Back to Journals » Journal of Hepatocellular Carcinoma » Volume 13
Post-Treatment Prognostic Nutritional Index Outperforms Baseline Index as an Independent Prognostic Biomarker in Advanced Hepatocellular Carcinoma Receiving Immune-Based Systemic Therapy
Authors Chen X, Guo X, Wang M ![]() , Chen G
, Chen G ![]() , Zheng S, Chen H
, Zheng S, Chen H ![]() , Zhang Z
, Zhang Z ![]() , Zhang B
, Zhang B
Received 3 March 2026
Accepted for publication 1 June 2026
Published 8 June 2026 Volume 2026:13 606554
DOI https://doi.org/10.2147/JHC.S606554
Checked for plagiarism Yes
Review by Single anonymous peer review
Peer reviewer comments 2
Editor who approved publication: Professor Toshihiro Tanaka
Xiaochun Chen,1– 3,* Xinkun Guo,1– 3,* Meixia Wang,1,4,* Guobin Chen,1– 3 Susu Zheng,1– 3 Hong Chen,1– 3 Zhenzhen Zhang,1– 3 Boheng Zhang1– 3
1Department of Hepatobiliary Oncology, Zhongshan Hospital (Xiamen), Fudan University, Xiamen, Fujian, People’s Republic of China; 2Xiamen Clinical Research Center for Cancer Therapy, Xiamen, Fujian, People’s Republic of China; 3Fujian Provincial Clinical Research Center for Precision Medicine of Abdominal Tumors, Xiamen, Fujian, People’s Republic of China; 4Department of Hospital Infection Management, Zhongshan Hospital (Xiamen), Fudan University, Xiamen, Fujian, People’s Republic of China
*These authors contributed equally to this work
Correspondence: Boheng Zhang, Department of Hepatobiliary Oncology, Zhongshan Hospital (Xiamen), Fudan University, Xiamen, Fujian, 361015, People’s Republic of China, Email [email protected]
Purpose: To investigate the prognostic value of post-treatment prognostic nutritional index (PNI) in advanced hepatocellular carcinoma (HCC) patients treated with immune‑based therapy, and explore its correlation with nutritional-inflammatory markers and treatment response.
Methods: This retrospective study enrolled 133 patients with unresectable or metastatic HCC who received first- or second-line immune-based regimens (February 2019–September 2022). Patients were stratified by median post-treatment PNI (46.3). Survival was analyzed using Kaplan-Meier and Cox regression methods; subgroup interaction, Spearman correlation, and ROC analyses were also performed.
Results: Significant baseline differences in Child-Pugh grade, vascular invasion, tumor size, baseline PNI, and median follow-up were observed between groups (all P < 0.05) and adjusted for in multivariate models. Elevated post-treatment PNI independently predicted longer overall survival (median 24.80 vs. 12.27 months, HR = 0.597, 95% CI 0.362– 0.983, P = 0.043) and progression-free survival (median 17.07 vs. 7.47 months, HR = 0.558, 95% CI 0.317– 0.981, P = 0.043). No significant subgroup interaction was observed for PFS (all interaction P > 0.05); for OS, effect modification was suggested for tumor number (interaction P = 0.036) and AFP level (interaction P = 0.035). Post-treatment PNI positively correlated with albumin (r = 0.862) and lymphocyte count (r = 0.632), and negatively with NLR (r = − 0.429) and CRP (r = − 0.354). It showed moderate discriminatory ability for objective response (AUC = 0.663). Dynamic change in PNI (ΔPNI) lacked prognostic significance. Median follow-up was 17.2 months.
Conclusion: Post‑treatment PNI is an independent prognostic biomarker in advanced HCC treated with immune‑based therapy, closely reflecting nutritional-inflammatory status and showing moderate discriminatory ability for treatment response. Dynamic PNI changes provided no incremental prognostic value in this cohort.
Keywords: hepatocellular carcinoma, immunotherapy, prognostic nutritional index, nutritional status, inflammation
Introduction
Hepatocellular carcinoma (HCC) is a leading cause of cancer-related mortality worldwide, with particularly poor outcomes observed in patients with unresectable, recurrent, or metastatic disease.1,2 In recent years, immune-based regimens—primarily combinations of PD-1/PD-L1 inhibitors and anti-angiogenic agents—have become the standard of care for first- and second-line treatment of advanced HCC, significantly improving survival in a subset of patients.3–6 However, there is substantial inter-individual variability in treatment response and prognosis, underscoring the need for simple, reliable, and clinically accessible prognostic biomarkers to enable risk stratification and guide personalized therapeutic strategies.
The prognostic nutritional index (PNI), calculated from serum albumin concentration and peripheral lymphocyte count, is a widely used composite marker that reflects both nutritional status and systemic inflammatory response—two factors closely associated with tumor progression and survival outcomes.7 Growing evidence has validated the prognostic predictive value of PNI in multiple solid tumors, especially HCC.8–11 Nevertheless, the majority of existing studies only focused on baseline PNI detected prior to treatment. Given that patients’ nutritional and inflammatory status may dynamically change following anti-tumor therapy,12 the prognostic role of post-treatment PNI remains largely unclear in advanced HCC patients receiving immune-based systemic therapy. Although several nutritional-immune biomarkers have been reported to predict outcomes in HCC patients receiving immunotherapy,13,14 the dynamic prognostic value of post-treatment PNI and its applicability with populations receiving pure immune-based regimens remain unclear, with no dedicated subgroup analyses conducted to validate its prognostic consistency.
Therefore, this retrospective study enrolled 133 patients with unresectable, recurrent, or metastatic HCC who received first- or second-line immune-based regimens at our institution between February 2019 and September 2022. The primary objective was to evaluate the independent prognostic value of post-treatment PNI for OS and PFS in this cohort. Stratified subgroup analyses were also conducted to assess the consistency of the prognostic impact of post-treatment PNI across various clinical subgroups. Additionally, we integrated recent mechanistic evidence to provide a biological context for the observed associations, while acknowledging that the precise pathways remain to be prospectively validated. This study aims to provide a clinical foundation for using post-treatment PNI in individualized risk stratification and prognostic assessment of advanced HCC patients receiving immune-based therapy.
Patients and Methods
Study Design and Population
This retrospective, single-center, observational study was conducted in the Department of Hepatobiliary Oncology, Zhongshan Hospital (Xiamen), Fudan University This study was approved by the Ethics Committee of Zhongshan Hospital, Fudan University (Xiamen) (Approval No. B2021-002R), and was conducted in accordance with the Declaration of Helsinki. Patient data were fully anonymized and maintained with strict confidentiality. The requirement for written informed consent was waived by the Institutional Review Board due to the retrospective nature of the study.
Patients diagnosed with advanced HCC at our institution between February 2019 and September 2022 were retrospectively enrolled, with final follow-up completed in November 2025. Eligible patients were those initiating immune-based systemic therapy in the form of immune checkpoint inhibitor (ICI) plus anti-angiogenic agent combination regimens for the first time (without prior exposure to anti-PD-1/PD-L1 or anti-CTLA-4 inhibitors) and meeting predefined inclusion and exclusion criteria.
To ensure cohort homogeneity, two independent investigators from the Department of Hepatic Oncology reviewed medical records, extracted clinical data, and verified data consistency. Discrepancies were resolved through consultation with a senior attending physician.
A total of 133 eligible patients were included in the statistical analysis, all of whom had complete medical records and follow-up data, ensuring the reliability of the study results.
Inclusion Criteria
- Histologically or clinically confirmed unresectable advanced HCC, or recurrent/metastatic HCC receiving palliative systemic therapy;
- First-time administration of an immune-based combination regimen (PD-1/PD-L1 inhibitor combined with anti-angiogenic agents) as first- or second-line systemic therapy (≤2 lines);
- Prior or concomitant transcatheter arterial chemoembolization (TACE) allowed, with no restriction on the number of procedures;
- Completion of at least two cycles of immunotherapy;
- Availability of complete baseline PNI, post-treatment PNI (measured at first efficacy assessment, 8–12 weeks after treatment initiation), and survival data including OS and PFS.
Exclusion Criteria
- Initiation of immunotherapy as third-line or later treatment (≥3 lines);
- Prior exposure to anti-PD-1/PD-L1 or anti-CTLA-4 inhibitors;
- Receipt of adjuvant or prophylactic immunotherapy in the absence of measurable tumor or metastatic disease (per RECIST v1.1);15
- Missing key variables including baseline PNI, post-treatment PNI,or survival data;
- Presence of severe systemic comorbidities (eg, severe cardiovascular, renal,or respiratory failure) that may independently influence survival outcomes;
- Loss to follow-up within 3 months after treatment initiation.
Data Collection
Baseline clinical and laboratory data were retrospectively collected from electronic medical records, including patient demographics (age, sex, ECOG performance status), liver disease etiology (hepatitis B virus infection status), hepatic function reserve (Child–Pugh grade), tumor characteristics (BCLC stage, vascular invasion, AFP level, maximum tumor diameter, and tumor number), treatment line, and specific immune checkpoint inhibitor (ICI) plus anti-angiogenic combination regimens.
PNI values at different time points were also recorded. Baseline PNI (PNI_base) was measured within one week prior to treatment initiation, and post-treatment PNI (PNI_post) was assessed at the first efficacy evaluation (8–12 weeks after treatment initiation), in accordance with clinical practice guidelines.16 PNI was calculated using the established formula: serum albumin (g/L) + 5 × absolute lymphocyte count (×109/L).7 Patients were dichotomized into high and low PNI_post groups using the median value of 46.3 as the cutoff. All laboratory parameters were analyzed by the central clinical laboratory of our institution using standardized assays.
The distribution of immune‑based regimens was as follows: 132 patients (99.2%) received a PD‑1 inhibitor combined with a tyrosine kinase inhibitor (TKI). The PD‑1 inhibitors used included nivolumab (n = 1), pembrolizumab (n = 5), camrelizumab (n = 48), toripalimab (n = 7), sintilimab (n = 39), and tislelizumab (n = 32). The TKIs administered were lenvatinib (n = 108), sorafenib (n = 11), apatinib (n = 11), and regorafenib (n = 2). One patient (0.8%) received atezolizumab plus bevacizumab.
Endpoint Definitions
Overall survival (OS) was defined as the interval from the initiation of immune-based therapy to death from any cause, or to the date of last follow-up for surviving patients. Progression-free survival (PFS) was defined as the time from treatment initiation to the first documented disease progression according to RECIST version 1.1,15 assessed by contrast-enhanced computed tomography (CT) or magnetic resonance imaging (MRI) every 8–12 weeks, or death from any cause, whichever occurred first; patients without progression or death were censored at the last follow-up.
Median follow-up duration was estimated using the simple median of follow-up times. The reverse Kaplan–Meier method was also considered but could not be applied due to insufficient follow-up data to meet the statistical requirements for median estimation.
Statistical Analysis
All statistical analyses were conducted using SPSS 22.0 (IBM Corp., Armonk, NY, USA) and R software (Version 4.3.0, R Foundation for Statistical Computing, Vienna, Austria). The Shapiro–Wilk test was used to assess normality of continuous variables. For baseline characteristics, continuous variables were presented as mean ± standard deviation (SD) for normally distributed data or median (interquartile range, IQR) for non-normally distributed data; comparisons between high and low PNI_post groups were performed using the independent samples t-test or Mann–Whitney U-test, as appropriate. Categorical variables were expressed as counts and percentages, and intergroup comparisons were conducted using the χ2-test or Fisher’s exact test when the expected frequency was less than 5.
Survival curves for OS and PFS were generated using the Kaplan–Meier method, and differences between groups were evaluated using the Log rank test. Univariate Cox proportional hazards regression models were used to identify potential prognostic factors associated with OS and PFS; variables with a P value < 0.1 in univariate analysis were entered into multivariate Cox models to determine independent prognostic factors. Hazard ratios (HRs) and corresponding 95% confidence intervals (CIs) were calculated.
Stratified subgroup analyses were performed to evaluate the consistency of the prognostic value of post-treatment PNI across predefined clinical subgroups, including treatment line (first-line vs. second-line), tumor number (solitary vs. multiple), AFP level (<400 ng/mL vs. ≥400 ng/mL), and BCLC stage (BCLC B vs. BCLC C). The sample sizes for each subgroup were as follows: first-line (n = 80), second-line (n = 53); solitary (n = 31), multiple (n = 102); AFP<400 (n = 72), AFP≥400 (n = 61); BCLC B (n = 18), BCLC C (n = 115). Forest plots were generated to illustrate HRs, 95% CIs, and P values for OS and PFS in each subgroup. Interaction P values were calculated by including a product term (PNI_post_group × subgroup variable) in the Cox model; a two-sided P value for interaction < 0.05 was considered to indicate significant heterogeneity. A two-tailed P value < 0.05 was considered statistically significant for all other analyses. No adjustment for multiple testing was applied because all subgroup analyses were exploratory in nature.
Spearman correlation was used to evaluate the relationship between post-treatment PNI and nutritional/inflammatory markers (albumin, lymphocyte count, NLR, CRP) as well as tumor indicators (AFP, tumor size, BCLC stage). The Mann–Whitney U-test and receiver operating characteristic (ROC) curve analysis were performed to compare post-treatment PNI between responders (CR/PR) and non-responders (SD/PD) and to assess its predictive performance. Dynamic change of PNI (ΔPNI = PNI_post – PNI_base) was analyzed both as a continuous variable (Cox regression) and as a categorical variable (decreased/stable/increased). All these additional analyses were exploratory; therefore, no adjustment for multiple testing was applied.
Results
Baseline Characteristics of the Study Population
A total of 133 patients with unresectable, recurrent, or metastatic HCC who received first- or second-line immune-based regimens were enrolled and stratified into high and low post-treatment PNI groups according to the median PNI_post value (46.3). Baseline characteristics are summarized in Table 1.
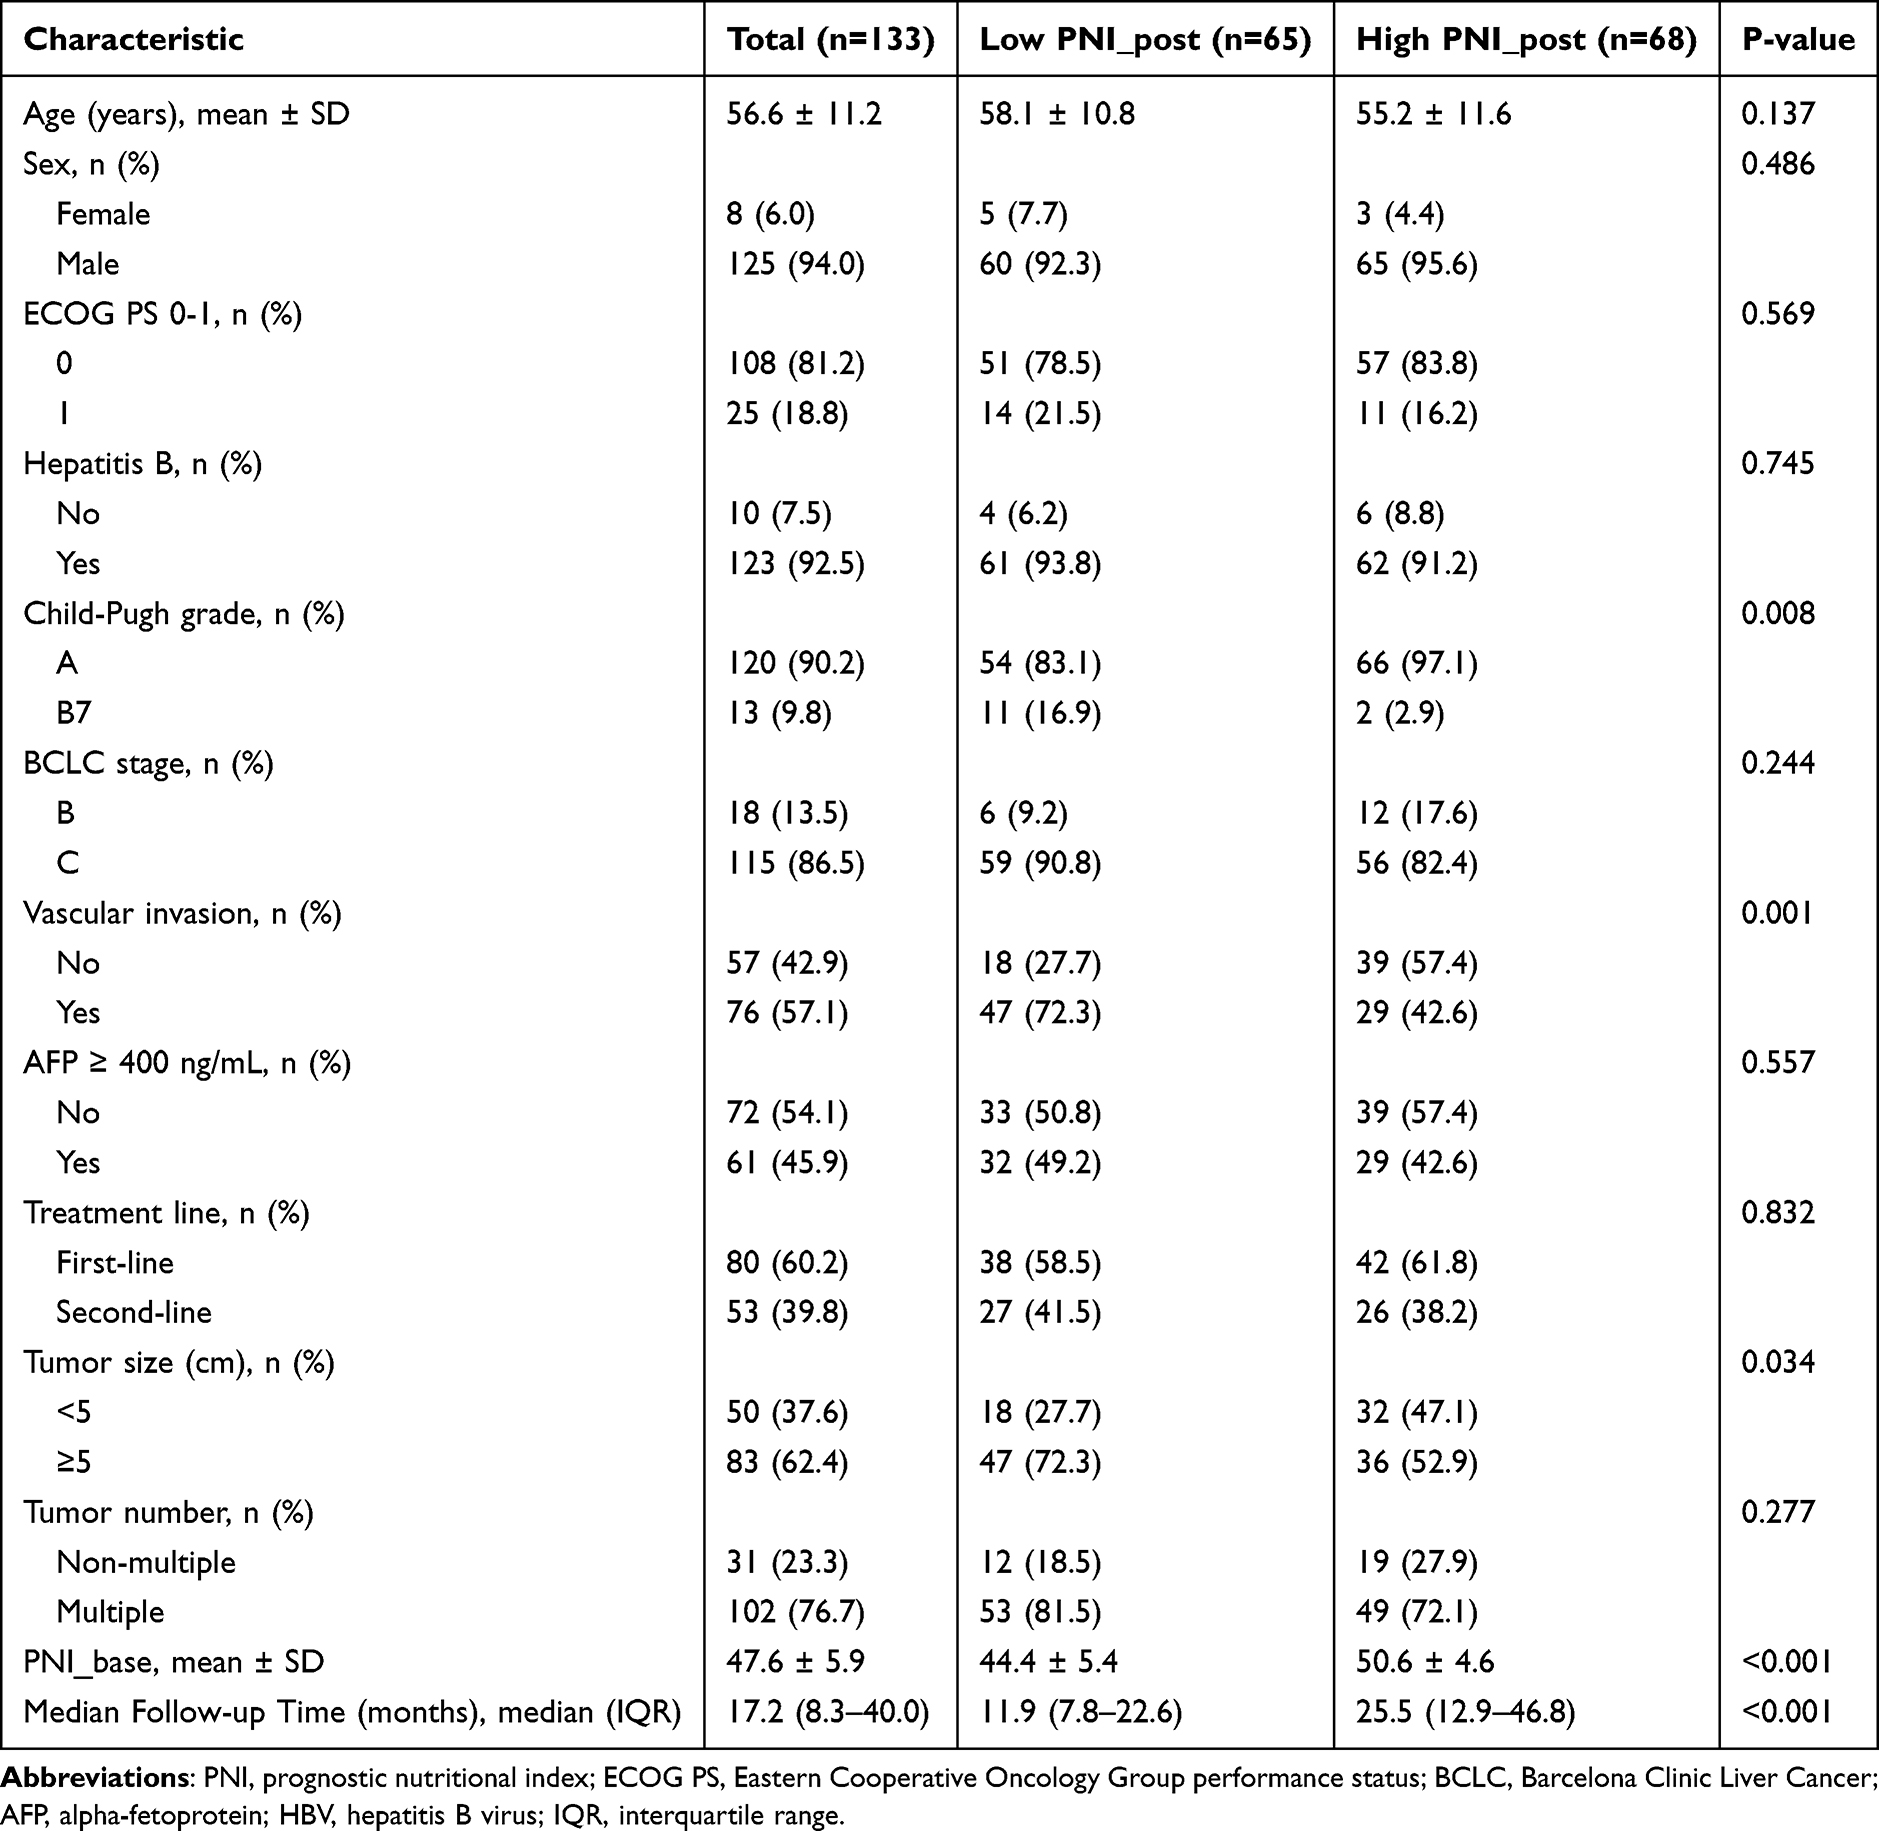 |
Table 1 Baseline Characteristics of Patients Stratified by Post-Treatment PNI (PNI_post) |
Significant differences between the two groups were observed in Child-Pugh grade, presence of vascular invasion, tumor size (≥5 cm), baseline PNI, and median follow-up duration (all P < 0.05). The low PNI_post group had a higher proportion of Child-Pugh grade B, a greater incidence of vascular invasion, a lower proportion of tumors with maximum diameter <5 cm, and significantly lower baseline PNI levels compared to the high PNI_post group. The median follow-up time was also significantly shorter in the low PNI_post group (11.9 vs. 25.5 months, P < 0.001).
Other baseline variables, including age, sex, ECOG PS, hepatitis B virus infection status, BCLC stage, treatment line, tumor number, and AFP level, were comparable between groups (all P > 0.05). All variables with statistical significance or clinical relevance were included as potential confounders in subsequent univariate and multivariate Cox regression analyses.
Survival Analysis and Independent Prognostic Factors
Kaplan‑Meier survival analysis demonstrated that patients in the high post‑treatment PNI group had significantly longer OS and PFS compared to those in the low post‑treatment PNI group (both log-rank P ≤0.004; Figures 1 and 2). The median OS was 24.80 months (95% CI: 17.86–31.74) in the high PNI_post group versus 12.27 months (95% CI: 9.38–15.15) in the low PNI_post group.The median PFS was 17.07 months (95% CI: 10.25–23.89) in the high PNI_post group and 7.47 months (95% CI: 4.18–10.75) in the low PNI_post group.
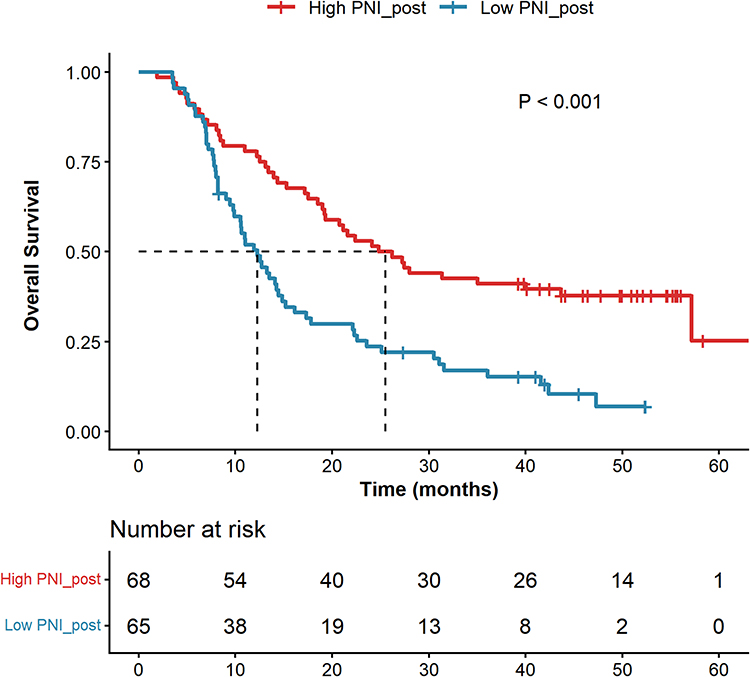 |
Figure 1 Kaplan–Meier curves for overall survival (OS) stratified by post-treatment PNI (median cutoff = 46.3) in advanced HCC patients receiving immune-based therapy. The high PNI group showed significantly longer OS (log-rank P < 0.001). |
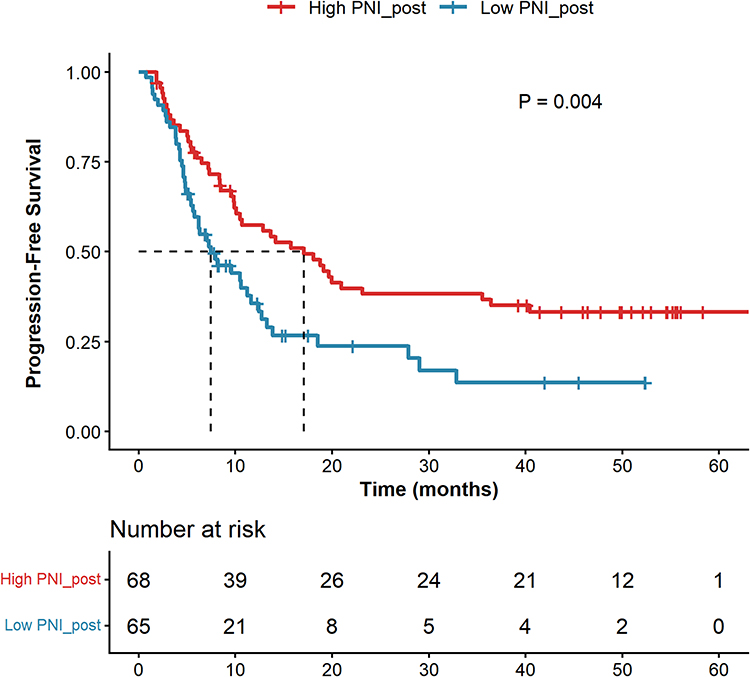 |
Figure 2 Kaplan–Meier curves for progression-free survival (PFS) stratified by post-treatment PNI (median cutoff = 46.3) in advanced HCC patients receiving immune-based therapy. The high PNI group showed significantly longer PFS (log-rank P = 0.004). |
Univariate Cox regression analysis showed that post‑treatment PNI group, baseline PNI, tumor number, treatment line, and Child‑Pugh grade were significantly associated with OS (all P < 0.05; Table 2). For PFS, significant prognostic factors identified by univariate analysis included post‑treatment PNI group, age, AFP ≥ 400 ng/mL, treatment line, and tumor number (all P < 0.05; Table 3). Multivariate Cox regression analysis, adjusted for potential confounders, confirmed that high post‑treatment PNI remained an independent favorable prognostic factor for both OS (HR = 0.597, 95% CI: 0.362–0.983, P = 0.043) and PFS (HR = 0.558, 95% CI: 0.317–0.981, P = 0.043; Tables 2 and 3). Additionally, treatment line and tumor number were independent prognostic factors for both OS and PFS, while age was an independent prognostic factor for PFS (all P < 0.05). Baseline PNI did not retain its independent prognostic significance in multivariate analysis, further highlighting the superior prognostic value of post-treatment PNI for survival outcomes.
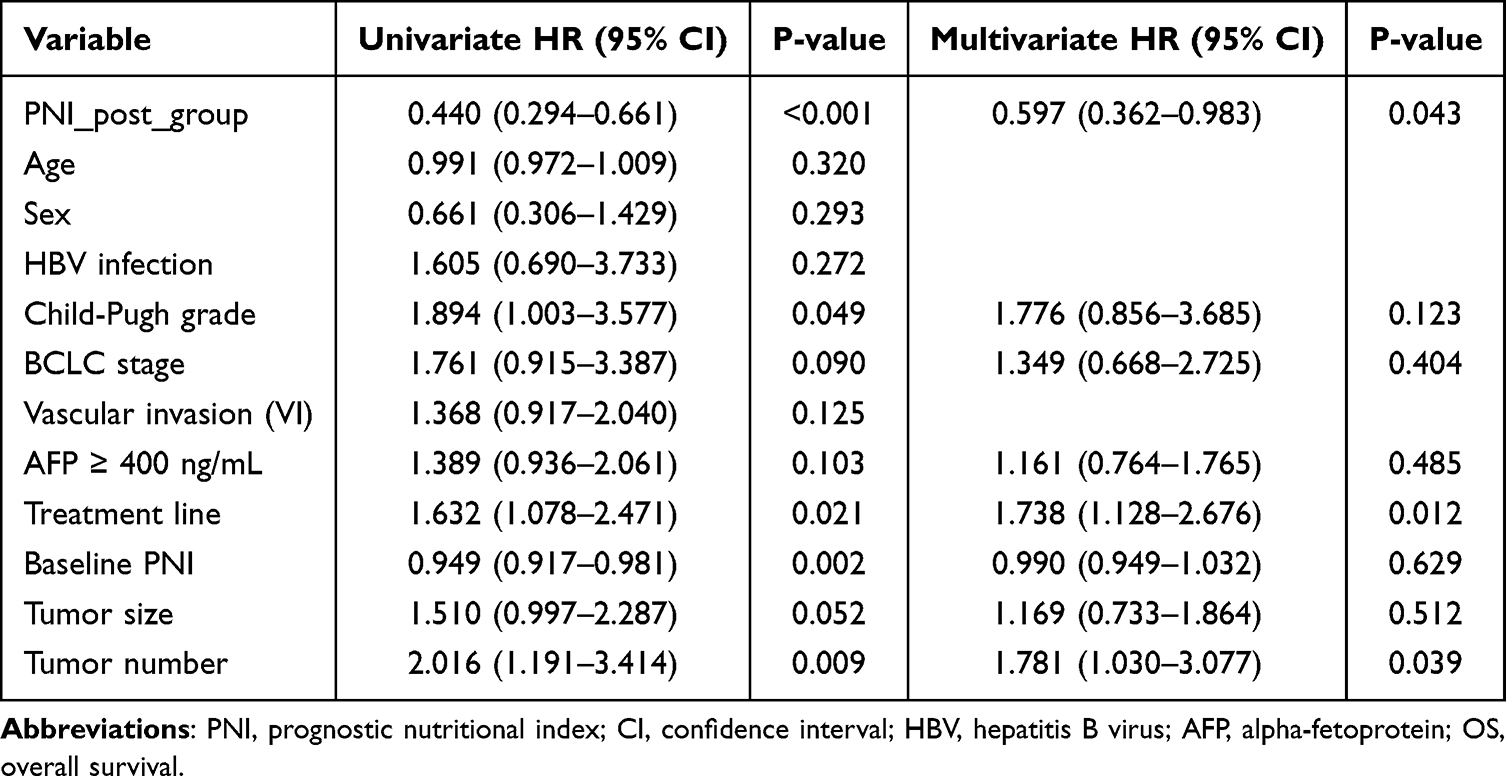 |
Table 2 Univariate and Multivariate Cox Regression Analyses of Overall Survival (OS) |
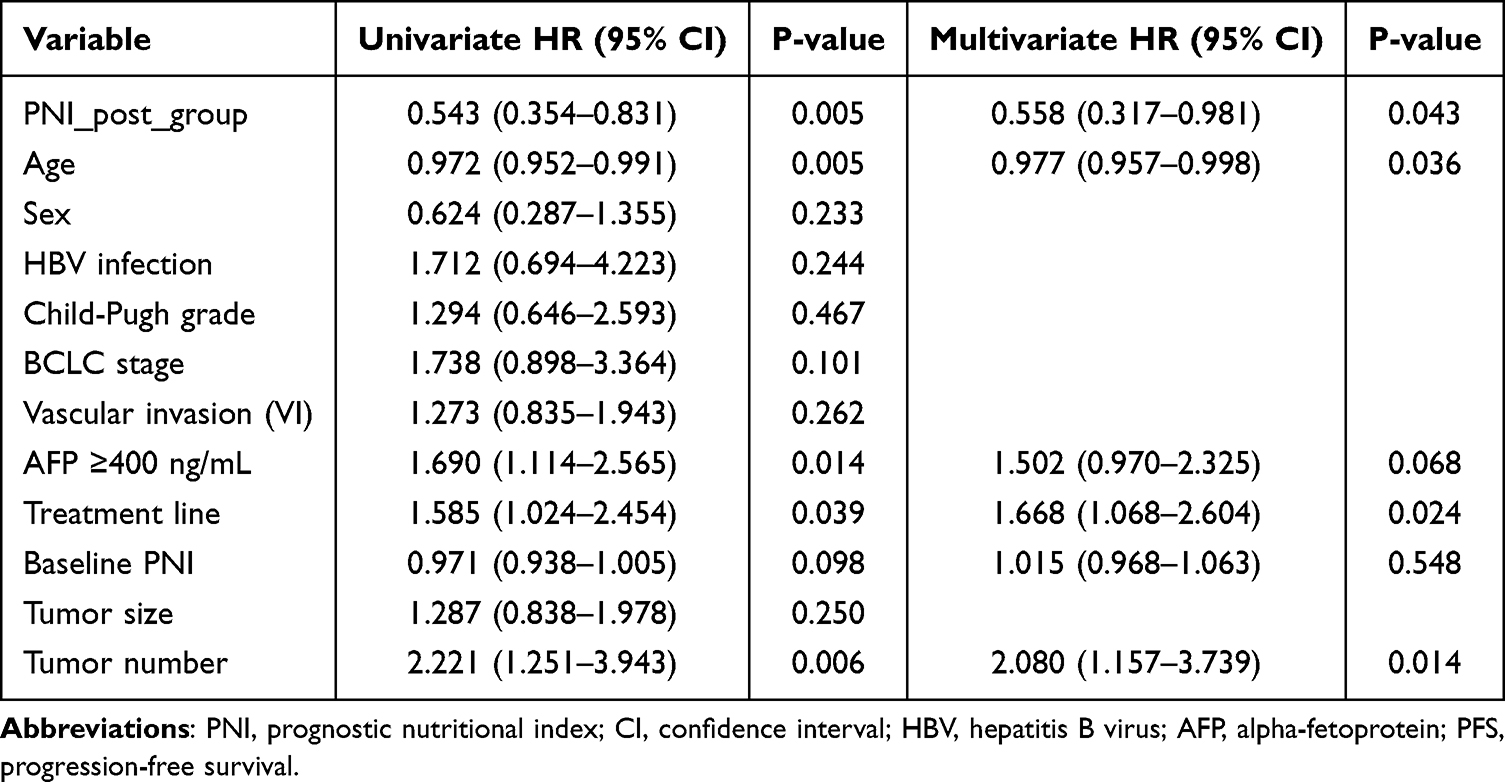 |
Table 3 Univariate and Multivariate Cox Regression Analyses of Progression-Free Survival (PFS) |
Subgroup Analyses of Post-Treatment PNI Prognostic Value
Subgroup analyses were conducted to evaluate the prognostic consistency of post‑treatment PNI across predefined clinical subgroups, with results presented as forest plots for overall survival (OS, Figure 3) and progression-free survival (PFS, Figure 4), respectively.
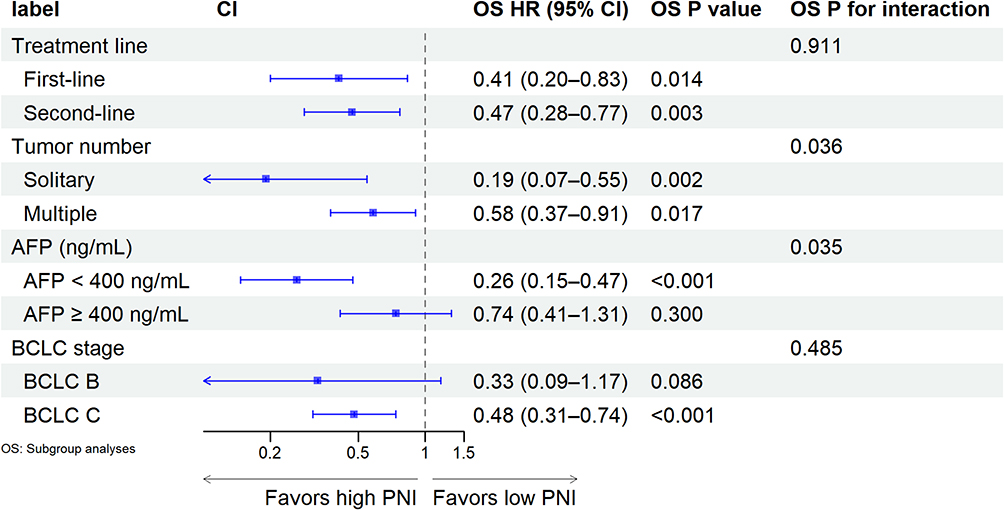 |
Figure 3 Forest plot of subgroup analyses for OS. The vertical dashed line represents HR = 1. HR < 1 indicates a favorable prognosis in the high PNI group. Interaction P values: treatment line P = 0.911, tumor number P = 0.036, AFP level P = 0.035, BCLC stage P = 0.485. Subgroup sample sizes: first-line (n = 80), second-line (n = 53); solitary (n = 31), multiple (n = 102); AFP < 400 (n = 72), AFP ≥ 400 (n = 61); BCLC B (n = 18), BCLC C (n = 115). |
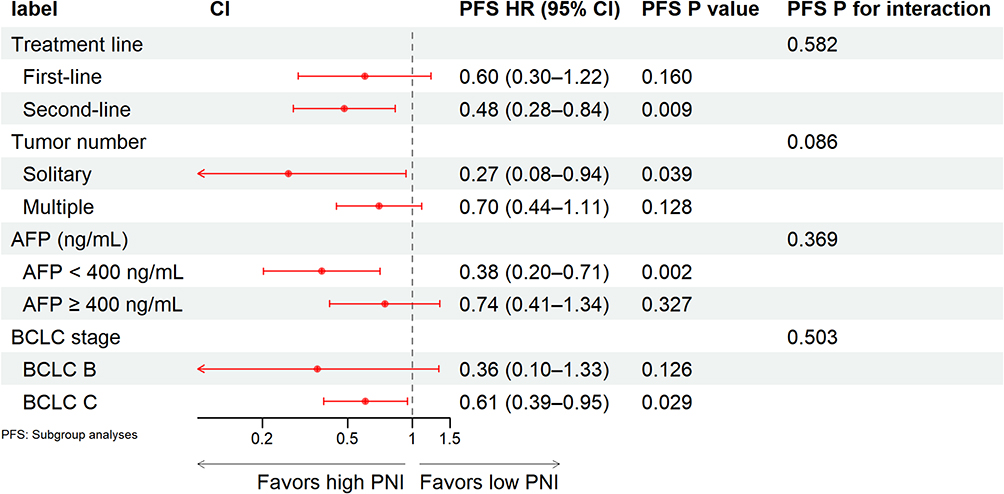 |
Figure 4 Forest plot of subgroup analyses for PFS. The vertical dashed line represents HR = 1. HR < 1 indicates a favorable prognosis in the high PNI group. All interaction P values were > 0.05. Subgroup sample sizes: first-line (n = 80), second-line (n = 53); solitary (n = 31), multiple (n = 102); AFP < 400 (n = 72), AFP ≥ 400 (n = 61); BCLC B (n = 18), BCLC C (n = 115). |
For OS, high post‑treatment PNI was associated with significantly longer survival in most subgroups, including first-line therapy (HR = 0.41, 95% CI: 0.20–0.83, P = 0.014), second-line therapy (HR = 0.47, 95% CI: 0.28–0.77, P = 0.003), solitary tumors (HR = 0.19, 95% CI: 0.07–0.55, P = 0.002), multiple tumors (HR = 0.58, 95% CI: 0.37–0.91, P = 0.017), AFP < 400 ng/mL (HR = 0.26, 95% CI: 0.15–0.47, P < 0.001), and BCLC stage C (HR = 0.48, 95% CI: 0.31–0.74, P < 0.001; Figure 3). No significant OS benefit was observed in patients with AFP ≥ 400 ng/mL (HR = 0.74, 95% CI: 0.41–1.31, P = 0.300) or BCLC stage B (HR = 0.33, 95% CI: 0.09–1.17, P = 0.086; Figure 3). Interaction tests suggested possible effect modification by tumor number (OS P for interaction = 0.036) and AFP level (OS P for interaction = 0.035), with larger HR point estimates observed in patients with solitary tumors or AFP < 400 ng/mL. No significant interaction was found for treatment line (OS P for interaction = 0.911) or BCLC stage (OS P for interaction = 0.780).
For PFS, high post-treatment PNI was associated with significantly longer survival in the second-line therapy (HR = 0.48, 95% CI: 0.28–0.84, P = 0.009), solitary tumors (HR = 0.27, 95% CI: 0.08–0.94, P = 0.039), AFP < 400 ng/mL (HR = 0.38, 95% CI: 0.20–0.71, P = 0.002), and BCLC stage C subgroups (HR = 0.61, 95% CI: 0.39–0.95, P = 0.029; Figure 4). The association did not reach statistical significance in the first-line therapy, multiple tumors, AFP ≥ 400 ng/mL, or BCLC stage B subgroups (all P for interaction > 0.05; Figure 4).
Taken together, these subgroup analyses indicate that the prognostic association of post-treatment PNI with PFS was consistent across all examined clinical subgroups. For OS, the association was consistent across treatment line and BCLC stage, whereas exploratory interaction tests suggested possible differences in the magnitude of association by tumor number and AFP level, findings that require cautious interpretation and independent validation.
Additional Analyses
To further explore the biological rationale and clinical utility of post-treatment PNI, we performed a set of supplementary analyses.
Correlation with Nutritional and Inflammatory Markers
Spearman correlation analysis showed that post-treatment PNI was strongly positively correlated with albumin (r = 0.862, P < 0.001) and lymphocyte count (r = 0.632, P < 0.001), and significantly negatively correlated with the neutrophil-to-lymphocyte ratio (NLR) (r = −0.429, P < 0.001) and C-reactive protein (CRP) (r = −0.354, P < 0.001). No significant correlation was observed with alpha-fetoprotein (AFP) (r = 0.027, P = 0.781) or tumor size (r = −0.184, P = 0.052) (Supplementary Figure S1).
Prediction of Objective Response
Among the 133 patients, 16 (12.0%) achieved an objective response (complete or partial response). The median post-treatment PNI was significantly higher in responders than in non-responders (50 vs. 46, P = 0.035, Mann–Whitney U-test; Supplementary Figure S2A). The area under the ROC curve (AUC) for predicting objective response was 0.663 (95% CI: 0.56–0.77). At the optimal cut-off value of 48.25, the sensitivity was 68.8% and specificity was 66.7% (Supplementary Figure S2B).
Dynamic Change of PNI
Changes in PNI from baseline to post-treatment (ΔPNI = PNI_post − PNI_base) were analyzed in 132 patients with paired data. When analyzed as a continuous variable, ΔPNI was not significantly associated with overall survival (HR per 1-unit increase = 0.984, 95% CI: 0.950–1.018, P = 0.352) or progression-free survival (HR = 0.995, 95% CI: 0.957–1.035, P = 0.802). Patients were further categorized into ΔPNI decreased (n = 77, 58.3%), stable (n = 6, 4.5%), and increased (n = 49, 37.1%) groups; no significant survival differences were detected among the three groups (Supplementary Table S1, Supplementary Figure S3A and S3B). Restricted cubic spline regression showed no evident nonlinear association between ΔPNI and survival outcomes (OS P = 0.316, PFS P = 0.053 for spline nonlinearity; Supplementary Figure S4A and S4B).
Discussion
In this retrospective study of 133 patients with unresectable, recurrent, or metastatic hepatocellular carcinoma (HCC) receiving first- or second-line immune-based systemic therapy, we demonstrated that post-treatment prognostic nutritional index (PNI) is an independent prognostic biomarker for both overall survival (OS) and progression-free survival (PFS), after adjusting for tumor multiplicity, treatment line, and AFP level. Subgroup analyses showed that the prognostic benefit of high post-treatment PNI was consistent across treatment line and BCLC stage subgroups (all interaction P > 0.05), whereas exploratory interaction tests suggested possible effect modification by tumor number (OS interaction P = 0.036) and AFP level (OS interaction P = 0.035). These findings underscore the clinical relevance of dynamic nutritional-immune assessment in this population.
The prognostic value of PNI in HCC has been extensively documented;11,17 however, most prior studies have focused on baseline measurements. Our study demonstrates that post-treatment PNI captures therapy-induced changes in nutritional and inflammatory status, providing prognostic information beyond baseline PNI alone. This is consistent with Suzuki et al,18 who showed that post-treatment PNI after atezolizumab plus bevacizumab predicts prognosis in advanced HCC Similarly, Osmański et al19 reported a significant association between post-treatment PNI and survival in advanced HCC patients treated with sorafenib. Unlike prior studies limited to single regimens, our cohort received a broader range of PD-1/PD-L1 inhibitor-based combinations, and we conducted comprehensive subgroup analyses across four clinical dimensions, enhancing generalizability and extending previous findings.
The subgroup findings merit careful interpretation. For PFS, the absence of any significant interaction across all variables indicates a consistent prognostic association. For OS, treatment line and BCLC stage similarly showed no significant interaction; numerical HR differences within these strata should be regarded as chance variation. Significant interactions were observed for tumor number (P = 0.036) and AFP level (P = 0.035). These findings generate the hypothesis that the prognostic value of post-treatment PNI may differ according to tumor burden: patients with solitary tumors or low AFP levels typically exhibit less aggressive disease and lower systemic inflammatory burden, conditions under which a favorable post-treatment nutritional-immune status may show a stronger association with survival. Conversely, in patients with multiple tumors or elevated AFP, high tumor burden and an entrenched immunosuppressive microenvironment may override the benefits of nutritional recovery. This interpretation is biologically plausible but remains speculative, requiring independent validation.
To further define its clinical utility, we performed additional exploratory analyses. Spearman correlation analysis confirmed that post-treatment PNI was strongly positively correlated with its constituent components and negatively correlated with inflammatory markers, while showing no correlation with AFP. This suggests that PNI and AFP reflect distinct biological axes—host nutritional-inflammatory status versus tumor burden—and that PNI offers a more holistic assessment than purely inflammatory markers alone. Post-treatment PNI also demonstrated modest discriminatory ability for objective response (AUC = 0.663), positioning it as a simple, low-cost adjunct for early treatment monitoring, particularly when imaging findings are ambiguous. In contrast, dynamic PNI change (ΔPNI) was not significantly associated with OS or PFS in either continuous or categorical analyses. This negative finding suggests that the absolute nutritional-inflammatory state achieved after induction therapy, rather than the magnitude of change from baseline, is the critical determinant of long-term outcomes, supporting the use of a single 8–12 week PNI measurement for risk stratification. All these exploratory findings require prospective validation.
Mechanistically, the prognostic significance of post-treatment PNI can be interpreted through the interplay between nutritional status, systemic inflammation, and anti-tumor immunity. Serum albumin functions as a critical modulator of both inflammatory and immune responses. Hypoalbuminemia actively perpetuates systemic inflammation and immunosuppression: recent evidence demonstrates that low albumin levels drive an immunosuppressive tumor microenvironment by impairing macrophage arginine metabolism, reducing intratumoral CD8+ T cell infiltration, and promoting resistance to immune checkpoint inhibitors.20 Consistently, transcriptomic analyses have linked low albumin status to signatures of neutrophil activation and T-cell down-regulation, accompanied by depletion of immunoregulatory metabolites such as arginine.21 Leek et al further demonstrated, through multi-omic analysis, that pretreatment hypoalbuminemia was a powerful independent predictor of poor outcome upon PD-1 blockade.22 The second component of PNI—absolute lymphocyte count—directly reflects the host’s immune reserve. Lymphopenia is a well-established surrogate marker of initial resistance to immunotherapy, as a sufficient effector lymphocyte pool is a prerequisite for checkpoint inhibitor activity.23 This is consistent with our correlation findings, and the lack of correlation between PNI and AFP further suggests that the nutritional-immune axis captured by PNI operates independently of tumor burden, representing a distinct and potentially modifiable dimension of host biology.
As a composite index, PNI simultaneously captures the nutritional input (albumin) and immune output (lymphocyte count) of this axis, with systemic inflammation as the connecting link. A higher post-treatment PNI may therefore signify a favorable shift away from chronic inflammation and immunosuppression toward restored immune competence—a state permissive for checkpoint inhibitor activity. This integrative capacity explains why post-treatment PNI offers prognostic information beyond baseline measurement: baseline PNI reflects a static pre-treatment state, whereas post-treatment PNI captures the net effect of therapy on the host nutritional-inflammatory-immune equilibrium. This interpretation is consistent with our finding that ΔPNI lacked prognostic significance—what matters for survival appears to be the absolute immune-nutritional state achieved after induction therapy, not the magnitude of change.Nevertheless, the precise molecular pathways linking dynamic changes in serum albumin and lymphocyte counts to specific tumor microenvironment alterations remain to be directly demonstrated, warranting future studies incorporating paired peripheral blood and tumor tissue analyses.
Several limitations warrant acknowledgment. The single-center retrospective design and relatively small sample size—particularly in certain subgroups—limit statistical power and generalizability. The significant interaction effects for tumor number and AFP level should be viewed as exploratory, as no correction for multiple testing was applied. Although findings align with Suzuki et al,18 external validation is needed The median follow-up of 17.2 months may not fully capture long-term immunotherapy outcomes, and median-derived PNI cutoff may hinder cross-study comparability. The small stable-PNI subgroup precludes robust conclusions about dynamic changes. Although the vast majority of patients received PD-1 inhibitor plus TKI, minor regimen heterogeneity and unmeasured confounders may have influenced outcomes. Future multicenter prospective studies with larger cohorts, extended follow-up, and standardized PNI cutoffs are warranted.
Conclusion
In conclusion, this study demonstrates that post-treatment PNI is a simple, reliable, and independent prognostic biomarker for advanced HCC patients receiving immune-based systemic therapy. By capturing therapy-induced changes in nutritional and inflammatory status, post-treatment PNI provides prognostic information beyond baseline PNI. Subgroup analyses indicated that the prognostic association was consistent for PFS across all examined clinical subgroups; for OS, exploratory interaction tests suggested possible effect modification by tumor number and AFP level, a finding that requires independent validation before guiding clinical decisions. Additional analyses showed that post-treatment PNI correlates with key nutritional and inflammatory markers and demonstrates moderate discriminatory ability for objective response, whereas dynamic changes in PNI (ΔPNI) did not provide incremental prognostic value. Given its clinical accessibility, post-treatment PNI can be readily integrated into routine practice for risk stratification and treatment monitoring, offering a practical tool to support personalized management in this high-risk population.
Author Contributions
All authors made a significant contribution to the work reported, whether that is in the conception, study design, execution, acquisition of data, analysis and interpretation, or in all these areas; took part in drafting, revising or critically reviewing the article; gave final approval of the version to be published; have agreed on the journal to which the article has been submitted; and agree to be accountable for all aspects of the work.
Funding
This study was supported by grants from the Natural Science Foundation of Xiamen, China (3502Z202372070 to Xinkun Guo).
Disclosure
Dr Xiaochun Chen and Dr Xinkun Guo received grants from the Natural Science Foundation of Xiamen, China to support this study. No other authors had funding directly associated with the present work. The authors declare no conflicts of interest.
References
1. Siegel RL, Kratzer TB, Giaquinto AN, Sung H, Jemal A. Cancer statistics, 2025. CA Cancer J Clin. 2025;75(1):10–12. doi:10.3322/caac.21871
2. Singal AG, Kanwal F, Llovet JM. Global trends in hepatocellular carcinoma epidemiology: implications for screening, prevention and therapy. Nat Rev Clin Oncol. 2023;20(12):864–884. doi:10.1038/s41571-023-00825-3
3. Finn RS, Qin S, Ikeda M, et al. Atezolizumab plus bevacizumab in unresectable hepatocellular carcinoma. N Engl J Med. 2020;382(20):1894–1905. doi:10.1056/NEJMoa1915745
4. Ren Z, Xu J, Bai Y, et al. Sintilimab plus a bevacizumab biosimilar (IBI305) versus sorafenib in unresectable hepatocellular carcinoma (ORIENT-32): a randomised, open-label, Phase 2-3 study. Lancet Oncol. 2021;22(7):977–990. doi:10.1016/S1470-2045(21)00252-7
5. Qin S, Chan SL, Gu S, et al. Camrelizumab plus rivoceranib versus sorafenib as first-line therapy for unresectable hepatocellular carcinoma (CARES-310): a randomised, open-label, international Phase 3 study. Lancet. 2023;402(10408):1133–1146. doi:10.1016/S0140-6736(23)00961-3
6. Llovet JM, Castet F, Heikenwalder M, et al. Immunotherapies for hepatocellular carcinoma. Nat Rev Clin Oncol. 2022;19(3):151–172. doi:10.1038/s41571-021-00573-2
7. Onodera T, Goseki N, Kosaki G. Prognostic nutritional index in gastrointestinal surgery of malnourished cancer patients. Nihon Geka Gakkai Zasshi. 1984;85(9):1001–1005.
8. Tsukagoshi M, Araki K, Igarashi T, et al. Lower geriatric nutritional risk index and prognostic nutritional index predict postoperative prognosis in patients with hepatocellular carcinoma. Nutrients. 2024;16(7):940. doi:10.3390/nu16070940
9. Johannet P, Sawyers A, Qian Y, et al. Baseline prognostic nutritional index and changes in pretreatment body mass index associate with immunotherapy response in patients with advanced cancer. J Immunother Cancer. 2020;8(2):e001674. doi:10.1136/jitc-2020-001674
10. Zhang L, Ma W, Qiu Z, et al. Prognostic nutritional index as a prognostic biomarker for gastrointestinal cancer patients treated with immune checkpoint inhibitors. Front Immunol. 2023;14:1219929. doi:10.3389/fimmu.2023.1219929
11. Fu J, Peng W, Jiang J, Deng T, Duan H, Liu K. Prognostic nutritional index and the survival of patients with hepatocellular carcinoma on immune checkpoint inhibitors: a meta-analysis. BMC Cancer. 2025;26(1):62. doi:10.1186/s12885-025-15310-6
12. Jiang Y, Tu X, Zhang X, et al. Nutrition and metabolism status alteration in advanced hepatocellular carcinoma patients treated with anti-PD-1 immunotherapy. Support Care Cancer. 2020;28(11):5569–5579. doi:10.1007/s00520-020-05478-x
13. Liu K, Lv Y, Fu S, et al. Establishment and validation of a novel nutritional-immune-inflammatory score model for predicting survival prognosis in hepatocellular carcinoma patients treated with PD-1 inhibitors. J Inflamm Res. 2025;18:13397–13412. doi:10.2147/JIR.S546164
14. Yu M, Wu Y, Xie Q, et al. Nomogram based on tumor burden score and inflammation-nutritional indicators to predict the prognosis of hepatocellular carcinoma patients undergoing TACE combined with targeted and immunotherapy. J Hepatocell Carcinoma. 2026;13:598348. doi:10.2147/JHC.S598348
15. Eisenhauer EA, Therasse P, Bogaerts J, et al. New response evaluation criteria in solid tumours: revised RECIST guideline (version 1.1). Eur J Cancer. 2009;45(2):228–247. doi:10.1016/j.ejca.2008.10.026
16. European Association for the Study of the Liver. EASL clinical practice guidelines on the management of hepatocellular carcinoma. J Hepatol. 2025;82(2):315–374. doi:10.1016/j.jhep.2024.08.028
17. Kuo YH, Teng W, Chen YH, et al. Prognostic nutritional index predicts outcomes in hepatocellular carcinoma treated with atezolizumab and bevacizumab: a propensity score-matched analysis. J Clin Transl Hepatol. 2026;14(2):168–176. doi:10.14218/JCTH.2025.00418
18. Suzuki T, Matsuura K, Suzuki Y, et al. Prognostic nutritional index after introduction of atezolizumab with bevacizumab predicts prognosis in advanced hepatocellular carcinoma: a multicenter study. Oncology. 2024;102(8):676–687. doi:10.1159/000536367
19. Osmański R, Mardas M, Radomyski P, Litwiniuk M, Stelmach-Mardas M. Changes in nutritional status in hepatocellular carcinoma patients treated with sorafenib. Support Care Cancer. 2025;33(10):901. doi:10.1007/s00520-025-09975-9
20. Yang F, Long Y, Li Y, et al. Hypoalbuminemia induces immunosuppression through disorder in macrophages and drives resistance to immune checkpoint inhibitors. Cancer Immunol Immunother. 2026;75(5):137. doi:10.1007/s00262-026-04364-5
21. Tsutsumi C, Ohuchida K, Imamura M, et al. Prognostic nutrition index reveals LAG3 in cytotoxic CD8+ T cells and MHC class II in gastric cancer cells. Cancer Immunol Immunother. 2025;74(6):176. doi:10.1007/s00262-025-04037-9
22. Leek LVM, Notohardjo JCL, de Joode K, et al. Multi-omic analysis identifies hypoalbuminemia as independent biomarker of poor outcome upon PD-1 blockade in metastatic melanoma. Sci Rep. 2024;14(1):11244. doi:10.1038/s41598-024-61150-y
23. Ménétrier-Caux C, Ray-Coquard I, Blay JY, Caux C. Lymphopenia in cancer patients and its effects on response to immunotherapy: an opportunity for combination with cytokines? J Immunother Cancer. 2019;7(1):85. doi:10.1186/s40425-019-0549-5
 © 2026 The Author(s). This work is published and licensed by Dove Medical Press Limited. The
full terms of this license are available at https://www.dovepress.com/terms
and incorporate the Creative Commons Attribution
- Non Commercial (unported, 4.0) License.
By accessing the work you hereby accept the Terms. Non-commercial uses of the work are permitted
without any further permission from Dove Medical Press Limited, provided the work is properly
attributed. For permission for commercial use of this work, please see paragraphs 4.2 and 5 of our Terms.
© 2026 The Author(s). This work is published and licensed by Dove Medical Press Limited. The
full terms of this license are available at https://www.dovepress.com/terms
and incorporate the Creative Commons Attribution
- Non Commercial (unported, 4.0) License.
By accessing the work you hereby accept the Terms. Non-commercial uses of the work are permitted
without any further permission from Dove Medical Press Limited, provided the work is properly
attributed. For permission for commercial use of this work, please see paragraphs 4.2 and 5 of our Terms.
Recommended articles
Decaprenyl Diphosphate Synthase Subunit 1 (PDSS1): A Potential Prognostic Biomarker and Immunotherapy-Target for Hepatocellular Carcinoma
Yang Y, Li J, Tang M, Nie B, Huang W
Cancer Management and Research 2022, 14:1627-1639
Published Date: 3 May 2022
Efficacy and Safety of Regorafenib with or without PD-1 Inhibitors as Second-Line Therapy for Advanced Hepatocellular Carcinoma in Real-World Clinical Practice
Liu K, Wu J, Xu Y, Li D, Huang S, Mao Y
OncoTargets and Therapy 2022, 15:1079-1094
Published Date: 1 October 2022
Promising Novel Biomarkers for Hepatocellular Carcinoma: Diagnostic and Prognostic Insights
Yu J, Park R, Kim R
Journal of Hepatocellular Carcinoma 2023, 10:1105-1127
Published Date: 18 July 2023
Circulating Fibroblast Growth Factor 21 (FGF21) as a Prognostic and Diagnostic Biomarker in Hepatocellular Carcinoma
Eid JR, Yalciner M, Xiao L, Sun R, Kannan MK, Hassan M, Rashid A, Chamseddine S, Tran Cao HS, Amin HM, Kaseb AO
Journal of Hepatocellular Carcinoma 2025, 12:2709-2722
Published Date: 10 December 2025
Exploring the Potential of CSTF1 as a Prognostic Biomarker in Hepatocellular Carcinoma and Its Correlation with Immune Infiltration
Aimaiti M, Maimaitituxun D, Yilihaer X, Kuerban T, Zhu J, Ainiwaer M, Jia Z, Abudourousuli A
Journal of Hepatocellular Carcinoma 2025, 12:2693-2707
Published Date: 11 December 2025