Back to Journals » Cancer Management and Research » Volume 14
Decaprenyl Diphosphate Synthase Subunit 1 (PDSS1): A Potential Prognostic Biomarker and Immunotherapy-Target for Hepatocellular Carcinoma
Authors Yang Y, Li J, Tang M, Nie B, Huang W ![]()
Received 28 February 2022
Accepted for publication 27 April 2022
Published 3 May 2022 Volume 2022:14 Pages 1627—1639
DOI https://doi.org/10.2147/CMAR.S364346
Checked for plagiarism Yes
Review by Single anonymous peer review
Peer reviewer comments 2
Editor who approved publication: Professor Kattesh Katti
Yuping Yang,* Jinying Li,* Ming Tang, Biao Nie, Wei Huang
Department of Gastroenterology, The First Affiliated Hospital of Jinan University, Jinan University, Guangzhou, Guangdong Province, 510630, People’s Republic of China
*These authors contributed equally to this work
Correspondence: Wei Huang, Departments of Gastroenterology, The First Affiliated Hospital of Jinan University, Jinan University, Guangzhou, 510630, Guangdong Province, People’s Republic of China, Tel +86 020-38688931, Email [email protected]
Purpose: PDSS1 (decaprenyl diphosphate synthase subunit 1) plays an important role in the progression of several types of tumor. However, the biological functions of PDSS1 remain unclear in patients with hepatocellular carcinoma (HCC). In this study, We attempted to determine the role of PDSS1 in predicting the survival and efficacy of immunotherapy for HCC patients.
Methods: We analyzed the expression of PDSS1 in pan-cancer by Tumor Immune Estimation Resource (TIMER) and UALCAN database. Next, we investigated the correlations between the expression and potential prognostic value of PDSS1 in pan-cancer by Gene Expression Profiling Interactive Analysis (GEPIA) and Kaplan-Meier plotter and further confirmed our finding in our study of 139 patients with HCC. Furthermore, we correlated expression patterns with the presence of immune cell infiltrates and immune regulatory molecules in HCC tissue by TIMER. Finally, its potential immune-related mechanism was explored by Gene Set Enrichment Analysis (GSEA).
Results: Multiple datasets demonstrate that PDSS1 is up-regulated in HCC tissues compared with adjacent tissues, which was validated at mRNA (databases) and protein levels (our cohort). Patients with higher PDSS1 expression had shorter overall survival and relapse-free survival. In addition, PDSS1 expression was positively related to early recurrence and served as an independent poor prognostic factor for HCC. Patients with higher PDSS1 expression had lower CD8+ T cells in HCC tissue, and PDSS1 deteriorates T cell exhaustion by promoting T cell surface inhibitory receptors’ secretion and immunosuppressive cell proliferation. Furthermore, PDSS1 was positively correlated with the WNT, TGFβ, VEGF, and other signaling pathways in HCC.
Conclusion: PDSS1 is a potential prognostic biomarker and immunotherapy target for hepatocellular carcinoma.
Keywords: decaprenyl diphosphate synthase subunit 1, hepatocellular carcinoma, prognosis, tumor microenvironment
Introduction
Hepatocellular carcinoma (HCC) is one of the most prevalent malignancies and ranks third in cancer-related mortality globally.1 HCC accounts for 90% of cases of liver cancer.2 Although significant progress in clinical diagnosis and comprehensive treatment has partially increased patients’ longevity, the prognosis of patients with HCC is still inferior because patients with advanced liver cancer account for about 50%.2 A recent study has shown that programmed cell death protein‐1‐targeted immunotherapy with nivolumab or pembrolizumab is associated with good survival in patients with advanced hepatocellular carcinoma.3 In addition, TGFβ signal-targeted immunotherapy showed promising efficacy in inhibiting cancer progression.4 So HCC may be a promising candidate for immunotherapy. But the effective target for hepatocellular carcinoma is still unclear. Searching for a reliable immunotherapeutic target for HCC is warranted.
Decaprenyl diphosphate synthase subunit 1 (PDSS1) was considered a gene related to the synthesis of coenzyme Q.5 Several studies showed that PDSS1 speed up the progression of some tumors, such as cutaneous melanoma, bladder cancer, breast cancer, and HCC.6–11 Bioinformatics studies suggest that PDSS1 may be associated with hypoxia in the tumor microenvironment of HCC.9–11 However, it is not yet clear whether PDSS1 acts as a prognostic marker in HCC and if its expression is related to the tumor immune infiltration.
Using bioinformatics tools and laboratory studies, we attempted to clarify the potential function of PDSS1 in HCC by evaluating the correlation between PDSS1 expression and prognosis, as well as the tumor microenvironment in HCC patients. Multiple datasets suggested that up-regulation of PDSS1 predicts poor prognosis and maybe a potential immunotherapeutic target for patients with HCC.
Materials and Methods
Tumor Immune Estimation Resource (TIMER) Database Analysis
TIMER is a comprehensive resource for systematical analysis of immune infiltrates across different types of cancer (http://timer.cistrome.org/) and allows users comprehensively to explore tumor immunological, clinical, and genomic features.12 The present study investigated the levels of PDSS1 mRNA expression in different cancer tissues and adjacent tissues in TIMER. Furthermore, we explored the correlation between PDSS1 expression and immune cells infiltration and tumor immune microenvironment by TIMER.
UALCAN Databases Analysis
UALCAN is a comprehensive and interactive web portal to analyze publicly available cancer databases in-depth, including The Cancer Genome Atlas (TCGA) gene expression dataset (http://ualcan.path.uab.edu/index.html). Specifically, it allows users to investigate the relative expression of a query gene across tumor and normal tissue samples, as well as correlate gene expression with clinicopathologic features or the prognosis of patients.13 In the present study, we performed the levels of PDSS1 mRNA expression in pan-cancer and corresponding normal tissues.
Gene Expression Profiling Interactive Analysis (GEPIA), Kaplan–Meier (KM) Plotter Analysis
GEPIA is a web server (http://gepia.cancer-pku.cn/) using a standard processing pipeline for analyzing the RNA sequencing expression from the TCGA and Genotype-Tissue Expression projects.14 The KM plotter (http://kmplot.com/analysis/) can assess the effect of 54k genes (mRNA, miRNA, protein) on survival in 21 types of cancer.15,16 In the present study, the survival analysis based on PDSS1 mRNA expression in 33 different types of cancer and 21 different types of cancer was explored by GEPIA and the KM plotter, respectively. In addition, the KM-plotter was used to investigate the survival analysis of patients with HCC based on immune cells infiltration, such as B cells, macrophages, CD4+ T cells, and CD8+ T cells. (http://kmplot.com/analysis/index.php? p=service and cancer=pancancer_rnaseq).
Gene Set Enrichment Analysis (GSEA) Analysis
Gene Set Enrichment Analysis (GSEA) is a computational method that determines whether an a priori defined set of genes shows statistically significant, concordant differences between two biological states.17 In the present study, we explored the correlation between PDSS1 mRNA expression (the RNA seq from TCGA: https://portal.gdc.cancer.gov/) and immune inflammation signaling pathways by GSEA 4.1.0.
Immunochemistry Analysis of Liver Sections
Tissue samples were fixed in 10% formalin, embedded in paraffin, cut into 4 µm-thick sections, and stained with immunohistochemistry according to standard procedures. Tumor sections of hepatocellular carcinoma were stained with the appropriate PDSS1 antibody (Thermo Fisher, #: PA558217), and both the intensity and percentage (signal: 0 for negative; 1 for weak staining; 2 for intermediate staining; and 3 for strong staining; percentage: 0 for 0%; 1 for 1–25%; 2 for 26–50%; 3 for 51–75%; and 4 for >75%) of immunostaining were taken into consideration when analyzing the data. The ultimate quantitation of each sample was obtained by multiplying these two values (intensity score and percentage score). The case was defined as a low expression if the score was 4 or less, and other cases were defined as high expression.
Patients and Specimens
139 samples from patients with HCC were collected in the Hospital. Ten patients were lost to follow-up. The study was performed to comply with the Declaration of Helsinki principles.
Statistical Analysis
Independent samples t-test was employed to compare the difference between two groups, and the one-way ANOVA was used for three groups or more. KM survival analysis and Log rank tests account for the overall survival. The results were defined as statistical significance if P < 0.05. SPSS software (Version 27.0; IBM, Armonk, NY, USA) was used in all our analyses.
Results
PDSS1 is Up-Regulated in HCC Tissues
TIMER and UALCAN databases were used to analyze the mRNA expression of PDSS1 in different cancer. The results of TIMER in the pan-cancer analysis showed that PDSS1 expression was up-regulated in 13 types of tumors, including hepatocellular carcinoma; however, it was down-regulated in only two types of tumors (Figure 1A). The results of UALCAN suggested that PDSS1 mRNA expression was up-regulated in bladder urothelial carcinoma, invasive breast carcinoma, cervical squamous cell carcinoma, endocervical adenocarcinoma, cholangiocarcinoma, esophageal carcinoma, glioblastoma multiforme, head and neck squamous cell carcinoma, liver hepatocellular carcinoma, lung adenocarcinoma, lung squamous cell carcinoma, prostate adenocarcinoma, rectum adenocarcinoma, stomach adenocarcinoma (STAD), but down-regulated in uterine corpus endometrial carcinoma and thyroid carcinoma (Figure 1B).
 |
Figure 1 The levels of PDSS1 expression in human tumors. (The mRNA expression of PDSS1 in different types of human tumors was analyzed by Tumor Immune Estimation Resource (TIMER) (A) and UALCAN (B). There are representative immunohistochemistry staining images with a PDSS1 antibody in HCC tumor tissues and adjacent tissues in our cohort (C). High expression tumors: Bladder urothelial carcinoma (BLCA); Breast invasive carcinoma (BRCA); Cervical squamous cell carcinoma and endocervical adenocarcinoma (CESC); Liver hepatocellular carcinoma (LIHC);Colon adenocarcinoma (COAD); Esophageal carcinoma (ESCA); Glioblastoma multiforme (GBM); Brain Lower Grade Glioma (LGG); Head and neck squamous cell carcinoma (HNSC);Head and neck squamous cell carcinoma-HPV neg (HNSC- HPV neg); Liver hepatocellular carcinoma (LIHC);Lung adenocarcinoma (LUAD); Lung squamous cell carcinoma (LUSC); Prostate adenocarcinoma (PRAD); Stomach adenocarcinoma (STAD); Uterine Corpus Endometrial Carcinoma (UCEC). Low expression tumors: Kidney chromophobe (KICH); Thyroid carcinoma (THCA). No difference tumors: Breast invasive carcinoma-Basal (BRCA-Basal); Breast invasive carcinoma-Her2 (BRCA- Her2); Breast invasive carcinoma-Luminal (BRCA- Luminal); Kidney renal clear cell carcinoma (KIRC); Kidney renal papillary cell carcinoma (KIRP); Pancreatic adenocarcinoma (PAAD); Pheochromocytoma and Paraganglioma (PCPG); Rectum adenocarcinoma (READ). *Indicates P-value <0.05; **Indicates P-value < 0.01; ***Indicates P-value < 0.001.). |
In order to confirm the expression status of the PDSS1 protein in HCC tissues, immunohistochemistry assays were further conducted to examine the expression pattern of PDSS1 in 139 paired human HCC specimens and non-neoplastic liver tissues. Consistent with the results of TIMER and UALCAN, we also found that PDSS1 was significantly up-regulated in HCC tissue (P<0.01). Furthermore, it is primarily expressed in the cytoplasm and nucleus (Figure 1C).
High PDSS1 Expression Predicts a Poor Prognosis in HCC Patients
First, we explored the prognostic value of PDSS1 mRNA expression in 33 types of cancers by GEPIA. We found that HCC patients with high PDSS1 expression had poorer overall survival (OS) (HR=1.8, P <0.001) and relapse-free survival (RFS) (HR=1.6, P <0.01) (Figure 2A). In addition, high expression of PDSS1 was associated with poorer OS in adrenocortical carcinoma, sarcoma (SARC), and mesothelioma, but had the opposite effect in the brain lower grade glioma, STAD, and THYM (Supplementary Figure 1).
 |
Figure 2 Up-regulated PDSS1 predicts a poor prognosis in HCC patients. The correlation between PDSS1 mRNA expression and survival of patients with HCC was analyzed by Gene Expression Profiling Interactive Analysis (GEPIA) and the Kaplan–Meier (KM) plotter (A and B). The correlation between PDSS1 protein expression and survival of patients with HCC was analyzed by our cohort. (C). Abbreviations: OS, Overall survival; RFS, relapse-free survival. |
Next, we confirmed the prognostic value of PDSS1 mRNA expression in 21 types of cancers by KM plotter. In line with the results obtained from GEPIA, high expression of PDSS1 was correlated with shorter OS (HR=2.12, P <0.0001) and RFS (HR=1.57, P <0.01) in HCC patients (Figure 2B). Moreover, an increased level of PDSS1 expression was correlated with shorter OS in invasive breast carcinoma, kidney renal clear cell carcinoma, lung adenocarcinoma, SARC, and uterine corpus endometrial carcinoma. But a high level of PDSS1 expression had longer OS in esophageal squamous cell carcinoma, STAD, and thymoma (Supplementary Figure 2).
Furthermore, the association between the levels of PDSS1 protein expression and OS or RFS in HCC patients was also investigated in our cohort. The results were certified that a high protein level of PDSS1 expression was significantly associated with worse OS (HR=1.969, P <0.01) and poor RFS (HR=1.858, P <0.05) in patients with HCC (Figure 2C).
PDSS1 is an Independent Risk Factor for HCC Patients
To verify the functions of PDSS1 genes, we analyzed the PDSS1 expression in our cohort with 15 widely recognized clinicopathological parameters, including age, gender, HBsAg, alpha-fetoprotein, alanine aminotransferase, aspartate aminotransferase, cirrhosis, Child-Pugh grade, tumor size, tumor number, tumor thrombus, tumor capsule, tumor grade, tumor stage, and tumor early recurrence. We found PDSS1 was associated with aspartate aminotransferase and early recurrence of HCC (P <0.05)(Table 1). These data suggested that PDSS1 is associated with aggressive behavior in HCC patients.
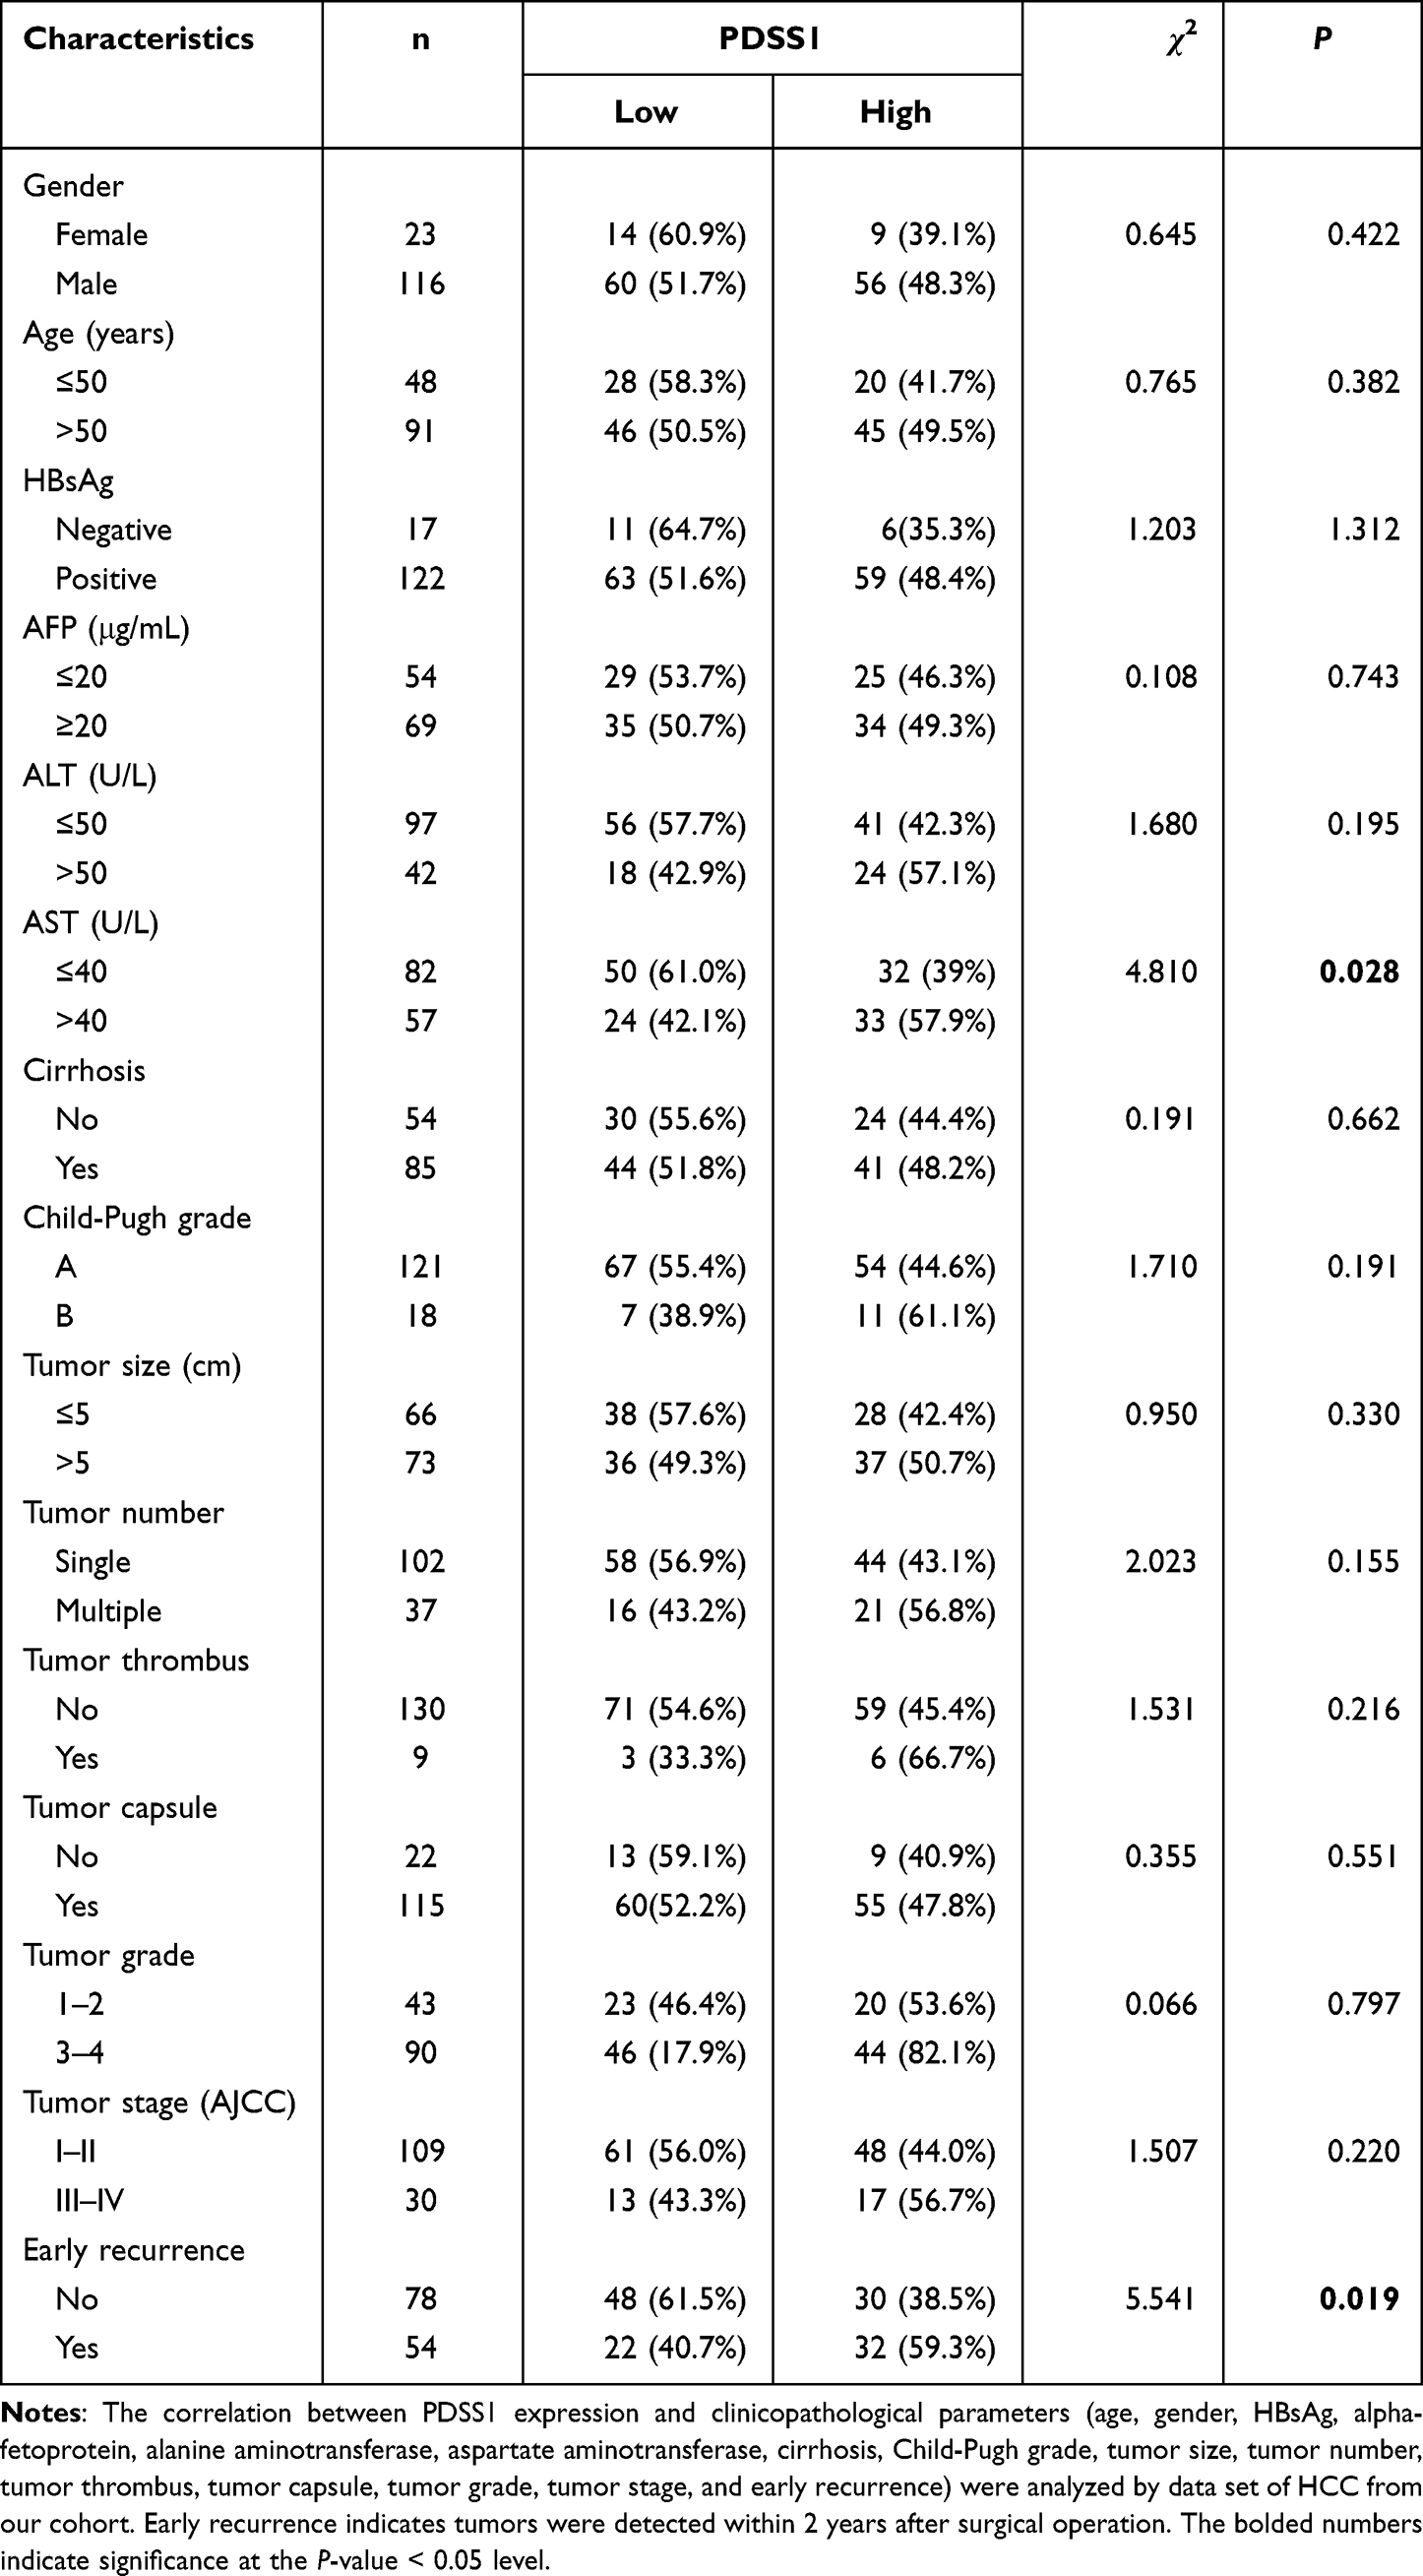 |
Table 1 PDSS1 is Correlated with Early Tumor Recurrence in HCC Patients |
Next, we explored the prognostic potential of PDSS1 expression for OS from our present cohort by univariate and multivariate Cox regression analyses. The univariate analysis suggested that poor Child-Pugh grade (HR = 2.767, P <0.01), bigger tumor size (HR = 2.064, P < 0.001), tumor thrombus (HR = 5.03, P < 0.001), tumor numbers (HR = 2.527, P < 0.001), vascular invasion (HR = 3.333, P < 0.001), advanced tumor stage (HR = 3.999, P < 0.001) and high PDSS1 expression (HR = 2.06, P < 0.01) significantly contribute to the worse OS (Table 2). The multivariate analysis demonstrated that high expression of PDSS1 was an independent risk factor for shorter OS in HCC patients (HR = 1.759, P <0.05) (Table 2). The above studies suggested that an increased level of PDSS1 expression caused an adverse prognosis and may speed up tumor progression of patients with HCC.
 |
Table 2 PDSS1 is an Independent Risk Factor for Patients with Hepatocellular Carcinoma |
Up-Regulation of PDSS1 Reduces the Level of CD8+T Cells Infiltration in Tumor
The infiltration of immune cells in a tumor is closely related to tumor progression and prognosis18,19. Particularly, differentiated CD8+T cells in tumor tissue exert powerful antitumor effects; patients with an elevated level of CD8+T cell infiltration in tumors have a good prognosis.20 We explored the relationship between PDSS1 expression and immune cells infiltration of B cell, macrophages, myeloid dendritic cell, CD4+ T cell, NK cell, and CD8+ T cell in HCC tissue by TIMER. The studies showed that an increased level of PDSS1 was positively correlated with the tumor-infiltration of B cells, macrophages, myeloid dendritic cells, and CD4+ T cells. In contrast, it reduced the level of CD8+T cell infiltration in tumors (P <0.05)(Figure 3A). Nevertheless, differences were not found in NK cell or tumor purity (P >0.05) (Figure 3A). Our present study also demonstrated that PDSS1 was expressed in the tumor microenvironment (Figure 1C).
 |
Figure 3 Up-regulated PDSS1 is associated with tumor immune infiltration in HCC patients. The correlation between PDSS1 expression and immune cells (B cells, macrophages, myeloid dendritic cells, CD4+ T cells, natural killer (NK) cells, and CD8+ T cells) were analyzed by Tumor Immune Estimation Resource (TIMER) (A). Kaplan-Meier survival analysis of the high and low group of PDSS1 expression in patients with HCC based on the number of tumor-infiltrating CD8+ T cells (B). |
To explore the relationship between immune cells infiltration and worse prognosis of HCC patients with elevated PDSS1 expression, we performed the KM plotter to analyze the survival of PDSS1 expression based on the immune cell subgroup. The studies suggested that up-regulation of PDSS1 was a significant indicator of poor prognosis in HCC patients regardless of whether enriched or decreased of B cell, macrophages, CD4+ T cell (P <0.01) (Supplementary Figure 3A–C) or CD8+ T cell (P <0.01) (Figure 3B).
Up-Regulation of PDSS1 Induces CD8+ T Cell Exhaustion by Promoting the Immunosuppressive Microenvironment
The decrease or exhaustion of CD8+ T cells is correlated with the tumor immunosuppressive microenvironment.21,22 Moreover, the tumor immunosuppressive microenvironment is mainly regulated by cell surface inhibitory receptors, immunoregulatory cell populations, and soluble factors.21,22 We used TIMER to explore the correlation between PDSS1 expression and immunosuppressive microenvironment from regulatory factors. The studies showed that high PDSS1 expression promoted the secretion of programmed cell death protein 1 (PD-1; rho =0.154, P <0.01), cytotoxic T lymphocyte-associated antigen-4 (CTLA4; rho = 0.182, P < 0.001), hepatitis A virus cellular receptor 2 (HAVCR2; r=0.212, P < 0.0001), T cell immunoreceptor with Ig and ITIM domains (TIGIT; rho=0.154, P < 0.01) (Figure 4A). The expression of these cell surface inhibitory receptors would deteriorate the function of CD8+ T cells.21 The primary immunosuppressive cells in the HCC microenvironment are myeloid-derived suppressor cells (MDSC), regulatory T cells (Treg), and tumor-associated macrophages (TAM).20 The studies from TIMER indicated that PDSS1 expression was positively correlated with immune biomarker sets23,24 of MDSC (STAT3, CD80, ITGAM, CD33), Treg (CTLA4, FOXP3, CCR4, CCR8), and TAM (PD-1, CD68, CCR2, IL-10) (Figure 4B). Furthermore, soluble molecules, including immunosuppressive cytokines such as transforming growth factor-β (TGFβ), IL-2, IL-7, and IL-10, are the third class of signals that regulate T cell exhaustion.25 These soluble molecules would accelerate the disintegration of CD8+ T cell cells.21,22,25 The data from TIMER indicated that PDSS1 expression was positively correlated with secretion of TGFβ, IL-2, IL-7, and IL-10 (Figure 4C).
 |
Figure 4 Up-regulated PDSS1 is positively correlated with tumor immunosuppressive microenvironment involved in T cell exhaustion. Correlation of PDSS1 expression with T cell surface inhibitory receptor (PD-1, CTLA4, HAVCR2, and TIGIT) (A). Correlation of PDSS1 expression with immunosuppressive cells (myeloid-derived suppressor cells, regulatory T cells, tumor-associated macrophages) (B). Correlation of PDSS1 expression with soluble mediators (TGFβ, IL-2, IL-7, IL-10) (C). |
Up-Regulation of PDSS1 is Correlated with Multiple Immune-Related Signaling Pathways
To explore the potential immune-related signaling pathways of PDSS1, we used GSEA to analyze the RNA seq from TCGA. The studies suggested PDSS1 expression was positively correlated with the WNT signaling pathway, P53 signaling pathway, TGFβ signaling pathway, toll-like receptor signaling pathway, VEGF signaling pathway, nod-like receptor signaling pathway, FC epsilon RI signaling pathway, FC gamma R mediated phagocytosis, and MAPK signaling pathway (P <0.05) (Figure 5). These pathways are associated with immune tolerance, immune inflammation, and inflammatory factors of tumors.26–29
 |
Figure 5 Up-regulated PDSS1 is significantly correlated with nine immune inflammation-related signaling pathways in HCC. The RNA seq from TCGA was analyzed by Gene Set Enrichment Analysis (GSEA). Wnt signaling pathway (A); P53 signaling pathway (B); TGFβsignaling pathway (C); toll-like receptor signaling pathway (D); VEGF signaling pathway (E); nod-like receptor signaling pathway (F); FC epsilon RI signaling pathway (G); FC gamma R mediated phagocytosis (H); MAPK signaling pathway (I). |
Discussion
Up-regulation of PDSS1 speed up the progression of some tumors.7,8 Overexpression of circPDSS1 caused increased proliferation, migration, and invasion rates of urothelial bladder cancer cells.7 High expression of PDSS1 promoted the metastasis of triple-negative breast cancer and suggested patients had a shorter OS.8 Moreover, an increased level of PDSS1 was positively correlated with the hypoxic microenvironment in tumors of HCC; the hypoxia of the tumor microenvironment inhibits tumor immune infiltration.9,10 In the present study, we found that PDSS1 expression levels were associated with prognosis in different tumors. Elevated expression of PDSS1 was correlated with tumor early recurrence and identified as an independent prognostic factor for patients with HCC. Up-regulation of PDSS1 decreased the number of CD8+ T cells in tumor tissue and could induce T cell exhaustion by promoting the secretion of immunosuppressive markers in patients with HCC. Up-regulation of PDSS1 enhanced some immune-related signaling pathways, such as WNT, TGFβ, and VEGF. Our studies identified that PDSS1 served as a prognostic biomarker and is a potential target of immunotherapy for HCC patients.
The aberrant expression and prognostic value of PDSS1 in pan-cancers remain unknown. In our present study, the results from TIMER and UALCAN databases consistently demonstrated the up-regulated PDSS1 in bladder urothelial carcinoma, breast invasive carcinoma, cervical squamous cell carcinoma and endocervical adenocarcinoma, cholangiocarcinoma, esophageal carcinoma, glioblastoma multiforme, head and neck squamous cell carcinoma, liver hepatocellular carcinoma, lung adenocarcinoma, lung squamous cell carcinoma, prostate adenocarcinoma and stomach, and STAD. Moreover, GEPIA and the KM plotter consistently identified the expression of PDSS1 as a prognostic biomarker for SARC, STAD, thymoma, and HCC. We further explored the relationship between clinicopathological parameters and PDSS1 expression to provide more insight into the biological role of PDSS1 in the progression of HCC. The studies indicated that higher expression of PDSS1 is associated with a more advanced tumor stage, and identified PDSS1 expression as an independent risk factor for poor OS in patients with HCC. The above studies indicated PDSS1 played a vital role in the progression of HCC and could be used as a predictor for outcomes of patients with HCC.
Tumor-infiltrating immune cells, especially CD8+ T cells, and tumor microenvironment are closely related to the prognosis of patients with HCC.30–32 Therefore, we investigated the influence of PDSS1 expression on tumor immune infiltration in HCC. The decreased number of tumor-infiltrating CD8+ T cells deteriorated host immune defense against tumor progression and poor prognosis of HCC.33,34 Our studies revealed that high expression of PDSS1 reduced the number of CD8+T cells in HCC tissue. HCC patients with increased expression of PDSS1 had poor OS, despite increased or decreased levels of CD8+ T cells in tumor tissue. An increased level of PDSS1 induced T cell exhaustion mainly through three aspects: the secretion of T cell surface inhibitory receptors and soluble cytokines, and the proliferation and migration of immunosuppressive cells in the tumor microenvironment of HCC. However, a decrease or exhaustion of T cells may cause uncontrolled tumor growth and worsen the prognosis among patients with HCC.35,36
The progression of hepatocellular carcinoma often occurs in the activation background of cancer-promoting immune signals.37 The activation of WNT signaling induces tumor immune tolerance, limiting the antitumor response and promoting the maintenance of Cancer Stem Cells.28,29 Excessive TGFβ stimulation will induce tumor progression.27 Our studies indicated that high expression of PDSS1 enhances the activity of multiple immune signaling pathways, including WNT, TGFβ, VEGF, and other immune signaling pathways in HCC. These studies showed that increased expression of PDSS1 may promote the proliferation, invasion, and metastasis of hepatocellular carcinoma cells through the above pathways.
In summary, our study demonstrated that up-regulation of PDSS1 might help predict the poor prognosis for patients with HCC. PDSS1 can speed up the progression of HCC by reducing T cells’ immune infiltration and regulating immune signals. PDSS1-targeted immunotherapy may be a promising strategy for patients with HCC.
Abbreviations
HCC, hepatocellular carcinoma; PDSS1, decaprenyl diphosphate synthase subunit 1; TIMER, Tumor Immune Estimation Resource; GEPIA, Gene Expression Profiling Interactive Analysis; GSEA, Gene set enrichment analysis; STAD, stomach adenocarcinoma; OS, overall survival; RFS, relapse-free survival; SARC, sarcoma.
Ethics Statement and Consent to Participate
The study was performed to comply with the Declaration of Helsinki principles and was approved by the First Affiliated Hospital of Jinan University Office for Protection of Human Subjects. Written informed consent was obtained from patients or their guardian.
Acknowledgments
We wish to offer our gratitude to the developers and managers of the following resources: Tumor Immune Estimation Resource, Gene Expression Profiling Interactive, Kaplan-Meier plotter, and The Cancer Genome Atlas Program.
Funding
This work was supported by the National Natural Science Foundation of China, China (81471080) for Biao Nie and the Medical Scientific Research Foundation of Guangdong Province, China (A2021091).
Disclosure
The authors declare that they do not have any competing interests in this work.
References
1. Sung H, Ferlay J, Siegel RL, et al. Global cancer statistics 2020: GLOBOCAN estimates of incidence and mortality worldwide for 36 cancers in 185 countries. CA Cancer J Clin. 2021;71(3):209–249. doi:10.3322/caac.21660
2. Llovet JM, Kelley RK, Villanueva A, et al. Hepatocellular carcinoma. Nat Rev Dis Primers. 2021;7(1):6. doi:10.1038/s41572-020-00240-3
3. Scheiner B, Kirstein MM, Hucke F, et al. Programmed cell death protein-1 (PD-1)-targeted immunotherapy in advanced hepatocellular carcinoma: efficacy and safety data from an international multicentre real-world cohort. Aliment Pharmacol Ther. 2019;49(10):1323–1333. doi:10.1111/apt.15245
4. Derynck R, Turley SJ, Akhurst RJ. TGFβ biology in cancer progression and immunotherapy. Nat Rev Clin Oncol. 2021;18(1):9–34. doi:10.1038/s41571-020-0403-1
5. Mollet J, Giurgea I, Schlemmer D, et al. Prenyldiphosphate synthase, subunit 1 (PDSS1) and OH-benzoate polyprenyltransferase (COQ2) mutations in ubiquinone deficiency and oxidative phosphorylation disorders. J Clin Invest. 2007;117(3):765–772. doi:10.1172/JCI29089
6. Dai W, Liu H, Chen K, et al. Genetic variants in PDSS1 and SLC16A6 of the ketone body metabolic pathway predict cutaneous melanoma-specific survival. Mol Carcinog. 2020;59(6):640–650. doi:10.1002/mc.23191
7. Yu Q, Liu P, Han G, Xue X, Ma D. CircRNA circPDSS1 promotes bladder cancer by down-regulating miR-16. Biosci Rep. 2020;40(1). doi:10.1042/BSR20191961
8. Yu TJ, Liu YY, Li XG, et al. PDSS1-mediated activation of CAMK2A-STAT3 signaling promotes metastasis in triple-negative breast cancer. Cancer Res. 2021;81(21):5491–5505. doi:10.1158/0008-5472.CAN-21-0747
9. Hu B, Yang XB, Sang XT. Development and verification of the hypoxia-related and immune-associated prognosis signature for hepatocellular carcinoma. J Hepatocell Carcinoma. 2020;7:315–330. doi:10.2147/JHC.S272109
10. Zhang B, Tang B, Gao J, Li J, Kong L, Qin L. A hypoxia-related signature for clinically predicting diagnosis, prognosis and immune microenvironment of hepatocellular carcinoma patients. J Transl Med. 2020;18(1):342. doi:10.1186/s12967-020-02492-9
11. Zhang T, Nie Y, Gu J, et al. Identification of mitochondrial-related prognostic biomarkers associated with primary bile acid biosynthesis and tumor microenvironment of hepatocellular carcinoma. Front Oncol. 2021;11:587479. doi:10.3389/fonc.2021.587479
12. Li T, Fu J, Zeng Z, et al. TIMER2.0 for analysis of tumor-infiltrating immune cells. Nucleic Acids Res. 2020;48(W1):W509–W514. doi:10.1093/nar/gkaa407
13. Chandrashekar DS, Bashel B, Balasubramanya SAH, et al. UALCAN: a portal for facilitating tumor subgroup gene expression and survival analyses. Neoplasia. 2017;19(8):649–658. doi:10.1016/j.neo.2017.05.002
14. Tang Z, Li C, Kang B, Gao G, Li C, Zhang Z. GEPIA: a web server for cancer and normal gene expression profiling and interactive analyses. Nucleic Acids Res. 2017;45(W1):W98–W102. doi:10.1093/nar/gkx247
15. Győrffy B. Survival analysis across the entire transcriptome identifies biomarkers with the highest prognostic power in breast cancer. Comput Struct Biotechnol J. 2021;19:4101–4109. doi:10.1016/j.csbj.2021.07.014
16. Nagy Á, Munkácsy G, Győrffy B. Pancancer survival analysis of cancer hallmark genes. Sci Rep. 2021;11(1):6047. doi:10.1038/s41598-021-84787-5
17. Subramanian A, Tamayo P, Mootha VK, et al. Gene set enrichment analysis: a knowledge-based approach for interpreting genome-wide expression profiles. Proc Natl Acad Sci U S A. 2005;102(43):15545–15550. doi:10.1073/pnas.0506580102
18. Wherry EJ, Kurachi M. Molecular and cellular insights into T cell exhaustion. Nat Rev Immunol. 2015;15(8):486–499. doi:10.1038/nri3862
19. Zheng C, Zheng L, Yoo JK, et al. Landscape of infiltrating T cells in liver cancer revealed by single-cell sequencing. Cell. 2017;169(7):1342–1356.e1316. doi:10.1016/j.cell.2017.05.035
20. Maimela NR, Liu S, Zhang Y. Fates of CD8+ T cells in tumor microenvironment. Comput Struct Biotechnol J. 2019;17:1–13. doi:10.1016/j.csbj.2018.11.004
21. Kurachi M. CD8(+) T cell exhaustion. Semin Immunopathol. 2019;41(3):327–337. doi:10.1007/s00281-019-00744-5
22. Jiang Y, Li Y, Zhu B. T-cell exhaustion in the tumor microenvironment. Cell Death Dis. 2015;6(6):e1792. doi:10.1038/cddis.2015.162
23. Bronte V, Brandau S, Chen SH, et al. Recommendations for myeloid-derived suppressor cell nomenclature and characterization standards. Nat Commun. 2016;7(1):12150. doi:10.1038/ncomms12150
24. Pan JH, Zhou H, Cooper L, et al. LAYN is a prognostic biomarker and correlated with immune infiltrates in gastric and colon cancers. Front Immunol. 2019;10:6. doi:10.3389/fimmu.2019.00006
25. Wherry EJ. T cell exhaustion. Nat Immunol. 2011;12(6):492–499. doi:10.1038/ni.2035
26. Goel HL, Mercurio AM. VEGF targets the tumour cell. Nat Rev Cancer. 2013;13(12):871–882. doi:10.1038/nrc3627
27. Ikushima H, Miyazono K. TGFbeta signalling: a complex web in cancer progression. Nat Rev Cancer. 2010;10(6):415–424. doi:10.1038/nrc2853
28. Li X, Xiang Y, Li F, Yin C, Li B, Ke X. WNT/β-Catenin signaling pathway regulating T cell-inflammation in the tumor microenvironment. Front Immunol. 2019;10:2293. doi:10.3389/fimmu.2019.02293
29. Patel S, Alam A, Pant R, Chattopadhyay S. Wnt signaling and its significance within the tumor microenvironment: novel therapeutic insights. Front Immunol. 2019;10:2872. doi:10.3389/fimmu.2019.02872
30. Buettner N, Thimme R. Toward a better understanding of hepatocellular carcinoma immune infiltrates. Cell Mol Gastroenterol Hepatol. 2020;9(2):341–342. doi:10.1016/j.jcmgh.2019.11.007
31. Garnelo M, Tan A, Her Z, et al. Interaction between tumour-infiltrating B cells and T cells controls the progression of hepatocellular carcinoma. Gut. 2017;66(2):342–351. doi:10.1136/gutjnl-2015-310814
32. Zhou G, Sprengers D, Boor PPC, et al. Antibodies against immune checkpoint molecules restore functions of tumor-infiltrating T cells in hepatocellular carcinomas. Gastroenterology. 2017;153(4):1107–1119.e1110. doi:10.1053/j.gastro.2017.06.017
33. Huang CY, Wang Y, Luo GY, et al. Relationship between PD-L1 expression and CD8+ T-cell immune responses in hepatocellular carcinoma. J Immunother. 2017;40(9):323–333. doi:10.1097/CJI.0000000000000187
34. Ma J, Zheng B, Goswami S, et al. PD1(Hi) CD8(+) T cells correlate with exhausted signature and poor clinical outcome in hepatocellular carcinoma. J Immunother Cancer. 2019;7(1):331. doi:10.1186/s40425-019-0814-7
35. Hashimoto M, Kamphorst AO, Im SJ, et al. CD8 T cell exhaustion in chronic infection and cancer: opportunities for interventions. Annu Rev Med. 2018;69(1):301–318. doi:10.1146/annurev-med-012017-043208
36. Wang X, He Q, Shen H, et al. TOX promotes the exhaustion of antitumor CD8(+) T cells by preventing PD1 degradation in hepatocellular carcinoma. J Hepatol. 2019;71(4):731–741. doi:10.1016/j.jhep.2019.05.015
37. Prieto J, Melero I, Sangro B. Immunological landscape and immunotherapy of hepatocellular carcinoma. Nat Rev Gastroenterol Hepatol. 2015;12(12):681–700. doi:10.1038/nrgastro.2015.173
 © 2022 The Author(s). This work is published and licensed by Dove Medical Press Limited. The
full terms of this license are available at https://www.dovepress.com/terms
and incorporate the Creative Commons Attribution
- Non Commercial (unported, 3.0) License.
By accessing the work you hereby accept the Terms. Non-commercial uses of the work are permitted
without any further permission from Dove Medical Press Limited, provided the work is properly
attributed. For permission for commercial use of this work, please see paragraphs 4.2 and 5 of our Terms.
© 2022 The Author(s). This work is published and licensed by Dove Medical Press Limited. The
full terms of this license are available at https://www.dovepress.com/terms
and incorporate the Creative Commons Attribution
- Non Commercial (unported, 3.0) License.
By accessing the work you hereby accept the Terms. Non-commercial uses of the work are permitted
without any further permission from Dove Medical Press Limited, provided the work is properly
attributed. For permission for commercial use of this work, please see paragraphs 4.2 and 5 of our Terms.
Recommended articles
Development and Validation of a Propionate Metabolism-Related Gene Signature for Prognostic Prediction of Hepatocellular Carcinoma
Xiao J, Wang J, Zhou C, Luo J
Journal of Hepatocellular Carcinoma 2023, 10:1673-1687
Published Date: 2 October 2023
Construction of a Prognostic Model for Hepatocellular Carcinoma Based on Macrophage Polarization-Related Genes
Chen H, Li J, Cao D, Tang H
Journal of Hepatocellular Carcinoma 2024, 11:857-878
Published Date: 11 May 2024
Molecular Subtyping of Hepatocellular Carcinoma via Lysosome-Related Genes for Prognosis and Therapy Prediction
Yao Y, Zhu T, Shen X, Ma J, Zhu X, Jiang J
International Journal of General Medicine 2025, 18:3933-3950
Published Date: 16 July 2025
The Predictive Significance of Interleukin-2 Receptor in Patients with Hepatocellular Carcinoma
Tian Z, Guo Y, Yang R, Yang W
Journal of Hepatocellular Carcinoma 2025, 12:1893-1904
Published Date: 22 August 2025
Exploring the Potential of CSTF1 as a Prognostic Biomarker in Hepatocellular Carcinoma and Its Correlation with Immune Infiltration
Aimaiti M, Maimaitituxun D, Yilihaer X, Kuerban T, Zhu J, Ainiwaer M, Jia Z, Abudourousuli A
Journal of Hepatocellular Carcinoma 2025, 12:2693-2707
Published Date: 11 December 2025