Back to Journals » Orthopedic Research and Reviews » Volume 17
Opportunistic Screening with Radiomics Model Based on CT Imaging of Adrenal Adenoma to Assess Bone Mass Change
Authors Jia C, Jiang L, Zhang Y, Yang T, Su D, Song M, Yang H, Qin J, Li C, Yang H
Received 19 June 2025
Accepted for publication 31 October 2025
Published 15 November 2025 Volume 2025:17 Pages 539—552
DOI https://doi.org/10.2147/ORR.S548365
Checked for plagiarism Yes
Review by Single anonymous peer review
Peer reviewer comments 2
Editor who approved publication: Professor Clark Hung
Cheng Jia,1,* Ling Jiang,2,* Yue Zhang,1 Tiantian Yang,3 Datian Su,1 Mingxin Song,1 Heqi Yang,1 Jian Qin,1 Changqin Li,1 Hui Yang1
1Department of Radiology, The Second Affiliated Hospital of Shandong First Medical University, Tai’an, Shandong, People’s Republic of China; 2Department of Medical Engineering, The Second Affiliated Hospital of Shandong First Medical University, Tai’an, Shandong, People’s Republic of China; 3Department of Radiology, Central Hospital Affiliated to Shandong First Medical University University, Ji’nan, Shandong, People’s Republic of China
*These authors contributed equally to this work
Correspondence: Hui Yang, Department of Radiology, The Second Affiliated Hospital of Shandong First Medical University, Tai’an, Shandong, People’s Republic of China, Tel +86 15550826993, Email [email protected]
Purpose: There was a strong correlation between adrenal adenoma and osteoporosis, the primary objective of this research was to establish and authenticate a radiomics nomogram using CT scan of adrenal adenoma to screen abnormal bone mineral density (BMD) opportunistically.
Methods and Materials: A total of 161 patients with adrenal adenomas who underwent thoracoabdominal CT and quantitative CT (QCT) were enrolled retrospectively. The radiomics features were chosen from the cross-sectional CT images of adrenal adenomas and the nomogram models that including patient’s clinical and radiomics features were then established. The receiver operating characteristic (ROC) curve was performed to evaluate the performance of the model and the decision curve analysis (DCA) was used to assess the clinical usefulness.
Results: To build a radiomics model, 11 radiomics features based on CT scans of adrenal adenomas were selected and showed good performance in distinguishing abnormal BMD from normal BMD. Moreover, the radiomics nomogram model demonstrated excellent ability to identify abnormal BMD of adrenal adenoma patients with area under the curve (AUC) of 0.87 (95% CI, 0.80– 0.93) in training cohort and 0.85 (95% CI, 0.74– 0.96) in validation cohort. The accuracy, sensitivity, specificity of the nomogram model were 79.7%, 78.3%, 81.1% in training cohort, and 72.9%, 67.7%, 82.4% in validation cohort respectively.
Conclusion: The radiomics nomogram based on clinical and radiomics features of adrenal adenoma CT images had a satisfying predictive ability and can be an opportunistic effective tool for identifying bone mass change.
Keywords: osteoporosis, adrenal adenoma, QCT, radiomics, nomogram
Introduction
During abdominal cross-sectional imaging, adrenal tumors are frequently detected incidentally with a prevalence ranging from 5% to 7%.1 Non-functioning adrenal tumors (NFAT) are the most common incidental tumors of the adrenal gland, followed by adenomas that usually exhibit with mild autonomic cortisol secretion (MACS).2,3 The diagnosis of MACS is based on an abnormal cortisol level (>1.8 µg/dL) after an overnight 1 mg dexamethasone suppression test (DST) in a patient without overt features of hypercortisolism.3 This condition is associated with a higher incidence of metabolic comorbidities, including bone diseases.4–6
The primary factor contributing to the development of secondary osteoporosis is steroid-induced osteoporosis (SIOP), which can be categorized into two forms, an exogenous form resulting from prolonged glucocorticoid administration as an adverse effect, and a rare endogenous form associated with potential endocrine disorders.7,8 MACS serves as the primary reason of endogenous SIOP.9 Patients with MACS are exposed to long-term abnormal cortisol secretion, while those with NFAT are exposed to a lesser degree, which all have detrimental effects on trabecular and cortex of bone.10,11 Numerous studies conducted on various populations have shown that individuals diagnosed with MACS experienced decreased BMD and there was a significant occurrence of vertebral fractures without symptoms, ranging from 56% to 82%, which surpassing the rates observed in those suffering from primary osteoporosis.12,13 Conversely, some researches have indicated that the occurrence of asymptomatic vertebral fractures in NFAT individuals are comparatively less frequent than in MACS, yet still fall within the range of 21%-46%.1,13,14 Additionally, two small-scale longitudinal studies involving approximately twenty participants each over a period of twenty-four month, revealed an incidence rate for new vertebral fractures at around 48–52% among MACS patients and 9–13% among NFAT patients.12,15
In recent times, radiomics has become as a promising technique in computerized quantitative imaging analysis, attracting increased attention.16–18 This approach involves extracting a wide range of image-related features, which are then analyzed to support decision-making processes and develop models for quantitatively analyzing the heterogeneity of lesions.19 Radiomics has been widely used in tumor analysis, which can objectively and quantitatively analyze the comprehensive data information co-determined by physiological, pathological, genetic and other factors hidden in images, holding significant clinical relevance. A study on adrenal adenomas showed that radiomics analysis can aid in the decision-making process, helping clinicians determine whether to opt for follow-up monitoring or proceed with a histopathological diagnosis for an adrenal lesion.20 However, as far as we know, there was a dearth of studies on the relationship between adrenal adenomas and osteoporosis basing on CT images radiomics analysis.
Therefore, the primary objective of this research was to establish and authenticate a nomogram model that integrated radiomics features of adrenal adenomas based on CT imaging with clinical risk factors and aimed to distinguish bone mass change in those individuals opportunistically. This study offered a new perspective for further exploring the relationship between the intrinsic biological features of adrenal adenomas and osteoporosis.
Materials and Methods
Patients
This study was approved by the Institutional Ethics Committee on Biomedical Research (Decision Number, 2023-1-1-089) and the requirement to obtain informed consent was waived. The cohort consisted of patients diagnosed with adrenal adenomas who underwent thoracoabdominal CT scans at our institution between June 2023 and January 2024. Data were obtained from the institutional Picture Archiving and Communication System (PACS) database. Exclusion criteria include adrenocortical carcinoma, pheochromocytoma, Cushing’s syndrome requiring adrenalectomy, the use of drugs to affect bone metabolism, and risk factors associated with secondary osteoporosis, such as glucocorticoid management, osteogenesis imperfecta, hyperparathyroidism, rheumatoid arthritis, diabetes, chronic liver disease, malnutrition, celiac disease, vitamin D deficiency. The workflow of this study was presented in Figure 1.
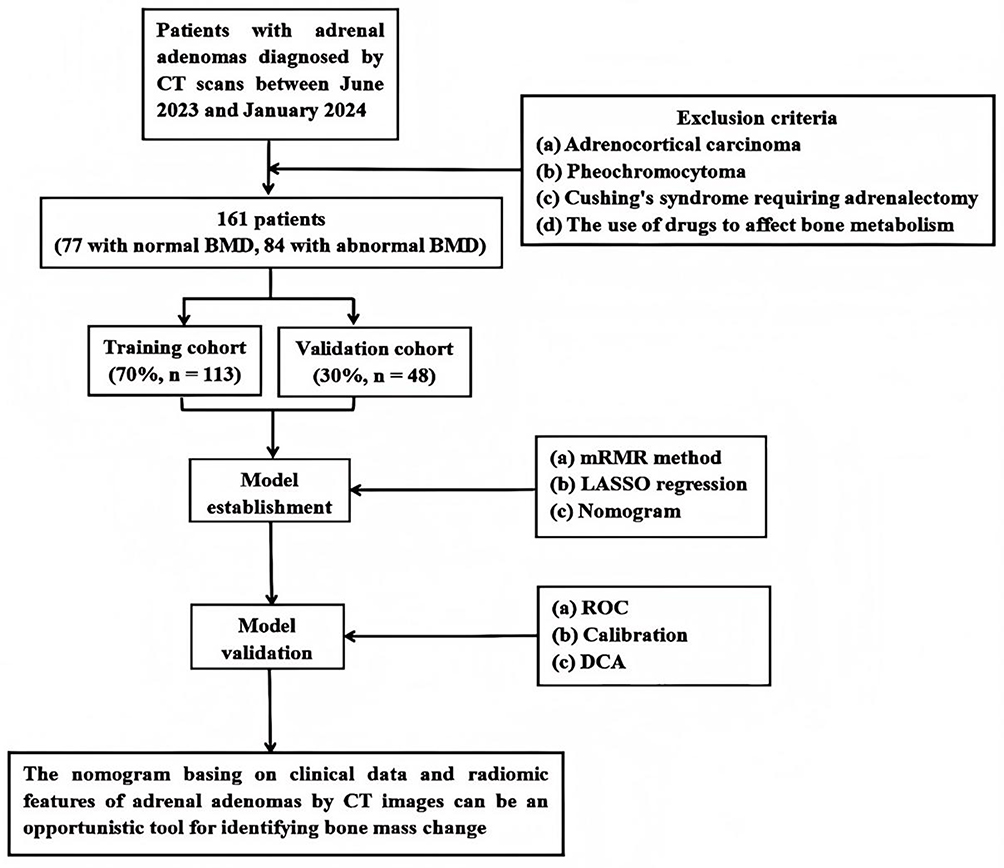 |
Figure 1 The workflow of this study. |
CT Images and QCT Acquisition
All patients included in the study underwent thoracoabdominal CT scans using a 256-slice CT scanner (Brilliance ICT, Philips Healthcare, Cleveland, USA), which used a tube voltage set at 100 kVp and a noise index maintained at 12, as well as a automatic measurement consisted of tube current modulation. Finally slices thickness and interval of 1.25 mm were obtained.
All data were obtained by performing QCT (United Imaging Healthcare Co.,Ltd China) scans. The reconstructed data were then transferred to the QCT Pro workstation. The BMD was measured the mean value from T11 to L2 in all patients. The volume of interest (VOI) was manually positioned at the center of the target vertebrae, covering approximately two-thirds of the entire vertebrae on the axial image. Special attention was given to avoid interference from basivertebral veins and cortical bone during placement. To ensure quality assurance, the same scanning parameters were used for asynchronous calibration model scanning every week (Model 4, Mindways Software, Inc).
Finally, 161 patients were divided into two different cohorts based on BMD levels from QCT scans,21 a normal BMD cohort (BMD>120 mg/cm3) and an abnormal BMD cohort (BMD≤120 mg/cm3).
Clinical Data
To gather comprehensive clinical information, medical records were utilized to obtain data on various factors including gender, age, BMI (Body Mass Index), smoking and drinking habits, lipid profile, glucose metabolism, renal function, and serum calcium levels. Detailed specifics pertaining to adrenal adenomas such as size (maximum tumor diameter) and laterality were extracted from radiology images. The thoracoabdominal CT scans were retrieved via the PACS system and stored in Digital Imaging and Communications in Medicine (DICOM) format.
ROI Segmentation
The DICOM images were imported into ITK-SNAP software (version 3.6.0) and the ROI (region of interest) on axial CT images were manually outlined. To ensure reliable segmentation, two senior radiologists manually delineated the ROI corresponding to the adrenal adenoma on a cross-sectional image, paying particular attention to its maximum appearance (Figure 2). In cases where uncertainty arose regarding the ROI, re-segmentation was only performed after both individuals reached mutual agreement. Subsequently, NIFTI format was used to save the images containing ROI information for subsequent feature analysis.
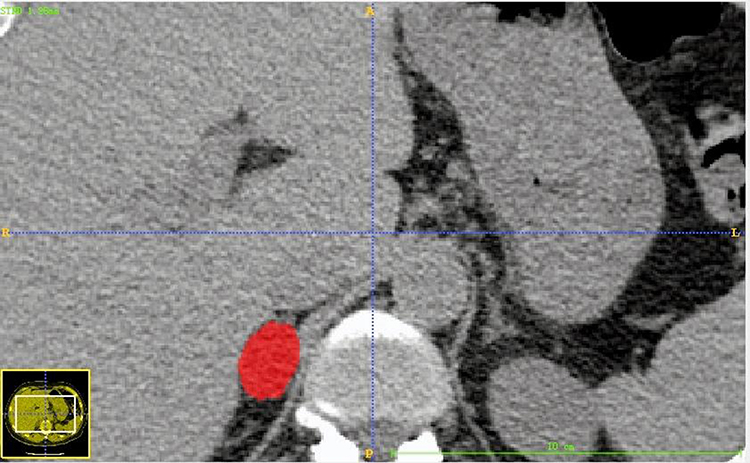 |
Figure 2 Manual rendering of the ROI for adrenal adenoma on a cross-sectional image, adrenal adenoma was usually selected at the largest level of appearance. The red area was the extracted ROI of adrenal adenoma, the blue line was the positioning line. |
To quantitatively evaluate the stability and reproducibility of ROI delineation in this study, an inter-observer agreement analysis was conducted. We randomly selected CT images from 50 patients, and two senior radiologists independently performed manual ROI segmentation without knowledge of each other’s results. Subsequently, using R software, a two-way random-effects model was employed for absolute agreement testing to calculate the intraclass correlation coefficient (ICC) of the Radscore generated from ROI delineated by two radiologists, thereby evaluating the consistency of segmentation results between the two radiologists.
Radiomics Features Extraction
To eliminate potential data variability caused by differences in scanning equipment or parameters, we have performed a series of standardization steps prior to feature extraction. First, all CT images were resampled to a uniform voxel size (1mm×1mm×1mm) using linear interpolation to ensure the spatial scale consistency of radiomic features. Second, to minimize the batch effects introduced by different scanners, we applied the ComBat harmonization method to the extracted radiomic features, thereby correcting for data variations arising from non-biological sources.
Pyradiomics (version 3.0.1) and AK software (version 3.2.0, GE Healthcare, China) were used for features extraction. The image was preprocessed, the gray value was discretized, the width was 25, and the gray value was normalized by μ±3σ method. Then, based on the original image, wavelet transform image and Sigma 2,3 Gaussian filter image Laplace operator, a total of 6 sets of features (first-order features, gray level co-occurence matrix, gray level run length matrix, gray level size zone matrix, gray level dependence matrix and neighboring gray tone difference matrix) were extracted from the original image.
Features Selection
In this research, to eliminate redundant and uncorrelated features, the minimum-Redundancy Maximum-Relevancy (mRMR) method was employed initially. Subsequently, the parameter λ was fine-tuned and evaluated through 10-fold cross-validation using least absolute shrinkage and selection operator (LASSO) regression. Finally, the optimal value of λ corresponding to the model with minimum variance was selected as the most suitable choice and determined the most valuable radiomics features. By assigning weights to these selected features, a Radscore was derived.
All patients diagnosed with adrenal adenoma were randomly divided into a training cohort (n = 113) and a validation cohort (n = 48), with a split ratio of 7,3. The training cohort was utilized for developing and training the predictive model, while the validation cohort verified the model. The AUC of the ROC and the sensitivity, specificity and accuracy of the corresponding model were calculated. To rigorously evaluate the model’s stability and risk of overfitting, we performed internal validation using 1000 iterations of Bootstrapping resampling on the training cohort (n = 113).
Statistical Analysis
All Statistic analysis were performed using R software. To statistically evaluate the adequacy of the sample size in this study, we conducted a post hoc power analysis in R software. Clinical data were analyzed by Shapiro–Wilk (S-W) Test. Quantitative data obeying normal distribution were expressed as mean ± standard deviation (SD). Categorical data were expressed as percentages. Normal distribution variables were analyzed by two-sample t-test. Categorical variables were compared between groups using chi-square test. Finally, a radiomics nomogram was established by combining radiomics features with independent clinical risk factors. The discriminative ability of these models was evaluated using the DeLong test. In addition, calibration curve analysis and the Hosmer-lemonade test were used to assess the predictive accuracy of the assessment model and the fit of the combined nomogram. DCA was used to evaluate the clinical application value of the model. P<0.05 was considered to indicate a statistically significant difference.
Results
Patients Features
A total of 161 patients diagnosed with adrenal adenomas, aged between 36 to 60 years (median age, 53 years), were enrolled in this study. Among them, 77 cases had normal BMD while the remaining 84 cases had abnormal BMD. The training cohort consisted of 113 patients, whereas the validation cohort included 48 patients. The post hoc power analysis revealed a Cohen’s d value of 1.45 (a large effect size), calculated based on the Radscore—a core variable differentiating the normal BMD group (n = 77) from the abnormal BMD group (n = 84). Using this effect size (Cohen’s d= 1.45) and the total sample size (n = 161), a power analysis performed in R software yielded a statistical power of 0.83, exceeding the 0.80 threshold. Table 1 presented a detailed overview of patients’ features in both cohorts. No significant differences were observed between genders, adrenal adenoma size, lipid profile, glucose metabolism, renal function, and serum calcium levels within each cohort. However, there were notable variations in BMI between the normal and abnormal BMD cohorts across both cohorts. Age was found to be statistically significant only in the training cohort but not in the validation cohort. Factors such as laterality of adrenal adenoma as well as smoking and drinking habits did not exhibit statistical significance within the training cohort, however they were statistically significant within the validation cohort.
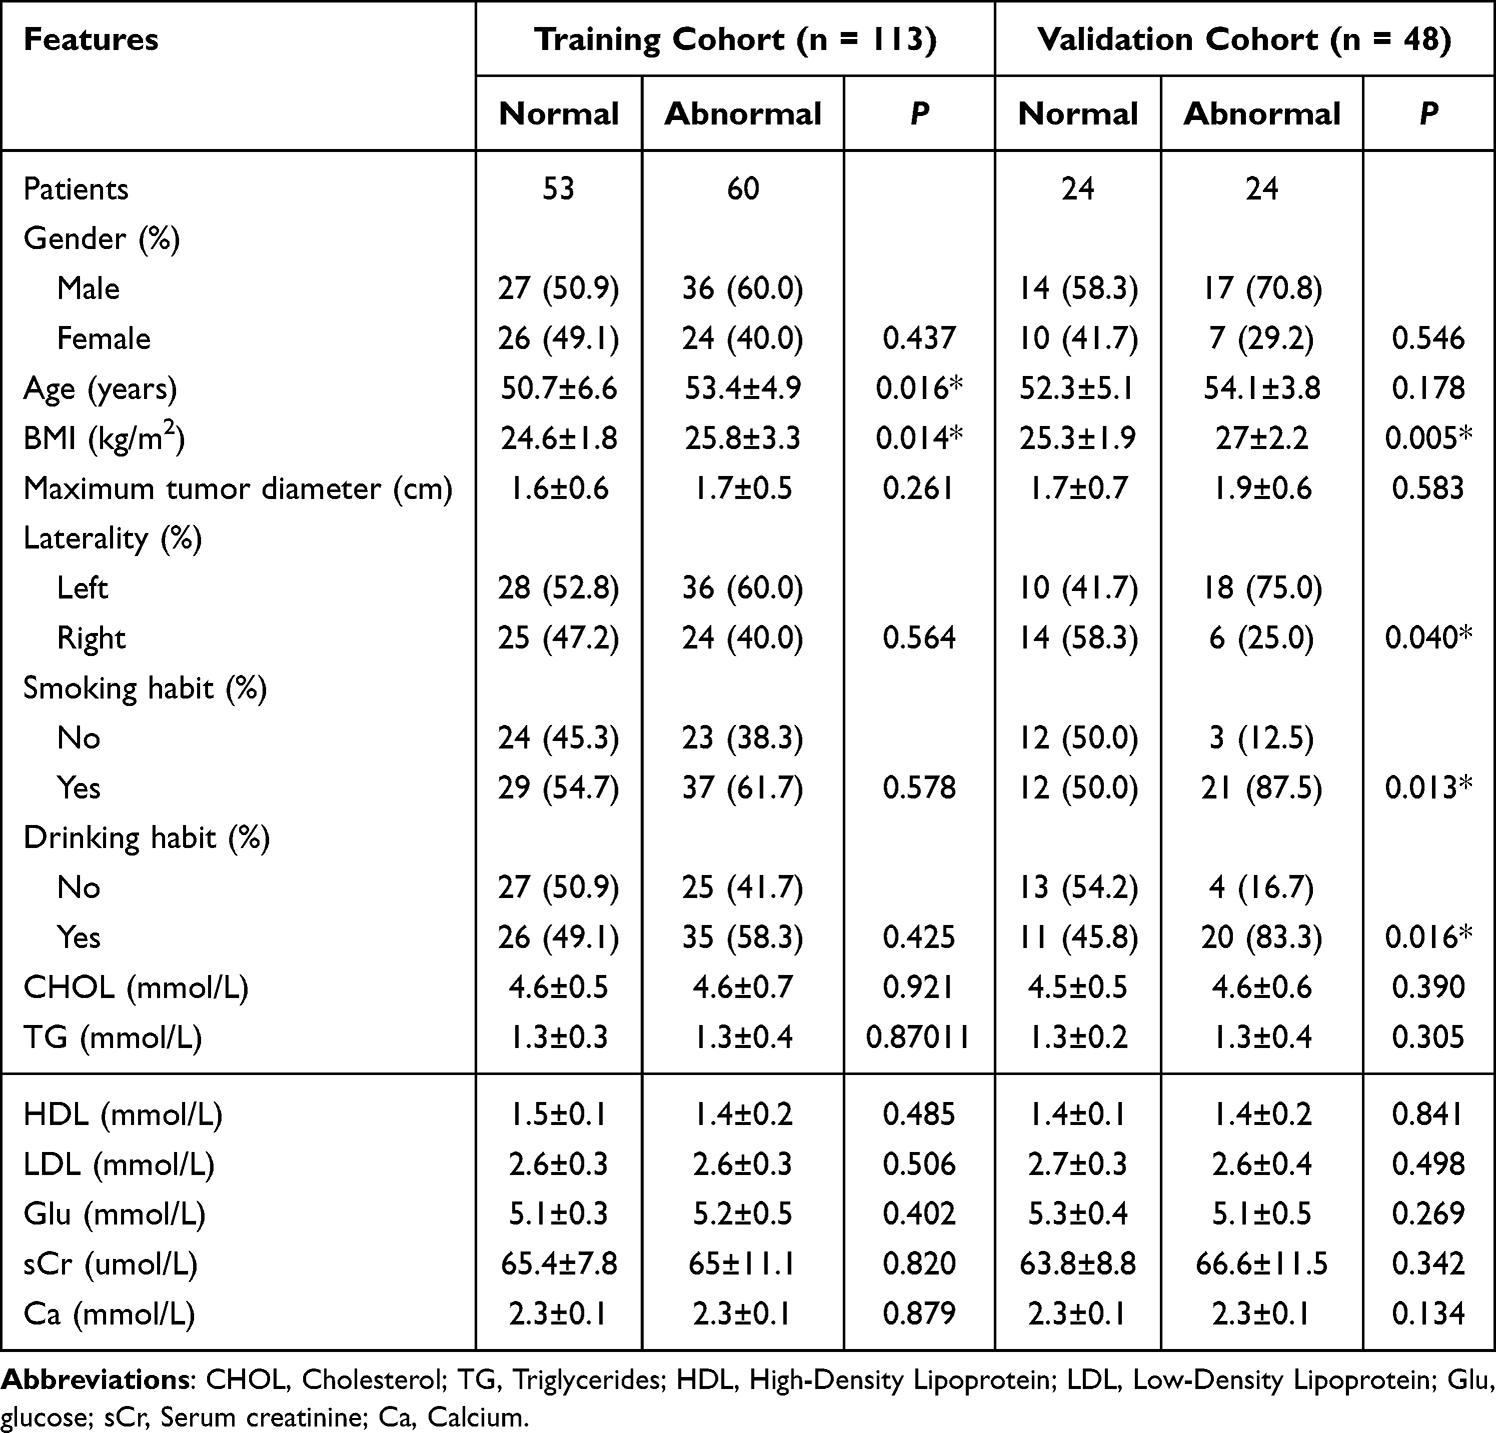 |
Table 1 Clinical Features of Patients with Adrenal Adenomas |
Radscore Building and Validation
The optimal value of λ (λ = 0.039) corresponding to the model with minimum variance was selected as the most suitable choice (Figure 3). A total of eleven subsets containing non-zero coefficients were identified (Figure 4), and their respective coefficients were computed accordingly. By assigning weights to these selected features, a Radscore was derived, which was shown below:
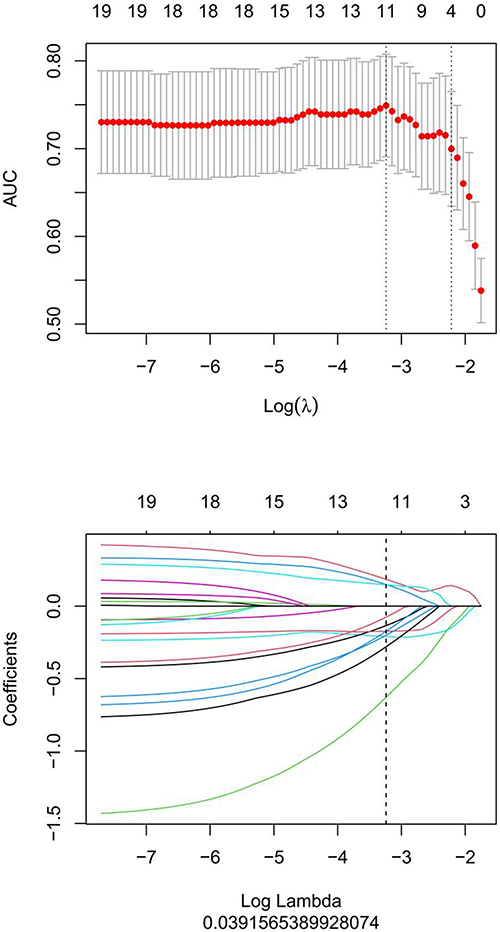 |
Figure 3 Feature selection was performed using mRMR and LASSO. The optimum value for λ was 0.039. |
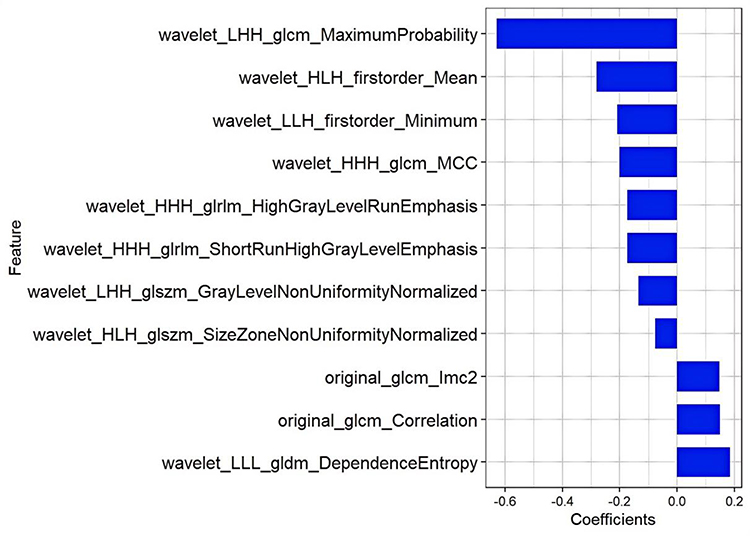 |
Figure 4 The histogram of the Radscore, the y-axis represented 11 radiomics that were selected, while the x-axis denoted the coefficients associated with these radiomics. |
Radscore=0.185*wavelet_LLL_gldm_DependenceEntropy-0.629*wavelet_LHH_glcm_MaximumProbability+0.149*original_glcm_Correlation-0.209*wavelet_LLH_firstorder_Minimum-0.134*wavelet_LHH_glszm_GrayLevelNonUniformityNormalized-0.173*wavelet_HHH_glrlm_ShortRunHighGrayLevelEmphasis-0.173*wavelet_HHH_glrlm_HighGrayLevelRunEmphasis-0.28*wavelet_HLH_firstorder_Mean-0.076*wavelet_HLH_glszm_SizeZoneNonUniformityNormalized-0.201*wavelet_HHH_glcm_MCC+0.148*original_glcm_Imc2 + 0.117
The inter-observer agreement analysis showed good consistency between the two observers. Using a two-way random-effects model for absolute agreement, the ICC for the Radscore obtained from ROIs delineated by two radiologists was 0.8120 (F = 9.55, P<0.05).
The boxplots indicated that the radiomics features of adrenal adenomas in patients with abnormal BMD exhibited significantly higher values in the training cohort and the validation cohort, compared to those with normal BMD (Figure 5). The radiomics model demonstrated an AUC of 0.86 (95% Confidence Interval [CI], 0.79–0.93) in the training cohort and 0.82 (95% CI, 0.70–0.94) in the validation cohort, with corresponding accuracy rates of 78.8% and 75.0%, sensitivity rates of 73.3% and 83.3%, as well as specificity rates of 84.9% and 66.7% (Figure 6 and Table 2). These findings suggested that radiomics features of adrenal adenomas exhibited effective discrimination between normal BMD and abnormal BMD.
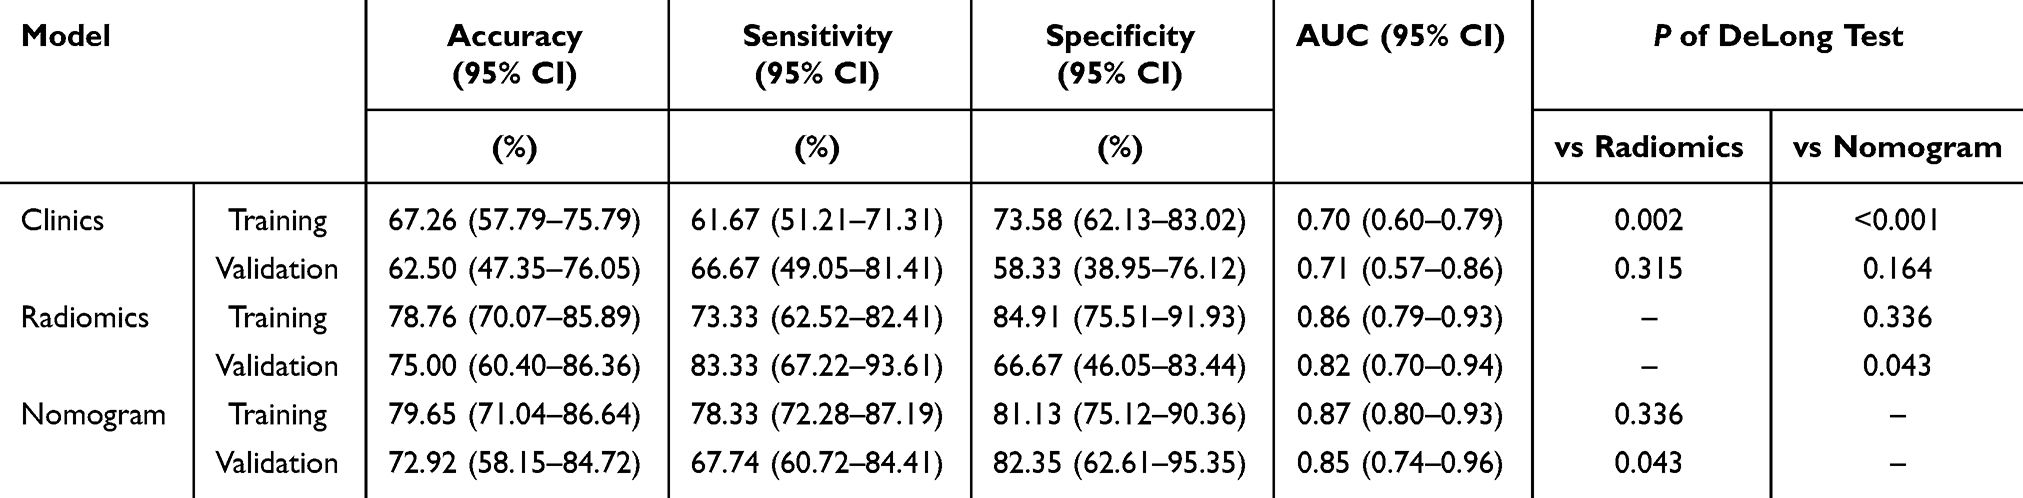 |
Table 2 Diagnostic Validity of Clinical Factors, Radiomics and Nomogram Models in the Training and Validation Cohorts |
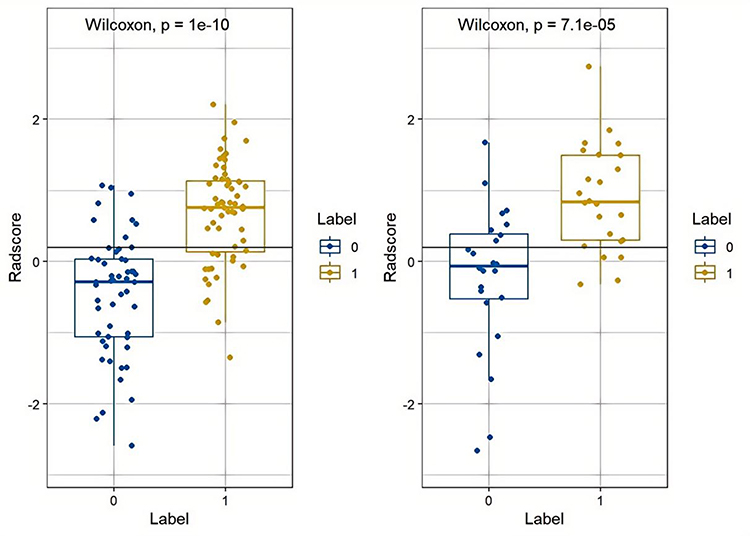 |
Figure 5 The boxplots indicated that the radiomics features of adrenal adenomas in patients with abnormal BMD exhibited significantly higher values in the training cohort (left) and the validation cohort (right), compared to those with normal BMD. “0” represented the normal BMD cohort, while “1” represented to the abnormal BMD cohort. |
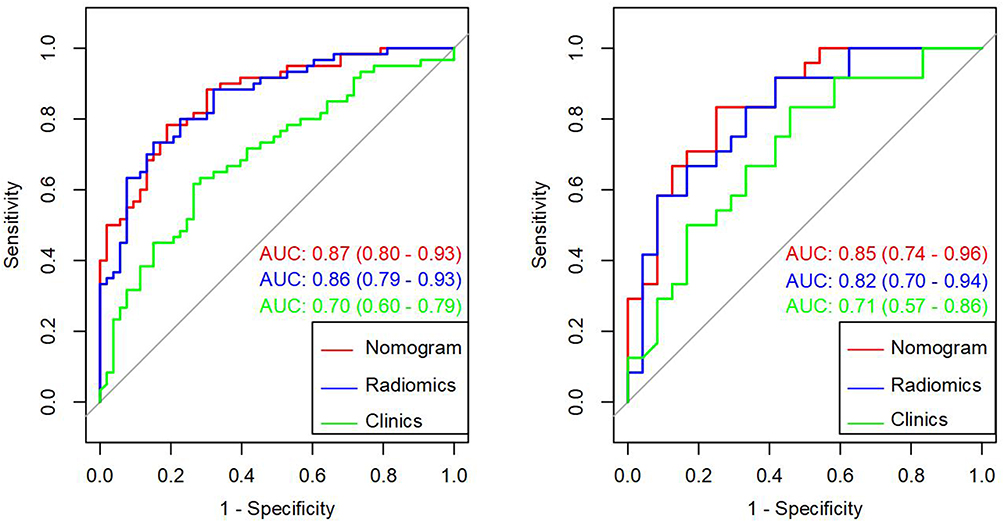 |
Figure 6 Evaluation of the AUC for 3 models in the training cohort (left) and the validation cohort (right). The green line represented the clinic model, the blue line represented the radiomics model, and the red line represented the nomogram model. |
Construction of Combined Nomogram Model
Through clinical and radiomics features, we established a combined nomogram model (Figure 7). Nomoscore = (Intercept)* - 3.793 + Age* 0.052 + BMI * 0.038 + Radscore * 1.855. The training cohort of the nomogram model exhibited a high performance, with an AUC, accuracy, sensitivity and specificity of 0.87 (95% CI, 0.80–0.93), 79.7%, 78.3% and 81.1% respectively. Similarly, the validation cohort also demonstrated good predictive ability with an AUC of 0.85 (95% CI, 0.74–0.96), and the accuracy was found to be 72.9%, while sensitivity and specificity were observed at levels of 67.7% and 82.4% respectively (Figure 6 and Table 2).
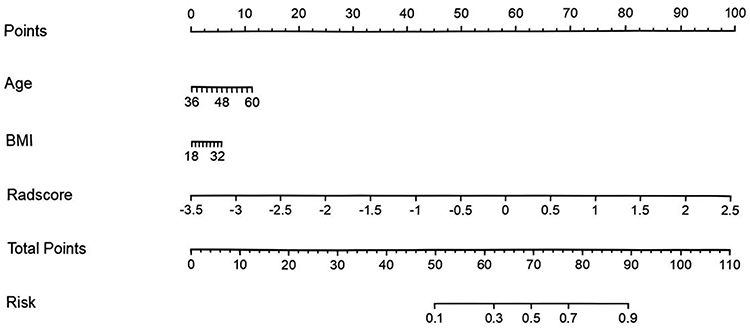 |
Figure 7 A nomogram model was created in the training cohort by integrating age, BMI and Radscores values. |
The overfitting risk assessment (Bootstrapping) results showed that the apparent AUC of the model on the original training set was 0.80. After 1000 iterations of bootstrap validation, the calculated optimism-corrected AUC was 0.78.
The nomogram calibration curve demonstrated the predicted probability between normal and abnormal BMD in the training cohort, which coincided well with the expected probabilities (Figure 8). The P of Hosmer-Lemeshow test for both the training and validation cohorts were greater than 0.05. The DCA was used to evaluate the clinical application value of the model (Figure 9). By conducting DeLong test, we observed significant distinctions of AUC between the clinical model and both the radiomics model as well as the nomogram model within the training cohort. In addition, there were notable variations in AUC between the nomogram model and radiomics model within the validation cohort (Table 2).
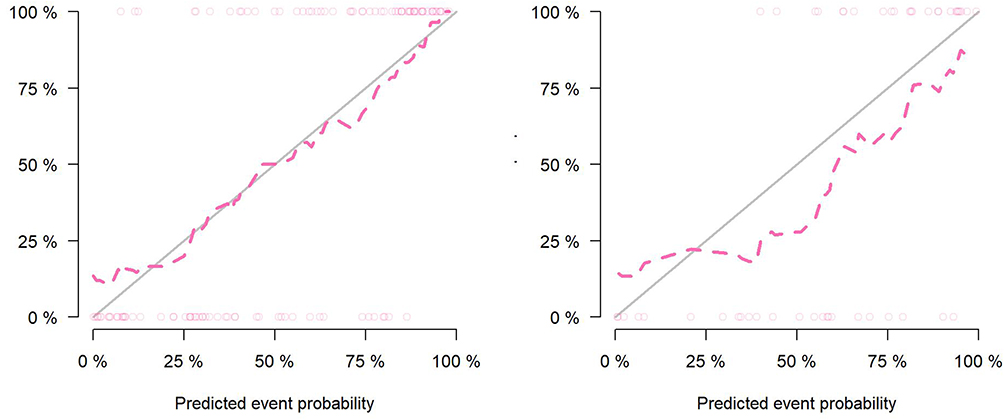 |
Figure 8 The calibration curves of the training cohort (left) and the validation cohort (right) demonstrated the relationship between prediction and reality value. The model’s predictive ability was inversely proportional to the difference between the solid line and dotted line. |
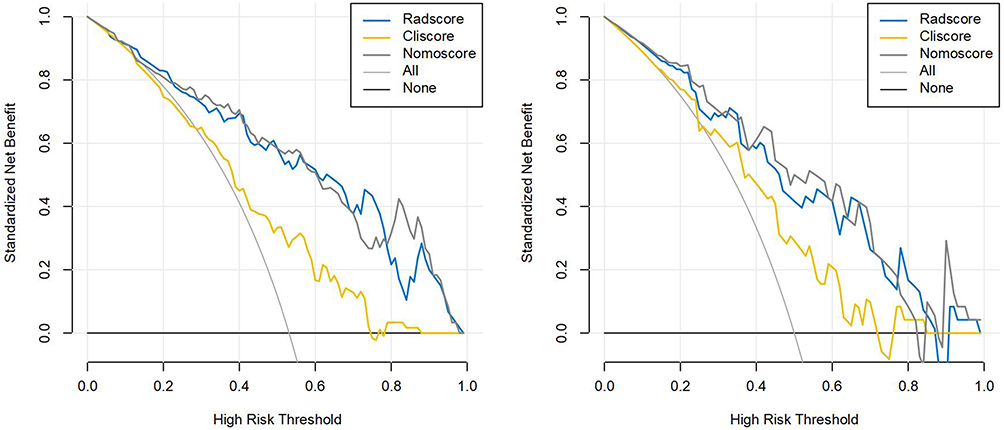 |
Figure 9 The DCA of the different models. The results demonstrated incorporating radiomics nomogram in predicting abnormal BMD provided greater clinical value compared to using only clinical models. The gray line represented the net benefit achieved by utilizing the radiomics nomogram, while the yellow line represented that of the clinical model. “All” indicated the hypothesis that patients had abnormal BMD, whereas “None” represented none of them had abnormal BMD. |
Discussion
The aim of this research was to establish and authenticate a combined nomogram model using CT images of adrenal adenomas for screening abnormal BMD opportunistically. Initially, we assessed both conventional radiomics and clinical features extracted from CT scans and clinical data. Subsequently, We integrated radiomics and clinical features to develop a nomogram model. Our results showed that the training cohort and validation cohort exhibited AUC of 0.87 and 0.85, which indicated that the nomogram model basing on adrenal adenomas had the potential to aid clinicians and radiologists in distinguishing between normal BMD and abnormal BMD effectively. The overfitting risk assessment (Bootstrapping) results revealed a minimal difference of only 0.02 between the apparent AUC value of the model on the original training set and the optimism-corrected AUC value calculated after 1000 bootstrap validation iterations. This strongly indicates that our model exhibits very low optimism bias, effectively controls the risk of overfitting, and demonstrates stability with strong generalization potential. As far as we know, this study was one of the few opportunistic models that incorporated CT scans of adrenal adenomas for osteoporosis diagnosis.
Steroid-induced osteoporosis (SIOP) is the leading contributor to secondary osteoporosis, which is caused by steroid use. Adrenal adenomas often lead to dysregulated hormone levels, particularly abnormal secretion of cortisol. However in some cases, adrenal adenomas may also require hormone replacement therapy with cortisol.22 Cortisol is well-known for inhibiting bone formation and calcium absorption in the intestines. Recurrent findings from extensive studies indicate that there is a strong correlation between adrenal adenoma and osteoporosis, a prevalent age-related ailment.23 Furthermore, recent large-scale investigations have demonstrated an elevated susceptibility to fragility fractures among individuals with this condition.24,25 Meanwhile, a related research indicates a reduction in bone mass among women with adrenal adenomas exposed to even slight degrees of cortisol excess.8 And a case report has highlighted the presentation of insufficiency fractures of the feet in individuals with adrenal adenomas.26 Consequently, while adrenal adenomas warrant attention, it is equally crucial to monitor the bone health of affected patients.
In this study, we employed QCT to evaluate the BMD of patients with adrenal adenomas and categorized them according to the BMD measurement. While dual-energy X-ray absorptiometry (DXA) is widely recognized as the conventional technique for assessing BMD, which employs a two-dimensional (2D) measurement method that is prone to being influenced by factors such as bone hypertrophy and calcification, leading to false-negative results. In addition, DXA solely quantifies bone quantity and lacks precision in providing insights into bone integrity and microarchitecture.27,28 On the other hand, QCT represents a three-dimensional (3D) imaging modality for assessing BMD. By directly measuring BMD, QCT offers multiplanar images free from the influence of surrounding soft tissues, enabling direct quantification of bone volume expressed as bone density.29 Furthermore, QCT possesses the capability to distinguish between trabecular and cortical bones while assessing bone morphology.27 Importantly, when evaluating BMD in the lumbar spine region using QCT measurements, it can remain unaffected by an individual’s body size unlike DXA measurements, which are influenced due to their surface-based nature. Therefore, QCT can be used as a superior tool for assessing BMD in children, young adults with varying statures or extreme BMI values.30
Radiomics, a technique leveraging quantitative computerized imaging analysis, has garnered increasing attention in recent years for aiding disease diagnosis.31,32 Radiomics features can capture features of tissues and lesions, such as shape and heterogeneity.33 In this research, we utilized radiomics features extracted from CT scans of adrenal adenomas to facilitate a precise distinction through a comprehensive quantitative analysis of image features. We utilized the LASSO technique to minimize regression coefficients for the creation of radiomics features. Afterwards, we computed the Radscore by assigning weights to the total sum of coefficients obtained from eleven chosen features. And among these features, wavelet_LLH_glcm_MaximumProbability proved to be the most predictive feature. The radiomics model, which was developed using CT imaging of adrenal adenomas, demonstrated a significant ability to distinguish bone mass change in the training cohort (AUC = 0.86) and also showed promising predictive performance in the validation cohort (AUC = 0.82). As a result, this model has potential for identifying abnormal BMD in patients with adrenal adenomas opportunistically, thus playing a crucial role in ensuring optimal bone health for these individuals in the future.
The gender, adrenal adenoma size, lipid profile, glucose metabolism, renal function and serum calcium did not exhibit statistically significant in either the training or validation cohorts. These findings indicated that there were no discernible difference in these parameters between individuals with abnormal BMD and those with normal BMD in patients with adrenal adenomas. Although age did not reach statistical significance within the validation cohort analysis, however it was found to be significant within the training cohort analysis. Furthermore, the laterality of adrenal adenoma as well as smoking and drinking habit showed no statistical significance within the training cohort; nevertheless they exhibited significance within the validation cohort. In light of the impact of these clinical factors, we established a nomogram model combining clinical and radiomics features. Ultimately, the nomogram model demonstrated excellent discriminatory ability with the highest AUC of 0.87 and 0.85 in the training and validation cohorts respectively. The performance of the nomogram model, as measured by its AUC, surpassed both the radiomics and clinical models in both the training and validation cohorts. These findings indicated that our combined nomogram model was more effective in distinguishing abnormal bone mass change in patients with adrenal adenomas. Moreover, the DCA demonstrated that utilizing this nomogram could yield greater net benefits compared to relying solely on the clinical model. Therefore, implementing our developed nomogram may promise as an assisting tool for radiologists in screening bone mass change in patients with adrenal adenomas opportunistically. This was of great value to further discover the relationship between the intrinsic biological features of adrenal adenomas and the changes of bone microenvironment in clinical practice.
This study had certain limitations. Firstly, this was a retrospective study conducted at a single center without an external evaluation set. Moreover, the number of patients included in the study was relatively small. In future investigations, efforts should be made to address and overcome these limitations. Additionally, the lack of routine MRI for subclassification of lipid-poor adenomas may have influenced the radiomic feature selection. Future studies incorporating chemical-shift MRI could provide further insights into the heterogeneity of adrenal adenomas. Lastly, a single 2D segmentation of adrenal adenoma on cross-sectional CT images was used for analysis. It is worth considering the use of 3D segmentation in the next study when delineating the ROI, as it may offer a more comprehensive analysis of the tumor’s internal features.
Conclusion
In summary, this study offered initial support for the potential of utilizing a radiomics diagnostic model based on CT imaging of adrenal adenoma to predict bone mass change. This had the potential to serve as an opportunistic effective tool for clinicians and radiologists to distinguish abnormal BMD in patients with adrenal adenomas.
Abbreviations
BMD, Bone mineral density; QCT, Quantitative CT; ROC, Receiver operating characteristic; DCA, Decision curve analysis; AUC, Area under the curve; NFAT, Non-functioning adrenal tumors; MACS, Mild autonomic cortisol secretion; DST, Dexamethasone suppression test; SIOP, Steroid-induced osteoporosis; PACS, Picture Archiving and Communication System; VOI, Volume of interest; BMI, Body Mass Index; DICOM, Digital Imaging and Communications in Medicine; ROI, Region of interest; ICC, Intraclass Correlation Coefficient; mRMR, minimum-Redundancy Maximum-Relevancy; LASSO, Least absolute shrinkage and selection operator; SD, Standard deviation; CHOL, Cholesterol; TG, Triglycerides; HDL, High-Density Lipoprotein; LDL, Low-Density Lipoprotein; Glu, Glucose; sCr, Serum creatinine; Ca, Calcium; CI, Confidence Interval; DXA, Dual-energy X-ray absorptiometry; 2D, Two-dimensional; 3D, Three-dimensional.
Data Sharing Statement
The datasets used and/or analysed during the current study are available from the corresponding author on reasonable request.
Ethics Approval and Consent to Participate
This study was approved by the Ethics Committee of The Second Affiliated Hospital of Shandong First Medical University (Decision Number, 2023-1-1-089). Patient consent was not required by the Ethics Committee due to the retrospective nature of this study and the anonymity of the data.
All methods were carried out in accordance with relevant guidelines and regulations and in accordance with the Declaration of Helsinki.
Funding
The present study was supported by grants from the Science and Technology Development Plan Project of Tai ‘an (2021NS251, 2020NS133), the Medical Health Science and Technology Development Plan Project of Shandong Province (202109010477), the Natural Science Foundation of Shandong (ZR2024QH094).
Disclosure
The authors declare no competing interests.
References
1. Li D, Kaur RJ, Zhang CD, et al. Risk of bone fractures after the diagnosis of adrenal adenoma, a population-based cohort study. Eur J Endocrinol. 2021;184(4):597–606.
2. Reimondo G, Castellano E, Grosso M, et al. Adrenal incidentalomas are tied to increased risk of diabetes, findings from a prospective study. J Clin Endocrinol Metab. 2020;105(4):dgz284. doi:10.1210/clinem/dgz284
3. Fassnacht M, Arlt W, Bancos I, et al. Management of adrenal incidentalomas, European society of endocrinology clinical practice guideline in collaboration with the european network for the study of adrenal tumors. Eur J Endocrinol. 2016;175(2):G1–G34. doi:10.1530/EJE-16-0467
4. Delivanis DA, Athimulam S, Bancos I. Modern management of mild autonomous cortisol secretion. Clin Pharmacol Ther. 2019;106(6):1209–1221. doi:10.1002/cpt.1551
5. Athimulam S, Bancos I. Evaluation of bone health in patients with adrenal tumors. Curr Opin Endocrinol Diabetes Obes. 2019;26(3):125–132. doi:10.1097/MED.0000000000000478
6. Elhassan YS, Alahdab F, Prete A, et al. Natural history of adrenal incidentalomas with and without mild autonomous cortisol excess, a systematic review and meta-analysis. Ann Intern Med. 2019;171(2):107–116. doi:10.7326/M18-3630
7. Hardy RS, Zhou H, Seibel MJ, Cooper MS. Glucocorticoids and bone, consequences of endogenous and exogenous excess and replacement therapy. Endocr Rev. 2018;39(5):519–548. doi:10.1210/er.2018-00097
8. Osella G, Reimondo G, Peretti P, et al. The patients with incidentally discovered adrenal adenoma (incidentaloma) are not at increased risk of osteoporosis. J Clin Endocrinol Metab. 2001;86(2):604–607. doi:10.1210/jcem.86.2.7178
9. Lacroix A, Feelders RA, Stratakis CA, Nieman LK. Cushing’s syndrome. Lancet. 2015;386(9996):913–927. doi:10.1016/S0140-6736(14)61375-1
10. Athimulam S, Delivanis D, Thomas M, et al. The impact of mild autonomous cortisol secretion on bone turnover markers. J Clin Endocrinol Metab. 2020;105(5):1469–1477. doi:10.1210/clinem/dgaa120
11. Morelli V, Eller-Vainicher C, Palmieri S, et al. Prediction of vertebral fractures in patients with monolateral adrenal incidentalomas. J Clin Endocrinol Metab. 2016;101(7):2768–2775. doi:10.1210/jc.2016-1423
12. Morelli V, Eller-Vainicher C, Salcuni AS, et al. Risk of new vertebral fractures in patients with adrenal incidentaloma with and without subclinical hypercortisolism, a multicenter longitudinal study. J Bone Miner Res. 2011;26(8):1816–1821. doi:10.1002/jbmr.398
13. Eller-Vainicher C, Morelli V, Ulivieri FM, et al. Bone quality, as measured by trabecular bone score in patients with adrenal incidentalomas with and without subclinical hypercortisolism. J Bone Miner Res. 2012;27(10):2223–2230. doi:10.1002/jbmr.1648
14. Chiodini I, Viti R, Coletti F, et al. Eugonadal male patients with adrenal incidentalomas and subclinical hypercortisolism have increased rate of vertebral fractures. Clin Endocrinol. 2009;70(2):208–213. doi:10.1111/j.1365-2265.2008.03310.x
15. Salcuni AS, Morelli V, Eller Vainicher C, et al. Adrenalectomy reduces the risk of vertebral fractures in patients with monolateral adrenal incidentalomas and subclinical hypercortisolism. Eur J Endocrinol. 2016;174(3):261–269. doi:10.1530/EJE-15-0977
16. Lambin P, Leijenaar RTH, Deist TM, et al. Radiomics, the bridge between medical imaging and personalized medicine. Nat Rev Clin Oncol. 2017;14(12):749–762. doi:10.1038/nrclinonc.2017.141
17. Gu D, Hu Y, Ding H, et al. CT radiomics may predict the grade of pancreatic neuroendocrine tumors, a multicenter study. Eur Radiol. 2019;29(12):6880–6890. doi:10.1007/s00330-019-06176-x
18. Aerts HJ, Velazquez ER, Leijenaar RT, et al. Decoding tumour phenotype by noninvasive imaging using a quantitative radiomics approach [published correction appears in Nat Commun. 2014;5,4644. Cavalho, Sara [corrected to Carvalho, Sara]]. Nat Commun. 2014;5(1):4006. doi:10.1038/ncomms5006
19. Yip SS, Aerts HJ. Applications and limitations of radiomics. Phys Med Biol. 2016;61(13):R150–R166. doi:10.1088/0031-9155/61/13/R150
20. Mendi BAR, Gülbay M. A CT radiomics analysis of the adrenal masses, can we discriminate lipid-poor adenomas from the pheochromocytoma and malignant masses? Curr Med Imaging. 2023;19(9):1018–1030.
21. Troy KL, Edwards WB. Practical considerations for obtaining high quality quantitative computed tomography data of the skeletal system. Bone. 2018;110:58–65. doi:10.1016/j.bone.2018.01.013
22. Nakao H, Yokomoto-Umakoshi M, Nakatani K, et al. Adrenal steroid metabolites and bone status in patients with adrenal incidentalomas and hypercortisolism. EBioMedicine. 2023;95:104733. doi:10.1016/j.ebiom.2023.104733
23. Kanis JA, Cooper C, Rizzoli R, Reginster JY. Scientific advisory board of the european society for clinical and economic aspects of osteoporosis (ESCEO) and the Committees of scientific advisors and national societies of the international osteoporosis foundation (IOF). European guidance for the diagnosis and management of osteoporosis in postmenopausal women [published correction appears in Osteoporos Int. 2020 Jan;31(1),209] [published correction appears in Osteoporos Int. 2020;31(4),801. Osteoporos Int. 2019;30(1):3–44. doi:10.1007/s00198-018-4704-5
24. Mao SS, Li D, Syed YS, et al. Thoracic quantitative computed tomography (QCT) can sensitively monitor bone mineral metabolism, comparison of Thoracic QCT vs lumbar QCT and dual-energy X-ray absorptiometry in detection of age-relative change in bone mineral density. Acad Radiol. 2017;24(12):1582–1587. doi:10.1016/j.acra.2017.06.013
25. Zavatta G, Vicennati V, Altieri P, et al. Mild autonomous cortisol secretion in adrenal incidentalomas and risk of fragility fractures, a large cross-sectional study. Eur J Endocrinol. 2023;188(4):343–352.
26. LiYeung LL, Lui TH. Bilateral adrenal adenoma presented as multiple metatarsal and phalangeal fractures. J Orthop Case Rep. 2015;5(4):77–78. doi:10.13107/jocr.2250-0685.353
27. Barmpa E, Karamagkiolis S, Tigas S, et al. Bone mineral density in adult patients with type 1 diabetes mellitus assessed by both DXA and QCT. J Diabetes Res. 2023;2023:8925956. doi:10.1155/2023/8925956
28. Bolotin HH. DXA in vivo BMD methodology, an erroneous and misleading research and clinical gauge of bone mineral status, bone fragility, and bone remodelling. Bone. 2007;41(1):138–154. doi:10.1016/j.bone.2007.02.022
29. Adams JE. Quantitative computed tomography. Eur J Radiol. 2009;71(3):415–424.
30. Yu EW, Thomas BJ, Brown JK, Finkelstein JS. Simulated increases in body fat and errors in bone mineral density measurements by DXA and QCT. J Bone Miner Res. 2012;27(1):119–124. doi:10.1002/jbmr.506
31. Kang B, Sun C, Gu H, et al. T1 stage clear cell renal cell carcinoma, A CT-based radiomics nomogram to estimate the risk of recurrence and metastasis. Front Oncol. 2020;10(579619). doi:10.3389/fonc.2020.579619
32. Mao N, Dai Y, Lin F, et al. Radiomics Nomogram of DCE-MRI for the prediction of axillary lymph node metastasis in breast cancer. Front Oncol. 2020;10:541849.
33. Gillies RJ, Kinahan PE, Hricak H. Radiomics, images are more than pictures, they are data. Radiology. 2016;278(2):563–577. doi:10.1148/radiol.2015151169
 © 2025 The Author(s). This work is published and licensed by Dove Medical Press Limited. The
full terms of this license are available at https://www.dovepress.com/terms
and incorporate the Creative Commons Attribution
- Non Commercial (unported, 4.0) License.
By accessing the work you hereby accept the Terms. Non-commercial uses of the work are permitted
without any further permission from Dove Medical Press Limited, provided the work is properly
attributed. For permission for commercial use of this work, please see paragraphs 4.2 and 5 of our Terms.
© 2025 The Author(s). This work is published and licensed by Dove Medical Press Limited. The
full terms of this license are available at https://www.dovepress.com/terms
and incorporate the Creative Commons Attribution
- Non Commercial (unported, 4.0) License.
By accessing the work you hereby accept the Terms. Non-commercial uses of the work are permitted
without any further permission from Dove Medical Press Limited, provided the work is properly
attributed. For permission for commercial use of this work, please see paragraphs 4.2 and 5 of our Terms.
Recommended articles
A Predictive Clinical-Radiomics Nomogram for Differentiating Tuberculous Spondylitis from Pyogenic Spondylitis Using CT and Clinical Risk Factors
Wu S, Wei Y, Li H, Zhou C, Chen T, Zhu J, Liu L, Wu S, Ma F, Ye Z, Deng G, Yao Y, Fan B, Liao S, Huang S, Sun X, Chen L, Guo H, Chen W, Zhan X, Liu C
Infection and Drug Resistance 2022, 15:7327-7338
Published Date: 13 December 2022
Optimized Radiomics Nomogram Based on Automated Breast Ultrasound System: A Potential Tool for Preoperative Prediction of Metastatic Lymph Node Burden in Breast Cancer
Li N, Song C, Huang X, Zhang H, Su J, Yang L, He J, Cui G
Breast Cancer: Targets and Therapy 2023, 15:121-132
Published Date: 5 February 2023
Radiomics Nomogram Model Based on TOF-MRA Images: A New Effective Method for Predicting Microaneurysms
Kong D, Li J, Lv Y, Wang M, Li S, Qian B, Yu Y
International Journal of General Medicine 2023, 16:1091-1100
Published Date: 27 March 2023
Integration of Multimodal Computed Tomography Radiomic Features of Primary Tumors and the Spleen to Predict Early Recurrence in Patients with Postoperative Adjuvant Transarterial Chemoembolization
Chen C, Liu J, Gu Z, Sun Y, Lu W, Liu X, Chen K, Ma T, Zhao S, Zhao H
Journal of Hepatocellular Carcinoma 2023, 10:1295-1308
Published Date: 8 August 2023
Shear-Wave Elastography-Based Radiomics Nomogram for the Prediction of Cardiovascular Disease in Patients with Diabetic Kidney Disease
Meng F, Wu Q, Zhang W, Hou S
Diabetes, Metabolic Syndrome and Obesity 2023, 16:2705-2716
Published Date: 7 September 2023