Back to Journals » Diabetes, Metabolic Syndrome and Obesity » Volume 16
Shear-Wave Elastography-Based Radiomics Nomogram for the Prediction of Cardiovascular Disease in Patients with Diabetic Kidney Disease
Authors Meng F, Wu Q, Zhang W, Hou S
Received 23 May 2023
Accepted for publication 29 August 2023
Published 7 September 2023 Volume 2023:16 Pages 2705—2716
DOI https://doi.org/10.2147/DMSO.S422364
Checked for plagiarism Yes
Review by Single anonymous peer review
Peer reviewer comments 3
Editor who approved publication: Prof. Dr. Juei-Tang Cheng
Fei Meng, Qin Wu, Wei Zhang, Shirong Hou
Department of Ultrasound, Xuan Cheng City Central Hospital, Xuancheng, Anhui, People’s Republic of China
Correspondence: Fei Meng, Xuan Cheng City Central Hospital, No. 171, Tonggong Road, Xuanzhou Distinct, Xuancheng, Anhui, 242000, People’s Republic of China, Tel + 86-18956308225, Email [email protected]
Background: Diabetic kidney disease (DKD) patients have a high risk of suffering from cardiovascular disease (CVD), placing a heavy cost on the public health system. In this study, we intended to develop and validate a shear-wave elastography (SWE)-based radiomics nomogram for predicting the development of CVD in DKD patients. This approach allows extensive use of the valuable information contained in ultrasound images, thus helping clinicians to identify CVD in DKD patients.
Methods: Totally 337 and 145 patients constituted the training and validation cohorts, respectively. The radiomics features of the segmented kidney in ultrasound images were extracted and selected to generate the rad-score of each patient. These rad-score, as well as the predictors of risk of CVD occurrence from the clinical characteristics, were included in the multivariate analysis to develop a nomogram. It was further assessed in the training and validation cohorts.
Results: Patients with CVD accounted for 30.9% (104/337) in the training cohort and 31.0% (45/145) in the validation cohort. The rad-score was calculated for each patient using 6 features extracted from the ultrasound images. The radiomics nomogram was built with the rad-score, age, systolic blood pressure (SBP), low-density lipoprotein cholesterol (LDL-C). It was superior to the clinical nomogram developed without the rad-score and demonstrated promising discrimination, calibration, and clinical utility in both training and validation cohorts.
Conclusion: We developed and validated an SWE-based radiomics nomogram to predict CVD risk in patients with DKD. The model was demonstrated to have a promising prediction performance, showing its potential to identify CVD in DKD patients and assist decision-making for appropriate early intervention.
Keywords: radiomics, nomogram, shear-wave elastography, cardiovascular disease, diabetic kidney disease
Introduction
Type 2 diabetes mellitus (T2DM), characterized by hyperglycemia, is a big health challenge around the world that has attracted a lot of attention.1 Diabetic kidney disease (DKD), a common microvascular complication of T2DM, may lead to end-stage renal disease which shortens life expectancy and decreases quality of life.2,3 Inflammation, endothelial dysfunction, electrolyte disturbances, etc. play important roles in the pathogenesis of DKD, which are also the leading causes of the development of cardiovascular disease (CVD).4,5 DKD patients have a high risk of suffering from CVD, placing a heavy cost on the public health system.4,6 Decreased renal function is regarded as an independent predictor of CVD; hence, DKD patients are more likely to develop CVD than the general population, leading to worse functional outcomes and mortality.7–10 At the same time, they suffer from under-treatment due to lack of knowledge of CVD risks. However, the mechanisms underlying the development of CVD in DKD patients have not been completely elucidated, and the individual prognosis are usually heterogeneous. Therefore, identifying risk factors of CVD in DKD patients and intervening early in high-risk patients may lead to improved prognosis.
In the evaluation of DKD, there is an effort to find reliable histologic or biochemical markers. Apart from these markers, reliable imaging evaluation methods are essential. Elastography is an ultrasound-based technique for evaluating tissue elasticity by measuring the speed of shear waves entering the tissue generated by an external stimulus, and is primarily used for the non-invasive evaluation of liver fibrosis,11,12 spleen stiffness,13 prostate lesions,14 and so on. Among the different elastographic methods, shear wave elastography (SWE) technique has been shown in previous studies to be helpful for the kidney.15,16 A low speed means soft, while a high speed represents a stiff medium. However, SWE parameters have a lack of high-dimensional characteristics from various frequency scales. Radiomics is a new method based on high-throughput extraction of medical image features, providing a quantitative and objective basis for standardized analysis.17,18 Recently, radiomics has been used for the analysis of ultrasound images of fibrosis,19–21 which may offer a new approach to elucidating the relationship between SWE and DKD, and also present an alternative to kidney biopsy for predicting DKD progression.
In this study, we intended to develop and validate a SWE-based radiomics nomogram for predicting the development of CVD in DKD patients. This approach allows extensive use of the valuable information contained in ultrasound images, thus helping clinicians to identify CVD in DKD patients.
Methods
Ethics Statement
This retrospective study was approved by medical ethics committee of Xuan Cheng City Central Hospital (No. 2023027) and conducted in accordance with the Declaration of Helsinki. Written informed consents were obtained from patients.
Study Population
From February 2018 to February 2022, 506 patients with DKD from Xuan Cheng City Central Hospital were screened in this study. Inclusion criteria: (i) age>18 years old; (ii) with T2DM; (iii) diagnosed with DKD (defined as estimated glomerular filtration rate [eGFR] <60 mL/min/1.73m2 and/or urinary albumin/creatinine ratio [UACR]≥30 mg/g for more than 3 months); (iv) no less than 2 hospitalizations, which enabled us to document baseline data prior to the CVD event (if any). Exclusion criteria: (i) other types of kidney function injury such as nephrotic syndrome and interstitial kidney disease; (ii) patients with acute infection, malignant tumors, and hypertension; (iii) loss of research information; (iv) with a history of CVD. After screening on the basis of inclusion and exclusion criteria, 482 patients were enrolled in this study. The data (145 patients) recorded between February 2018 and April 2019 were assigned to the validation cohort, and the data (337 patients) obtained between May 2019 and February 2022 were named the training cohort (Figure 1). Patients with CVD accounted for 30.9% (104/337) in the training cohort and 31.0% (45/145) in the validation cohort. Referring to the rule to have at least 10 outcome events per variable,22,23 we ensured less than 10 features retained for the model in order to avoid overfitting.
 |
Figure 1 Summary of patient flow diagram. Abbreviations: DM, diabetes mellitus; T2DM, type 2 diabetes mellitus; DKD, diabetic kidney disease; CVD, cardiovascular disease; Step 1: Patient screening; Step 2: Model construction; Step 3: Model validation. |
The baseline clinical data were obtained from the medical records, including age, gender, Body mass index (BMI), smoking status, drinking status, systolic blood pressure (SBP), diastolic blood pressure (DBP), duration of diabetes, diabetic retinopathy, low-density lipoprotein cholesterol (LDL-C), high-density lipoprotein cholesterol (HDL-C), total cholesterol (TC), triglyceride (TG), serum creatinine (SCr), glycated hemoglobin (HbA1c), hemoglobin.
Cardiovascular Outcomes
According to the International Classification of Diseases 10th Revision (ICD-10), the definition of cardiovascular outcomes was coronary heart disease, congestive heart failure, cerebrovascular disease, and peripheral artery disease.
Workflow of Radiomic Analysis
The ultrasound radiomics workflow included the following: (i) image acquisition for radiomics; (ii) image segmentation and feature extraction; (iii) feature selection and radiomic score (rad-score) development; (iv) construction and validation of the radiomics nomogram (Figure 2).
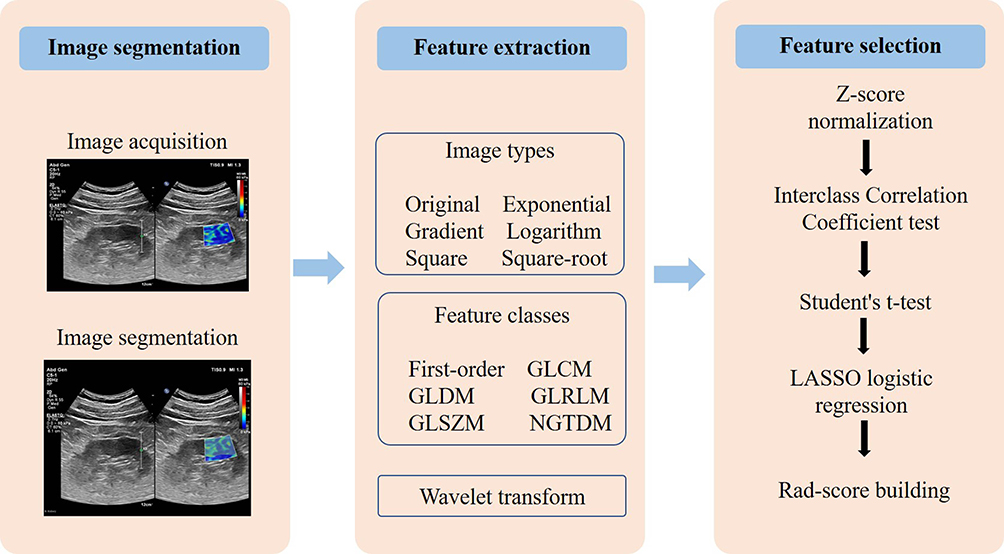 |
Figure 2 Workflow of the critical steps in constructing an ultrasound imaging-based rad-score for a patient with diabetic kidney disease. Kidney tumor is first manually segmented on ultrasound images to extract radiomics features. After normalization, a three-step feature selection method (Interclass Correlation Coefficient test, Student’s t-test, and LASSO logistic regression) was performed to recognize the key radiomics features associated with the development of CVD and incorporate them into the rad-score. Abbreviations: CVD, cardiovascular disease; GLCM, gray-level co-occurrence matrix; GLDM, gray-level dependence matrix; GLRLM, gray-level run length matrix; GLSZM, gray-level size zone matrix; NGTDM, neighbouring grey tone difference matrix; LASSO, least absolute shrinkage and selection operator; rad-score, radiomics score. |
Step 1: Image Acquisition for Radiomics
Kidney ultrasound-based SWE was conducted using the Philips EPIQ 7 ultrasound system. The region of interest (ROI) was located in the kidney cortex.
Step 2: Image Segmentation and Feature Extraction
Utilizing ITK-SNAP software (http://www.itksnap.org/pmwiki/pmwiki.php), ROIs were manually accomplished by an experienced ultrasonographer, which was confirmed by another ultrasonographer (with >10 years of experience). All extractions of radiomics signatures of each ROI were performed by PyRadiomics (v3.7). In total, 6 image types and 6 feature classes were extracted.
Step 3: Feature Selection and Rad-Score Development
Before developing the nomogram model, three feature selection steps were conducted to prevent overfitting. First, the interclass correlation coefficients (ICCs) >0.8 were regarded as acceptable agreement. Next, the t-test was used for each feature between patients with CVD and non-CVD. Then, the using the least absolute shrinkage and selection operator (LASSO) logistic regression with 10-fold cross validation, CVD related features with non-zero coefficients were chosen from those with P-values <0.05 in the t-test. A linear combination of selected features weighted by the LASSO algorithm was used to generate a rad-score for every patient.
Step 4: Construction and Validation of the Radiomics Nomogram
To develop radiomic nomogram, the univariate logistic analysis was initially used to evaluate clinical data, features identified by ultrasound, and rad-score to explore the predictors associated with the occurrence of CVD. Subsequently, the multivariate logistic regression analysis was used to analyze all statistically significant variables from the univariate analysis. Then, a radiomics nomogram including all predictors was conducted in the training cohort, and validated in both the training and validation cohorts.
Statistical Analysis
Statistical analyses were performed using R statistical software (V4.2.1), IBM SPSS Statistics (V21.0), and Python programming software (V3.7.1). The normally distributed variables were recorded as mean (standard deviation), and compared using the Student’s t-test. All non-normally distributed variables were recorded as [interquartile range (IQR)], and compared using Mann–Whitney U-test. The categorical characteristics were recorded as number (percentage), and compared using the χ2 test. A two-sided P <0.05 was regarded as the statistically significant difference. In the validation of the nomogram model, the receiver operating characteristic (ROC) curve, calibration curve with 1000 bootstrap samples, Hosmer-Lemeshow (HL) test, and decision curve analysis (DCA) was used to evaluate the discrimination, calibration, goodness-of-fit, and clinical usefulness of the nomogram model, respectively.
Results
Patient Summary
The clinical data of 337 patients in the training cohort and 145 patients in the validation cohort were evaluated. Patients with CVD accounted for 30.9% (104/337) in the training cohort and 31.0% (45/145) in the validation cohort. No statistically significant differences in CVD distribution, clinical characteristics, and rad-score between the two cohorts were observed (all P values > 0.05). The details of the two cohorts were shown in Table 1.
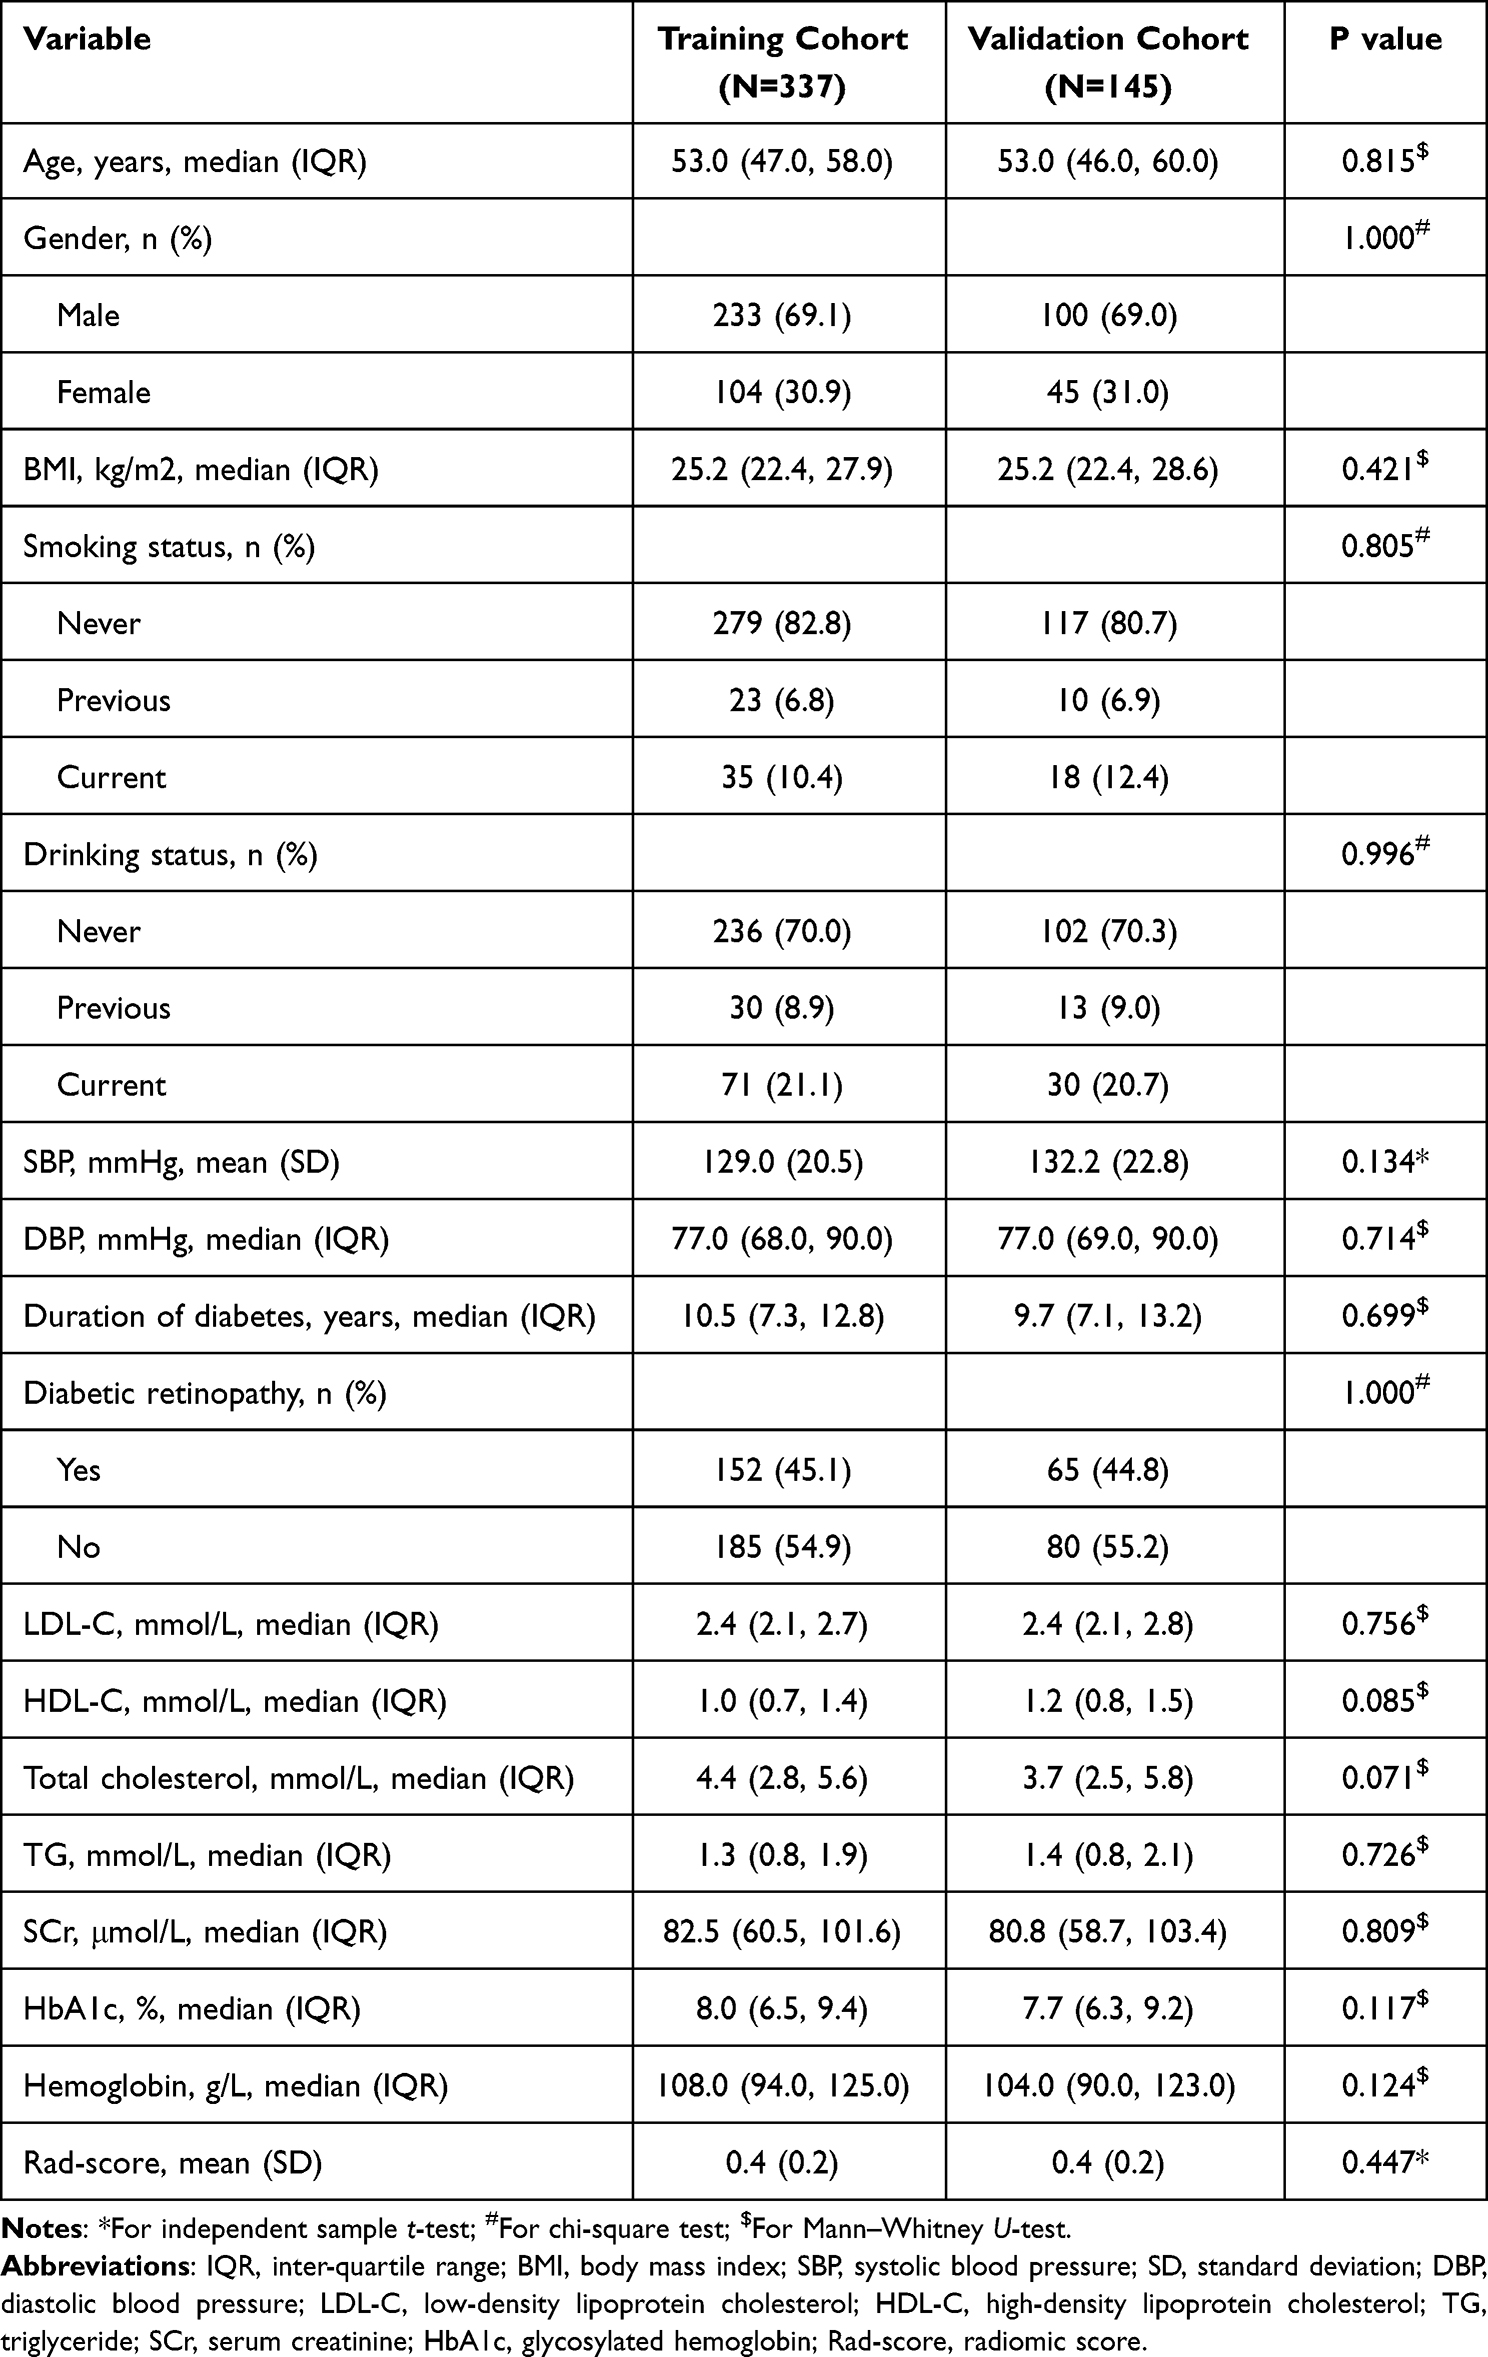 |
Table 1 Comparisons of the Clinical Characteristics and Rad-Score Between the Training and Validation Cohorts |
Radiomics Analyses for Rad-Score
A total of 1313 radiomics features were extracted and normalized from each ultrasound image in the training cohort. Sixty-eight (5.2%) features with intra-observer ICC ≥0.8 were chosen for the next Student’s t-test. Finally, 6 CVD occurrence-related features with non-zero coefficients were chosen using a LASSO logistic regression model (Figures 3A and B). The rad-score was calculated for each patient using these 6 features and their weights, which was the correlation between the CVD occurrence status and the features (Figure 3C). Supplemental Appendix 1 shown its calculation formula. A significant difference in rad-score was found between patients with and without CVD (0.34 [0.18, 0.50] vs 0.58 [0.39, 0.84]; P<0.001). ROC curve analysis indicated that the rad-score exhibited a moderate predictive efficacy for the prediction of the occurrence of the CVD, with the area under the curve (AUC) of 0.791 (Figure 3D).
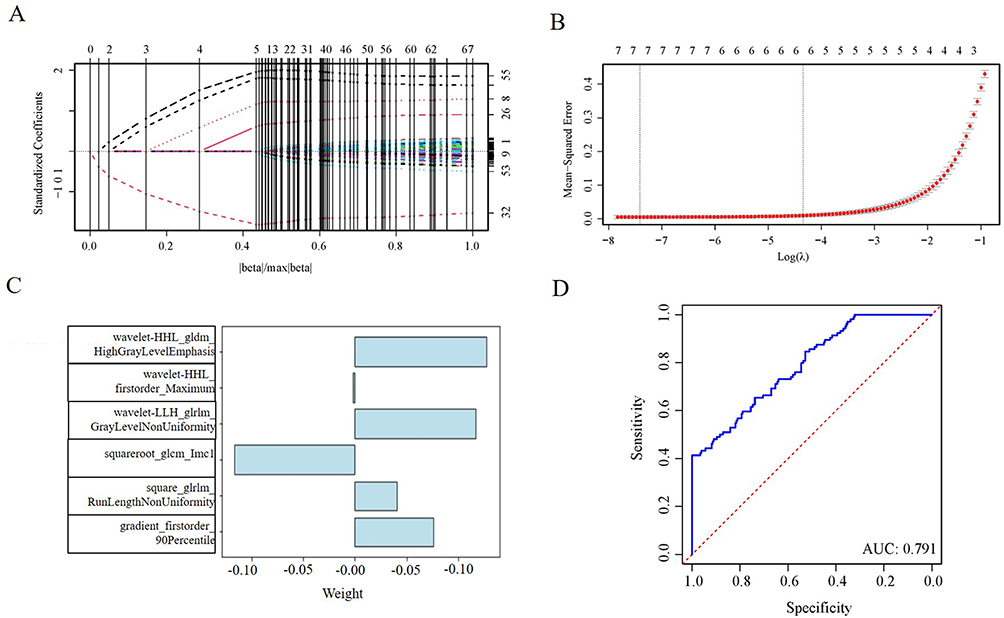 |
Figure 3 Radiomics feature selection using LASSO logistic regression for establishing the rad-score. (A) LASSO coefficient distribution of the 67 radiomics features. (B) Selection of the tuning parameter (λ) using 10-fold cross validation via the minimum criteria (λ.min) and the 1-standard error of the minimum criteria (λ.1-SE). The optimal λ results in 6 features with nonzero coefficients. (C) The weights of the selected radiomics features. (D) ROC curve of the rad-score for predicting the occurrence of CVD. Abbreviations: LASSO, least absolute shrinkage and selection operator; λ, penalty regularization parameter; AUC, area under the curve; ROC, receiver operating characteristic; CVD, cardiovascular disease. |
Radiomics Nomogram Development
To establish the radiomics nomogram, multivariate logistic regression followed by univariate logistic regression was used to evaluate clinical characteristics and the rad-score (Table 2). The result showed that the occurrence of CVD was independently related to age, SBP, LDL-C, and rad-score (all P <0.05). The occurrence of CVD was more prevalent in patients with older age, higher SBP, higher LDL-C level, and higher rad-score (odds ratio [OR]: 1.081, 1.035, 1.876, and 5.531, respectively). The radiomics nomogram was developed with these 4 independent predictors to visualize the likelihood of CVD in patients with DKD (Figure 4).
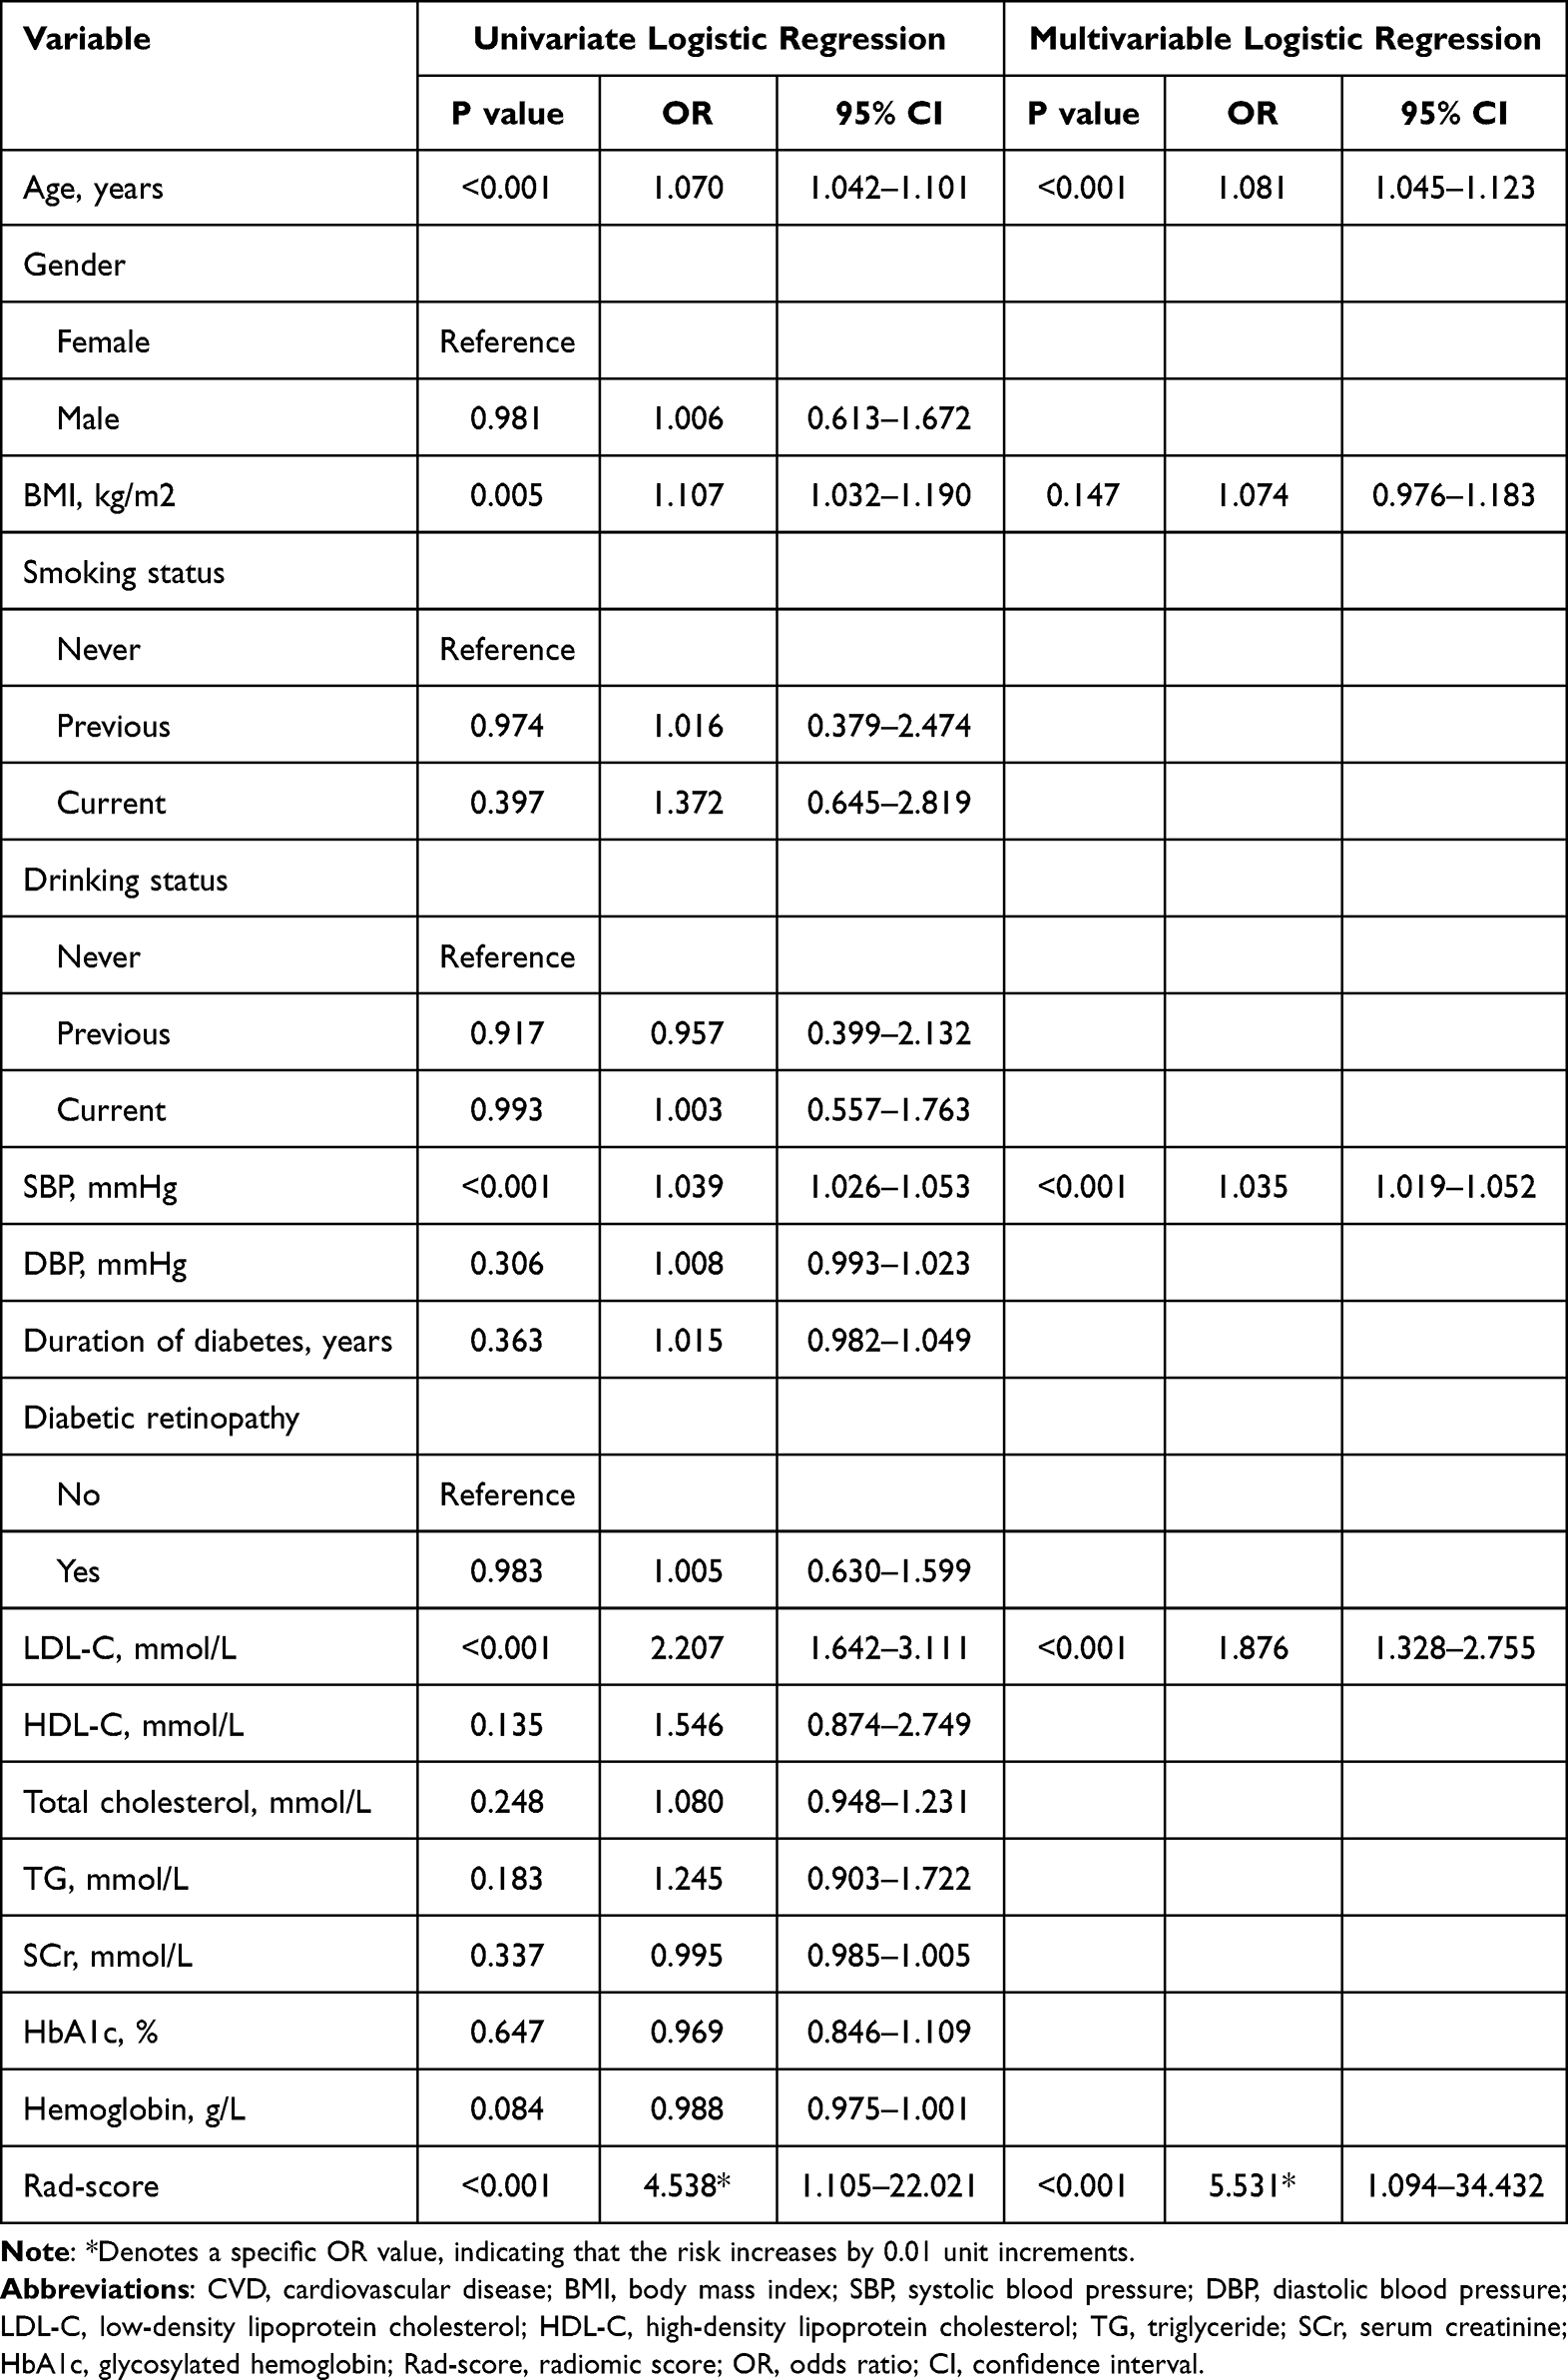 |
Table 2 Univariate and Multivariate Logistic Regression Analyses for the Independent Correlates of the Occurs of CVD |
 |
Figure 4 Radiomics nomogram for predicting CVD risk in patients with DKD. Abbreviations: SBP, systolic blood pressure; LDL-C, low-density lipoprotein cholesterol; Rad-score, radiomics score; CVD, cardiovascular disease; DKD, diabetic kidney disease. |
Model Validation
The ROC curves of the clinical nomogram (without the rad-score) and radiomics nomogram in the training and validation cohorts were compared in Figure 5A and B, respectively. The discrimination of the radiomics model was significantly enhanced in both the training cohort (AUC: 0.888 vs 0.798; P <0.001) and the validation cohort (AUC: 0.894 vs 0.792; P =0.002), respectively. It suggested that the radiomics nomogram in both cohorts obtained better predictions than the model without the rad-score.
 |
Figure 5 Assessment of the discrimination in training and validation cohorts. (A and B) demonstrate the ROC curves in the training and validation cohorts, respectively, for comparing the discrimination of radiomics nomogram and clinical nomogram (without the rad-score). The discrimination of the radiomics nomogram is higher than that of the clinical nomogram in both cohorts. Abbreviations: ROC, receiver operating characteristic; rad-score, radiomics score. |
The calibration curves showed excellent agreement between the radiomics nomogram-predicted and the observed occurrence of CVD in both cohorts (Figures 6A and B). The HL test indicated good calibration of the radiomics nomogram in both the training (χ2 =12.019, P =0.150) and validation (χ2 =9.504, P =0.302) cohorts.
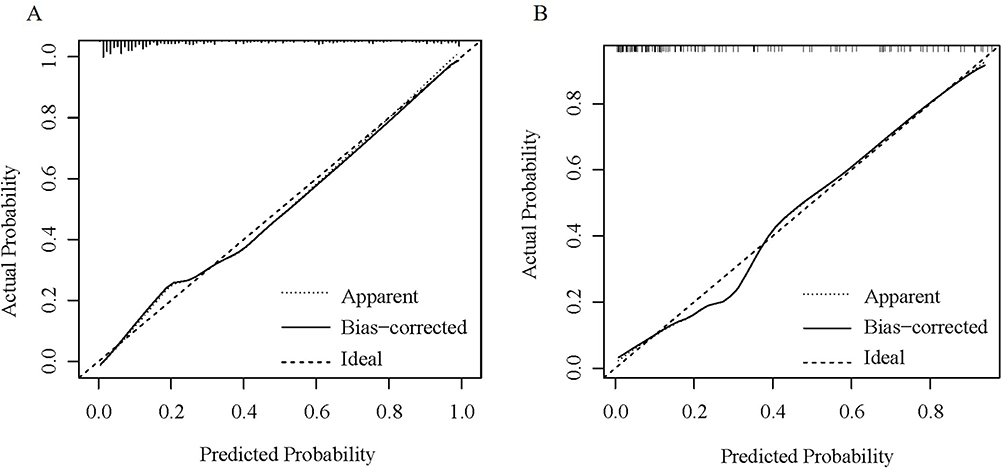 |
Figure 6 Assessment of the calibration in training and validation cohorts. (A and B) demonstrate the calibration curves of the radiomics nomogram in the training and validation cohorts, respectively. |
The DCA of the radiomics nomogram was shown in Figure 7. The plots revealed more net benefit of using radiomics nomogram to predict the occurrence of CVD than the treat-all or treat-none scheme.
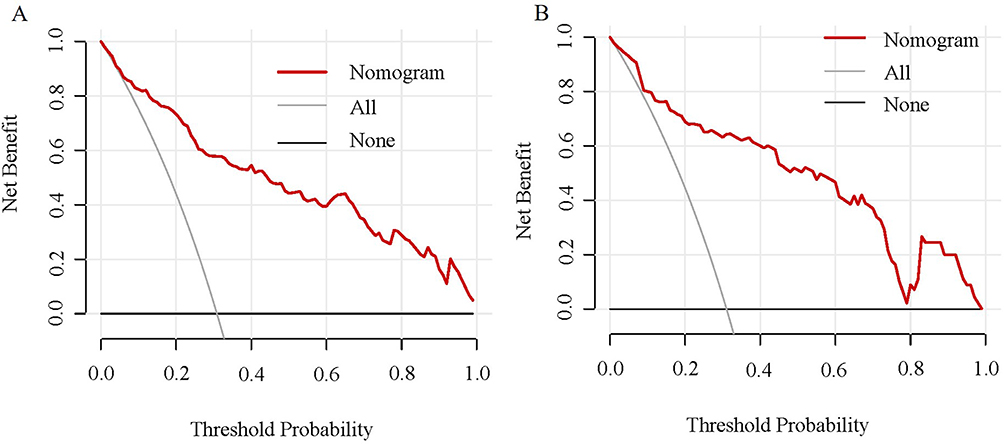 |
Figure 7 DCA of the radiomics nomogram for predicting CVD risk in patients with DKD in the training and validation cohorts. Both (A) (training cohort) and (B) (validation cohort) show that using the radiomics nomogram to predict CVD risk adds more net benefit than the treat-all or treat-none scheme. Abbreviations: DCA, decision curve analysis; CVD, cardiovascular disease; DKD, diabetic kidney disease. |
Example of the Radiomics Nomogram
For example, a 65-year-old patient with DKD had an SBP of 150 mmHg, an LDL-C of 4.5 mmol/L, and a rad-score of 0.5. The corresponding scores were: 37 points for age, 34 points for SBP, 39 points for LDL-C, and 50 points for rad-score. The total score was 160 points, and the risk of developing CVD is close to 90%.
Discussion
The occurrence of CVD is a crucial factor in the poor outcomes of patients with DKD.24 In this study, an SWE-based radiomics nomogram including the baseline clinical characteristics and rad-score was developed and validated as a new tool to predict the development of CVD in patients with DKD. It was superior to the clinical nomogram developed without the rad-score and demonstrated promising discrimination, calibration, and clinical utility in both training and validation cohorts. As a result, clinicians can select the most appropriate treatment strategy according to the results of risk stratification to perform individualized management and even achieve a better CVD outcome.
Many risk factors have been shown to be associated with a high incidence of CVD in patients with DKD. In this study, we also proved 3 recognized traditional risk factors, including age, SBP, and LDL-C, in agreement with previous studies.25 A meta-analysis has revealed that these traditional risk predictors have been demonstrated in classical predictive models for the general population.26 Age is a widely accepted risk factor for CVD.27 In the aging process, fundamental cardiomyocyte often leads to structural changes and functional dysfunction of the heart.28 Hypertension is very common in patients with chronic kidney disease (CKD) and is widely considered to be a risk factor for the occurrence of CVD.29,30 Lowering blood pressure is an essential treatment strategy that not only slows the development of renal failure but also reduces the risk of CVD.31 Previous reports indicated that LDL-C is a potential risk marker for DKD. Regardless of the relationship with DKD, dyslipidemia is strongly associated with overall cardiovascular risk, so controlling dyslipidemia, especially LDL-C, is critical for patients with diabetes. Increased awareness of traditional risk factors for CVD is important for early intervention and effective treatment of patients with DKD.
Pálsson et al32 reported that patients with DKD have a much higher risk of developing CVD compared with patients with diabetes without CKD. The mechanisms underlying this association between DKD and cardiovascular risk are largely unknown. The increased risk in patients with diabetes cannot be fully explained by the common traditional risk factors. Therefore, there is an urgent need to explore other factor to predict the presence of CVD in patients with DKD. Elastography can evaluate increased tissue stiffness due to injury in breast, prostate and kidney.33 We utilized a relatively novel SWE method to evaluate kidney stiffness. An ultrasound image is made up of pixels, and image texture analysis reveals the characteristics, spatial distribution and mutual relationships of pixel gray values of an image, as well as the features of pixel changes, and acquires quantitative data of these texture characteristics. In the present study, by evaluating the textural features of ultrasound images of the kidneys in patients with DKD, we found that SWE-based radiomics features could play an active role in predicting the occurrence of CVD in patients with DKD. In our study, the rad-score was developed on the basis of 6 image types, 6 feature classes, and wavelet transform extracted from ultrasound images, suggesting that it is associated with the occurrence of CVD in DKD patients.
The SWE-based radiomics nomogram developed in this study demonstrated good performance for the risk of developing CVD in patients with DKD. However, we must be aware of the limitations of this study. First, this study was a retrospective design. The prospective studies are needed to check the generalizability and validity of the nomogram. Second, the small number of patients enrolled was also a limitation of our study. Studies in larger sample sizes are needed to verify the superior predictive potential. Finally, this study only enrolled the Chinese population and further validation is required to ensure whether it can be extended to other ethnicities.
Conclusions
We developed and validated an SWE-based radiomics nomogram to predict CVD risk in patients with DKD. The model was demonstrated to have a promising prediction performance, showing its potential to identify CVD in DKD patients and assist decision-making for appropriate early intervention.
Abbreviations
T2DM, Type 2 diabetes mellitus; DKD, Diabetic kidney disease; CVD, Cardiovascular disease; SWE, Shear wave elastography; eGFR, Estimated glomerular filtration rate; UACR, Urinary albumin/creatinine ratio; BMI, Body mass index; SBP, Systolic blood pressure; DBP, Diastolic blood pressure; LDL-C, Low-density lipoprotein cholesterol; HDL-C, High-density lipoprotein cholesterol; TC, Total cholesterol; TG, Triglyceride; SCr, Serum creatinine; HbA1c, Glycated hemoglobin; Rad-score, Radiomic score; ROI, Region of interest; ICC, Interclass correlation coefficient; LASSO, Least absolute shrinkage and selection operator; IQR, Interquartile range; ROC, Receiver operating characteristic; HL, Hosmer-Lemeshow; DCA, Decision curve analysis; AUC, Area under the curve; CKD, chronic kidney disease.
Data Sharing Statement
All data generated or analysed during this study are included in this article. Further enquiries can be directed to the corresponding author.
Ethical Approval
This retrospective study was approved by medical ethics committee of Xuan Cheng City Central Hospital (No. 2023027) and conducted in accordance with the Declaration of Helsinki.
Informed Consent
Data collection was performed after written informed consents were obtained from subjects.
Author Contributions
All authors made a significant contribution to the work reported, whether that is in the conception, study design, execution, acquisition of data, analysis and interpretation, or in all these areas; took part in drafting, revising or critically reviewing the article; gave final approval of the version to be published; have agreed on the journal to which the article has been submitted; and agree to be accountable for all aspects of the work.
Funding
There in no funding to report.
Disclosure
The authors have no conflicts of interest to declare in this work.
References
1. Ueki K, Sasako T, Okazaki Y, et al. Multifactorial intervention has a significant effect on diabetic kidney disease in patients with type 2 diabetes. Kidney Int. 2021;99(1):256–266. doi:10.1016/j.kint.2020.08.012
2. Chen C, Wang C, Hu C, et al. Normoalbuminuric diabetic kidney disease. Front Med. 2017;11(3):310–318. doi:10.1007/s11684-017-0542-7
3. Selby NM, Taal MW. An updated overview of diabetic nephropathy: diagnosis, prognosis, treatment goals and latest guidelines. Diabetes Obes Metab. 2020;22(Suppl 1):3–15. doi:10.1111/dom.14007
4. Maqbool M, Cooper ME, Jandeleit-Dahm KAM. Cardiovascular disease and diabetic kidney disease. Semin Nephrol. 2018;38(3):217–232. doi:10.1016/j.semnephrol.2018.02.003
5. Laffin LJ, Bakris GL. Intersection between chronic kidney disease and cardiovascular disease. Curr Cardiol Rep. 2021;23(9):117. doi:10.1007/s11886-021-01546-8
6. Jankowski J, Floege J, Fliser D, et al. Cardiovascular disease in chronic kidney disease: pathophysiological insights and therapeutic options. Circulation. 2021;143(11):1157–1172. doi:10.1161/circulationaha.120.050686
7. Kühn A, van der Giet M, Kuhlmann MK, et al. Kidney function as risk factor and predictor of cardiovascular outcomes and mortality among older adults. Am J Kidney Dis. 2021;77(3):386–396.e381. doi:10.1053/j.ajkd.2020.09.015
8. Chen J, Budoff MJ, Reilly MP, et al. Coronary artery calcification and risk of cardiovascular disease and death among patients with chronic kidney disease. JAMA Cardiol. 2017;2(6):635–643. doi:10.1001/jamacardio.2017.0363
9. Kelly D, Rothwell PM. Disentangling the multiple links between renal dysfunction and cerebrovascular disease. J Neurol Neurosurg Psychiatry. 2020;91(1):88–97. doi:10.1136/jnnp-2019-320526
10. Johansen KL, Garimella PS, Hicks CW, et al. Central and peripheral arterial diseases in chronic kidney disease: conclusions from a Kidney Disease: improving Global Outcomes (KDIGO) controversies conference. Kidney Int. 2021;100(1):35–48. doi:10.1016/j.kint.2021.04.029
11. Bota S, Herkner H, Sporea I, et al. Meta-analysis: ARFI elastography versus transient elastography for the evaluation of liver fibrosis. Liver Int. 2013;33(8):1138–1147. doi:10.1111/liv.12240
12. Nierhoff J, Chávez Ortiz AA, Herrmann E, et al. The efficiency of acoustic radiation force impulse imaging for the staging of liver fibrosis: a meta-analysis. Eur Radiol. 2013;23(11):3040–3053. doi:10.1007/s00330-013-2927-6
13. Takuma Y, Nouso K, Morimoto Y, et al. Measurement of spleen stiffness by acoustic radiation force impulse imaging identifies cirrhotic patients with esophageal varices. Gastroenterology. 2013;144(1):92–101.e102. doi:10.1053/j.gastro.2012.09.049
14. Zhai L, Madden J, Foo W-C, et al. Characterizing stiffness of human prostates using acoustic radiation force. Ultrason Imaging. 2010;32(4):201–213. doi:10.1177/016173461003200401
15. Yuksekkaya R, Celikyay F, Yuksekkaya M, Kutluturk F. Shear wave elastography in early diabetic kidney disease. Rev Assoc Med Bras. 2022;68(6):765–769. doi:10.1590/1806-9282.20211042
16. Gunduz N, Buz A, Kabaalioglu A. Does early diabetic kidney damage alter renal elasticity? An ultrasound-based, two-dimensional shear wave elastography study. Medeni Med J. 2021;36(3):209–216. doi:10.5222/mmj.2021.65021
17. Limkin EJ, Sun R, Dercle L, et al. Promises and challenges for the implementation of computational medical imaging (radiomics) in oncology. Ann Oncol. 2017;28(6):1191–1206. doi:10.1093/annonc/mdx034
18. Feng S-T, Jia Y, Liao B, et al. Preoperative prediction of microvascular invasion in hepatocellular cancer: a radiomics model using Gd-EOB-DTPA-enhanced MRI. Eur Radiol. 2019;29(9):4648–4659. doi:10.1007/s00330-018-5935-8
19. Kagiyama N, Shrestha S, Cho JS, et al. A low-cost texture-based pipeline for predicting myocardial tissue remodeling and fibrosis using cardiac ultrasound. EBioMedicine. 2020;54:102726. doi:10.1016/j.ebiom.2020.102726
20. Li W, Huang Y, Zhuang BW, et al. Multiparametric ultrasomics of significant liver fibrosis: a machine learning-based analysis. Eur Radiol. 2019;29(3):1496–1506. doi:10.1007/s00330-018-5680-z
21. Ge XY, Lan ZK, Lan QQ, et al. Diagnostic accuracy of ultrasound-based multimodal radiomics modeling for fibrosis detection in chronic kidney disease. Eur Radiol. 2023;33(4):2386–2398. doi:10.1007/s00330-022-09268-3
22. Moons KG, Altman DG, Reitsma JB, et al. Transparent Reporting of a Multivariable Prediction Model For Individual Prognosis Or Diagnosis (TRIPOD): explanation and elaboration. Ann Internal Med. 2015;162(1):W1–73. doi:10.7326/m14-0698
23. Battersby NJ, Bouliotis G, Emmertsen KJ, et al. Development and external validation of a nomogram and online tool to predict bowel dysfunction following restorative rectal cancer resection: the POLARS score. Gut. 2018;67(4):688–696. doi:10.1136/gutjnl-2016-312695
24. Santoro D, Gembillo G. Glomerular filtration rate as a predictor of outcome in acute coronary syndrome complicated by atrial fibrillation. J Clin Med. 2020;9(5). doi:10.3390/jcm9051466
25. Rahman M, Hsu JY, Desai N, et al. Central blood pressure and cardiovascular outcomes in chronic kidney disease. Clin J Am Soc Nephrol. 2018;13(4):585–595. doi:10.2215/cjn.08620817
26. Jiang W, Wang J, Shen X, et al. Establishment and validation of a risk prediction model for early diabetic kidney disease based on a systematic review and meta-analysis of 20 cohorts. Diabet Care. 2020;43(4):925–933. doi:10.2337/dc19-1897
27. Costantino S, Paneni F, Cosentino F. Ageing, metabolism and cardiovascular disease. J Physiol. 2016;594(8):2061–2073. doi:10.1113/jp270538
28. Picca A, Mankowski RT, Burman JL, et al. Mitochondrial quality control mechanisms as molecular targets in cardiac ageing. Nat Rev Cardiol. 2018;15(9):543–554. doi:10.1038/s41569-018-0059-z
29. Yan Z, Wang Y, Li S, et al. Hypertension control in adults With CKD in China: baseline results from the Chinese cohort study of chronic kidney disease (C-STRIDE). Am J Hypertens. 2018;31(4):486–494. doi:10.1093/ajh/hpx222
30. McMullan CJ, Hickson DA, Taylor HA, et al. Prospective analysis of the association of ambulatory blood pressure characteristics with incident chronic kidney disease. J Hypertens. 2015;33(9):1939–1946. doi:10.1097/hjh.0000000000000638
31. Cheung AK, Rahman M, Reboussin DM, et al. Effects of Intensive BP Control in CKD. J Am Soc Nephrol. 2017;28(9):2812–2823. doi:10.1681/asn.2017020148
32. Pálsson R, Patel UD. Cardiovascular complications of diabetic kidney disease. Adv Chronic Kidney Dis. 2014;21(3):273–280. doi:10.1053/j.ackd.2014.03.003
33. Sigrist RMS, Liau J, Kaffas AE, et al. Ultrasound elastography: review of techniques and clinical applications. Theranostics. 2017;7(5):1303–1329. doi:10.7150/thno.18650
 © 2023 The Author(s). This work is published and licensed by Dove Medical Press Limited. The
full terms of this license are available at https://www.dovepress.com/terms
and incorporate the Creative Commons Attribution
- Non Commercial (unported, 3.0) License.
By accessing the work you hereby accept the Terms. Non-commercial uses of the work are permitted
without any further permission from Dove Medical Press Limited, provided the work is properly
attributed. For permission for commercial use of this work, please see paragraphs 4.2 and 5 of our Terms.
© 2023 The Author(s). This work is published and licensed by Dove Medical Press Limited. The
full terms of this license are available at https://www.dovepress.com/terms
and incorporate the Creative Commons Attribution
- Non Commercial (unported, 3.0) License.
By accessing the work you hereby accept the Terms. Non-commercial uses of the work are permitted
without any further permission from Dove Medical Press Limited, provided the work is properly
attributed. For permission for commercial use of this work, please see paragraphs 4.2 and 5 of our Terms.
Recommended articles
A Predictive Clinical-Radiomics Nomogram for Differentiating Tuberculous Spondylitis from Pyogenic Spondylitis Using CT and Clinical Risk Factors
Wu S, Wei Y, Li H, Zhou C, Chen T, Zhu J, Liu L, Wu S, Ma F, Ye Z, Deng G, Yao Y, Fan B, Liao S, Huang S, Sun X, Chen L, Guo H, Chen W, Zhan X, Liu C
Infection and Drug Resistance 2022, 15:7327-7338
Published Date: 13 December 2022
Optimized Radiomics Nomogram Based on Automated Breast Ultrasound System: A Potential Tool for Preoperative Prediction of Metastatic Lymph Node Burden in Breast Cancer
Li N, Song C, Huang X, Zhang H, Su J, Yang L, He J, Cui G
Breast Cancer: Targets and Therapy 2023, 15:121-132
Published Date: 5 February 2023
Radiomics Nomogram Model Based on TOF-MRA Images: A New Effective Method for Predicting Microaneurysms
Kong D, Li J, Lv Y, Wang M, Li S, Qian B, Yu Y
International Journal of General Medicine 2023, 16:1091-1100
Published Date: 27 March 2023
Integration of Multimodal Computed Tomography Radiomic Features of Primary Tumors and the Spleen to Predict Early Recurrence in Patients with Postoperative Adjuvant Transarterial Chemoembolization
Chen C, Liu J, Gu Z, Sun Y, Lu W, Liu X, Chen K, Ma T, Zhao S, Zhao H
Journal of Hepatocellular Carcinoma 2023, 10:1295-1308
Published Date: 8 August 2023
Deep-Learning-Based Radiomics to Predict Surgical Risk Factors for Lumbar Disc Herniation in Young Patients: A Multicenter Study
Fan Z, Wu T, Wang Y, Jin Z, Wang T, Liu D
Journal of Multidisciplinary Healthcare 2024, 17:5831-5851
Published Date: 7 December 2024