Back to Journals » Infection and Drug Resistance » Volume 15
A Predictive Clinical-Radiomics Nomogram for Differentiating Tuberculous Spondylitis from Pyogenic Spondylitis Using CT and Clinical Risk Factors
Authors Wu S, Wei Y, Li H, Zhou C, Chen T, Zhu J, Liu L, Wu S, Ma F, Ye Z, Deng G, Yao Y, Fan B, Liao S, Huang S, Sun X, Chen L, Guo H, Chen W, Zhan X ![]() , Liu C
, Liu C ![]()
Received 12 September 2022
Accepted for publication 2 December 2022
Published 13 December 2022 Volume 2022:15 Pages 7327—7338
DOI https://doi.org/10.2147/IDR.S388868
Checked for plagiarism Yes
Review by Single anonymous peer review
Peer reviewer comments 2
Editor who approved publication: Prof. Dr. Héctor Mora-Montes
Shaofeng Wu, Yating Wei, Hao Li, Chenxing Zhou, Tianyou Chen, Jichong Zhu, Lu Liu, Siling Wu, Fengzhi Ma, Zhen Ye, Guobing Deng, Yuanlin Yao, Binguang Fan, Shian Liao, Shengsheng Huang, Xuhua Sun, Liyi Chen, Hao Guo, Wuhua Chen, Xinli Zhan, Chong Liu
Department of Spine and Osteopathy Ward, The First Affiliated Hospital of Guangxi Medical University, Nanning, People’s Republic of China
Correspondence: Chong Liu; Xinli Zhan, Department of Spine and Osteopathy Ward, The First Affiliated Hospital of Guangxi Medical University, Nanning, People’s Republic of China, Email [email protected]; [email protected]
Objective: The study aimed to develop and validate a nomogram model with clinical risk factors and radiomic features for differentiating tuberculous spondylitis (TS) from pyogenic spondylitis (PS).
Methods: A total of 254 patients with TS (n = 141) or PS (n = 113) were randomly divided into training (n = 180) and validation (n = 74) groups. In addition, 43 patients (TS = 22 and PS = 21) were collected to construct a test cohort. t-test analysis, de-redundancy analysis, and minimum absolute shrinkage and selection operator (lasso) algorithm were utilized on the training set to obtain the optimal radiomics features from computed tomography (CT) for constructing the radiomics model and determine the radiomics score (Rad-score). Eight clinical risk predictors were identified to develop the clinical model. Combined with clinical risk predictors and Rad-scores, a nomogram model was constructed using multivariate logistic regression analysis.
Results: A total of 1781 features were extracted, and 12 optimal radiomic features were utilized to construct the radiomic model and determine the Rad-score. The combined clinical radiomics model revealed good discrimination performance in both the training cohort and the validation cohort (AUC = 0.891 and 0.830) and was superior to the clinical (AUC = 0.807 and 0.785) and radiomics (AUC = 0.796 and 0.811) models. The calibration curve and DCA also depicted that the nomogram had better clinical efficacy. The discriminative performance of the model is well validated in the test cohort (AUC=0.877).
Conclusion: The clinical radiomic nomogram could serve as a promising predictive tool for differentiating TS from PS, which could be helpful for clinical decision-making.
Keywords: tuberculous spondylitis, pyogenic spondylitis, computed tomography, radiomics, clinical risk factors, nomogram
Introduction
Tuberculous spondylitis (TS) is one of the most severe and common extrapulmonary tuberculosis, affecting about 50% of all bone and joint tuberculosis. With the progress of the disease, the bone is severely damaged, leading to scoliosis, affecting nerve function, and seriously impacting the quality of life of patients.1,2 Early diagnosis and precise treatment of TS can not only prevent the further development of the disease but also prevent the occurrence of spinal deformities and improve the quality of life among patients.3,4 However, the onset of TS is occult. The early clinical manifestations, laboratory examinations, and imaging lack specificity, which can easily be confused with pyogenic spondylitis (PS).5 Especially in recent years, with the abuse of antibiotics and immunosuppressants, PS with atypical clinical symptoms is becoming more common. The differential diagnosis between the two becomes difficult.6 Due to the significant differences in treatment options for different diseases, a safe, rapid, and accurate diagnosis method without invasive intervention will help the clinic take further measures to intervene in the treatment.7,8
Bacterial culture is the gold standard for differentiating TS from PS, but it has many limitations. First, it requires a long time for bacterial culture.9 Second, excessive utilization of antibiotics before tissue sampling or incorrect tissue sampling could lead to a low positive rate.10,11 Computed tomography (CT) is an important imaging technique for identifying and diagnosing orthopedic diseases.12 Studies have found that CT scan is of great significance in the differential diagnosis of TS and PS, particularly in depicting vertebral bone destruction.13
For a long time, imaging scientists have extracted subjective and semi-quantitative information from images. In addition to displaying conventional descriptive signs, images include extensive and deeply excavated digital information.14,15 Radiomics is an emerging quantitative imaging method enabling high-throughput extraction of quantitative and characteristic information regarding regions of interest (ROI) among medical images.16 Currently, studies have demonstrated the potential of radiomics during the differential diagnosis of spinal diseases, including spinal tumors, spinal fractures, and osteoporosis.17–19 Combining the radiomics and clinical factors can improve disease diagnosis accuracy.20 However, there have been no reports of imaging biomarkers that could distinguish TS from PS depending on radiomics approaches.
Therefore, this study attempted to investigate the radiomics features obtained from CT to identify TS and PS and to develop and validate a combined clinical radiomics nomogram model for identifying TS and PS.
Materials and Methods
Patients
We reviewed the patients who underwent surgery from the First Affiliated Hospital of Guangxi Medical University for TS or PS between January 2015 and September 2022. The inclusion criteria were1 Patients diagnosed with TS or PS by pathological examination after an operation.2 CT examination and complete clinical data of patients who underwent before operation. The exclusion criteria were1 The postoperative pathological diagnosis was unclear.2 It was combined with tumors or other immune-related diseases.3 The imaging data was incomplete, or the image was unclear.4 Incomplete clinical information. Simultaneously, the electronic medical record system collected indicators, including age, gender, C-reactive protein (CRP), erythrocyte sedimentation rate (ESR), white blood cells (WBC), red blood cells (RBC), hemoglobin (HGB), platelets (PLT), neutrophil count (NEU), lymphocyte count (LYM), monocyte count (MONO), eosinophil count (EOS), Basophil count (BASO), mean red blood cell volume (MCV), mean RBC hemoglobin content (MCH), mean RBC hemoglobin concentration (MCHC), RBC volume distribution width CV (RDWCV), mean platelet volume (MPV), plateletcrit (PCT), platelet volume distribution width (PDW), hematocrit (HCT), monocyte-to-lymphocyte ratio (MLR), platelets -to- monocyte ratio (PMR), platelets -to- lymphocyte ratio (PLR), neutrophil -to- lymphocyte ratio (NLR), and platelets -to- neutrophil ratio (PNR). Finally, 254 patients diagnosed with TS (n = 141) or PS (n = 113) were included in this study. Patients were randomly divided into the training and validation cohorts at a ratio of 7:3. In addition, 43 patients (TS = 22 and PS = 21) were recruited to the test cohort (Figure 1). The Ethics Committee of the First Affiliated Hospital of Guangxi Medical University approved this study. The study complies with the Declaration of Helsinki.
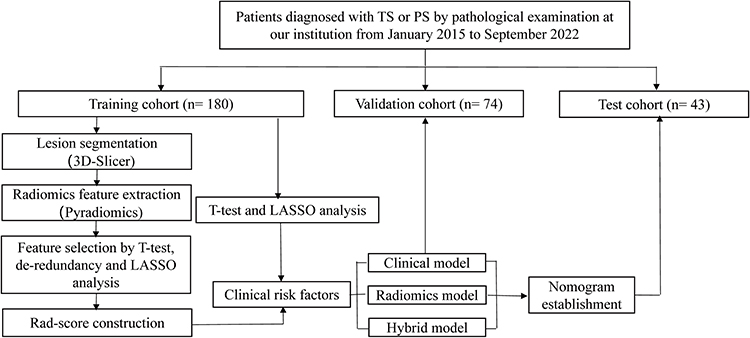 |
Figure 1 The workflow of this study. Abbreviations: TS, Tuberculous spondylitis; PS, Pyogenic spondylitis; LASSO, least absolute shrinkage and selection operator. |
Image Acquisition
CT images were extracted from the archiving and communication system (PACS) of the hospital. The CT scans mainly used helical 64-channel CT scanners. CT scan parameters were set: tube voltage 120 kVp or 150 kVp, tube current 200–300 mA, depending on the tube weight, size, and slice thickness 2.0 mm.
Image Segmentation and Radiomics Features Extraction
Two musculoskeletal experts who were unaware of the diagnosis of each patient identified and segmented all the diseased vertebral bodies. They analyzed the diseased vertebral bodies of each patient. If there were any disputes, they would discuss them to obtain a consensus. This process was achieved by semi-automatic segmentation of the images in the vertebral body region through a segmentation threshold by 3D Slicer (version: 5.0.2). Image resampling was performed with the interpolator method, and the feature extraction was performed through the open source pyradiomics Library (version: 3.0). Finally, 1781 radiomics features were obtained and subsequently, the feature distribution was normalized through the Z-score transform.
Establishment of Radiomics Features Model
First, we performed a t-test analysis on all features to determine the differences between the two groups. Subsequently, the redundant features with a correlation coefficient R>0.9 were removed by determining intraclass correlation coefficients. Finally, a radiomics model was constructed with LASSO to select the optimal features. The Rad-score for each patient was calculated based on the weighting coefficients of the components. The Rad-score calculation formula is shown in Supplementary Table S1.
Establishment of the Clinical Model
Similarly, we performed a t-test or chi-square analysis on the collected indicators such as age, gender, ES, CRP, and routine blood tests. Finally, we used LASSO to select the key clinical factor construction from the clinical model.
Establishment of Clinical Radiomics Model
Further, we constructed a clinical radiomics nomogram model combining the Rad-score of each patient with key clinical predictors and evaluated the performance of the combined model. Ultimately, we constructed three models to discriminate between TS and PS: the clinical model, the radiomics model, and the combined clinical radiomics model.
Model Validation and Comparison
The discrimination performance of the three models in differentiating TS and PS in the training and validation cohorts was determined by plotting the receiver operating characteristic (ROC) curve. The accuracy, sensitivity, specificity, positive predictive value (PPV), and negative predictive value (NPV) were calculated. The DeLong test assessed the differences in AUC values between these models. The consistency between the predicted and actual probability was evaluated by plotting the calibration curve. The clinical utility of the nomogram was assessed through decision curve analysis (DCA) to quantify the net benefit of the patients at each threshold probability. The test cohort was used to further validate the discriminative performance of the best model.
Statistical Analysis
SPSS (IBM version 26.0) and R statistical software (version 4.2.1) were utilized for statistical analysis. t-test was used for continuous variables, and the chi-square test or Fisher’s exact test was used for categorical variables. Pearson’s test was used for correlation analysis for normally distributed data, while Spearman’s test was used for non-normally distributed data. The Hosmer-Lemeshow goodness-of-fit test were used to assess model discrimination and calibration. All the continuous variables were expressed as mean ±standard deviation (SD). P < 0.05 was considered a significant statistical difference.
Results
Clinical Characteristics
A total of 254 patients, including 141 TS (55.51%) and 113 PS (44.49%) patients, were divided into training cohort (n=180) and validation cohort (n=74) according to the ratio of 7:3 by computer generated random numbers. No significant difference in clinical factors was found between the two cohorts (P > 0.05) (Supplementary Table S2), which proves that the divided training set and trial set are reasonable.
Clinical Model
After statistical analysis, we found that there were statistically significant differences between the two groups in the clinical factors of age, RBC, HGB, NEU, MONO, EOS, MPV, PCT, PDW, HCT, MLR and PNR (Table 1). We then performed LASSO regression on these parameters using 10-fold cross-validation to select the best λ parameter (Figure 2A and B). Finally, eight critical clinical factors, including age, RBC, HGB, NEU, MONO, HCT, MLR and PNR, were assessed.
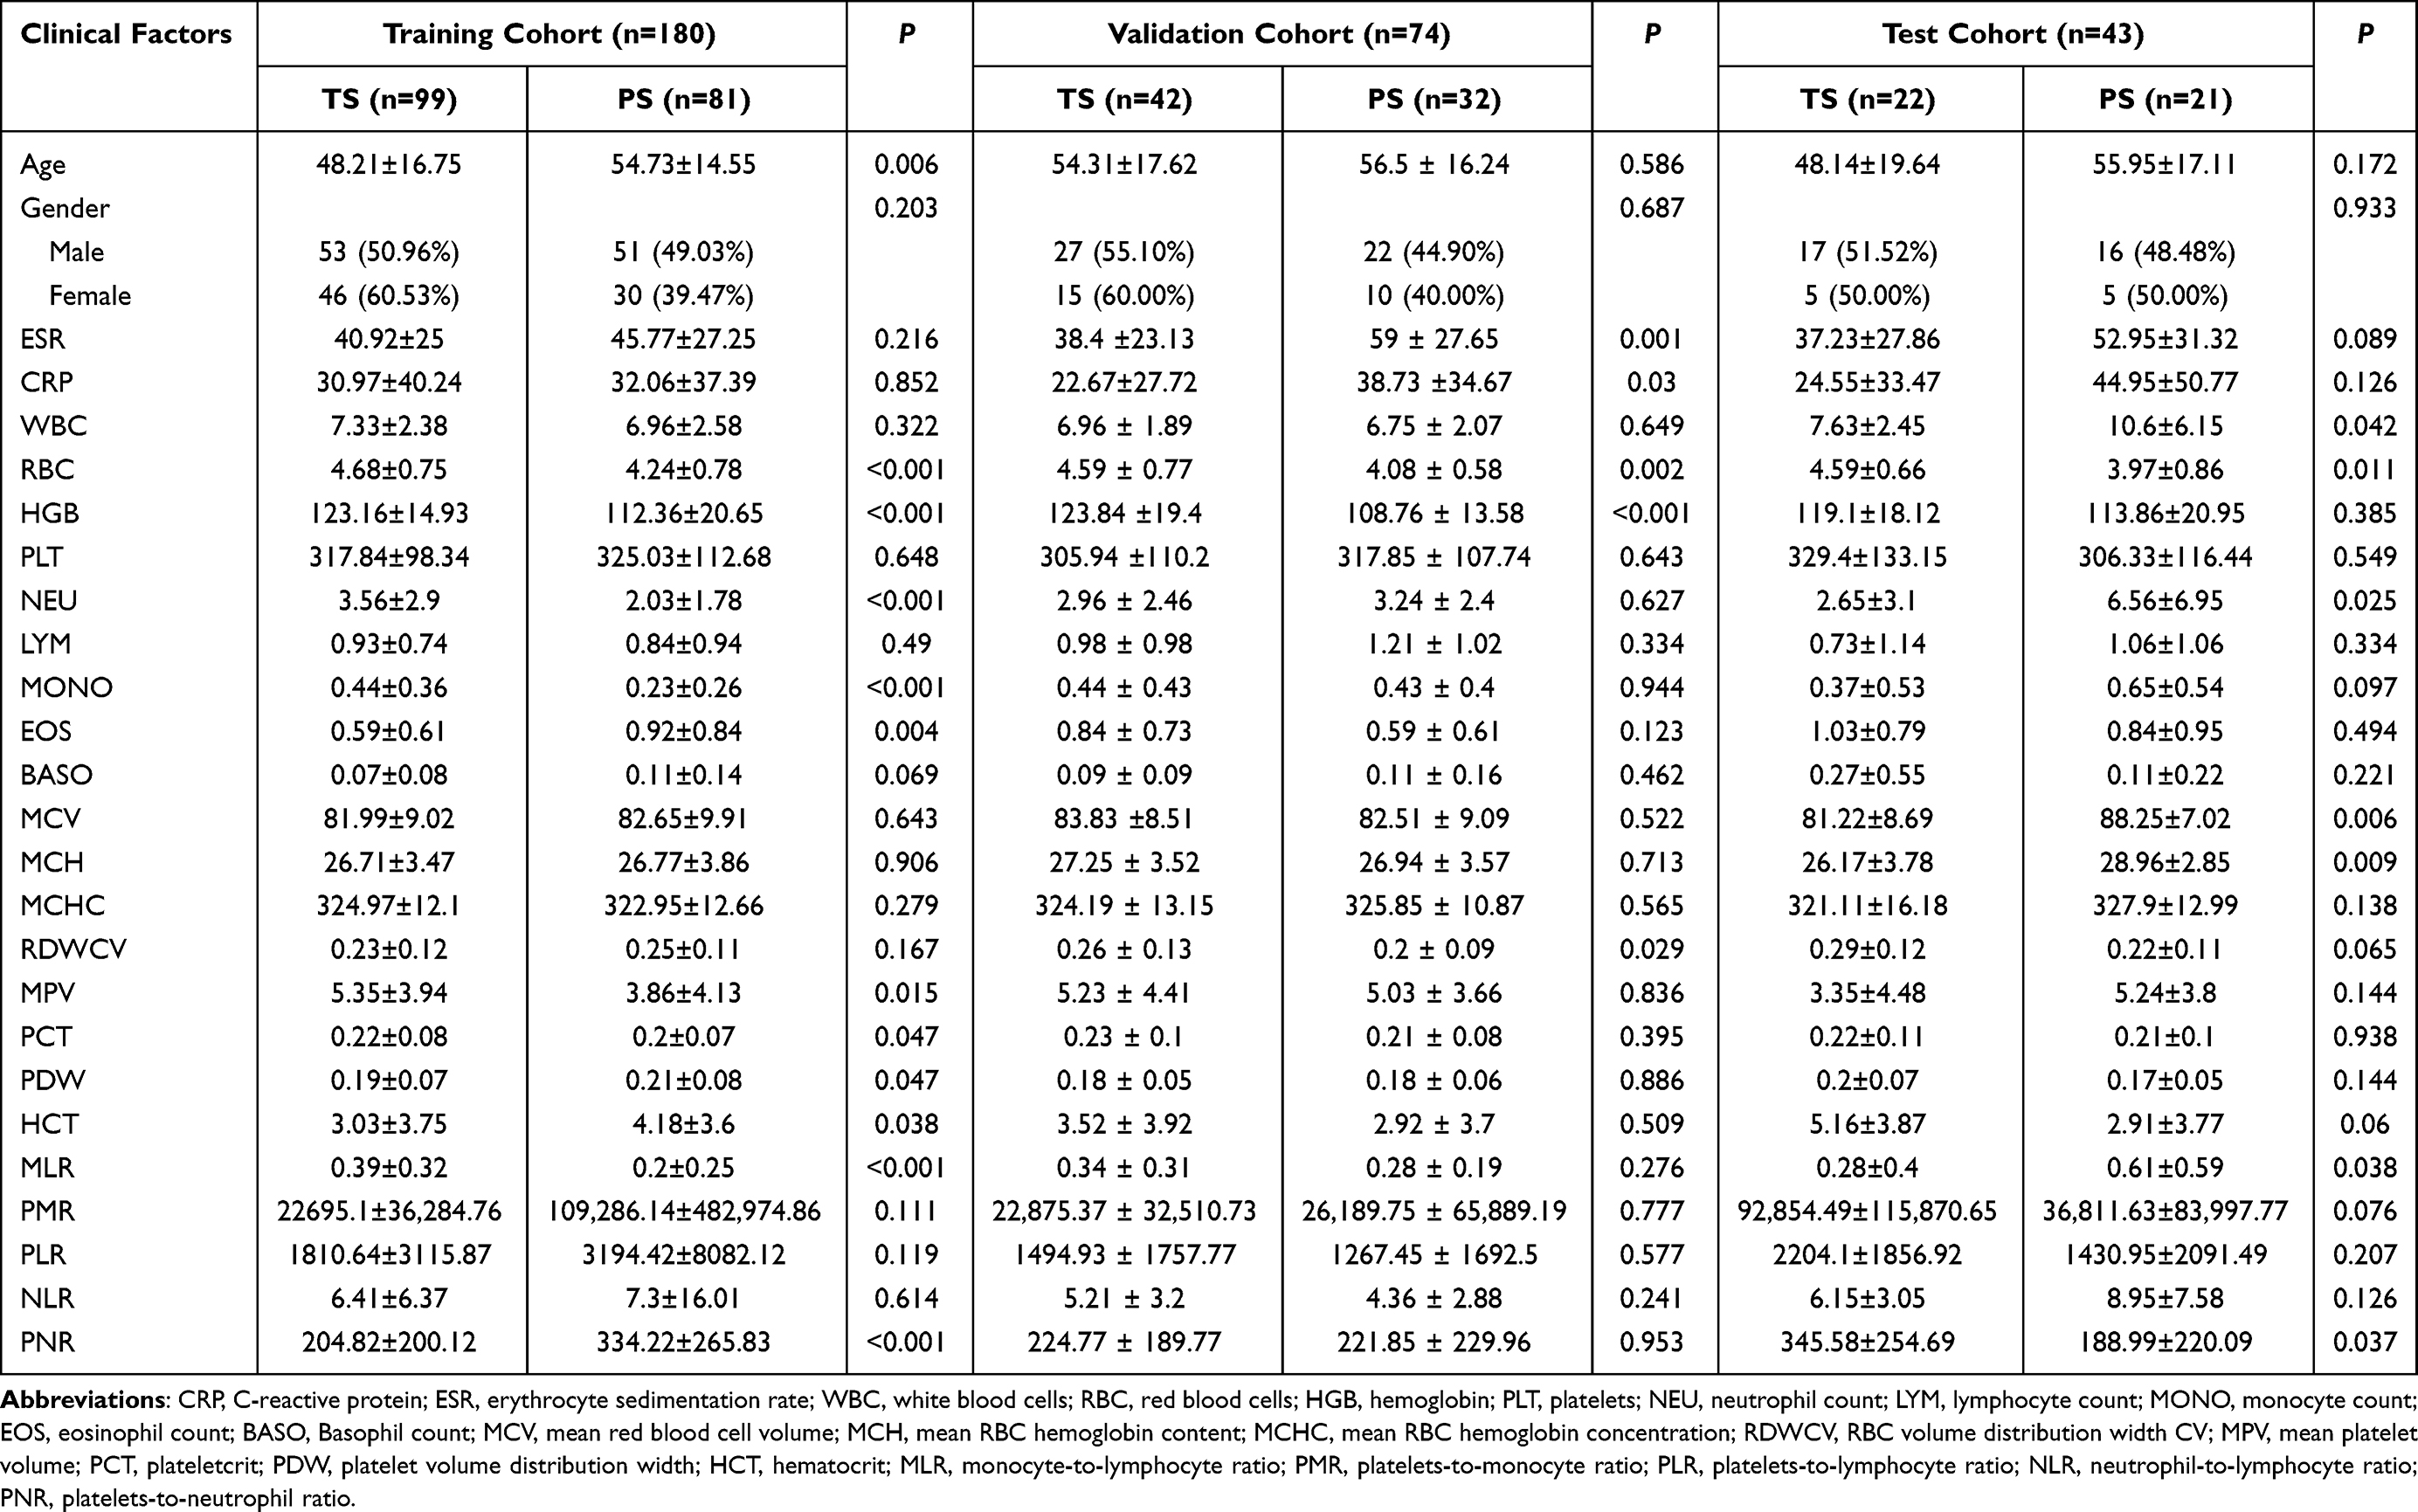 |
Table 1 Comparison of Clinical Data in TS and PS |
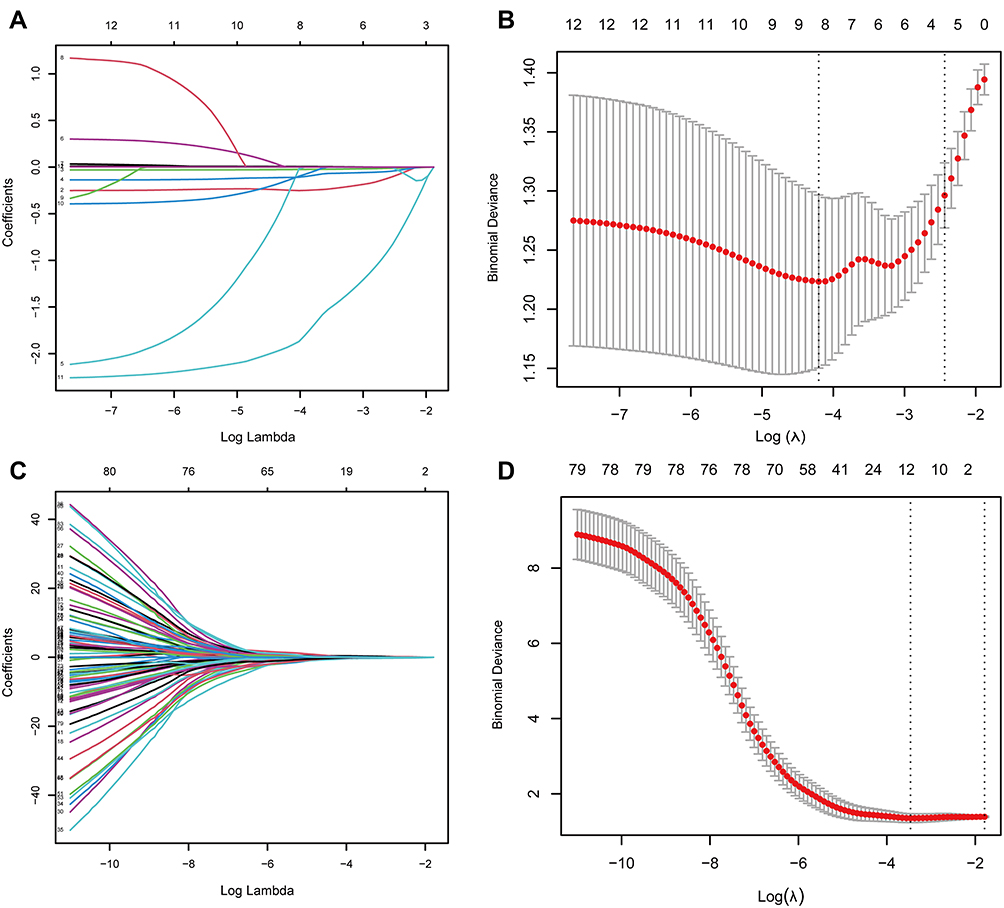 |
Figure 2 Identification of optimal characteristics and clinical risk factors by LASSO. (A) LASSO coefficient profiles of the clinical risk factors. (B) The clinical risk factors were screened out by tuningλusing LASSO via minimum binomial deviation. (C) LASSO coefficient profiles of the radiomics features. (D) The most valuable features were screened out by tuningλusing LASSO via minimum binomial deviation. |
The critical clinical factors were used to construct clinical models. In the training set, the model AUC was 0.807 (95% CI: 0.744–0.869) and the Hosmer–Lemeshow test = 0.382. In the validation set, the model AUC was 0.785 (95% CI: 0.684–0.886) and the Hosmer–Lemeshow test = 0.389.
Radiomics Model
A total of 1781 radiomic features were obtained, 12 optimal radiomic features were identified (Figure 2C and D), and the Rad-score for each patient was determined by summing the weighting coefficients of features (Figure 3). There was a statistically significant difference in Rad-score among the TS and PS groups (P<0.05) (Figure 4).
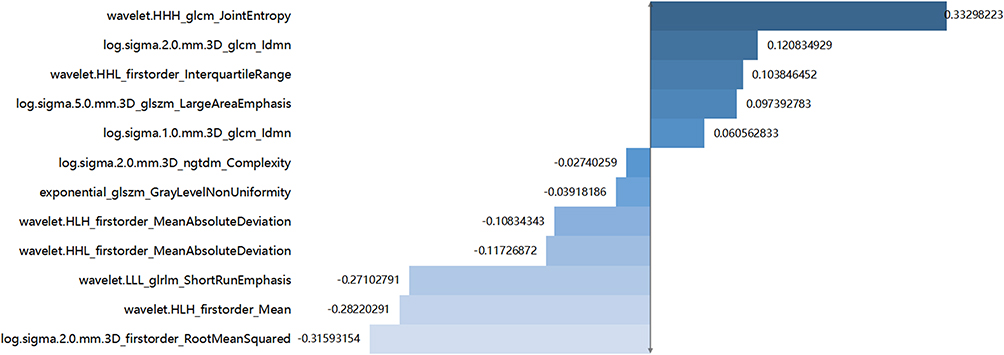 |
Figure 3 The 12 optimal radiomic features chosen for the radiomics model and the LASSO regression coefficient of features. |
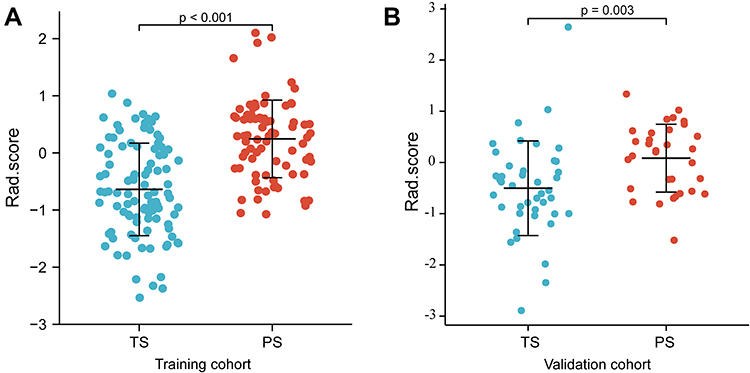 |
Figure 4 Comparative analysis of Rad-scores in TS and PS groups in the training (A) and validation (B) cohort. Abbreviations: TS, tuberculous spondylitis; PS, pyogenic spondylitis; Blue circle, Rad-score of tuberculous spondylitis; Red circle, Rad-score of pyogenic spondylitis. |
The 12 optimal radiomic features were utilized to construct a radiomic model. In the training set, the model AUC was 0.796 (95% CI: 0.732–0.859) and the Hosmer–Lemeshow test = 0.425. In the validation set, the model AUC was 0.811 (95% CI: 0.714–0.908) and the Hosmer–Lemeshow test= 0.329.
The Clinical-Radiomics Nomogram Construction
The age, RBC, HGB, NEU, MONO, HCT, MLR, PNR and Rad-score were utilized to construct the clinical-radiomics nomogram (Figure 5). The AUC of the model in the training set was 0.891 (95% CI:0.845–0.937) and the Hosmer–Lemeshow test = 0.933. The AUC of the model in the validation set was.830 (95% CI:0.740–0.921) and the Hosmer–Lemeshow test = 0.768. (Figure 6). It could be found from the calibration curve that the observed values were very close to the ideal values, indicating good consistency (Figure 7). Through DCA, we identified that the clinical radiology model revealed more significant benefits than the simple clinical model or the radiomics model, suggesting that it has excellent clinical utility (Figure 8).
 |
Figure 5 The predictive clinical-radiomics nomogram for differentiating TS from PS. Abbreviations: PNR, platelets-to-neutrophil ratio; MLR, monocyte-to-lymphocyte ratio; HCT, hematocrit; MONO, monocyte count; NEU, neutrophil count; HGB, hemoglobin; RBC, red blood cells. |
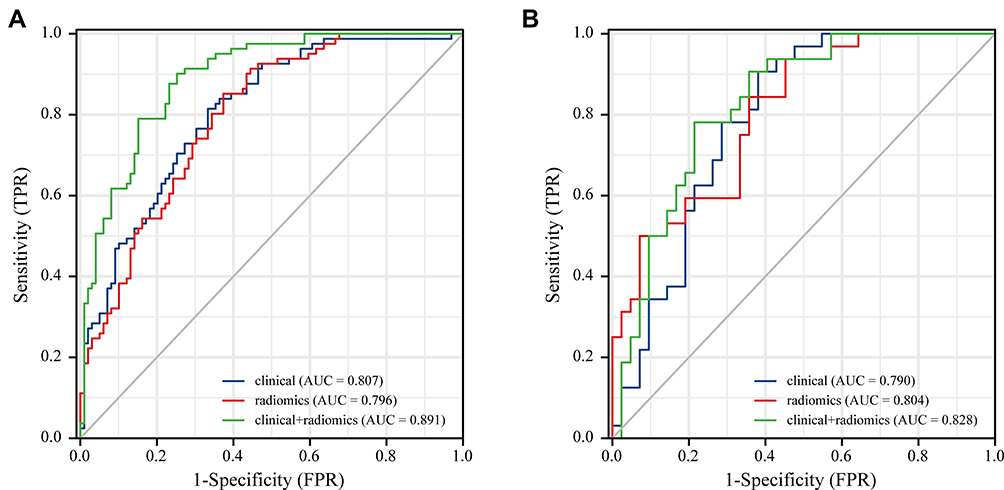 |
Figure 6 ROC curves of the clinical, radiomics, and combined models in the training (A) and validation (B) cohort. Abbreviations: AUC, area under the receiver operator characteristic curve; ROC, receiver operator characteristic. |
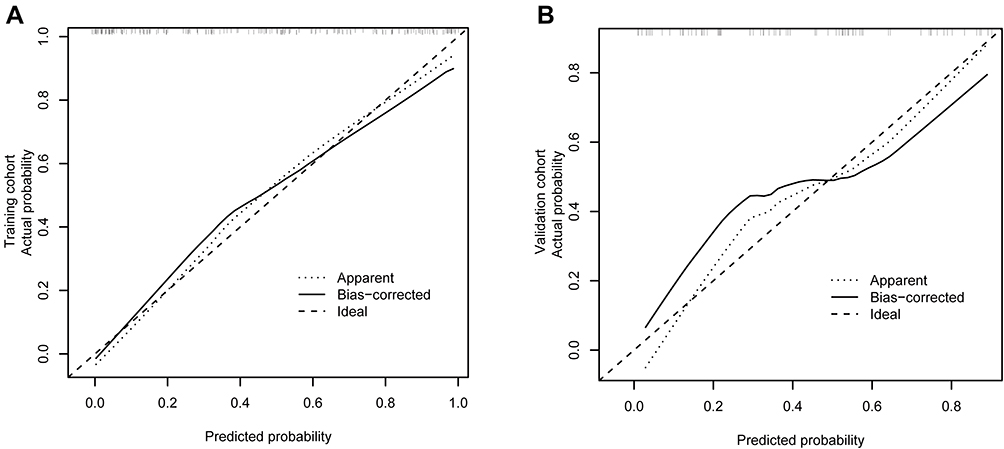 |
Figure 7 The clinical-radiomics nomogram calibration curve in the training (A) and validation (B) cohort. |
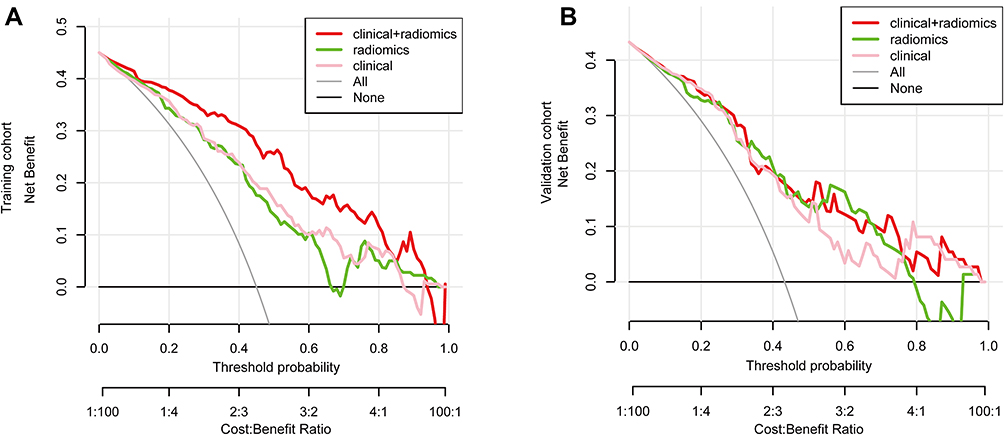 |
Figure 8 The decision curve analysis for the clinical, radiomic, and combined models in the training (A) and validation (B) cohort. The y-axis indicates the net benefit; the x-axis indicates threshold probability. |
Model Validation and Comparison
Through the DeLong test and comparative analysis of the AUC among the three models, it was identified that the radiomics and the clinical models had similar discrimination and prediction efficiency in both the training (0.796 vs 0.807, P > 0.05) and the validation (0.804 vs 0.790, P > 0.05) sets (Supplementary Table S3).
In the training cohort, the discrimination and prediction efficiency of the clinical radiomics nomogram model was significantly better than the radiomics and clinical (0.891 vs 0.796 and 0.807, P < 0.05) models. In addition, accuracy, sensitivity, specificity, PPV, NPV, and Youden’s index were better than other models. In the validation cohort, the clinical radiomics nomogram model revealed better performance than the radiomics or clinical feature model in terms of accuracy, specificity, NPV, and Youden’s index. However, its AUC value was not significantly better than other models (0.830 vs 0.811 and 0.785, P > 0.05) (Table 2). Therefore, by combining radiomics and clinical factors, a comprehensive model could better distinguish TS and PS (Figure 9). The discriminative performance of the clinical radiomics nomogram model was also validated for the test cohort (Figure 10).
 |
Table 2 Diagnostic Performance of Each Model in the Training and Validation Cohorts |
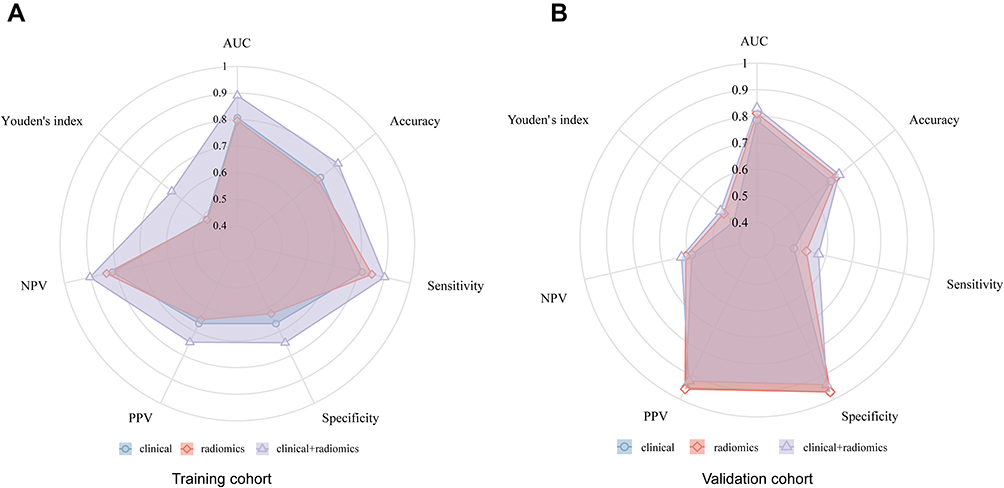 |
Figure 9 The radar chart shows the diagnostic performance of clinical, radiomic, and combined models in the training (A) and validation (B) cohort. Abbreviations: AUC, area under the receiver operator characteristic curve; CI, confidence interval; PPV, Positive predictive value; NPV, Negative predictive value. |
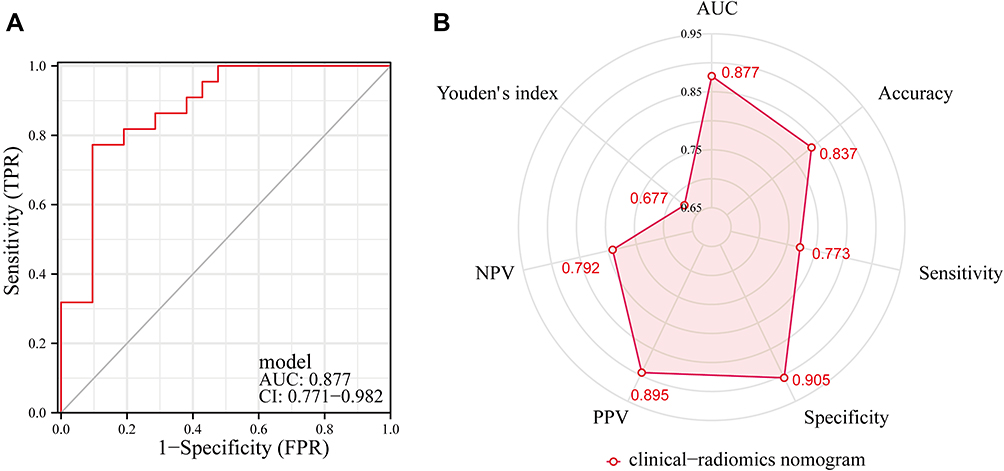 |
Figure 10 The discriminative performance of the clinical-radiomics nomogram model in the test cohort. (A) The ROC curve of the clinical-radiomics nomogram model in the test cohort. (B) The radar chart shows the diagnostic performance of the clinical-radiomics nomogram model in the test cohort. Abbreviations: AUC, area under the receiver operator characteristic curve; CI, confidence interval; PPV, Positive predictive value; NPV, Negative predictive value. |
Discussion
The correct diagnosis of TS and PS is directly associated with the treatment and prognosis of patients. Timely and accurate treatment can reduce the disability rate and damage to bodily function and enhance the quality of life of patients.21 In this study, we developed and validated a predictive model for distinguishing TS from PS based on the radiomics features of CT. The model combines clinical risk factors and radiomics elements and has better predictive value than the radiomics and clinical models in training and validation cohorts.
In recent decades, traditional imaging techniques such as magnetic resonance imaging (MRI) and computed tomography (CT) have an increasingly important role in revealing changes among spinal infection patients with the advancement of medical imaging technology.22–24 Although MRI has high sensitivity and specificity for showing inflammatory edema,25 it has specific implications for the differential diagnosis of spinal infections.26,27 However, MRI is insufficient in depicting vertebral and bone destruction morphology. In contrast, CT has a unique advantage in delivering skeletal changes.13,28 A previous study identified the significant benefits of CT in differentiating purulent spondylitis from Brucella spondylitis and indicated that CT could compensate for MRI deficiencies.29 Liu et al described bone destruction and formation depending on CT images and constructed a simple diagnostic model, which can distinguish TS and PS and clinically differentiates PS and TS.30 However, the above studies are based on the visual interpretation of images, and the ability to identify small lesions is limited. Simultaneously, radiomics methods can extract texture features that the naked eye cannot recognize for quantitative analysis. Therefore, in this study, we extracted the radiomics features of the diseased vertebral body depending on CT and evaluated its role in differentiating TS from PS.
As a relatively new technology, radiomics has become a novel method for quantifying various data in imaging images and assisting diagnosis and disease treatment31 and has been widely utilized in the diagnosis and differential diagnosis of spinal diseases. Chee et al obtained 14 radiomics features from CT images of patients having benign and malignant vertebral fractures. They constructed a prediction model for the malignant degree of vertebral compression fracture. The results indicated that the ACC of malignant vertebral fracture within the low-risk and the high-risk groups in the training and the test groups was 98.2% and 90.9%, respectively. It was revealed that radiomics has a significant differential ability in predicting benign and malignant compression fractures within vertebral bodies.32
Recent studies have depicted that combining radiomics signatures with clinical factors indicates excellent potential in the diagnosis and prognosis of the disease.33,34 Routine blood tests have a significant role in diagnosing diseases and observing the curative effect and prognosis and are a commonly used clinical examination method. NEU, LYM, and MONO are common infection indicators and systemic inflammation inside the body.35 Chen et al analyzed the blood tests of 496 spinal tuberculosis cases and 504 non-spinal tuberculosis cases, totaling 1000 patients. They found that age, PLR, MLR, and monocyte percentage had good diagnostic values for spinal tuberculosis. They believed that MLR might predict active spinal tuberculosis and be associated with TS severity.36 Liu et al also found that NEU, MONO, PLR, and other indicators can differentiate TS from PS.37 In this study, we also analyzed the blood test results of patients with TS and PS. We constructed a clinical model to evaluate their ability to discriminate between TS and PS. After comparative analysis, single radiomics and clinical models can better distinguish TS and PS, and the efficacy is equivalent. We also found that the clinical radiomics model had the highest AUC in ROC and the most significant net gain in most threshold probabilities for DCA, indicating that the combined model showed the best discriminative power and was validated for the test cohort.
However, the current study has several limitations: First, this is a single-center, retrospective study with few samples and may have inevitable selection bias. In the future, we must increase the sample size and conduct a multicenter, prospective study for validation. Second, manual ROI segmentation is time-consuming and complex, and the potential subjectivity in the manual segmentation process could hinder the reproducibility of results, demanding automatic segmentation techniques having good reliability and repeatability.
Conclusion
By combining CT-based radiomic features and vital clinical factors, a non-invasive clinical radiomics nomogram model was constructed and validated, which has good accuracy for identifying TS and PS and could be helpful in precision medicine and enhancing medical decision support.
Data Sharing Statement
The original contributions presented in the study are included in the article/Supplementary Materials. Further inquiries can be directed to the corresponding author.
Ethics Approval and Consent to Participate
This study was approved by The Ethics Committee of the First Affiliated Hospital of Guangxi Medical University. Informed consent was obtained from all participants and/or their legal guardians. The study complies with the Declaration of Helsinki.
Acknowledgment
We are grateful to Dr. Xinli Zhan (Spine and Osteopathy Ward, The First Affiliated Hospital of Guangxi Medical University) for his kindly assistance in all stages of the present study. Dr. Chong Liu and Dr. Xinli Zhan are the co-corresponding authors for this study.
Author Contributions
All authors made a significant contribution to the work reported, whether that is in the conception, study design, execution, acquisition of data, analysis and interpretation, or in all these areas; took part in drafting, revising or critically reviewing the article; gave final approval of the version to be published; have agreed on the journal to which the article has been submitted; and agree to be accountable for all aspects of the work.
Funding
This work was supported by grants from the National Natural Science Foundation of China (81560359 and 81860393).
Disclosure
The authors declare no conflicts of interest in this work.
References
1. Garcia-Rodriguez JF, Alvarez-Diaz H, Lorenzo-Garcia MV, Marino-Callejo A, Fernandez-Rial A, Sesma-Sanchez P. Extrapulmonary tuberculosis: epidemiology and risk factors. Enferm Infecc Microbiol Clin. 2011;29(7):502–509. doi:10.1016/j.eimc.2011.03.005
2. Khanna K, Sabharwal S. Spinal tuberculosis: a comprehensive review for the modern spine surgeon. Spine J. 2019;19(11):1858–1870. doi:10.1016/j.spinee.2019.05.002
3. Weiner J
4. Garg RK, Raut T, Malhotra HS, et al. Evaluation of prognostic factors in medically treated patients of spinal tuberculosis. Rheumatol Int. 2013;33(12):3009–3015. doi:10.1007/s00296-013-2841-x
5. Garg RK, Malhotra HS, Kumar N. Spinal tuberculosis: still a great mimic. Neurol India. 2019;67(6):1402–1404. doi:10.4103/0028-3886.273618
6. Aizawa T, Ozawa H, Koakutsu T, et al. Atypical findings on magnetic resonance imaging in the patients with active pyogenic spondylitis in Japanese university hospitals. Tohoku J Exp Med. 2013;231(1):13–19. doi:10.1620/tjem.231.13
7. Tali ET, Oner AY, Koc AM. Pyogenic spinal infections. Neuroimaging Clin N Am. 2015;25(2):193–208. doi:10.1016/j.nic.2015.01.003
8. Babic M, Simpfendorfer CS. Infections of the spine. Infect Dis Clin North Am. 2017;31(2):279–297. doi:10.1016/j.idc.2017.01.003
9. Colman RE, Anderson J, Lemmer D, et al. Rapid drug susceptibility testing of drug-resistant mycobacterium tuberculosis isolates directly from clinical samples by use of amplicon sequencing: a proof-of-concept study. J Clin Microbiol. 2016;54(8):2058–2067. doi:10.1128/JCM.00535-16
10. Sheikh AF, Khosravi AD, Goodarzi H, et al. Pathogen identification in suspected cases of pyogenic spondylodiscitis. Front Cell Infect Microbiol. 2017;7:60. doi:10.3389/fcimb.2017.00060
11. Jeong SJ, Choi SW, Youm JY, Kim HW, Ha HG, Yi JS. Microbiology and epidemiology of infectious spinal disease. J Korean Neurosurg Soc. 2014;56(1):21–27. doi:10.3340/jkns.2014.56.1.21
12. Ibad HA, de Cesar Netto C, Shakoor D, et al. Computed tomography: state-of-The-art advancements in musculoskeletal imaging. Invest Radiol. 2022. doi:10.1097/RLI.0000000000000908
13. Berg L, Thoresen H, Neckelmann G, Furunes H, Hellum C, Espeland A. Facet arthropathy evaluation: CT or MRI? Eur Radiol. 2019;29(9):4990–4998. doi:10.1007/s00330-019-06047-5
14. Shiiba T, Takano K, Takaki A, Suwazono S. Dopamine transporter single-photon emission computed tomography-derived radiomics signature for detecting Parkinson’s disease. EJNMMI Res. 2022;12(1):39. doi:10.1186/s13550-022-00910-1
15. Wang Y, Zhou M, Ding Y, et al. Development and comparison of multimodal models for preoperative prediction of outcomes after endovascular aneurysm repair. Front Cardiovasc Med. 2022;9:870132. doi:10.3389/fcvm.2022.870132
16. Lambin P, Rios-Velazquez E, Leijenaar R, et al. Radiomics: extracting more information from medical images using advanced feature analysis. Eur J Cancer. 2012;48(4):441–446. doi:10.1016/j.ejca.2011.11.036
17. Naseri H, Skamene S, Tolba M, et al. Radiomics-based machine learning models to distinguish between metastatic and healthy bone using lesion-center-based geometric regions of interest. Sci Rep. 2022;12(1):9866. doi:10.1038/s41598-022-13379-8
18. Kim AY, Yoon MA, Ham SJ, et al. Prediction of the acuity of vertebral compression fractures on CT using radiologic and radiomic features. Acad Radiol. 2022;29:1512–1520. doi:10.1016/j.acra.2021.12.008
19. Jiang YW, Xu XJ, Wang R, Chen CM. Radiomics analysis based on lumbar spine CT to detect osteoporosis. Eur Radiol. 2022;32:8019–8026. doi:10.1007/s00330-022-08805-4
20. Ye L, Miao S, Xiao Q, et al. A predictive clinical-radiomics nomogram for diagnosing of axial spondyloarthritis using MRI and clinical risk factors. Rheumatology. 2022;61(4):1440–1447. doi:10.1093/rheumatology/keab542
21. Wang B, Gao W, Hao D. Current study of the detection and treatment targets of spinal tuberculosis. Curr Drug Targets. 2020;21(4):320–327. doi:10.2174/1389450120666191002151637
22. Liu X, Rui M, Lyu L. Tuberculous meningomyelitis in magnetic resonance imaging: a Chinese case report. Eur J Radiol Open. 2019;6:284–286. doi:10.1016/j.ejro.2019.02.006
23. Li T, Li W, Du Y, et al. Discrimination of pyogenic spondylitis from brucellar spondylitis on MRI. Medicine. 2018;97(26):e11195. doi:10.1097/MD.0000000000011195
24. Raghavan M, Lazzeri E, Palestro CJ. Imaging of spondylodiscitis. Semin Nucl Med. 2018;48(2):131–147. doi:10.1053/j.semnuclmed.2017.11.001
25. Kumaran SP, Thippeswamy PB, Reddy BN, Neelakantan S, Viswamitra S. An institutional review of tuberculosis spine mimics on MR imaging: cases of mistaken identity. Neurol India. 2019;67(6):1408–1418. doi:10.4103/0028-3886.273630
26. Gao M, Sun J, Jiang Z, et al. Comparison of tuberculous and brucellar spondylitis on magnetic resonance images. Spine. 2017;42(2):113–121. doi:10.1097/BRS.0000000000001697
27. Zhang N, Zeng X, He L, et al. The value of MR imaging in comparative analysis of spinal infection in adults: pyogenic versus tuberculous. World Neurosurg. 2019;128:e806–e813. doi:10.1016/j.wneu.2019.04.260
28. Muehlematter UJ, Mannil M, Becker AS, et al. Vertebral body insufficiency fractures: detection of vertebrae at risk on standard CT images using texture analysis and machine learning. Eur Radiol. 2019;29(5):2207–2217. doi:10.1007/s00330-018-5846-8
29. Liu X, Zheng M, Jiang Z, et al. Computed tomography imaging characteristics help to differentiate pyogenic spondylitis from brucellar spondylitis. Eur Spine J. 2020;29(7):1490–1498. doi:10.1007/s00586-019-06214-8
30. Liu X, Zheng M, Sun J, Cui X. A diagnostic model for differentiating tuberculous spondylitis from pyogenic spondylitis on computed tomography images. Eur Radiol. 2021;31(10):7626–7636. doi:10.1007/s00330-021-07812-1
31. Tharmaseelan H, Hertel A, Rennebaum S, et al. The potential and emerging role of quantitative imaging biomarkers for cancer characterization. Cancers. 2022;14(14):3349. doi:10.3390/cancers14143349
32. Chee CG, Yoon MA, Kim KW, et al. Combined radiomics-clinical model to predict malignancy of vertebral compression fractures on CT. Eur Radiol. 2021;31(9):6825–6834. doi:10.1007/s00330-021-07832-x
33. Huang W, Li L, Liu S, et al. Enhanced CT-based radiomics predicts pathological complete response after neoadjuvant chemotherapy for advanced adenocarcinoma of the esophagogastric junction: a two-center study. Insights Imaging. 2022;13(1):134. doi:10.1186/s13244-022-01273-w
34. Tong H, Sun J, Fang J, et al. A machine learning model based on PET/CT radiomics and clinical characteristics predicts tumor immune profiles in non-small cell lung cancer: a retrospective multicohort study. Front Immunol. 2022;13:859323. doi:10.3389/fimmu.2022.859323
35. Honda T, Uehara T, Matsumoto G, Arai S, Sugano M. Neutrophil left shift and white blood cell count as markers of bacterial infection. Clin Chim Acta. 2016;457:46–53. doi:10.1016/j.cca.2016.03.017
36. Chen L, Liu C, Liang T, et al. Monocyte-to-lymphocyte ratio was an independent factor of the severity of spinal tuberculosis. Oxid Med Cell Longev. 2022;2022:7340330. doi:10.1155/2022/7340330
37. Liu H, Li Y, Yi J, Zhou W, Zhao S, Yin G. Neutrophil-lymphocyte ratio as a potential marker for differential diagnosis between spinal tuberculosis and pyogenic spinal infection. J Orthop Surg Res. 2022;17(1):357. doi:10.1186/s13018-022-03250-x
 © 2022 The Author(s). This work is published and licensed by Dove Medical Press Limited. The
full terms of this license are available at https://www.dovepress.com/terms
and incorporate the Creative Commons Attribution
- Non Commercial (unported, 3.0) License.
By accessing the work you hereby accept the Terms. Non-commercial uses of the work are permitted
without any further permission from Dove Medical Press Limited, provided the work is properly
attributed. For permission for commercial use of this work, please see paragraphs 4.2 and 5 of our Terms.
© 2022 The Author(s). This work is published and licensed by Dove Medical Press Limited. The
full terms of this license are available at https://www.dovepress.com/terms
and incorporate the Creative Commons Attribution
- Non Commercial (unported, 3.0) License.
By accessing the work you hereby accept the Terms. Non-commercial uses of the work are permitted
without any further permission from Dove Medical Press Limited, provided the work is properly
attributed. For permission for commercial use of this work, please see paragraphs 4.2 and 5 of our Terms.
Recommended articles
Development and Validation of a Comprehensive Model for Predicting Distant Metastasis of Solid Lung Adenocarcinoma: 3D Radiomics, 2D Radiomics and Clinical Features
Peng Z, Lin Z, He A, Yi L, Jin M, Chen Z, Tao Y, Yang Y, Cui C, Liu Y, Zuo M
Cancer Management and Research 2022, 14:3437-3448
Published Date: 13 December 2022
Optimized Radiomics Nomogram Based on Automated Breast Ultrasound System: A Potential Tool for Preoperative Prediction of Metastatic Lymph Node Burden in Breast Cancer
Li N, Song C, Huang X, Zhang H, Su J, Yang L, He J, Cui G
Breast Cancer: Targets and Therapy 2023, 15:121-132
Published Date: 5 February 2023
Radiomics Nomogram Model Based on TOF-MRA Images: A New Effective Method for Predicting Microaneurysms
Kong D, Li J, Lv Y, Wang M, Li S, Qian B, Yu Y
International Journal of General Medicine 2023, 16:1091-1100
Published Date: 27 March 2023
Integration of Multimodal Computed Tomography Radiomic Features of Primary Tumors and the Spleen to Predict Early Recurrence in Patients with Postoperative Adjuvant Transarterial Chemoembolization
Chen C, Liu J, Gu Z, Sun Y, Lu W, Liu X, Chen K, Ma T, Zhao S, Zhao H
Journal of Hepatocellular Carcinoma 2023, 10:1295-1308
Published Date: 8 August 2023
Assessing Invasiveness of Ground-Glass Nodules Using Ternary-Class CT Radiomics Models: A Multi-Center Study with SHAP Explanations
Zhao P, Chen H, Gu H, Lin Y, Ma Y
Cancer Management and Research 2026, 18:602730
Published Date: 5 June 2026