
Back to Journals » International Journal of Women's Health » Volume 18
A Risk Prediction Model for Progression-Free Survival in Endometrial Cancer Integrating Clinicopathological Variables and Routine Laboratory Indicators
Authors Liang S, Lu X, Du W, Wei M, Sun J, Jing L
Received 15 April 2026
Accepted for publication 7 July 2026
Published 17 July 2026 Volume 2026:18 617159
DOI https://doi.org/10.2147/IJWH.S617159
Checked for plagiarism Yes
Review by Single anonymous peer review
Peer reviewer comments 2
Editor who approved publication: Dr Matteo Frigerio
Sheng Liang, Xiaoyuan Lu, Wensheng Du, Min Wei, Jieyun Sun, Li Jing
Department of Obstetrics and Gynecology, Affiliated Hospital of Xuzhou Medical University, Xuzhou, 221000, People’s Republic of China
Correspondence: Li Jing, Department of Obstetrics and Gynecology, Affiliated Hospital of Xuzhou Medical University, No. 99, Huaihai West Road, Quanshan District, Xuzhou, Jiangsu, 221000, People’s Republic of China, Email [email protected]
Aim: To develop and validate a prediction model for progression-free survival (PFS) in endometrial cancer (EC) using routine clinicopathological and preoperative laboratory data, and assess the incremental prognostic value of inflammatory, nutritional, and tumor markers.
Methods: This single-center retrospective cohort study included 282 EC patients receiving initial treatment. Clinicopathological data and laboratory results from within 7 days pre-surgery were extracted. PFS was the primary endpoint. Kaplan–Meier and Cox regression analyses were used to identify independent prognostic factors for model construction. Internal validation was performed via bootstrapping. Model performance was evaluated using the corrected C-index, time-dependent ROC curves, calibration plots, and decision curve analysis (DCA).
Results: During follow-up, 76 PFS events occurred. Compared to the non-event group, patients with events had more advanced FIGO stages, a higher proportion of non-endometrioid histology, and more pronounced inflammatory and hypercoagulable states. Multivariate analysis identified FIGO stage III–IV (HR = 1.95, P = 0.008), non-endometrioid histology (HR = 1.95, P = 0.006), neutrophil-to-lymphocyte ratio (NLR) (HR = 1.15, P = 0.021), and log-transformed cancer antigen 125 (CA125) (HR = 1.79, P = 0.003) as independent predictors. The model showed good discrimination for 3-year PFS (AUC = 0.792), satisfactory calibration, and a positive net benefit on DCA across relevant clinical thresholds.
Conclusion: This prediction model based on readily available clinicopathological and laboratory indicators demonstrated good internal performance for PFS risk stratification in endometrial cancer; however, external validation is required before broader clinical application. NLR and CA125 provide incremental prognostic value beyond traditional staging and pathology, which may aid in personalizing postoperative management.
Keywords: endometrial carcinoma, PFS risk stratification, inflammatory markers, neutrophil-to-lymphocyte ratio, CA125, prediction model
Introduction
Endometrial cancer (EC) is one of the most common gynecological malignancies in developed countries. Although most patients are diagnosed at an early stage and have favorable outcomes following surgery, a significant proportion experience recurrence/progression during follow-up, with notably poorer PFS risk stratification for those with advanced-stage or high-risk subtypes. Recent European Society for Gynaecological Oncology/European Society for Radiotherapy and Oncology/European Society of Pathology (ESGO/ESTRO/ESP) guidelines integrate molecular classification with traditional clinicopathological features for risk stratification to optimize adjuvant treatment and follow-up strategies.1 However, current risk stratification systems still face limitations in real-world applicability, particularly in guiding individualized postoperative surveillance and adjuvant treatment intensity. And, in real-world settings, disparities in the accessibility, cost, and standardization of molecular testing create a gap between guideline recommendations and clinical implementation.2 Therefore, developing a prognostic tool based on routinely available information, balancing discriminative power and interpretability, retains clear clinical value.
Beyond classic prognostic factors like International Federation of Gynecology and Obstetrics (FIGO) stage, histologic type/grade, and lymphovascular space invasion (LVSI), systemic inflammatory response, nutritional status, and coagulation activation that interact with the tumor microenvironment are implicated in tumor invasion, immune evasion, and metastatic potential. Evidence linking inflammatory indices such as the neutrophil-to-lymphocyte ratio (NLR) and platelet-to-lymphocyte ratio (PLR) to poor survival in EC continues to accumulate, with systematic reviews suggesting consistent associations with overall survival (OS) and disease-free survival (DFS).3 Nutritional-immunological indices, such as the prognostic nutritional index (PNI), have also been shown to identify patients with occult frailty preoperatively and correlate with cancer-related mortality.4,5 Conversely, while lacking specificity for EC, cancer antigen 125 (CA125) correlates with high-risk pathological features including LVSI and lymph node metastasis, aiding preoperative risk stratification.6 A recent meta-analysis further supports a stable association between CA125 and multi-dimensional survival outcomes, including progression-free survival (PFS)/OS.7 These biomarkers may therefore provide additional value in identifying patients requiring intensified follow-up or closer postoperative monitoring. Research combining blood inflammatory markers with CA125 for prognostic assessment suggests potential enhancement of postoperative survival prediction.8 Additionally, multi-modal modeling integrating radiomics/clinical variables shows promise for predicting EC recurrence, but its reliance on imaging quality, segmentation consistency, and external validation limits short-term feasibility in many primary care settings.9
Based on this background, this study aims to integrate clinicopathological features with preoperative routine laboratory indicators within a single-center retrospective cohort to construct a risk prediction model for PFS. We plan to evaluate the model’s robustness and calibration by internal validation using bootstrapping. Progression-free survival was selected as the primary endpoint due to its clinical relevance in capturing early recurrence events and its suitability for retrospective cohorts with limited long-term overall survival follow-up. Contemporary prognostic model studies emphasize the importance of calibration, internal validation, and clinical utility assessment to ensure robustness and applicability. By developing an interpretable risk model based on clinical variables + routine laboratory indicators, this study aims to provide an accessible quantitative tool for postoperative risk stratification, with potential applications in tailoring follow-up intensity and supporting adjuvant treatment decision-making.
Methods and Materials
Study Design
This was a single-center retrospective cohort study. Participants were consecutive EC patients who received initial treatment at our hospital’s gynecologic oncology center between January 2020 and March 2024, with follow-up data collected until March 2025. Data sources included electronic medical records (EMRs), laboratory information systems, pathology databases, and follow-up registries. The study population selection process is illustrated in Figure 1. The study was approved by the Affiliated Hospital of Xuzhou Medical University’s Ethics Committee (Approval No.: XYFY2025-KLISI-01). Informed consent was waived due to the retrospective nature. Patient data were anonymized and de-identified prior to analysis to ensure confidentiality. No personally identifiable information was included in this study, and data were handled in accordance with institutional ethical standards. All procedures were conducted in accordance with the principles of the Declaration of Helsinki.
 |
Figure 1 Flow diagram of patient selection. |
Inclusion criteria were: (1) Pathologically confirmed EC; (2) Initial treatment completed at our hospital (surgery ± adjuvant therapy); (3) Routine laboratory tests completed within 7 days pre-surgery; (4) Complete follow-up information available.
Exclusion criteria included: (1) Concurrent other primary malignant tumors; (2) Preoperative neoadjuvant radiotherapy, chemotherapy, or endocrine therapy; (3) Severe hepatic/renal failure causing albumin (Alb) or coagulation abnormalities distinctly deviating from tumor-related mechanisms; (4) Missing key predictor variables.
Outcome Definition
All laboratory measurements were obtained within 7 days prior to surgery. If multiple results were available, the value closest to the date of surgery and prior to any treatment was selected. The follow-up start point (time zero) was defined as the date of radical surgery. Follow-up information was collected through outpatient visits, hospital readmission records, and telephone interviews. Death events were confirmed using medical records and death certificates whenever available. The primary outcome was PFS, defined from time zero to first documented radiologic/pathologic tumor recurrence/progression or cancer-related death, whichever occurred first. Recurrence/progression was determined based on imaging evidence of new lesions or progression of existing lesions (with clear documentation as recurrence/progression in clinical records), pathological confirmation, or initiation of second-line anti-tumor therapy for documented recurrence/progression. The secondary outcome was OS, defined from time zero to death from any cause. Outcome event times (recurrence/progression/death dates) were independently verified by two researchers, with a third arbitrator for discrepancies.
Sample Size Consideration
PFS was the primary outcome for model development. Recent methodological studies indicate that traditional experience-based sample size determination or sole reliance on event count thresholds are insufficient to ensure model robustness. The sample size and model complexity control framework for prediction models proposed by Riley et al10 emphasizes a comprehensive consideration of model degrees of freedom, regression coefficient shrinkage, and prediction performance stability during development, rather than mechanically adhering to the events-per-variable rule. This framework has been widely adopted in recent prediction model research. Based on an estimated PFS event rate of ~25% in retrospective EC data,11 and to mitigate overfitting with limited events, the final model was restricted to ≤ 7 parameters. The final cohort of 282 patients with 76 events met sample size requirements.
Data Collection
Data extracted from EMRs included age, body mass index (BMI), FIGO stage, histologic type, tumor grade, myometrial invasion depth, LVSI status, and adjuvant therapy. All laboratory indicators were derived from the first admission test results prior to surgery, including neutrophil count (NEU), lymphocyte count (LYM), platelet count (PLT), Alb, D-dimer, and CA125. Derived inflammatory/nutritional indices were calculated: NLR = NEU/LYM; PLR = PLT/LYM; lymphocyte-to-monocyte ratio (LMR) = LYM/monocyte count; PNI = Alb (g/L) + 5 × LYM (109/L). Patients with missing key predictor variables were excluded from the analysis, and a complete-case analysis approach was applied.
Statistical Analysis
Statistical analyses were carried out using R 4.5.2 and SPSS 26, with a two-tailed P < 0.05 indicating significance. Continuous variables were described as mean ± standard deviation or median (P25, P75), and categorical variables as count (percentage). The t, Mann–Whitney U, chi-square, or Fisher’s exact tests were utilized for group comparisons. Survival outcomes were estimated via Kaplan–Meier (KM) method with Log rank tests. Associations with PFS/OS were assessed using Cox regression. Candidate variables were pre-specified based on clinical relevance and prior literature, including clinicopathological factors and laboratory-derived inflammatory and nutritional indices. Variables for model development were pre-specified based on clinical relevance and previously published literature. Univariable Cox regression analysis was first performed, and variables with P < 0.05 were considered for further inclusion. In addition, key clinically established prognostic variables, including FIGO stage and histologic type, were forcibly retained in the multivariable model regardless of statistical significance. No stepwise (forward or backward) selection procedures were applied. Collinearity was assessed using correlation matrices and variance inflation factors (VIF), and variables with strong collinearity were not included simultaneously in the model. Continuous variables, including NLR and CA125, were treated as continuous predictors. CA125 was log-transformed due to right-skewed distribution. Linearity of continuous variables was assessed using restricted cubic spline (RCS) functions. The final multivariable model was constructed using Cox proportional hazards regression, with the number of parameters restricted to avoid overfitting based on the number of observed events. The proportional hazards assumption was assessed using Schoenfeld residuals, and no statistically significant violations were detected for any covariates in the final model. The final model was limited to ≤ 7 parameters to control overfitting. Internal validation and calibration were conducted via bootstrap resampling (500 repetitions). Time-dependent receiver operating characteristic (ROC) curves were plotted to assess predictive ability at specific time points. Clinical utility was evaluated using decision curve analysis (DCA) to calculate net benefit across threshold probabilities.
Results
Baseline Clinicopathological and Laboratory Characteristics
The study included 282 patients, with 76 in the event group (disease progression) and 206 in the non-event group. Age and BMI did not differ significantly between groups (both P > 0.05). Compared to the non-event group, the event group had more advanced FIGO stages (III–IV: 48.68% vs 16.99%, P < 0.001), a higher proportion of non-endometrioid histology (39.47% vs 21.84%, P = 0.003), higher tumor grade (G3: 47.37% vs 22.33%, P < 0.001), and more frequent LVSI positivity (53.95% vs 32.04%, P < 0.001). Myometrial invasion ≥ 1/2 showed a non-significant trend (P = 0.092). Laboratory-wise, the event group had significantly higher NEU, lower LYM, and lower Alb (all P ≤ 0.004). PLT did not differ significantly (P = 0.147).
Inflammatory/nutritional indices showed significantly higher D-dimer, CA125, NLR, and PLR, while lower LMR and PNI in the event group than the non-event group (all P < 0.001), suggesting enhanced hypercoagulability, systemic inflammation, and poorer nutrition in patients with progression (Table 1).
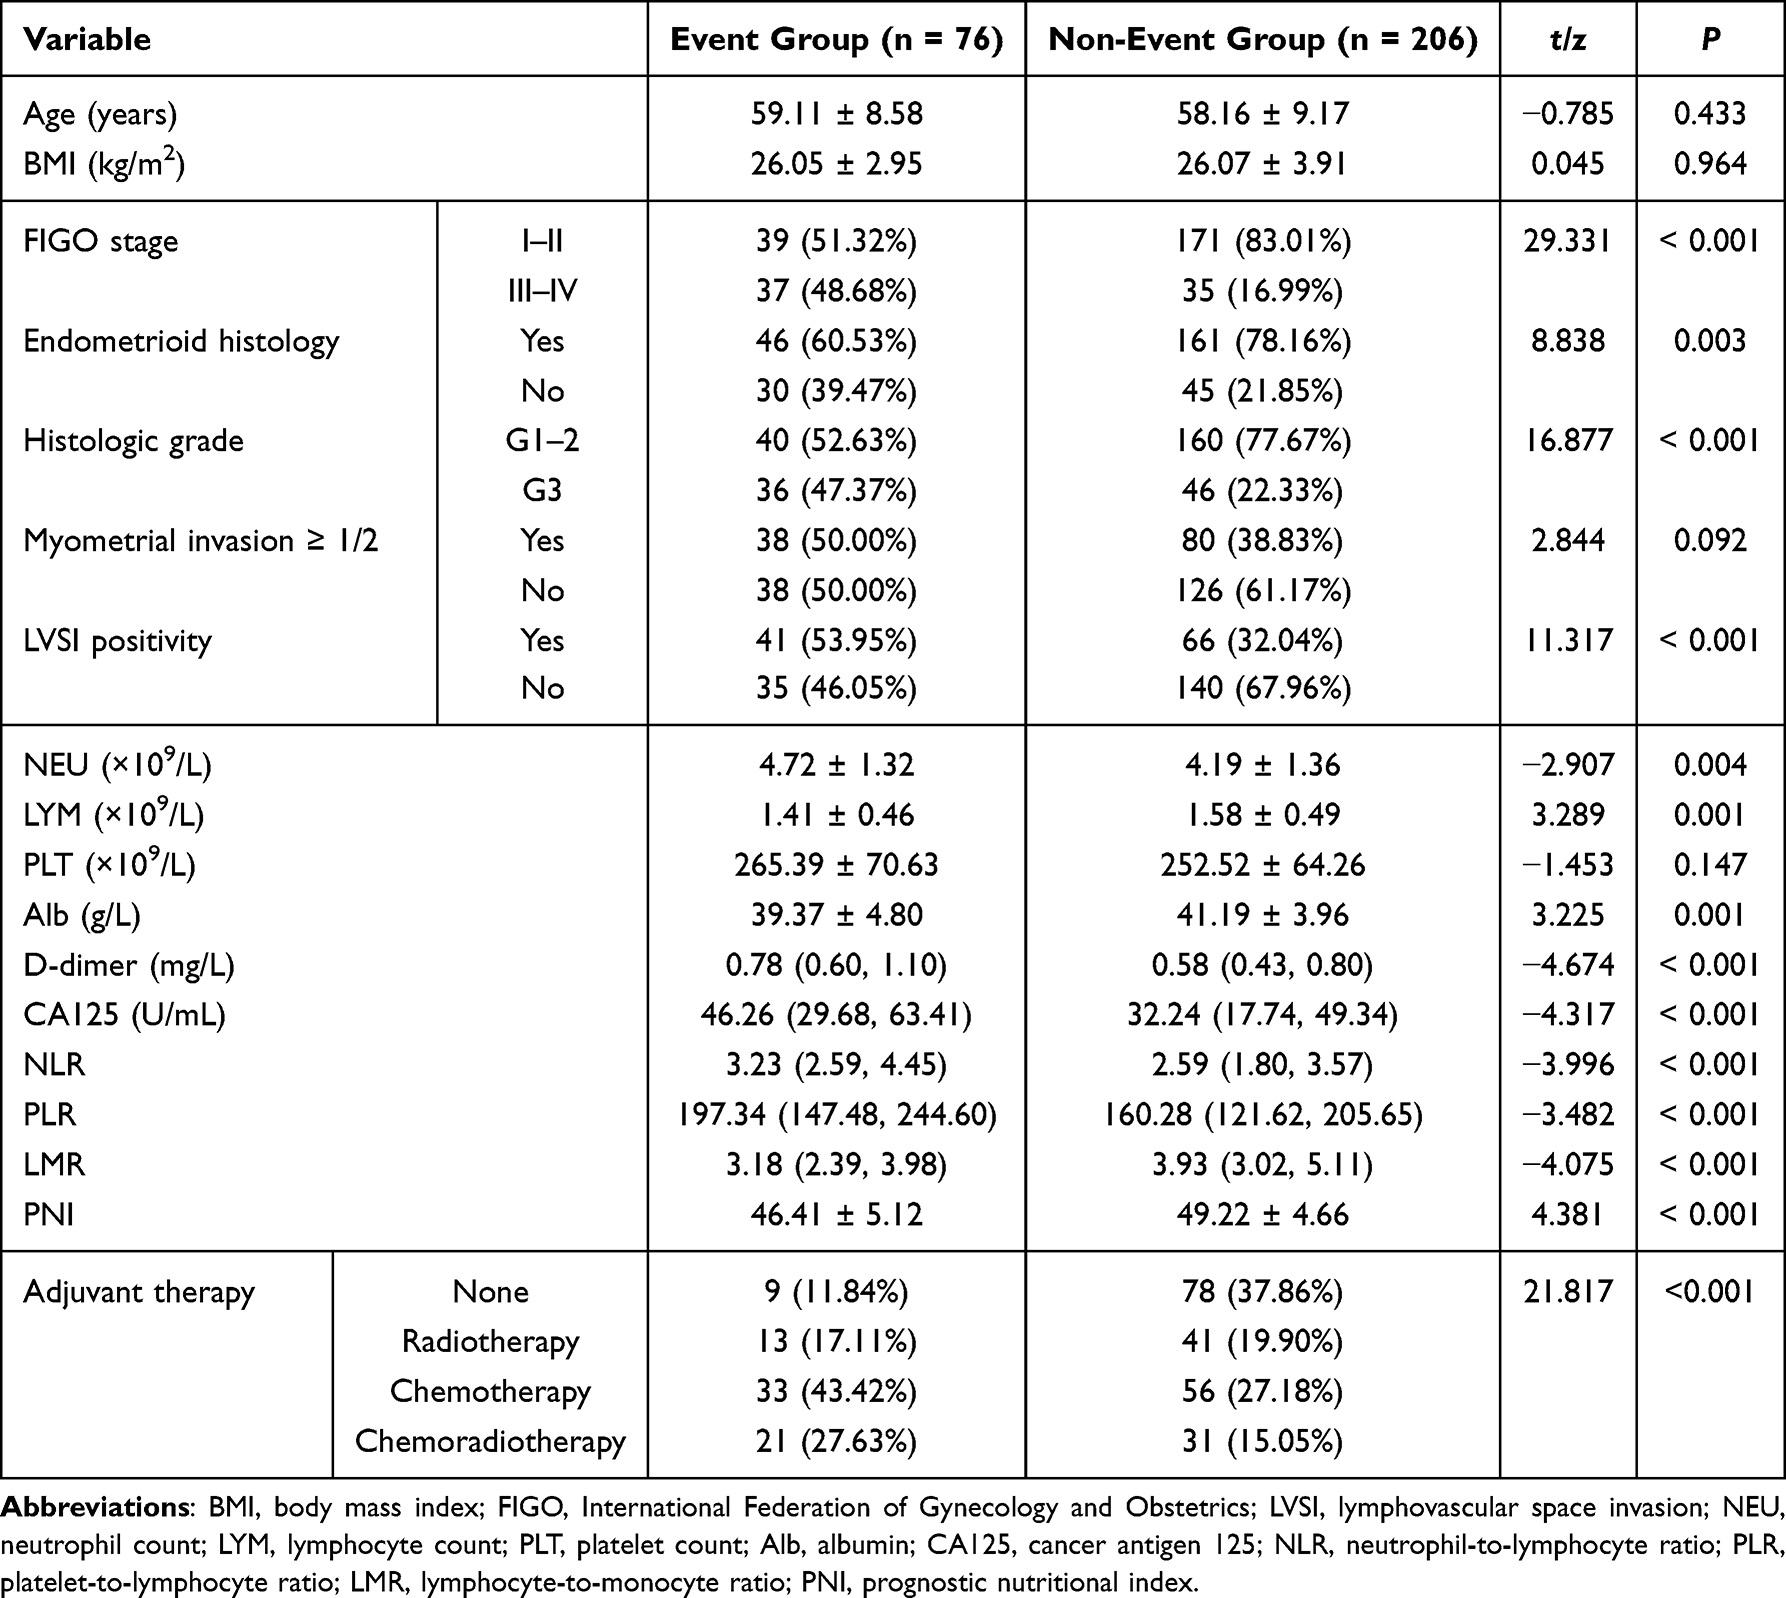 |
Table 1 Baseline Clinicopathological and Laboratory Characteristics |
Cox Regression Analysis of Prognostic Factors
Univariate Cox regression analysis showed that FIGO stage, histologic type, tumor grade, LVSI, NLR, PNI, CA125, D-dimer and adjuvant therapy were significantly associated with PFS (all P < 0.01). Notably, advanced FIGO stage (III–IV) was associated with a significantly higher risk of disease progression compared to early-stage disease (HR = 3.02, 95% CI: 1.93–4.74, P < 0.001). Higher NLR and D-dimer were linked to worse PFS risk stratification, while higher PNI indicated better outcomes.
Variables with statistical or clinical significance from the univariate analysis were subsequently included in a multivariate Cox regression model. This analysis confirmed FIGO stage, histologic type, NLR, and log-transformed CA125 as independent predictors of PFS. Specifically, patients with stage III–IV disease had a 1.95 times higher progression risk than those with stage I–II (HR = 1.95, 95% CI: 1.19–3.20, P = 0.008). Non-endometrioid histology was associated with an approximately 1.95-fold increase in progression risk (HR = 1.95, 95% CI: 1.21–3.14, P = 0.006). Each 1-unit increase in NLR corresponded to a 15% increase in progression risk (HR = 1.15, 95% CI: 1.02–1.30, P = 0.021). Log-transformed CA125 also showed a significant association with progression risk (HR = 1.79, 95% CI: 1.22–2.63, P = 0.003).
LVSI and myometrial invasion depth showed only marginal significance in the multivariate model (P = 0.073 and P = 0.085, respectively). PNI lost independent predictive value in the multivariate analysis (P = 0.113). Adjuvant therapy was not included in the final multivariable model because it represents a downstream treatment variable determined by baseline tumor characteristics (such as FIGO stage, histology, and LVSI). Therefore, its inclusion would introduce treatment-related confounding and may lead to over-adjustment, as it lies on the causal pathway between baseline disease severity and survival outcomes (Table 2). Sensitivity analysis including adjuvant therapy demonstrated consistent results (Supplementary Table S1).
 |
Table 2 Univariate and Multivariate Cox Regression Analyses for PFS |
No significant non-linear associations were observed for NLR (P = 0.143) and log-transformed CA125 (P=0.496). Bootstrap validation yielded an optimism-corrected C-index of 0.782. The proportional hazards assumption was satisfied (global P = 0.304).
KM Survival Analysis
Based on prior literature, cut-off values of 3.012 for the NLR and 4613 for the PNI were used to stratify patients for KM survival analysis. FIGO stage was categorized into I–II and III–IV according to clinical standards. KM analysis revealed significant differences in PFS between groups stratified by clinicopathological and inflammatory-nutritional indicators. Patients in the NLR ≥ 3.0 group had significantly worse PFS than those in the NLR < 3.0 group. The high-NLR group experienced disease progression events earlier during follow-up, with their survival curve remaining at a consistently lower level (Figure 2B). When stratified by PNI, patients with PNI ≥ 46 had significantly better PFS than those with PNI < 46. The survival curve for the low-PNI group declined more steeply, indicating a higher risk of disease progression. The difference between the two groups was statistically significant by the Log rank test (P < 0.0001; Figure 2A). Stratification by FIGO stage showed that patients with stage III–IV disease had markedly worse PFS than those with stage I–II. The survival curves for the two groups separated early during follow-up, and the difference widened over time. This difference was highly statistically significant by the Log rank test (P < 0.0001; Figure 2C).
 |
Figure 2 Kaplan–Meier survival analysis. Notes: (A) Stratified by PNI (≥46 vs <46); (B) Stratified by NLR (≥3.0 vs <3.0); (C) Stratified by FIGO stage (I–II vs III–IV). |
Model Discriminative Ability and Calibration
Time-dependent ROC curve analysis showed that the model had good discriminative ability for 3-year PFS, with an area under the curve (AUC) of 0.792 (Figure 3A). A stable 5-year AUC estimate was not obtained due to reduced sample size and high censoring.
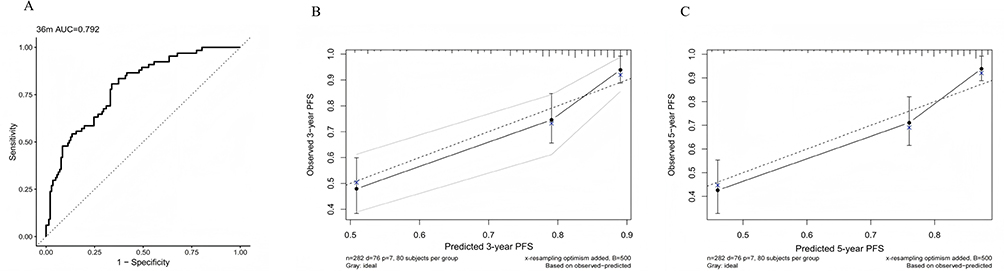 |
Figure 3 Model discrimination and calibration. Notes: (A) Time-dependent ROC curve for predicting 3-year PFS; (B) Calibration plot for 3-year PFS; (C) Calibration plot for 5-year PFS. |
Calibration plots at 3 and 5 years showed good agreement between predicted and observed PFS probabilities. The 3-year calibration curve closely followed the ideal reference line, indicating good fit, especially in medium-to-high risk ranges (Figure 3B). The 5-year curve also showed consistent predictions with minimal deviation, suggesting that the model maintained stable calibration performance for long-term PFS risk stratification prediction (Figure 3C).
DCA
Given that a reduced sample size in later follow-up might lead to unstable estimates, the 36-month time point was selected for DCA (Figure 4). The results showed that across a threshold probability range of approximately 0.05–0.55, the curve for the prediction model based on the Cox regression was positioned above the curves for both the “treat all” and “treat none” extreme strategies. This indicates that using this model for clinical decision-making within this threshold interval yields a higher net benefit. Although the model’s net benefit gradually decreased as the threshold probability increased, it remained positive and superior to both the “treat all” and “treat none” strategies across most clinically relevant threshold probabilities.
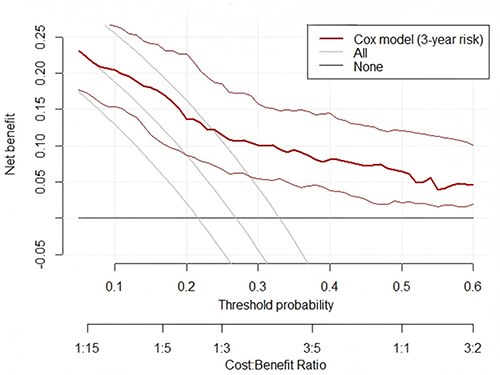 |
Figure 4 Decision curve analysis for the Cox model predicting 3-year progression-free survival. |
Incremental Value Analysis
In the time-dependent ROC analysis (Figure 5A), the full model demonstrated superior discriminative performance for 3-year progression-free survival, with an AUC of 0.792 compared with 0.708 for the clinical model, indicating a moderate improvement in risk stratification ability.
 |
Figure 5 Incremental value analysis of the clinical and full models for predicting 3-year progression-free survival (PFS). Notes: (A) Time-dependent ROC curves comparing the discriminative ability of the clinical and full models. (B) Calibration curves assessing agreement between predicted and observed 3-year PFS probabilities for both models. (C) DCA evaluating the clinical net benefit of the two models across a range of threshold probabilities. |
Calibration analysis (Figure 5B) showed that the full model provided better agreement between predicted and observed probabilities of 3-year progression-free survival, with calibration curves closely approximating the ideal 45-degree reference line, suggesting that the addition of laboratory biomarkers provides incremental prognostic information beyond conventional clinicopathological factors.
Decision curve analysis (Figure 5C) further demonstrated that the full model yielded higher net clinical benefit across a wide range of threshold probabilities (approximately 0.10–0.50), compared with the clinical model and the treat-all or treat-none strategies, supporting its potential clinical utility.
Discussion
This study found that patients experiencing disease progression exhibited more pronounced systemic inflammation/hypercoagulability (elevated NLR, PLR, D-dimer) and decreased nutritional/immune reserve (lower PNI, LMR). Multivariate analysis confirmed FIGO stage, non-endometrioid histology, NLR, and log-transformed CA125 as independent PFS predictors. These findings align with clinical disease behavior, suggesting that tumor burden/aggressiveness, inflammatory-immune imbalance, and coagulation activation may jointly influence progression risk.
It is important to emphasize that the present study does not introduce novel prognostic biomarkers. Instead, it integrates previously reported clinical and laboratory variables into a unified predictive model to assess their combined utility in a real-world setting. Therefore, the primary contribution of this work is methodological and pragmatic rather than discovery-oriented.
The persistent significance of advanced FIGO stage and non-endometrioid histology aligns with guideline risk stratification based on anatomical extent and tumor biology.1 Notably, the updated FIGO 2023 staging further incorporates histologic and molecular features for precision,14 and the ESGO-ESTRO-ESP 2025 update strengthens the clinical-pathological-molecular framework.15 However, real-world variability in molecular test accessibility, standardization, and cost creates an implementation gap, highlighting the continued relevance of models based on routine, low-barrier indicators.2 This model complements rather than competes with molecular classification, offering a practical alternative.
Although adjuvant therapy is an important determinant of progression-free survival in endometrial cancer, it was not included in the multivariable model to avoid over-adjustment bias, as treatment decisions are strongly influenced by baseline tumor characteristics such as FIGO stage, histologic subtype, and LVSI. To further assess the robustness of the model, a sensitivity analysis including adjuvant therapy was performed, and the results remained consistent, indicating that its exclusion did not materially affect the main findings.
The independent significance of NLR in the multivariate model (≈ 15% increased risk per unit) suggests that it captures more than just advanced disease, potentially reflecting a systemic projection of the tumor-related inflammatory-immune microenvironment.16,17 Previous systematic reviews and meta-analyses consistently associate higher NLR with worse OS/DFS (and PFS in some studies) in EC.3,18 Mechanistically, neutrophils may promote invasion/metastasis via neutrophil extracellular traps and pro-angiogenic/stromal remodeling factors, while lymphocytopenia indicates weakened anti-tumor immune surveillance, allowing minimal residual disease a growth advantage. Although not directly measuring tumor immune infiltration, NLR, as a cheap, reproducible peripheral blood index, may integrate these opposing forces, explaining its retained significance after multivariable adjustment.
Furthermore, the significant association of log-transformed CA125 with PFS risk indicates that its prognostic value extends beyond collinearity with stage. Pretreatment serum CA125 correlates with OS and PFS/DFS in EC patients, which is particularly evident using common cut-offs (eg, 35 U/mL).7,19 Biologically, CA125 (MUC16-related) may reflect peritoneal/mesothelial-related inflammation and tumor cell adhesion/migration capacity, providing incremental information even after accounting for histology and stage.20 A recent meta-analysis provides further support for a stable association between pretreatment CA125 levels and poor prognosis in EC.7 High preoperative CA125 also correlates significantly with adverse features such as lymph node metastasis and LVSI.21 The synergistic role of these biomarkers in the prediction model may reflect complex inflammation-tumor interactions.
D-dimer and PNI, significant in univariate analysis but not independently in the multivariate model, should still be interpreted as reflecting relevant biological processes despite losing statistical independence in multivariable analysis. The loss of independent significance may be explained by the following factors: (1) Pathway overlap: D-dimer represents coagulation-fibrinolysis activation, closely coupled with inflammatory networks, and NLR captures the inflammatory axis, leading to information redundancy. Previous studies show that D-dimer predicts high-risk EC pathology and recurrence risk,22 and combining coagulation markers with tumor markers has diagnostic/stratification value.23 (2) Model parsimony: With limited events, priority is given to retaining robust, consistently reported predictors (stage, histology, NLR, CA125) to control overfitting, aligning with modern prediction modeling principles.10,24 (3) Component overlap: PNI comprises Alb and lymphocytes, the latter also part of NLR; thus, its independent contribution can be absorbed by NLR. While PNI is a reported prognostic indicator in EC,4,5 its effect attenuation when modeled alongside core inflammatory indices is not uncommon.
The model demonstrated an AUC of ~0.792 for 3-year PFS, good calibration, and positive net benefit on DCA within the 0.05–0.55 threshold range. This triad of discrimination-calibration-net benefit reporting aligns with current prediction model standards.24 DCA suggests that the model provides potential clinical net benefit within a relevant threshold range.25–28 Thus, the model’s value lies not only in statistical significance but also in providing a quantitative basis for intensifying follow-up, adjuvant therapy discussions, and postoperative monitoring strategies.
This study has several limitations. First, as a single-center retrospective study, it is subject to potential selection and information bias. Second, the relatively limited number of events may restrict model complexity and affect long-term predictive stability. Third, external validation was not performed, limiting generalizability. Fourth, the absence of molecular classification represents a major limitation, as it has become an essential component of contemporary endometrial cancer risk stratification. Therefore, the proposed model should be considered complementary to, rather than a substitute for, molecularly integrated prognostic systems. Future studies should focus on external validation in multi-center cohorts and explore the integration of molecular classification with inflammation-based markers to improve predictive performance and clinical applicability.
Conclusion
In conclusion, this study developed an internally validated progression-free survival (PFS) prediction model for endometrial cancer based on routinely available clinicopathological and laboratory indicators. The model demonstrated moderate-to-good discrimination and acceptable calibration, with the most robust performance observed for 3-year PFS prediction, and may serve as a supportive tool for exploratory risk stratification in endometrial cancer. However, external and multi-center validation is required before any clinical application can be considered. The absence of molecular classification should be acknowledged as a key limitation, and the model should be interpreted as complementary to molecularly integrated risk stratification systems.
Data Sharing Statement
The datasets used and/or analyzed during the current study are available from the corresponding author on reasonable request.
Ethics Approval and Consent to Participate
The study was approved by the Affiliated Hospital of Xuzhou Medical University’s Ethics Committee (Approval No.: XYFY2025-KL151-01). Informed consent was waived due to the retrospective nature. All procedures were conducted in accordance with the principles of the Declaration of Helsinki.
Funding
This study was supported by Science and Technology Project of Xuzhou Municipal Health Commission (No. XWKYHT20240126).
Disclosure
The authors declare no competing interests.
References
1. Concin N, Matias-Guiu X, Vergote I, et al. ESGO/ESTRO/ESP guidelines for the management of patients with endometrial carcinoma. Int J Gynecol Cancer. 2021;31(1):12–11. doi:10.1136/ijgc-2020-002230
2. Imboden S, Nastic D, Ghaderi M, et al. Implementation of the 2021 molecular ESGO/ESTRO/ESP risk groups in endometrial cancer. Gynecol Oncol. 2021;162(2):394–400. doi:10.1016/j.ygyno.2021.05.026
3. Leng J, Wu F, Zhang L. Prognostic significance of pretreatment neutrophil-to-lymphocyte ratio, platelet-to-lymphocyte ratio, or monocyte-to-lymphocyte ratio in endometrial neoplasms: a systematic review and meta-analysis. Front Oncol. 2022;12:734948. doi:10.3389/fonc.2022.734948
4. Njoku K, Barr CE, Ramchander NC, Crosbie EJ. Impact of pre-treatment prognostic nutritional index and the haemoglobin, albumin, lymphocyte and platelet (HALP) score on endometrial cancer survival: a prospective database analysis. PLoS One. 2022;17(8):e0272232. doi:10.1371/journal.pone.0272232
5. Kim YJ, Park HP, Kim HS, Park S. Preoperative prognostic nutritional index is a prognostic indicator of cancer-specific survival in patients undergoing endometrial cancer surgery. J Korean Med Sci. 2023;38(21):e163. doi:10.3346/jkms.2023.38.e163
6. Shawn LyBarger K, Miller HA, Frieboes HB. CA125 as a predictor of endometrial cancer lymphovascular space invasion and lymph node metastasis for risk stratification in the preoperative setting. Sci Rep. 2022;12(1):19783. doi:10.1038/s41598-022-22026-1
7. Yu Z, Sun Y, Guo C. Evaluating pretreatment serum CA-125 levels as prognostic biomarkers in endometrial cancer: a comprehensive meta-analysis. Front Oncol. 2024;14:1442814. doi:10.3389/fonc.2024.1442814
8. Lin Z, Wang T, Li Q, et al. Development and validation of MRI-based radiomics model to predict recurrence risk in patients with endometrial cancer: a multicenter study. Eur Radiol. 2023;33(8):5814–5824. doi:10.1007/s00330-023-09685-y
9. Lin H, Zhong W, Zhong L, Que C, Lin X. The inflammatory markers combined with CA125 may predict postoperative survival in endometrial cancer. J Obstet Gynaecol. 2024;44(1):2373937. doi:10.1080/01443615.2024.2373937
10. Riley RD, Ensor J, Snell KIE, et al. Calculating the sample size required for developing a clinical prediction model. BMJ. 2020;368:m441. doi:10.1136/bmj.m441
11. Ma X, Cao D, Zhou H, et al. Survival outcomes and the prognostic significance of clinicopathological features in patients with endometrial clear cell carcinoma: a 35-year single-center retrospective study. World J Surg Oncol. 2023;21(1):106. doi:10.1186/s12957-023-02992-0
12. Nindra U, Shahnam A, Stevens S, et al. Elevated neutrophil-to-lymphocyte ratio (NLR) is associated with poorer progression-free survival in unresectable stage III NSCLC treated with consolidation durvalumab. Thorac Cancer. 2022;13(21):3058–3062. doi:10.1111/1759-7714.14646
13. Jiang N, Deng JY, Ding XW, et al. Prognostic nutritional index predicts postoperative complications and long-term outcomes of gastric cancer. World J Gastroenterol. 2014;20(30):10537–10544. doi:10.3748/wjg.v20.i30.10537
14. Berek JS, Matias-Guiu X, Creutzberg C, et al. FIGO staging of endometrial cancer: 2023. Int J Gynaecol Obstet. 2023;162(2):383–394. doi:10.1002/ijgo.14923
15. Concin N, Matias-Guiu X, Cibula D, et al. ESGO-ESTRO-ESP guidelines for the management of patients with endometrial carcinoma: update 2025. Lancet Oncol. 2025;26(8):e423–e435. doi:10.1016/S1470-2045(25)00167-6
16. Zhang W, Tan Y, Li Y, Liu J. Neutrophil to Lymphocyte ratio as a predictor for immune-related adverse events in cancer patients treated with immune checkpoint inhibitors: a systematic review and meta-analysis. Front Immunol. 2023;14:1234142. doi:10.3389/fimmu.2023.1234142
17. Faria SS, Fernandes PC, Silva MJ, et al. The neutrophil-to-lymphocyte ratio: a narrative review. Ecancermedicalscience. 2016;10:702. doi:10.3332/ecancer.2016.702
18. Su J, Li Y, Tan S, Cheng T, Luo Y, Zhang L. Pretreatment neutrophil-to-lymphocyte ratio is associated with immunotherapy efficacy in patients with advanced cancer: a systematic review and meta-analysis. Sci Rep. 2025;15(1):446. doi:10.1038/s41598-024-84890-3
19. Song JM, Aiob A, Kim K, et al. Prognosis of premenopausal women with low-risk endometrial cancer but elevated CA125 levels. Front Oncol. 2024;14:1510988. doi:10.3389/fonc.2024.1510988
20. Coll-de la Rubia E, Martinez-Garcia E, Dittmar G, Gil-Moreno A, Cabrera S, Colas E. Prognostic biomarkers in endometrial cancer: a systematic review and meta-analysis. J Clin Med. 2020;9(6):1900. doi:10.3390/jcm9061900
21. Erturk A, Korkmaz E, Arslantas Z, Bekdemir S, Erturk NK. Preoperative cancer antigen-125 levels as a predictor of recurrence in early-stage endometrial cancer. Rev Assoc Med Bras. 2024;70(5):e20231115. doi:10.1590/1806-9282.20231115
22. Huang YJ, Li BL. The significance of plasma D-dimer level in predicting high risk factors of endometrial cancer. Transl Cancer Res. 2020;9(12):7688–7696. doi:10.21037/tcr.2020.04.22
23. Li H, Liao H, Jing B, Wang Y. Effects of coagulation function indicators and tumor markers on diagnosis and clinicopathological characteristics of endometrial cancer. Int J Biol Markers. 2023;38(3–4):214–222. doi:10.1177/03936155231196253
24. Efthimiou O, Seo M, Chalkou K, Debray T, Egger M, Salanti G. Developing clinical prediction models: a step-by-step guide. BMJ. 2024;386:e078276. doi:10.1136/bmj-2023-078276
25. Vickers AJ, Holland F. Decision curve analysis to evaluate the clinical benefit of prediction models. Spine J. 2021;21(10):1643–1648. doi:10.1016/j.spinee.2021.02.024
26. Piovani D, Sokou R, Tsantes AG, Vitello AS, Bonovas S. Optimizing clinical decision making with decision curve analysis: insights for clinical investigators. Healthcare. 2023;11(16):2244. doi:10.3390/healthcare11162244
27. Zhao L, Leng Y, Hu Y, et al. Understanding decision curve analysis in clinical prediction model research. Postgrad Med J. 2024;100(1185):512–515. doi:10.1093/postmj/qgae027
28. Chalkou K, Vickers AJ, Pellegrini F, Manca A, Salanti G. Decision curve analysis for personalized treatment choice between multiple options. Med Decis Making. 2023;43(3):337–349. doi:10.1177/0272989X221143058
 © 2026 The Author(s). This work is published and licensed by Dove Medical Press Limited. The
full terms of this license are available at https://www.dovepress.com/terms
and incorporate the Creative Commons Attribution
- Non Commercial (unported, 4.0) License.
By accessing the work you hereby accept the Terms. Non-commercial uses of the work are permitted
without any further permission from Dove Medical Press Limited, provided the work is properly
attributed. For permission for commercial use of this work, please see paragraphs 4.2 and 5 of our Terms.
© 2026 The Author(s). This work is published and licensed by Dove Medical Press Limited. The
full terms of this license are available at https://www.dovepress.com/terms
and incorporate the Creative Commons Attribution
- Non Commercial (unported, 4.0) License.
By accessing the work you hereby accept the Terms. Non-commercial uses of the work are permitted
without any further permission from Dove Medical Press Limited, provided the work is properly
attributed. For permission for commercial use of this work, please see paragraphs 4.2 and 5 of our Terms.
Recommended articles
Prognostic Value of the Neutrophil-to-Lymphocyte Ratio in Patients with Chronic Internal Carotid Artery Occlusion Complicated by Cerebral Infarction
Qiu Z, Guo T, Sheng X, Tang Y, Du H
Neuropsychiatric Disease and Treatment 2022, 18:2265-2271
Published Date: 14 October 2022

Validation of a Disease-Free Survival Prediction Model Using UBE2C and Clinical Indicators in Breast Cancer Patients
Shen J, Yan H, Yang C, Lin H, Li F, Zhou J
Breast Cancer: Targets and Therapy 2023, 15:295-310
Published Date: 25 April 2023
Preoperative Inflammation-Associated Blood Cell Markers in Patients with Non-Metastatic Clear Cell Renal Cell Carcinoma: A Retrospective Study
Cheng Y, Kou W, Zhu Y
International Journal of General Medicine 2023, 16:3067-3080
Published Date: 19 July 2023
A Predictive Model for Endometrial Carcinoma Based on Hysteroscopic Data
Wu H, Chen Q, Liu Y, Tang Y, Zhao Y, Zhang X, Chen X, Ying X, Xu B
International Journal of Women's Health 2023, 15:1651-1659
Published Date: 30 October 2023
Association of Systemic Immune-Inflammation Index and Systemic Inflammation Response Index with Diabetic Kidney Disease in Patients with Type 2 Diabetes Mellitus
Liu W, Zheng S, Du X
Diabetes, Metabolic Syndrome and Obesity 2024, 17:517-531
Published Date: 1 February 2024