Back to Journals » Breast Cancer: Targets and Therapy » Volume 15
Validation of a Disease-Free Survival Prediction Model Using UBE2C and Clinical Indicators in Breast Cancer Patients
Authors Shen J, Yan H, Yang C, Lin H, Li F, Zhou J
Received 20 December 2022
Accepted for publication 28 March 2023
Published 25 April 2023 Volume 2023:15 Pages 295—310
DOI https://doi.org/10.2147/BCTT.S402109
Checked for plagiarism Yes
Review by Single anonymous peer review
Peer reviewer comments 2
Editor who approved publication: Professor Pranela Rameshwar
Jun Shen,1,* Huanhuan Yan,1,* Congying Yang,2 Haiyue Lin,2 Fan Li,1 Jun Zhou1
1Department of Breast Surgery, The First People’s Hospital of Lianyungang, The First Affiliated Hospital of Kangda College of Nanjing Medical University, Lianyungang, Jiangsu, 222002, People’s Republic of China; 2Department of Pathology, The First People’s Hospital of Lianyungang, The First Affiliated Hospital of Kangda College of Nanjing Medical University, Lianyungang, Jiangsu, 222002, People’s Republic of China
*These authors contributed equally to this work
Correspondence: Jun Zhou, Department of Breast surgery, The First People’s Hospital of Lianyungang, The First Affiliated Hospital of Kangda College of Nanjing Medical University, No. 6 Zhenhua East Road, High-Tech Square, Lianyungang, Jiangsu Province, 222002, People’s Republic of China, Tel +86 18961326373, Email [email protected]
Objective: To explore the validation of a disease-free survival (DFS) model for predicting disease progression based on the combination of ubiquitin-conjugating enzyme E2 C (UBE2C) levels and clinical indicators in breast cancer patients.
Methods: We enrolled 121 patients with breast cancer, collected their baseline characteristics and follow-up data, and analyzed the UBE2C levels in tumor tissues. We studied the relationship between UBE2C expression in tumor tissues and disease progression events of patients. We used the Kaplan-Meier method for identifying the disease-free survival rate of patients, and the multivariate Cox regression analysis to study the risk factors affecting the prognosis of patients. We sought to develop and validate a model for predicting disease progression.
Results: We found that the level of expression of UBE2C could effectively distinguish the prognosis of patients. In the Receiver Operating Characteristic (ROC) curve analysis, the Area under the ROC Curve (AUC) = 0.826 (0.714– 0.938) indicating that high levels of UBE2C was a high-risk factor for poor prognosis. After evaluating different models using the ROC curve, Concordance index (C-index), calibration curve, Net Reclassification Index (NRI), Integrated Discrimination Improvement Index (IDI), and other methods, we finally developed a model for the expression of Tumor-Node (TN) staging using Ki-67 and UBE2C, which had an AUC=0.870, 95% CI of 0.786– 0.953. The traditional TN model had an AUC=0.717, and 95% CI of 0.581– 0.853. Decision Curve Analysis (DCA) and Clinical Impact Curve (CIC) analysis indicated that the model had good clinical benefits and it was relatively simple to use.
Conclusion: We found that high levels of UBE2C was a high-risk factor for poor prognosis. The use of UBE2C in addition to other breast cancer-related indicators effectively predicted the possible disease progression, thus providing a reliable basis for clinical decision-making.
Keywords: breast cancer, nomograms, prediction model, prognosis, UBE2C
Introduction
Breast cancer is the most common cancer among women and one of the leading causes of cancer deaths in women.1,2 The occurrence of breast cancer is closely linked to gene mutation.3 Prognosis is a dynamic process of abnormal cell proliferation involving multiple genes, regulation of multiple targets, and multi-step coordination, influenced by several factors.4 The incidence of breast cancer in China is lower than that in Europe and the United States, but the cancer mortality rate is higher than that in the United States and Britain, and the burden of breast cancer is growing rapidly.5 At present, early diagnosis and treatment as well as standardized treatment are advocated in clinical treatment.6 Despite some improvement in prognosis, disease progression occurs in approximately 30% of patients, who become advanced patients with poor prognosis.7 Tumor, node, metastasis (TNM) staging can effectively distinguish the overall survival of patients, but the prediction of disease progression by Tumor-Node (TN) staging among early patients without distant metastasis in the early stage of diagnosis and treatment is inaccurate.8 It is important to address how to effectively distinguish the risk of disease progression of patients to guide follow-up treatment decisions.
Relevant studies have shown that ubiquitin conjugating enzyme 2C (UBE2C) is a biomarker of poor prognosis of breast cancer,9 as UBE2C promotes proliferation of breast cancer cells by activating the AKT/mTOR signaling pathway.10 Inhibition of UBE2C reduces the proliferation of breast cancer cells.11 The use of UBE2C levels as a prognostic marker for lymph node-positive breast cancer has been validated,12 and UBE2C mRNA expression in high-risk early breast cancer has prognostic significance.13 In this study, we developed and validated a prediction model for disease progression in breast cancer patients after surgery by detecting the levels of expression of UBE2C mRNA in tumor tissues and immunohistochemistry along with patient clinical indicators, with the aim of constructing a model to guide clinical adjuvant treatment strategies.
Materials and Methods
Clinical Data and Specimen Tissue of Breast Cancer Patients
We included a total of 121 breast cancer patients who received surgical treatment from June 7 to June 2019. Surgery was the primary treatment in all the patients, and no chemotherapy or radiotherapy was given before the surgery. These patients had complete clinical and pathological data and follow-up results, with a diagnosis and treatment plan devised according to National Comprehensive Cancer Network (NCCN) guidelines and the Chinese Society of Clinical Oncology (CSCO) guidelines.14 The study was approved by the Ethics Committee and all patients gave informed consent. The patients were followed up until June 2021, with a follow-up period of 24–48 months. Breast cancer staging was done according to the American Joint Committee on Cancer (AJCC) Cancer Staging Manual, 8th edition.15 Detection of estrogen receptor (ER) and progesterone receptor (PR) in tumor cells and human epidermal growth factor receptor 2 (HER2) positive/negative was as per the American Society of Clinical Oncology (ASCO)/College of American Pathologists (CAP) guidelines for HER2 testing in breast cancer.16,17 Fluorescence in situ hybridization (FISH) was used when HER2 status could not be determined.18,19 The breast tissue was frozen and stored in the specimen bank within the specified time (within 30 min, stored in −80 °C liquid nitrogen), and the samples were taken out for analysis when the trial began. All patients were given postoperative adjuvant therapy according to the CSCO guidelines, patients who met chemotherapy evidence were given postoperative adjuvant chemotherapy, patients with positive HER-2 were given targeted therapy, high-risk HR positive premenopausal patients were given tamoxifen combined with goserelin, the rest were given tamoxifen, and postmenopausal HR positive patients were given AI therapy.
Detection of mRNA-UBE2C Expression in Breast Cancer Tumor Tissue Using RT-qPCR
Total RNA was isolated from samples using Trizol reagent (TransGen Biotech, Beijing, China). RNA was reverse transcribed to cDNA using TransScript All-in-One - First-strand cDNA Synthesis Kit (TransGen Biotech). Using human GAPDH gene as the internal control, cDNA was detected by reverse transcription-quantitative polymerase chain reaction (RT-qPCR) using Applied Biosystems (USA). The final qPCR reaction mixture contained 10 μ L of Bestar® SYBR Green QPCR Master Mix. The amplification steps were as follows: denaturation at 94 °C for 5 min, amplification at 94 °C for 30s, amplification at 58 °C for 30s and amplification at 72 °C for 30s, 40 cycles in total. The reaction was stopped at 25 °C for 5 min. ABI Prism 7900HT/FAST (Applied Biosystems, USA) was used to detect and analyze its relative expression, calculated using the formula 2−ΔΔct The RT-PCR primers were as follows. Reaction PCR primers (Supplementary Material 1):
Immunohistochemical Analysis of UBE2C Expression
The specimen tissues were prepared into 3 mm thick sections, transferred to an adhesive slide (Thermo Fisher Scientific, CN), and analyzed by the fully automatic Immunohistochemistry staining system (dako Omins, BIOPIKE, CN). TRS with PH9.0 was repaired at 95 °C for 15 minutes, and Buffer (dako Omins, CN) was washed for 3 minutes. The Anti-UBE2C Mouse Monoclonal Antibody [5D-3F] kit (HUABIO, CN) was used for immunohistochemistry. The primary antibody of UBE2C (1:100 dilution) was incubated for 20 minutes, and the secondary antibody (1:100 dilution) was incubated for 20 minutes. UBE2C-stained sections were observed using high-resolution electron microscopy and protein expression levels were assessed using image software. The modified histochemistry score (H-score)20 was evaluated by the semi-quantitative evaluation method. We used double-blind scoring by two researchers to examine the consistency between the observers, as described in Supplementary Material 2.
Definition of Event Indicating Disease Progression
We defined an event of disease progression (endpoint event) as follows. 1. Soft tissue metastasis, recurrence, including lymph nodes and chest wall soft tissues, and the diagnosis by biopsy pathology was either recurrence or metastasis (both primary cancers should be excluded for the contralateral side). 2. Liver and lung metastasis: As confirmed by pathology. 3. Bone metastasis: As confirmed by pathology, or ECT along with X-Ray/CT/MRI and others were determined as bone metastasis by experts. 4. Brain metastasis: As confirmed by the imaging diagnosis, brain metastasis was considered if accompanied by relevant symptoms such as headache and high intracranial pressure. 5. Bone marrow metastasis: As confirmed by bone marrow biopsy pathology. 6. Metastases were from other parts: As confirmed by pathology or PET-CT scan.
Statistical Methods
The comparison of clinical characteristics between groups was performed using the Student’s t-test and Wilcoxon rank sum test of continuous variables, categorical variables using the Chi-square test and Fisher’s exact test. We used R 4.0.2 software for statistical analysis and to plot the Kaplan-Meier (K-M) survival curve and ROC curve. The univariate and multivariate regression analyses were performed using Cox regression to confirm the relationship between UBE2C levels and prognostic outcome. The relevant UBE2C regression model was developed, verified, and visualized, and the difference was statistically significant if P < 0.05. Variables were selected for nomogram using Akaike information criterion. The Concordance index (C-index), area under ROC curve (AUC) with the subject operating characteristic and time-dependent ROC curve (ROC) were used to identify and correct the model, and the correction curve was drawn. The differences between the different models were evaluated using the Net Reclassification Index (NRI). Nomogram was used for evaluating clinical benefit with the decision curve analysis (DCA) and clinical impact curve (CIC).
Results
Patient Status at Baseline
The baseline data showed that there were significant differences between the two groups in mRNA content of UBE2C, immunohistochemical expression of UBE2C, pathological grade (PG), N-stage, ER, PR, and Ki-67 expression (P < 0.05). There were no significant differences in other variables, as shown in the baseline status table (Table 1).
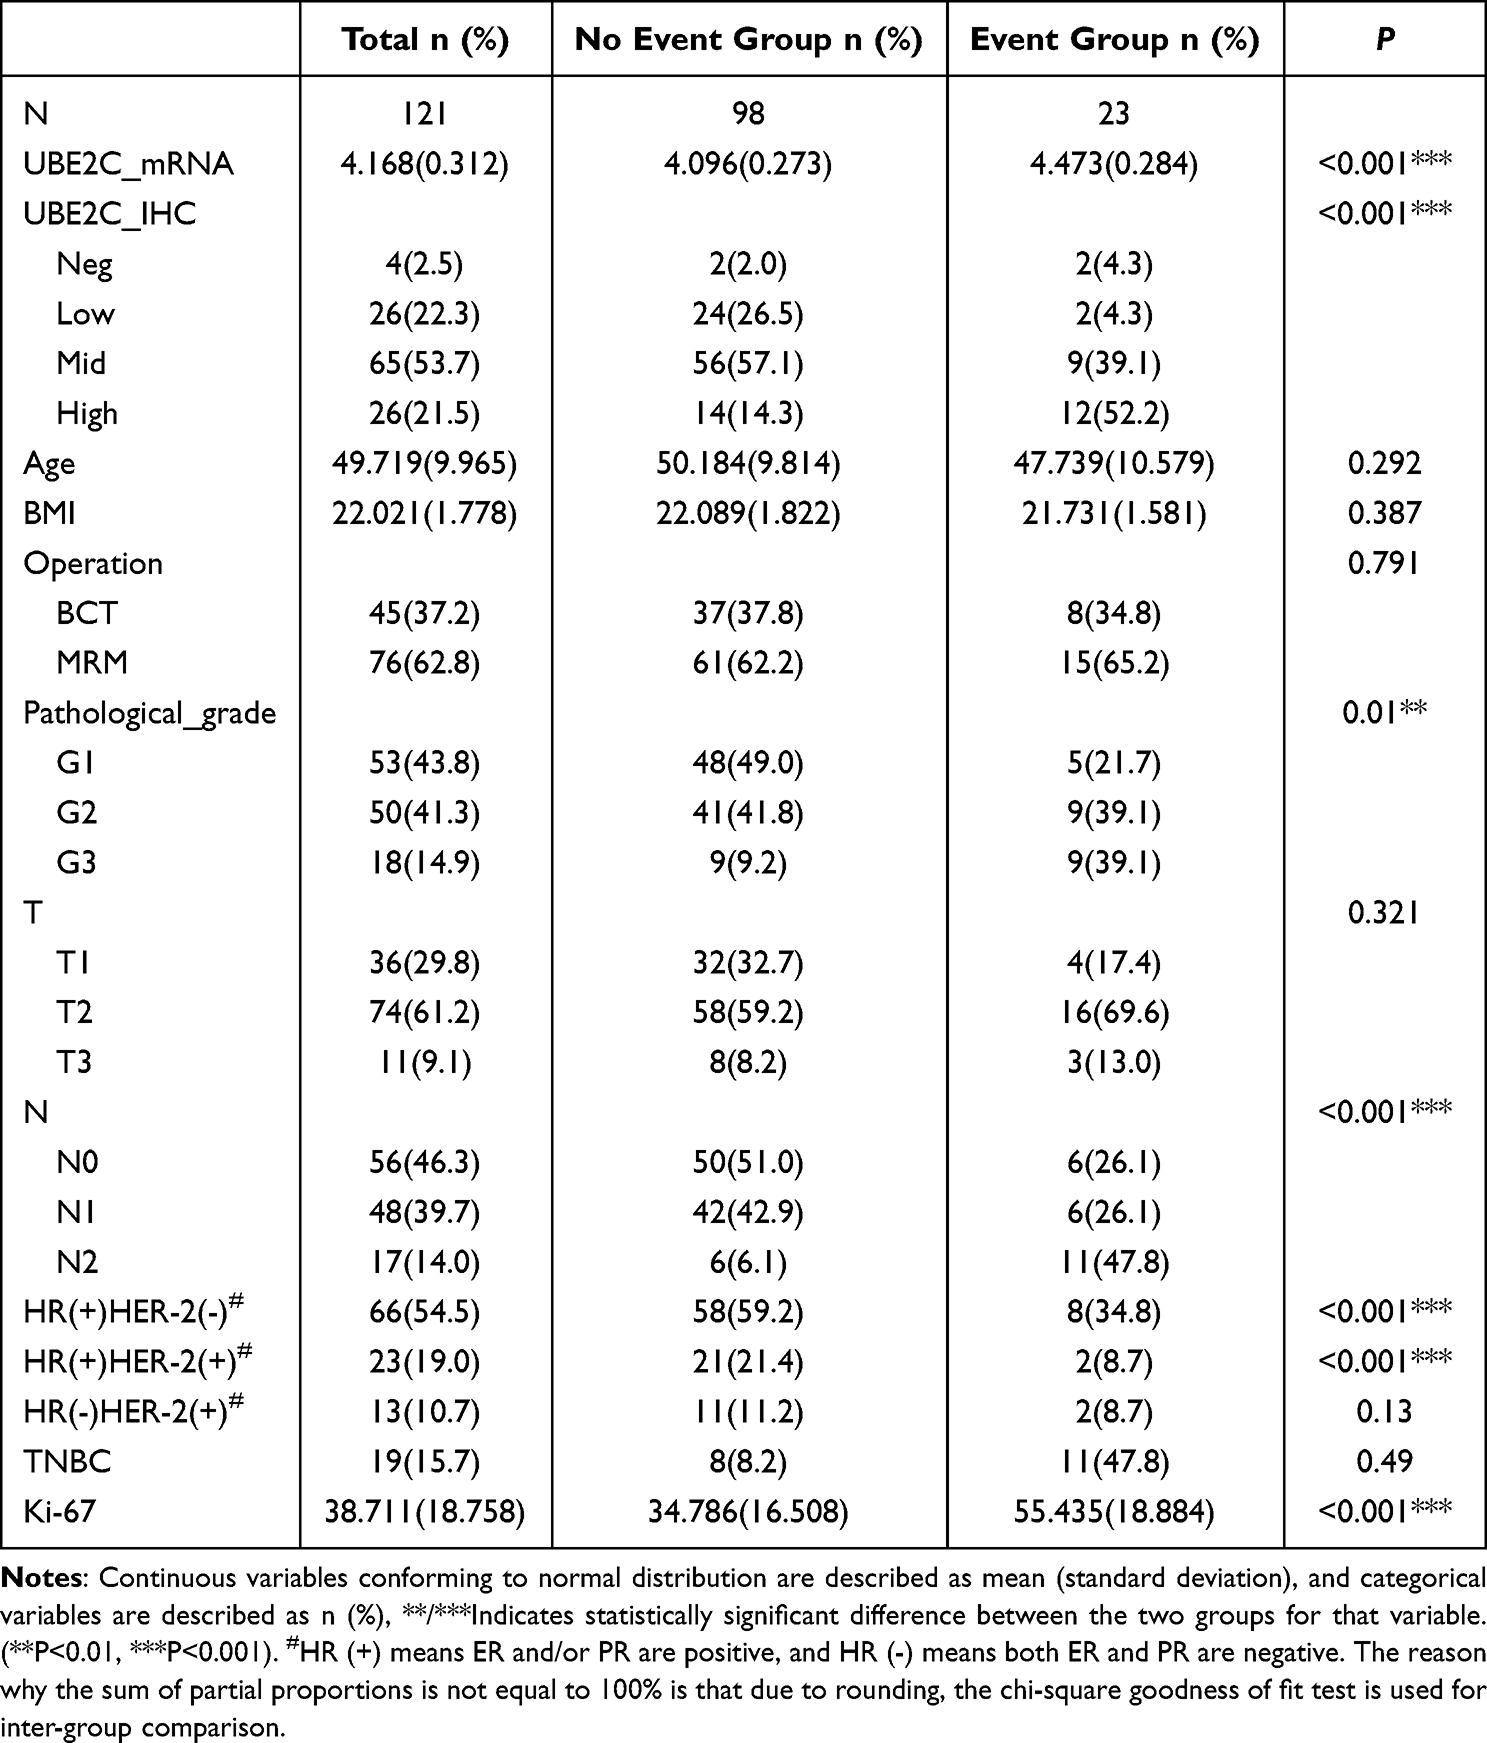 |
Table 1 Patient Baseline Profile |
Overexpression of UBE2C Predicted Poor Prognosis in Patients
There were statistical differences (P < 0.001) between the expressions of UBE2C mRNA, and ROC showed a cutoff value of 4.535, a sensitivity of 60.9%, a specificity of 100%, a positive predictive value of 100%, and a negative predictive value of 91.6%. K-M curve showed that the prognosis of high expression of UBE2C mRNA was poor, with median time to no disease progression (25 vs NA), and HR=12.39 (5.26–29.18) (P < 0.001). The immunohistochemical expression of UBE2C was positively correlated with the mRNA expression of UBE2C, and there was a statistical difference in the mRNA expression of UBE2C in the tumor tissue between the expression groups (P < 0.001). The prognosis of patients with strong positive UBE2C immunohistochemistry was poor, while the prognosis of patients with negative and weak positive UBE2C immunohistochemistry was good. The prognosis of patients with moderate positive UBE2C immunohistochemistry was in-between the two, and the difference was statistically significant (P < 0.001) (Figure 1).
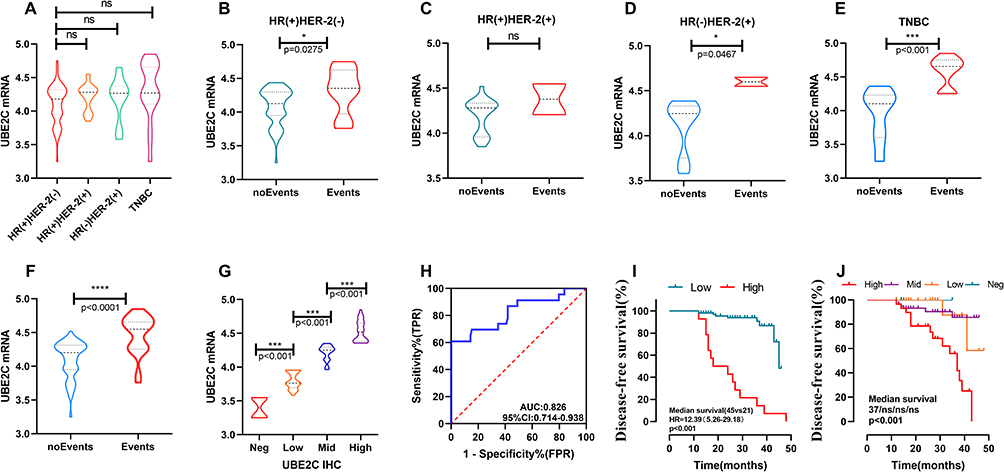 |
Figure 1 The expression of UBE2C mRNA in different subtypes showed that the expression of UBE2C was lower in HR(+)HER-2(-) patients, but there was no statistical difference compared with other groups. There was no statistically significant difference between the other groups (A). There was a statistical difference in UBE2C expression between the patients with disease progression events and those without disease progression events in HR(+)HER-2(-) patients, and the patients with disease progression events were clearly higher than those without disease progression events (p<0.05). A similar pattern was observed in the HR(-)HER-2(+) and TNBC breast cancer subtypes. In the HR(+)HER-2(+) subtypes, although the UBE2C expression in the group with no event was lower than that in the group with event, there was no statistical difference between the two groups (B–E). High expression of UBE2C predicted poor prognosis of patients. The tumor tissues with progression events had higher levels of UBE2C mRNA than those without progression events P < 0.001 (F). The immunohistochemical expression of UBE2C was positively correlated with the mRNA expression of UBE2C, and there was a statistically significant difference in mRNA expression of UBE2C mRNA different groups (P < 0.001) (G). The ROC curve showed an AUC of 0.826 and a CI of 0.714–0.938 (H). The K-M curve suggests that the prognosis of patients with high UBE2C mRNA expression was poor, whereas vice versa, the prognosis was good, HR=12.39 (5.26–29.18), and the difference was statistically significant (P < 0.001) (I). The K-M curve suggests a statistically significant difference between the different expressions of UBE2C IHC (P < 0.001) (J).(*P<0.05, ***P<0.001, ****P<0.0001). |
Cox Univariate and Multivariate Regression Analysis
In the univariate analysis, UBE2C mRNA level and expression of UBE2C IHC as well as some related indicators such as Pathological grade (PG), N stage, PR expression and Ki-67 expression were independent influencing factors. Cox regression analysis indicated that mRNA content of UBE2C, expression of UBE2C IHC and Ki-67 expression were independent prognostic factors (P < 0.05). (Table 2).
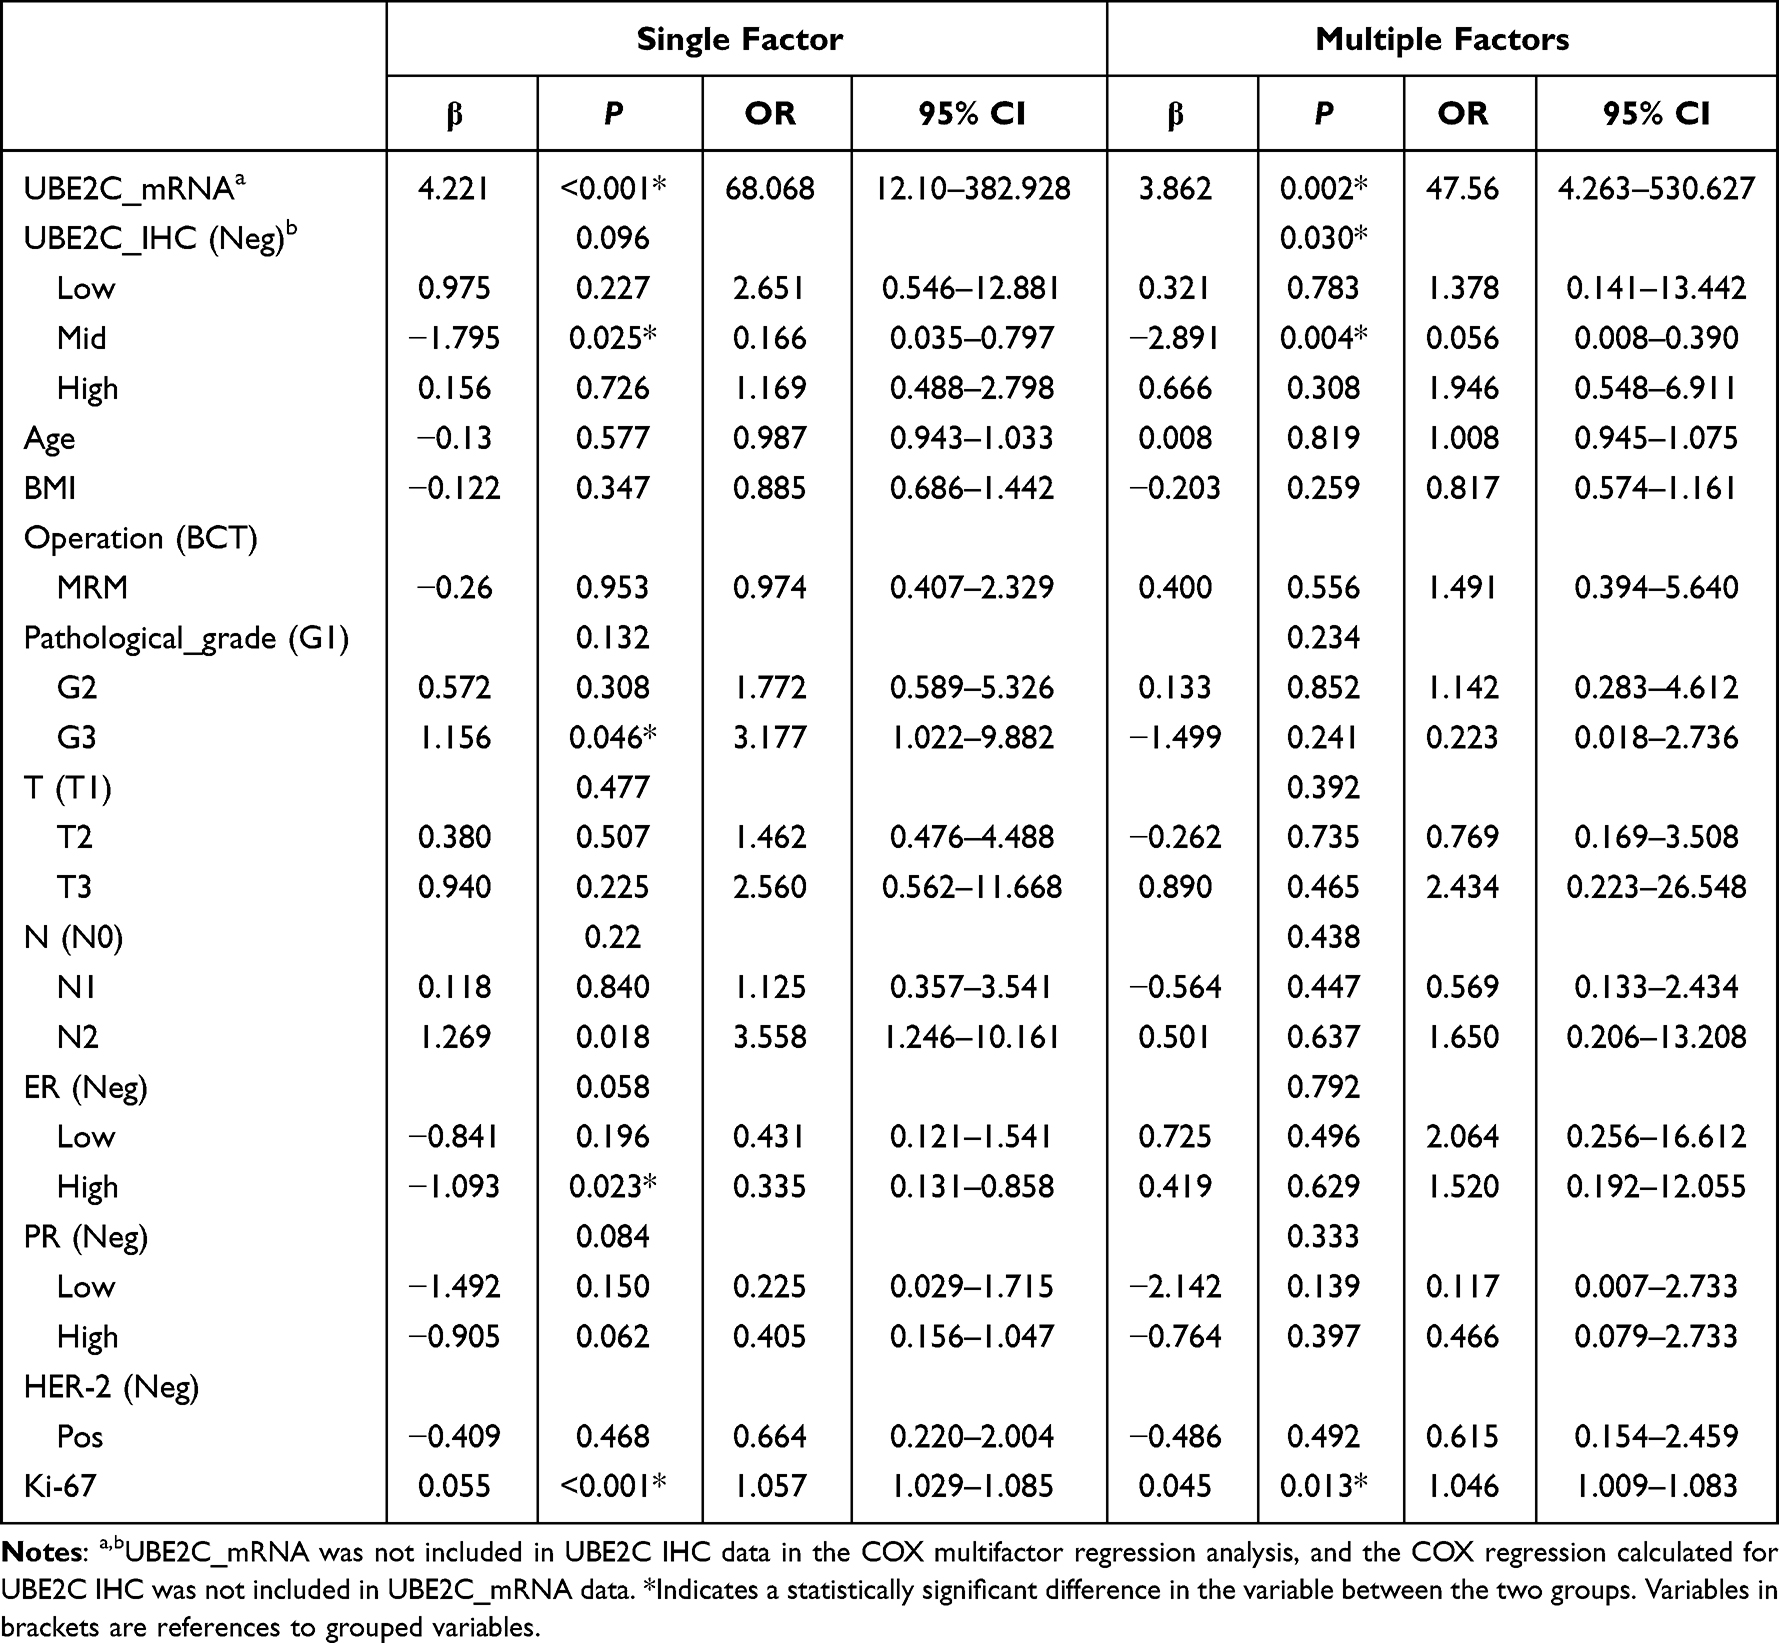 |
Table 2 Cox Univariate and Multivariate Regression Analysis |
Variable Screening and Model Establishment
The variance inflation factor (VIF) score was determined based on multivariate Cox analysis to determine the multicollinearity of each variable. Among the independent variables included in the study, PG, T, N, ER, and PR had higher VIF scores, suggesting that there was possibility of collinearity between the independent variables, and the inclusion of regression analysis at the same time may increase the possibility of over-fitting. Lasso analysis can reduce the high-dimensional data and screen the correlation factors with the best prediction features through regularization.21 Using Lasso regression analysis, we finally obtained two variables, namely, Ki-67 and UBE2C_mRNA. We created an inclusion model with all independent variables (Model 1), and another model that included Ki-67, UBE2C_mRNA, T, and N (Model 2). Our aim was to design a simple and convenient prediction model for clinical use. We included T staging and N staging in the process of selecting independent variables while developing the model to avoid the bias of included data, which could reduce the generalization ability of the model. At the same time, we compared the predictive ability of the simple T+N model (Model 3) in the occurrence of progression events and compared some other models including the model for commonly used clinical indicators PG, T, N, ER, PR, HER2, and Ki-67 (Model 4), the UBE2C_mRNA, T, N model (Model 5) and the model for Ki-67, T, and N (Model 6). (Figure 2).
 |
Figure 2 Screening of variables and model building, and correlation between independent variables included in the study (A). Lasso regression analysis shows that with the increase of log (λ), the regression coefficient gradually decreased and tended to zero, and the model kept converging (B). With the increase of interpretation deviation, the retrospective coefficient also gradually increased (C). When lambda values were lasso_1se and lasso_min, the variables included in the model were reduced to two, namely Ki-67 and UBE2C_mRNA (D), showing the VIF scores of each independent variable and the independent variables included in the model establishment (E). (*P < 0.05; ** p < 0.01). |
Model Evaluation and Comparison
ROC Curve, Risk Score Curve and Time-Dependent ROC Curve
The ROC curves were plotted against each model to obtain the all-variable model, Model 1, AUC = 0.915, 95% CI = 0.863–0.968, the model of TN combined with Ki-67 and UBE2C_mRNA, Model 2, AUC = 0.870, 95% CI = 0.786–0.953 and the traditional TN model (Model 3) AUC = 0.717, 95% CI = 0.581–0.853. There was no statistical difference between Model 1 and Model 2 (P > 0.05), but there was a statistical difference between Model 2 and Model 3 (P < 0.0001), and Model 2 was superior to Model 3. Based on the trend of the ROC curve, we concluded that Model 1 and Model 2 were relatively stable in the overall prediction process, while the prediction performance of Model 3 was significantly decreased after the cutoff value. Model 4 had AUC = 0.838, 95% CI of 0.753–0.923, Model 5 had AUC = 0.853, 95% CI of 0.776–0.943 and Ki-67, Model 6 had AUC = 0.811, and 95% CI of 0.709–0.914. The goodness of fit of Cox regression was further evaluated by plotting the risk score, and the relationship between Ki-67 and UBE2C_mRNA and prognosis was visually displayed. The ROC curves22 of time dependence of Model 1, Model 2, and Model 3 were drawn respectively, and the stability and prediction efficiency of different models at different time points were identified. The prediction stability of the three models at different time points was good, but the prediction efficiency of Model 3 was low (Figure 3).
 |
Figure 3 ROC curve: Model 1, AUC=0.915, 95% CI 0.863–0.968, Model 2, AUC=0.870, 95% CI 0.786–0.953, Model 3, AUC=0.717, 95% CI 0.581–0.853. The efficacy of Model 1 and Model 2 was comparable, and Model 1 and Model 2 were superior to Model 3. Model 4, AUC=0.838, 95% CI 0.753–0.923, Model 5, AUC=0.853, 95% CI 0.776–0.943, and Model 6, AUC=0.811, 95% CI 0.709–0.914 (A). Risk scores were plotted, suggesting that Ki-67 and UBE2C_mRNA were independent prognostic factors (B and C). According to the ROC curve of tolerance, the time to draw Model 1, Model 2, and Model 3 had good prediction stability at different time points. Model 1 and Model 2 had good prediction performance, while Model 3 had poor prediction performance (D, E and F). |
C Index, NRI, and IDI Index
The C-index, or Concordance index, was used to assess the model’s ability to predict. The net reclassification improvement index (NRI) was used to determine the accuracy of the prediction model,23 and we compared the models to see if there were differences between them. We used the Integrated Discrimination Improvement Index (IDI) to make the overall judgment for the model relative to NRI for the evaluation of a certain time node,24 the results showed that from Model 1 to Model 2 to Model 3 the prediction performance and model complexity gradually reduced. The difference among the three models was further explored using the C index, NRI, and IDI together (Figure 4). There was no significant difference between Model 1 and Model 2 in predicting disease progression events at the 48th month. Model 2 with an NRI of 0.1708, was slightly better than Model 1, and Model 2 was significantly better than Model 3, with an NRI of 0.6196. With respect to the IDI, it was also found that there was no significant difference in predictive efficacy between Model 1 and Model 2 (P = 0.358), and there was a statistical significance between the predictive efficacy of Model 2 and Model 3 (<0.05). The C-index of prediction of the models with different time nodes also showed that Model 1 and Model 2 had good prediction performance, while Model 3 had poor prediction performance.
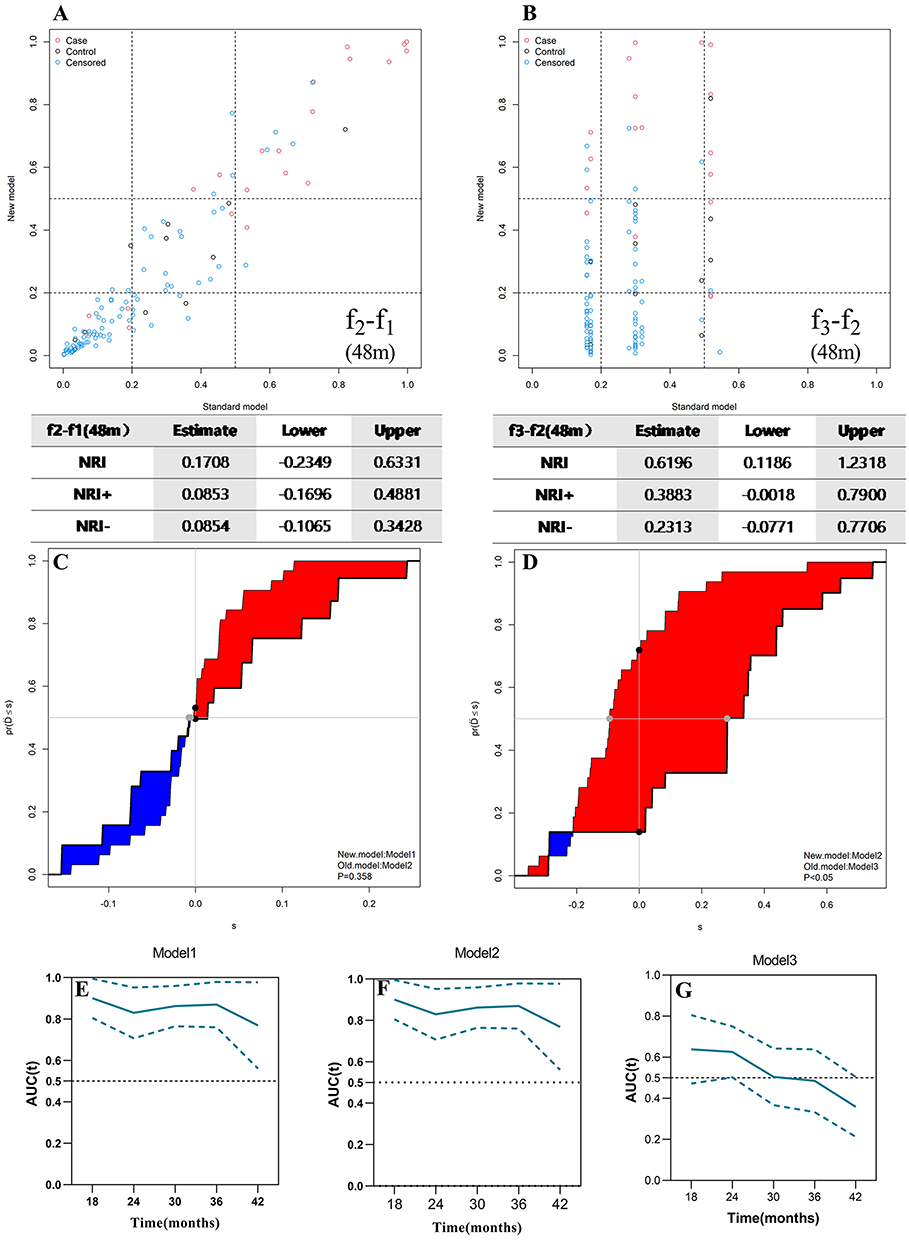 |
Figure 4 There was no significant difference between Model 1 and Model 2. NRI was 0.1708, Model 2 was slightly better than Model 1, while Model 2 was significantly better than Model 3, and NRI was 0.6196 (A and B). IDI showed that there was no significant difference in predictive efficacy between Model 1 and Model 2 (P = 0.358), and there was a statistical significance between the predictive efficacy of Model 2 and Model 3 (P < 0.05) (C and D). The C index of the prediction models with different time nodes also show that Model 1 and Model 2 had good prediction performance, while Model 3 had poor prediction performance (E, F and G). |
Calibration Curve
A calibration curve was used to evaluate the accuracy of the model. The results showed that the prediction performance of Model 1 and Model 2 was similar, while that of Model 3 was poor. Therefore, Model 3 is not discussed here. By plotting the calibration curves (Figure 5) of the 24 m and 48 m prediction of disease progression event probabilities and actual probabilities of Model 1 and Model 2, the results showed that Model 1 and Model 2 had high prediction ability and stability when the prediction ability was close to the actual ability.
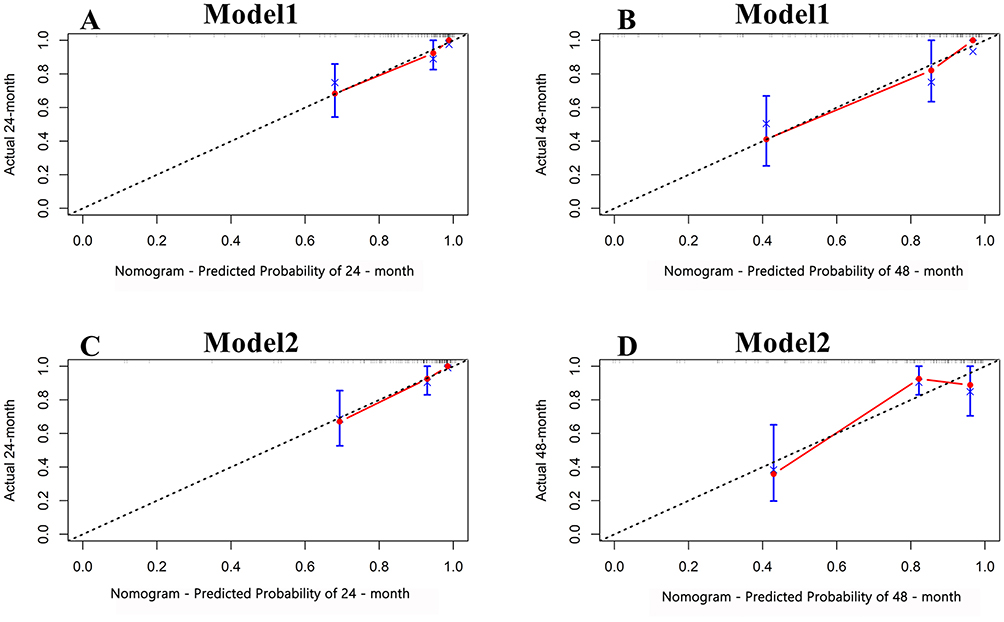 |
Figure 5 Calibration curve. The predicted calibration curve of Model 1 at 24 and 48 months shows that the predicted performance of Model 1 was good at both 24 and 48 months (A and B). The calibration curves of Model 2 were predicted at 24 months and 48 months, and it can be seen that Model 1 performed better at 24 months and there was a slight deviation of the curve from the middle dotted line at 48 months (C and D). |
Decision Curve Analysis (DCA), Clinical Impact Curve (CIC), and Model Visualization
Model 1 and Model 2 had higher prediction efficiency. The prediction efficiency of Model 1 was slightly higher than that of Model 2. There was no statistical difference between the two models, but the prediction efficiency of Model 3 was lower than that of Model 1 and Model 2, and the difference was statistically significant. However, Model 1 included more variables, and its clinical use was more complex, while Model 2 included fewer variables and its clinical use was relatively simple. Due to the low test efficiency of Model 3, it is not further discussed here. Model 1 and Model 2 were selected to further evaluate the clinical benefits25 by decision curve analysis (DCA) and clinical impact curve (CIC). By visualizing the model using the nomogram diagram (Figure 6),26 we found that the effectiveness of Model 1 and Model 2 was very similar in DCA and CIC evaluation, but Model 1 was more complex than Model 2, so we chose Model 2 as the optimal model.
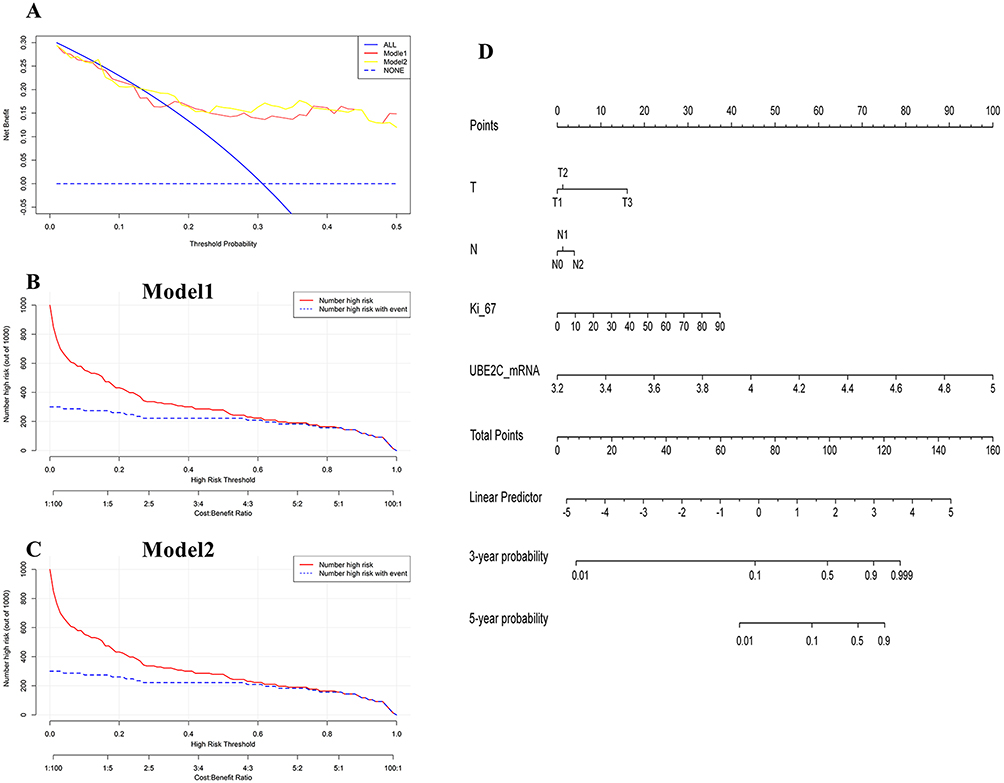 |
Figure 6 DCA, CIC, and nomogram plots. The performance of Model 1 and Model 2 was similar, but Model 1 was more complex than Model 2 (A–C), nomogram for Model 2 (D). |
UBE2C_IHC Test Results and Model Validation
Clinically, protein expression is usually detected using immunohistochemistry. The immunohistochemical results of UBE2C (Figure 7A–D) confirmed a certain correlation between the immunohistochemical results of UBE2C and the expression of UBE2C_mRNA. We identified Model 2 in the selection and comparison of previous models, replaced the UBE2C_mRNA indicator with the more clinically available UBE2C_IHC, and re-evaluated the efficacy and stability of the model. When the ROC curve was plotted, the area under the curve was 0.835, and the 95% CI was 0.736 to 0.933, which indicated that it had a high prediction ability. To further evaluate stability, we used the time-dependent tolerance ROC curve and calibration curve for evaluation. We found that the model had good stability and was more convenient for clinical use (Figure 7E–I).
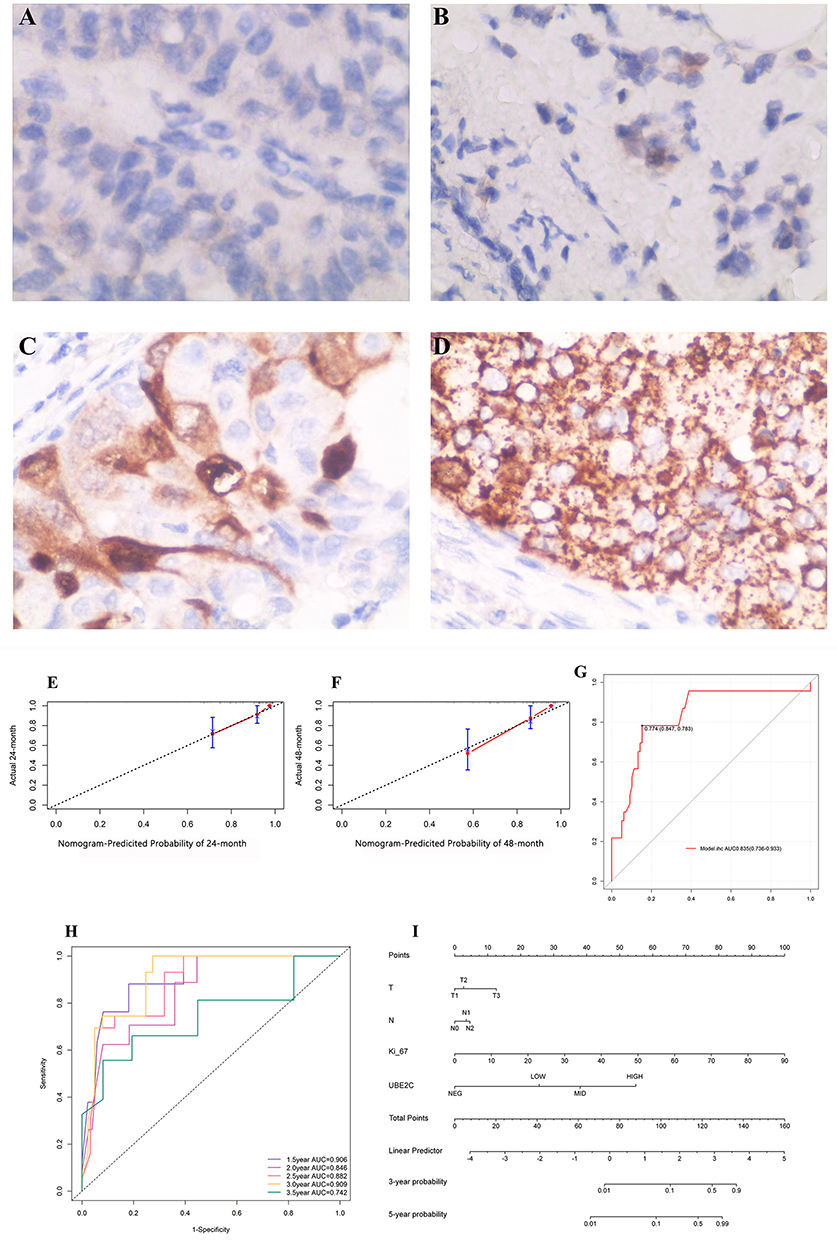 |
Figure 7 Immunohistochemical results of UBE2C: Under 400x magnification, it was negative (A), weak positive (B), moderate positive (C), and strong positive (D). After UBE2C_mRNA index was replaced by UBE2C_IHC, which is more available clinically, and the calibration curve (E and F), ROC curve (G), time-dependent ROC curve (H) of Model 1 and nomogram diagram (I) were verified again. |
Data Verification
We divided the original data set into the training set and the verification set in a ratio of 7:3. The basic information of each data set is shown in Supplementary Material 3. We trained model 2 again in the training set and tested it in the verification set to draw ROC curve and calibration curve respectively. We found that the ROC curve of model 2 was AUC0.892 (0.805–0.980) in the training set and AUC0.872 (0.661–0.998) in the verification set. No matter in the training set or the verification set, the calibration curve of 24 months showed better predictive ability (Figure 8).
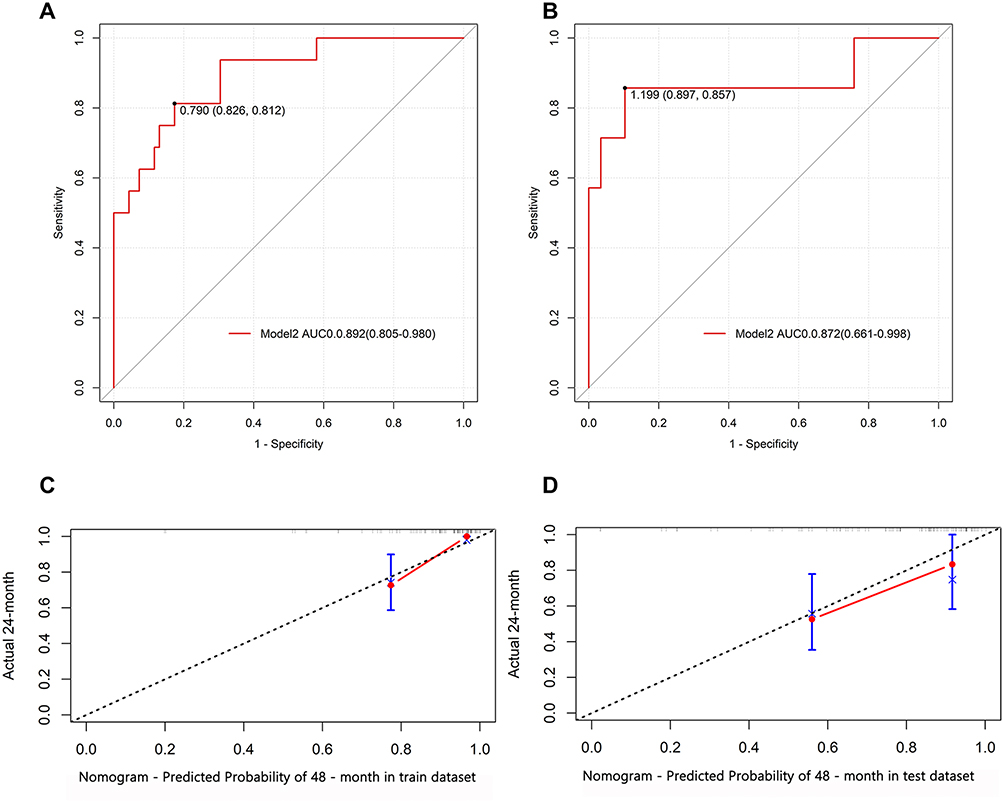 |
Figure 8 In the ROC curve of model 2 in the training set, the cut-off value is 0.79, then the sensitivity is 81.2%, the specificity is 82.6%, and the AUC is 0.892 (0.805–0.980) (A). In the ROC curve of model 2 in the verification set, the cut-off value is 1.199, then the sensitivity is 85.7%. The specificity was 89.7% and the AUC was 0.872 (0.661–0.998) (B). The calibration curves of model 2 at 24 months of training set and verification set both showed good prediction efficiency (C and D). |
Discussion
Clinicians offer patients treatment suggestions according to treatment guidelines and corresponding to the stage of their disease. However, how two patients with similar disease stages and subtypes develop very different prognoses after receiving similar treatments is often a puzzle. The nature of TNM staging is a description of tumor burden at a time cut-off that does not reflect the biological characteristics of the tumor. This issue is increasingly being addressed, and in the Eighth Edition of the American Joint Committee on Cancer Staging Manual for Breast Cancer, the panel recognized the need to incorporate biological factors and gene expression prognosis into the staging system.27 However, this too cannot fully explain the above situation. We speculate that the biological factors incorporated into our graded treatment strategy based on our TNM staging system in combination with biological factors are insufficient to reflect the original characteristics of the tumor.
High levels of UBE2C_mRNA were found in tumor tissues of patients with disease progression events, and there was a statistical difference between the two. The expression level of UBE2C_mRNA effectively distinguished the prognosis of patients, and the ROC curve AUC = 0.826 95% CI of (0.714–0.938). High levels of UBE2C_mRNA is a high risk factor for poor prognosis,28 is an indicator of poor prognosis,29,30 and is one of the core genes associated with breast cancer progression.31 Increased UBE2C level is associated with poorer overall survival (OS) in breast cancer patients.32 Analysis of our clinical data also revealed that UBE2C is involved in the regulation of breast cancer disease processes, and its overexpression is a prognostic risk factor. The expression of UBE2C in different subtypes is also different to some extent. In patients with HR(+)HER-2(-), the expression of UBE2C is lower, but there is no statistical difference compared with other groups. This may be related to the fact that we included fewer patients, but the results are consistent with clinical practice. However, high expression of UBE2C often predicts higher malignancy and poor prognosis. However, there was a statistical difference in UBE2C expression between HR(+)HER-2(-) patients with disease progression events and patients without disease progression events (p<0.05). However, in HR(-)HER-2(+) and TNBC breast cancer subtypes, A similar pattern was observed. In the HR(+)HER-2(+) subtype, although UBE2C expression in the group with no event was lower than that in the group with event, there was no statistical difference between the two groups.
Univariate and multivariate analysis indicated that UBE2C_mRNA and Ki-67 were independent prognostic indicators. ROC curves were used to compare different models, Model 1, AUC=0.915, 95% CI = 0.863–0.968, Model 2, in which TN was combined with Ki-67 and UBE2C_mRNA, and AUC = 0.878, with a 95% CI of 0.791–0.966 versus a traditional TN model (Model 3) with AUC=0.717 and a 95% CI of 0.581–0.853; Model 1 was comparable to Model 2, with Model 1 and Model 2 outperforming Model 3. At the same time, we compared some other models and found that the prediction ability of Model 4 consisting of commonly used clinical indicators was not prominent in the model we discussed, and the prediction ability was even lower than that of Model 5, which incorporated UBE2C_mRNA, T, and N. However, the prediction ability of the model was insufficient, and we speculated that it was due to the lack of factors representing tumor characteristics. Several earlier studies have demonstrated that the expression of UBE2C_mRNA was related to the prognosis of patients.13,33,34 Ki-67 is also a prognostic indicator in patients with invasive breast cancer35 and can be used as a marker of the proliferation capacity of breast cancer cells.36 It was also found to be one of the predictors of local recurrence and lymph node metastasis.37 In our study, both UBE2C_mRNA and Ki-67 had a strong capacity to reflect tumor characteristics, and their prediction ability increased when the model incorporated both UBE2C_mRNA and Ki-67.
The molecular typing of a tumor reflects the characteristics of the tumor, which can help predict its growth in the human body based on specific conditions. We have summarized this into a formula: TNM stage = time × (tumor characteristics-environmental pressure), where “time” refers to the time from the occurrence of the tumor to diagnosis, and “tumor characteristics-environmental pressure” represents the survival rate of the tumor in a certain period. When a patient visits the doctor, the tumor is diagnosed in this manner and TNM staging is done at this time. As the time variable and the environmental pressure are unknown, the current clinical indicator model (Model 4) has no outstanding predictive ability. In the absence of these two variables in the equation, we can improve the predictive ability of the model only if we can increase the tumor characteristics. This also explains why the prediction ability of the model further improved after adding the factors that were able to strongly reflect the tumor characteristics. For example, a tumor that proliferates rapidly and is highly malignant can be detected by physical examination at presentation, leading to early treatment and early intervention. However, it is possible for some error to occur, leading to errors in the prediction using the simple TNM staging alone. This may explain the significant differences in clinical outcomes between two patients with the same disease stage and molecular type.
This study also has some limitations: 1. The sample size is relatively small; 2. We did not find the appropriate data set in the subsequent data screening, we conducted internal verification. We will further verify the reliability and stability of our results in future work.
Conclusion
In this study, our results again verified that high levels of UBE2C predicted a poor prognosis in patients. The combination of UBE2C expression levels and breast cancer-related indicators may be more effective in predicting disease progression and thus guide clinical decision-making. However, our findings need to be validated further by research studies with larger samples.
Ethics Approval and Consent to Participate
This study was conducted with approval from the Ethics Committee of The First People’s Hospital of LianYunGang. This study was conducted in accordance with the declaration of Helsinki. Written informed consent was obtained from all participants.
Acknowledgments
We would like to acknowledge the hard and dedicated work of all the staff that implemented the intervention and evaluation components of the study.
Funding
No external funding received to conduct this study.
Disclosure
The authors declare that they have no competing interests.
References
1. Sung H, Ferlay J, Siegel RL, et al. Global cancer statistics 2020: globocan estimates of incidence and mortality worldwide for 36 cancers in 185 countries. CA Cancer J Clin. 2021;71(3):209–249. doi:10.3322/caac.21660
2. Bray F, Ferlay J, Soerjomataram I, Siegel RL, Torre LA, Jemal A. Global cancer statistics 2018: GLOBOCAN estimates of incidence and mortality worldwide for 36 cancers in 185 countries. CA Cancer J Clin. 2018;68(6):394–424. doi:10.3322/caac.21492
3. Howell A, Anderson AS, Clarke RB, et al. Risk determination and prevention of breast cancer. Breast Cancer Res. 2014;16(5):446. doi:10.1186/s13058-014-0446-2
4. Beroukhim R, Mermel CH, Porter D, et al. The landscape of somatic copy-number alteration across human cancers. Nature. 2010;463(7283):899–905. doi:10.1038/nature08822
5. Feng RM, Zong YN, Cao SM, Xu RH. Current cancer situation in China: good or bad news from the 2018 global cancer statistics. Cancer Commun. 2019;39(1):22. doi:10.1186/s40880-019-0368-6
6. Sun L, Legood R, Sadique Z, Dos-Santos-Silva I, Yang L. Cost-effectiveness of risk-based breast cancer screening programme, China. Bull World Health Organ. 2018;96(8):568–577. doi:10.2471/BLT.18.207944
7. Gonzalez-Angulo AM, Morales-Vasquez F, Hortobagyi GN. Overview of resistance to systemic therapy in patients with breast cancer. Adv Exp Med Biol. 2007;608:1–22.
8. Hortobagyi GN, Edge SB, Giuliano A. New and important changes in the TNM staging system for breast cancer. Am Soc Clin Oncol Educ Book. 2018;38:457–467. doi:10.1200/EDBK_201313
9. Kariri Y, Toss MS, Alsaleem M, et al. Ubiquitin-conjugating enzyme 2C (UBE2C) is a poor prognostic biomarker in invasive breast cancer. Breast Cancer Res Treat. 2022;192(3):529–539. doi:10.1007/s10549-022-06531-5
10. Lu ZN, Song J, Sun TH, Sun G. UBE2C affects breast cancer proliferation through the AKT/mTOR signaling pathway. Chin Med J. 2021;134(20):2465–2474. doi:10.1097/CM9.0000000000001708
11. Rawat A, Gopal G, Selvaluxmy G, Rajkumar T. Inhibition of ubiquitin conjugating enzyme UBE2C reduces proliferation and sensitizes breast cancer cells to radiation, doxorubicin, tamoxifen and letrozole. Cell Oncol. 2013;36(6):459–467. doi:10.1007/s13402-013-0150-8
12. Loussouarn D, Campion L, Leclair F, et al. Validation of UBE2C protein as a prognostic marker in node-positive breast cancer. Br J Cancer. 2009;101(1):166–173. doi:10.1038/sj.bjc.6605122
13. Psyrri A, Kalogeras KT, Kronenwett R, et al. Prognostic significance of UBE2C mRNA expression in high-risk early breast cancer. A Hellenic Cooperative Oncology Group (HeCOG) study. Ann Oncol. 2012;23(6):1422–1427.
14. Gradishar WJ, Anderson BO, Balassanian R, et al. NCCN guidelines insights: breast cancer, version 1.2017. J Natl Compr Canc Netw. 2017;15(4):433–451. doi:10.6004/jnccn.2017.0044
15. Giuliano AE, Edge SB, Hortobagyi GN. Eighth edition of the AJCC cancer staging manual: breast cancer. Ann Surg Oncol. 2018;25(7):1783–1785. doi:10.1245/s10434-018-6486-6
16. Hammond ME, Hayes DF, Dowsett M, et al. American Society of Clinical Oncology/College of American Pathologists guideline recommendations for immunohistochemical testing of estrogen and progesterone receptors in breast cancer (unabridged version). Arch Pathol Lab Med. 2010;134(7):e48–72. doi:10.5858/134.7.e48
17. Allison KH, Hammond M, Dowsett M, et al. Estrogen and progesterone receptor testing in breast cancer: ASCO/CAP guideline update. J Clin Oncol. 2020;38(12):1346–1366. doi:10.1200/JCO.19.02309
18. Wolff AC, Hammond ME, Hicks DG, et al. Recommendations for human epidermal growth factor receptor 2 testing in breast cancer: American Society of Clinical Oncology/College of American Pathologists clinical practice guideline update. J Clin Oncol. 2013;31(31):3997–4013. doi:10.1200/JCO.2013.50.9984
19. Wolff AC, Hammond ME, Schwartz JN, et al. American Society of Clinical Oncology/College of American Pathologists guideline recommendations for human epidermal growth factor receptor 2 testing in breast cancer. J Clin Oncol. 2007;25(1):118–145. doi:10.1200/JCO.2006.09.2775
20. McCarty KS, Miller LS, Cox EB, Konrath J, McCarty KS. Estrogen receptor analyses. Correlation of biochemical and immunohistochemical methods using monoclonal antireceptor antibodies. Arch Pathol Lab Med. 1985;109(8):716–721.
21. Hu JY, Wang Y, Tong XM, Yang T. When to consider logistic LASSO regression in multivariate analysis. Eur J Surg Oncol. 2021;47(8):2206. doi:10.1016/j.ejso.2021.04.011
22. Li J, Ma S. Time-dependent ROC analysis under diverse censoring patterns. Stat Med. 2011;30(11):1266–1277. doi:10.1002/sim.4178
23. Pepe MS, Fan J, Feng Z, Gerds T, Hilden J. The Net Reclassification Index (NRI): a misleading measure of prediction improvement even with independent test data sets. Stat Biosci. 2015;7(2):282–295. doi:10.1007/s12561-014-9118-0
24. Hayashi K, Eguchi S. The power-integrated discriminant improvement: an accurate measure of the incremental predictive value of additional biomarkers. Stat Med. 2019;38(14):2589–2604. doi:10.1002/sim.8135
25. Van Calster B, Wynants L, Verbeek J, et al. Reporting and interpreting decision curve analysis: a guide for investigators. Eur Urol. 2018;74(6):796–804. doi:10.1016/j.eururo.2018.08.038
26. Park SY. Nomogram: an analogue tool to deliver digital knowledge. J Thorac Cardiovasc Surg. 2018;155(4):1793. doi:10.1016/j.jtcvs.2017.12.107
27. Giuliano AE, Connolly JL, Edge SB, et al. Breast cancer-major changes in the American Joint Committee on cancer eighth edition cancer staging manual. CA Cancer J Clin. 2017;67(4):290–303. doi:10.3322/caac.21393
28. Dastsooz H, Cereda M, Donna D, Oliviero S. A Comprehensive Bioinformatics Analysis of UBE2C in Cancers. Int J Mol Sci. 2019;20(9):2228. doi:10.3390/ijms20092228
29. Bao Z, Cheng J, Zhu J, et al. Using weighted gene co-expression network analysis to identify increased MND1 expression as a predictor of poor breast cancer survival. Int J Gen Med. 2022;15:4959–4974. doi:10.2147/IJGM.S354826
30. Lin CY, Yu CJ, Liu CY, et al. CDK4/6 inhibitors downregulate the ubiquitin-conjugating enzymes UBE2C/S/T involved in the ubiquitin-proteasome pathway in ER + breast cancer. Clin Transl Oncol. 2022;24(11):2120–2135. doi:10.1007/s12094-022-02881-0
31. Yu D, Liu S, Chen Y, Yang L. Integrative bioinformatics analysis reveals CHEK1 and UBE2C as luminal a breast cancer subtype biomarkers. Front Genet. 2022;13:944259. doi:10.3389/fgene.2022.944259
32. Zeng X, Shi G, He Q, Zhu P. Screening and predicted value of potential biomarkers for breast cancer using bioinformatics analysis. Sci Rep. 2021;11(1):20799. doi:10.1038/s41598-021-00268-9
33. Parris TZ, Kovács A, Aziz L, et al. Additive effect of the AZGP1, PIP, S100A8 and UBE2C molecular biomarkers improves outcome prediction in breast carcinoma. Int J Cancer. 2014;134(7):1617–1629. doi:10.1002/ijc.28497
34. Mo CH, Gao L, Zhu XF, et al. The clinicopathological significance of UBE2C in breast cancer: a study based on immunohistochemistry, microarray and RNA-sequencing data. Cancer Cell Int. 2017;17:83. doi:10.1186/s12935-017-0455-1
35. Davey MG, Hynes SO, Kerin MJ, Miller N, Lowery AJ. Ki-67 as a prognostic biomarker in invasive breast cancer. Cancers. 2021;13(17):4455. doi:10.3390/cancers13174455
36. Menon SS, Guruvayoorappan C, Sakthivel KM, Rasmi RR. Ki-67 protein as a tumour proliferation marker. Clin Chim Acta. 2019;491:39–45. doi:10.1016/j.cca.2019.01.011
37. Liang Q, Ma D, Gao RF, Yu KD. Effect of Ki-67 expression levels and histological grade on breast cancer early relapse in patients with different immunohistochemical-based subtypes. Sci Rep. 2020;10(1):7648. doi:10.1038/s41598-020-64523-1
 © 2023 The Author(s). This work is published and licensed by Dove Medical Press Limited. The
full terms of this license are available at https://www.dovepress.com/terms
and incorporate the Creative Commons Attribution
- Non Commercial (unported, 3.0) License.
By accessing the work you hereby accept the Terms. Non-commercial uses of the work are permitted
without any further permission from Dove Medical Press Limited, provided the work is properly
attributed. For permission for commercial use of this work, please see paragraphs 4.2 and 5 of our Terms.
© 2023 The Author(s). This work is published and licensed by Dove Medical Press Limited. The
full terms of this license are available at https://www.dovepress.com/terms
and incorporate the Creative Commons Attribution
- Non Commercial (unported, 3.0) License.
By accessing the work you hereby accept the Terms. Non-commercial uses of the work are permitted
without any further permission from Dove Medical Press Limited, provided the work is properly
attributed. For permission for commercial use of this work, please see paragraphs 4.2 and 5 of our Terms.
Recommended articles
A Novel lncRNA Panel for Risk Stratification and Immune Landscape in Breast Cancer Patients

Li C, Wang X, Chen T, Li W, Yang Q
International Journal of General Medicine 2022, 15:5253-5272
Published Date: 27 May 2022
RuleFit-Based Nomogram Using Inflammatory Indicators for Predicting Survival in Nasopharyngeal Carcinoma, a Bi-Center Study
Luo C, Li S, Zhao Q, Ou Q, Huang W, Ruan G, Liang S, Liu L, Zhang Y, Li H
Journal of Inflammation Research 2022, 15:4803-4815
Published Date: 24 August 2022
Establishment and Validation of a Model for Disease-Free Survival Rate Prediction Using the Combination of microRNA-381 and Clinical Indicators in Patients with Breast Cancer
Shen J, Wang M, Li F, Yan H, Wang R, Zhou J
Breast Cancer: Targets and Therapy 2022, 14:375-389
Published Date: 30 November 2022
Chromobox Family Proteins as Putative Biomarkers for Breast Cancer Management: A Preliminary Study Based on Bioinformatics Analysis and qRT-PCR Validation
Tian H, Zhao T, Li Y, Sun N, Ma D, Shi Q, Zhang G, Chen Q, Zhang K, Chen C, Zhang Y, Qi X
Breast Cancer: Targets and Therapy 2022, 14:515-535
Published Date: 30 December 2022
Prognostic Significance of Preoperative Lactate Dehydrogenase to Albumin Ratio in Breast Cancer: A Retrospective Study
He J, Tong L, Wu P, Wu Y, Shi W, Chen L
International Journal of General Medicine 2023, 16:507-514
Published Date: 8 February 2023