Back to Journals » International Journal of General Medicine » Volume 15
A Novel lncRNA Panel for Risk Stratification and Immune Landscape in Breast Cancer Patients
Authors Li C, Wang X, Chen T, Li W, Yang Q
Received 21 March 2022
Accepted for publication 18 May 2022
Published 27 May 2022 Volume 2022:15 Pages 5253—5272
DOI https://doi.org/10.2147/IJGM.S366335
Checked for plagiarism Yes
Review by Single anonymous peer review
Peer reviewer comments 2
Editor who approved publication: Dr Scott Fraser
Chen Li,1 Xiaolong Wang,1 Tong Chen,1 Wenhao Li,1 Qifeng Yang1– 3
1Department of Breast Surgery, General Surgery, Qilu Hospital, Cheeloo College of Medicine, Shandong University, Jinan, Shandong, People’s Republic of China; 2Department of Pathology Tissue Bank, Qilu Hospital, Cheeloo College of Medicine, Shandong University, Jinan, Shandong, People’s Republic of China; 3Research Institute of Breast Cancer, Shandong University, Jinan, Shandong, People’s Republic of China
Correspondence: Qifeng Yang, Department of Breast Surgery, General Surgery, Qilu Hospital, Cheeloo College of Medicine, Shandong University, Jinan, Shandong, 250012, People’s Republic of China, Email [email protected]
Purpose: In recent years, breast cancer (BC) has been a primary cause of mortality in women. However, the underlying mechanisms remain to be elucidated. Accumulating evidence has supported the hypothesis that long noncoding RNAs (lncRNAs) play central roles in the progression of cancer. We aimed to construct an immune-related lncRNA panel to predict the prognosis of patients with BC and evaluate the immune features.
Methods: The expression profiles of patients with BC were obtained from The Cancer Genome Atlas (TCGA) database to screen the differentially expressed lncRNAs (DELs). Pearson’s correlation analysis was employed to filter the DELs related to the immune-associated genes. Univariate Cox regression, the LASSO algorithm, and multivariate Cox regression analyses were conducted to establish the model. Functional enrichment analyses and biological experiments were performed to explore the immune activity of the lncRNA panel.
Results: A four-immune-related lncRNA panel (IRLP) composed of AC022196.1, ARHGAP26-AS1, DPYD-AS1 and PURPL was established in TCGA training cohort. The prognostic accuracy of the predictive model was confirmed in TCGA internal validation cohort, TCGA entire cohort and Qilu external validation cohort. Bioinformatics analyses indicated that the IRLP had a close relationship with tumour infiltrating immune cells and immunomodulatory biomarkers. The biological functions of the four immune-related lncRNAs in BC were first investigated in vitro and in vivo. PURPL was indicated to play a central role in the regulation of macrophage recruitment and polarization via CCL2.
Conclusion: Our study identified IRLP as a reliable prognostic indicator with great potential for clinical application in personalized immunotherapy.
Keywords: breast cancer, lncRNA, immune, prognosis, risk score
Graphical Abstract:

Plain Language Summary
Our team built an immune-related lncRNA panel for predicting the prognosis of patients with breast cancer. We performed bioinformatics analyses to show that the lncRNA panel had a close relationship with tumour-infiltrating immune cells and immunomodulatory biomarkers. In addition, we explored the biological functions of selected lncRNAs using in vitro and in vivo assays. Notably, the lncRNA PURPL exerted obvious effects on the recruitment of macrophages by promoting CCL2 release. Our study revealed that the lncRNA panel might be a reliable prognostic model in personalized immunotherapy.
Introduction
According to Global Cancer Statistics 2020, with 2,261,419 newly diagnosed cases and 684,996 deaths occurring worldwide, breast cancer (BC) continues to be the chief cause of cancer-associated mortality in females.1 Hence, explorations of better risk assessment algorithms and more reliable prognostic biomarkers are urgently needed to improve the prognosis of patients with BC.
Accumulating evidence has proven that escape of immune surveillance is a crucial step in the pathogenesis of malignancies.2 With an in-depth understanding of the immune system, immunotherapeutic modulation in the tumour microenvironment (TME) has emerged as an encouraging treatment option for multiple malignancies.3 Although a previously held hypothesis indicated that BC was a poorly immunogenic cancer phenotype, recent investigations have revealed that certain types of BC exhibit robust infiltration of immune cells, which obviously influences the overall survival (OS) of patients.4 Thus, immunotherapy might be a promising therapeutic modality for patients with BC.
In recent years, noncoding RNAs (ncRNAs) have emerged as a class of transcripts that are encoded by the genome but rarely translated into proteins.5 Initially considered transcriptional noise, ncRNAs were proven to play essential roles in multiple physiological and pathological processes.6 Long noncoding RNAs (lncRNAs), a group of ncRNAs with sizes > 200 nucleotides, have been extensively investigated mainly in the past decade.7 These transcripts contribute to the regulation of chromatin dynamics and gene expression, and participate in the progression of cancer. Importantly, lncRNAs play pivotal roles in tumour growth, metastasis and chemoresistance.8 In addition, initiation of the immune response in the TME was reported to be correlated with lncRNA dysregulation.9 A tumour-promoting lncRNA, named LINK-A, hampers antigen presentation of cancer cells and attenuates intrinsic immune stimulation.10 LincR-Ccr2-5′AS is a key regulator of the pulmonary infiltration of TH2 cells.11
Despite the dilemma in studying the large number of lncRNAs, next-generation sequencing provides a promising solution to reveal their functions in multiple malignancies.12 Utilizing bioinformatics tools and biological experiments, Xu et al13 revealed a group of lncRNAs associated with the stimulation of the immune system in BC. Lai et al14 established an immune-related lncRNA model to further assess the accuracy of prognosis predictions for patients with BC.
In the present study, univariate Cox regression, LASSO algorithm and multivariate Cox regression analyses of immune-related lncRNA expression profiles were employed to construct a novel 4-immune-related-lncRNA panel (IRLP). The biological functions of the prognostic indicators were further investigated in vitro and in vivo. AC022196.1, ARHGAP26-AS1, DPYD-AS1 and PURPL potentially play central roles in the proliferation and metastasis of BC.
Materials and Methods
Data Source
The lncRNA profiles and clinical data of BC and normal specimens were accessed from TCGA (http://tcga-data.nci.nih.gov/tcga/). A total of 1082 patients were randomly and equally divided into the training cohort (n = 541) and the internal validation cohort (n = 541). LncRNAs with missing expression values in > 50% of all samples were excluded. Finally, 7180 lncRNAs were selected for further research.
One hundred eight patients diagnosed with BC from July 2008 to December 2020 at Qilu Hospital, Shandong University (Jinan, China) were enrolled in our study to perform independent external validation. Frozen BC samples were used to experimentally confirm the prognostic value of the IRLP. This study was approved by the Ethical Committee on Scientific Research of Shandong University Qilu Hospital and complied with the Declaration of Helsinki. Informed consent was obtained from all patients.
Screening of Differentially Expressed lncRNAs (DELs)
For detection of the DELs, the raw counts from BC tissues and adjacent normal tissues were converted into log2-transformed TPM. We used the R package “limma” to filter the upregulated and downregulated lncRNAs with a threshold of 1 for the log fold change and an adjusted FDR < 0.01. We utilized the R package “pheatmap” to obtain a heatmap.
Detection of Immune-Related lncRNAs (IRLs)
To detect lncRNAs which participated in immune system, 2483 immune-related genes (IRGs) were searched from the ImmPort. After excluding IRGs with missing values in > 50% of all specimens in TCGA dataset, a panel of 1402 IRGs was selected for further analysis.
Pearson’s correlation analysis was employed to assess the association between IRGs and DELs. A total of 1261 immune-related DELs (IRDELs) were identified with a strong correlation with more than one IRG (p < 0.001 and |R| > 0.4).
Identification of Prognostic IRLs
Univariate Cox regression analysis was performed to acquire 104 IRDELs in the training cohort and determine the prognostic value of the IRDELs (p < 0.05). We subsequently screened the lncRNAs using the LASSO algorithm. The packages “survival” and “glmnet” were utilized to construct a LASSO model. Thirteen candidate lncRNAs were retained for the multivariate Cox regression analysis. Finally, we identified 4 IRDELs (p < 0.01). The coefficient for each lncRNA was determined to establish the lncRNA panel in BC.
The IRLP was formulated as follows:

where N is the number of lncRNAs, Expression represents the expression level of lncRNAs, and the coefficient is the lncRNA coefficient in the multivariate Cox regression model.
Evaluation of the Prognostic Prediction Model
Kaplan–Meier analysis, univariate and multivariate Cox regression analyses and receiver operating characteristic (ROC) curve analysis were utilized to assess the discrimination capacity of the IRLP.
Functional Enrichment Analysis
The Gene Ontology (GO) enrichment analysis was performed using online software (https://david.ncifcrf.gov/). Gene set variation analysis (GSVA) was used to search for processes that differed between the two cohorts. The R package “GSVA” was applied to perform the analysis. Gene set enrichment analysis (GSEA) was performed using GSEA 4.1.0 software. The R packages “plyr”, “ggplot2”, “RColorBrewer”, “gridExtra”, “grid” and “cowplot” were employed to present the results.
Evaluation of Infiltrating Immune Cells
An analysis of infiltrating immune cells was performed to explore the populations of tumour-infiltration cells in different risk cohorts and examine the potential biological activities of lncRNAs in the IRLP. The analytical tool called CIBERSORT (https://cibersortx.stanford.edu/) was used to calculate the relative proportions of twenty-two types of infiltrating immune cells (LM22) in BC tissues.
Cell Culture
The human breast cancer cell lines MDA-MB-231, MCF-7, MDA-MB-468 and human monocytic THP-1 cells used in this study were purchased from American Type Culture Collection (ATCC, Manassas, VA, USA) and maintained as described in our previous studies.15,16 MDA-MB-231, MCF-7 and MDA-MB-468 were routinely maintained in high glucose DMEM (Hyclone, UT, USA) with 10% fetal bovine serum (Gemini, CA, USA), and 1% penicillin-streptomycin (Macgene, Beijing, China) at a 37 °C cell culture incubator with 5% CO2. Human THP-1 cells were cultured in RPMI 1640 medium (Hyclone, UT, USA) with 10% fetal bovine serum (Gemini, CA, USA), and 1% penicillin-streptomycin at a 37 °C cell culture incubator with 5% CO2. Phorbol-12-myristate-13-acetate (PMA)-activated THP-1 cells were used as human macrophages.
Plasmid Construction and Transfection
AC022196.1, ARHGAP26-AS1, DPYD-AS1 and PURPL were cloned into the pEnCMV vector for gain-of-function assays, while the PCDH vector was utilized to construct PURPL overexpression plasmids for in vivo assays. The pEnCMV or PCDH empty vectors without target sequences were used as negative controls. Transfection was conducted with Lipofectamine 2000 (Invitrogen) according to the manufacturer’s protocol. Puromycin (0.5 μg/mL) was used to establish a stable PURPL-overexpressing cell line.
RNA Extraction and Quantitative Real Time-PCR (qRT–PCR)
Total RNA was extracted from whole-cell lysates with TRIzol reagent (Invitrogen, Carlsbad, CA, USA) according to the manufacturer’s protocol. A PrimeScript reverse transcriptase reagent kit (TaKaRa, Shiga, Japan) was used to synthesize cDNAs, according to the manufacturer’s protocol. qRT–PCR was performed using SYBR Premix Ex Taq I. The primers used in the study are listed in Supplementary Table 1. β-Actin was used as an internal control.
MTT (3-(4,5-Dimethyl-2-Thiazolyl)-2,5–Diphenyl-Tetrazolium Bromide) Assay
Transfected cells were seeded in 96-well culture plates. After incubation, 20 μL of MTT (Sigma, St. Louis, MO, USA) was added into the medium and incubated for another 6 h at 37°C. Then, the supernatants were carefully removed, and 100 μL DMSO was added to each well. The proliferation curves were determined by calculating the relative value of absorbance values measured by a Microplate Reader (Bio-Rad, Hercules, CA, USA) at 490 nm.
5-Ethynyl-2’-Deoxyuridine (EdU) Incorporation Assay
Cells were seeded into 96-well plates at a density of 1×10⁴ cells/well. The EdU incorporation assay kit (RiboBio, China) was used to assess cell proliferation. After incubation with 50 mM EdU for 2 h, the cells were fixed with 4% paraformaldehyde (PFA) and stained with Apollo Dye Solution. Hoechst 33342 was used to stain the nucleic acid. A fluorescence microscope (Nikon, Japan) was used to obtain images.
Scratch Assay
After transfected with selected genes, cells were seeded in a 24-well plate and incubated in DMEM containing 10% FBS until a confluent monolayer had formed. Then a sterile 10 μL plastic pipette tip was used to create a cell-free “scratch” on the single cell layer and a horizontal line at the back of the plate was drawn as reference for image acquisition. After washing with PBS to remove cellular debris. The plate was incubated in serum-free DMEM at 37°C and the images were captured using an Olympus light microscope at the indicated times as described.
Macrophage Polarization Experiment
The effect of BC cells on the polarization of macrophages was detected using a transwell apparatus (Thermo Fisher, Waltham, MA USA). THP-1 cells were treated with 150 ng/mL PMA for macrophage differentiation. BC cells transfected with PURPL-expressing or control vector were plated in upper insert and cocultured with THP-1 derived macrophages. After 48 h, the relative mRNA levels of ARG1 and iNOS in cells from the lower chamber were detected using qRT–PCR.
Chemotaxis Assay
These experiments were conducted using a 24-well transwell system with 8 μm pore size (Corning, Lowell, MA, USA). THP-1-derived macrophages were seeded into the upper chamber, and BC cells were seeded into the bottom wells and cultured in serum-free medium. After coculture for 48 h, the chamber was fixed with 4% paraformaldehyde and then stained using 0.1% crystal violet (Sigma, St. Louis, MO, USA). Each assay was performed in triplicate. Cells were counted using a microscope at a magnification of 100×. Five random fields per chamber were observed to count invaded cell numbers.
In vivo Xenograft Tumorigenicity Assay
Female BALB/c nude mice (4–5 weeks old) were used to establish the xenograft model. MDA-MB-231 cells transfected with the PURPL-expressing or control vector were injected subcutaneously into the right flanks of nude mice. The tumour volume was calculated as follows: volume = width2 × length ÷ 2. After 15 days, all mice were euthanized through inhalation of 5% isoflurane for 3 min and sacrificed via cervical dislocation. The animal experiments were performed in strict accordance with the Guidelines for the Care and Use of Laboratory Animals of Shandong University. All animal procedures were approved by the Ethical Committee on Scientific Research of Shandong University Qilu Hospital (licence number: 21106).
Histological Examination and Immunohistochemical Staining (IHC)
Formalin-fixed tumours were sectioned and embedded with paraffin using a routine procedure. Mouse tumour sections were prepared for H&E staining and IHC using standard protocols as previously reported.17 An antibody against the F4/80 antigen (Cell Signaling Technology, Cat# 70076) was applied to examine tumour-infiltrating macrophages. Sections were imaged at 20× magnification with a digital camera (Leica, Wetzlar, Germany).
Statistical Analysis
All assays were performed in triplicate. Statistical analyses in the study were performed with SPSS (version 23.0) and GraphPad Prism 8.0 software. Significant differences were evaluated using Student’s t test and one-way analysis of variance (ANOVA). P < 0.05 was considered statistically significant.
Results
Clinicopathological Features of Patients with BC
In the present study, 1082 patients with BC who had prognostic information in TCGA project were separated into a training cohort (n = 541) and internal validation cohort (n = 541) using a random number table In addition, 108 patients with BC and prognostic information who were treated at Qilu Hospital were enrolled in the independent external validation cohort (Table 1).
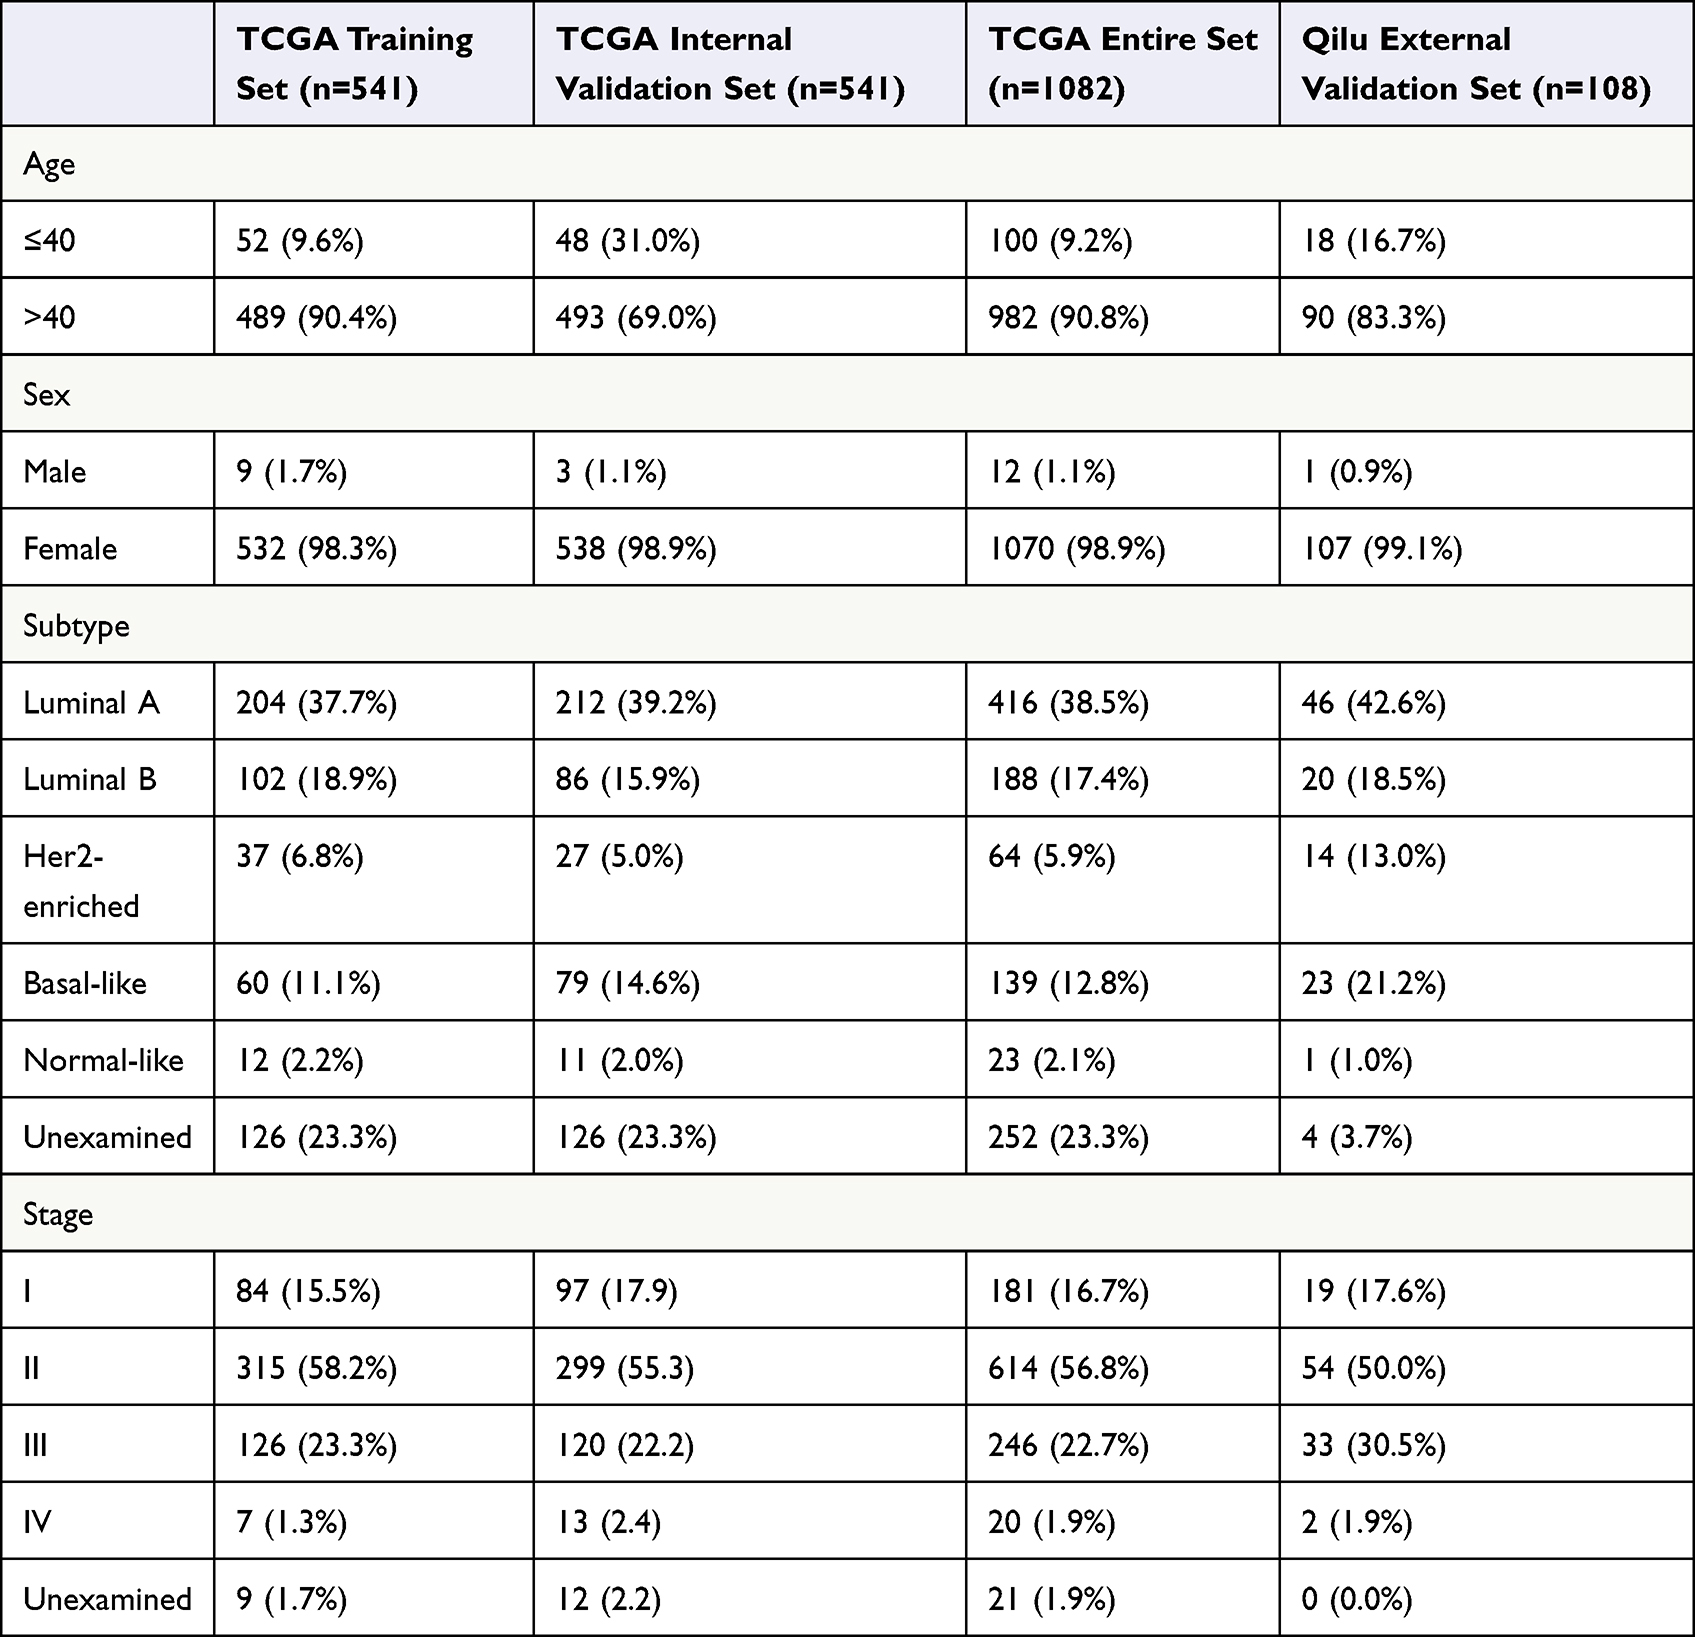 |
Table 1 Clinical Information of Breast Cancer Patients |
The age of the patients in the entire TCGA cohort was ranged from 26 to 90 years, and the median follow-up was 821 (range 1–8605) days. In addition, the age of the Qilu external validation cohort ranged from 26 to 81 years, while the median follow-up was 2825.5 (range 123–4139) days. During the follow-up period, 154/1082 (14.2%) patients died in the entire TCGA cohort, and 27/108 (25.0%) patients died in the Qilu cohort.
Identification of IRLP
The process used in the current study is shown in Figure 1.
 |
Figure 1 Flow chart showing the design of the study. |
The expression profiles of 541 tumour samples from TCGA training cohort and 113 normal breast tissue samples were used to identify DELs. Criteria were set as |FC| >2, and FDR < 0.01 (Figure 2A). A total of 2180 DELs were screened, including 657 upregulated lncRNAs and 1523 downregulated lncRNAs. Volcano plots were conducted to show the DELs (Figure 2B).
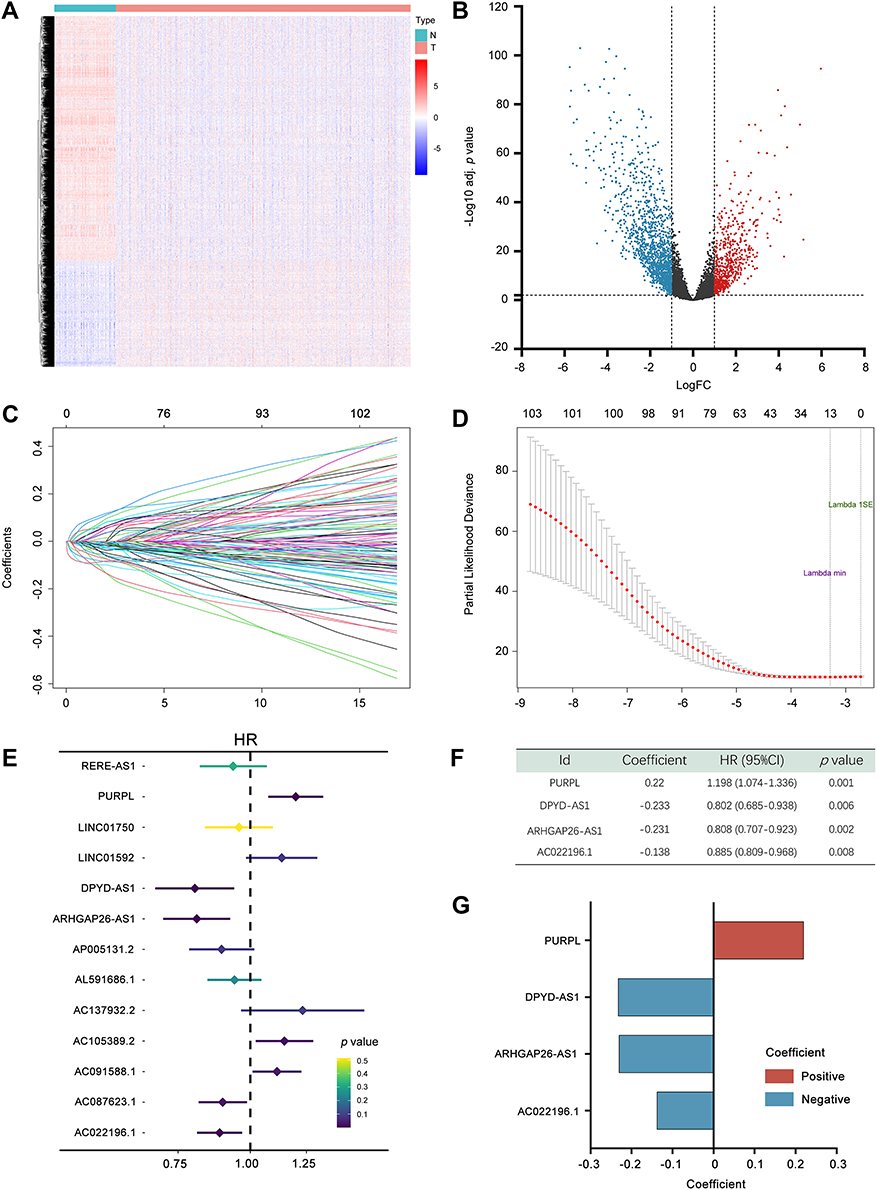 |
Figure 2 Construction of the 4-immune-related lncRNA prognostic model. (A) Heatmap representing lncRNAs that were differentially expressed between breast cancer and normal breast tissues based on a microarray analysis. (B) Volcano plot presenting all differentially expressed lncRNAs; blue dots indicate downregulated lncRNAs, and red dots indicate upregulated lncRNAs. The X-axis represents the log2 fold change, and the Y-axis represents the log-transformed adjusted p values. (C) The coefficients of variables identified using the LASSO Cox regression model. (D) Ten-fold cross validation of the LASSO regression analysis. Left and right vertical dotted lines represent the “lambda. min” and “lambda.1se” criteria, respectively. The red dots indicate partial likelihood deviance values, and the gray lines indicate the corresponding standard error. (E) Forest plots showing the relationships of each lncRNA with OS in the training cohort. (F) Multivariate Cox regression results for the 4 immune-related prognostic lncRNAs in TCGA training cohort. (G) Coefficient distribution of the IRLP. Adj. p value, adjusted p value. Abbreviations: HR, hazard ratio; CI, confidence interval. |
Pearson’s correlation analysis was adopted to assess the correlations between 2180 DELs and 1402 IRGs. |R| > 0.4 and p < 0.001 were used as the thresholds. A total of 1261 IRDELs were identified with a significant correlation with two or more IRGs.
Next, we conducted a univariate Cox regression analysis to select lncRNAs associated with the prognosis of patients with BC (p < 0.05), among which 104 lncRNAs were acquired. Based on the survival-related IRDELs, LASSO followed by stepwise multivariate Cox regression analyses (p < 0.01) were used to establish the prediction model (Figure 2C–E). Detailed information on the lncRNA panel is presented in Figure 2F and G.
Risk score = (0.22 × expression of PURPL) + (−0.233 × expression of DPYD-AS1) + (−0.231 × expression of ARHGAP26-AS1) + (−0.138 × expression of AC022196.1).
Validation of the IRLP in TCGA Cohort
In TCGA training cohort, patients were stratified based on the median risk score. The risk score distribution and OS time of each patient are shown in Figure S1A and B. The gene expression of selected lncRNAs in patients is shown in Figure S1C. Kaplan–Meier survival curves indicated that the low-risk patients had a better prognosis (HR = 4.168, 95% CI = 2.664–6.521, p < 0.001) in TCGA training cohort (Figure 3A). Univariate and multivariate Cox regression analyses were conducted to test the prognostic value of the IRLP. Risk score, age, Tumor-Node-Metastasis (TNM) stage and margin status were included as covariates (Figure 3B and C). Patients with BC in TCGA internal validation cohort and the entire TCGA cohort were classified using the same criteria to evaluate the predictive accuracy of the IRLP. The risk score distribution and survival time of each patient are visualized in Figure S1D–I. The Kaplan–Meier plot showed that patients with low risk score experienced substantially longer OS in both TCGA internal validation cohort (HR = 1.750, 95% CI = 1.109–2.763, p = 0.014) and the entire TCGA cohort (HR = 2.506, 95% CI = 1.824–3.444, p < 0.001) (Figure 3D and G). We further verified that the IRLP served as an independent prognostic factor for BC in univariate and multivariate Cox regression analyses (Figure 3E, F and H, I).
 |
Figure 3 Evaluating the predictive power of the IRLP in TCGA cohort. (A) Kaplan–Meier plot of the high‐ and low‐risk groups in the training cohort. (B and C) Forest plot of univariate (B) and multivariate (C) Cox regression analyses of TCGA training cohort. (D) Kaplan–Meier plot of the high‐ and low‐risk groups in TCGA internal validation cohort. (E and F) Forest plot of univariate (E) and multivariate (F) Cox regression analyses of TCGA internal validation cohort. (G) Kaplan–Meier plot of the high‐ and low‐risk groups in the entire TCGA cohort. (H and I) Forest plot of univariate (E) and multivariate (F) Cox regression analyses in the entire TCGA cohort. (J–L) ROC curve analysis of the risk score for predicting OS of TCGA training cohort, the internal validation cohort and the entire cohort. (M) Nomogram including the risk score and clinicopathological traits of the entire cohort. (N) Calibration plot. Abbreviations: HR, hazard ratio; CI, confidence interval. |
Moreover, we assessed the OS-predicting efficiency of the IRLP by performing a ROC curve analysis. The age and clinical stage of patients were also included candidate predictive indicators. As shown in Figure 3J, in TCGA training cohort, the risk score displayed a better prediction of the BC prognosis than other factors, with an AUC of 0.737. Moreover, a multivariate regression model was also established with the risk score, age and clinical stage. Combined risk score = (0.945× Risk score) + (0.018 × Age) + (0.369 × Clinical stage). The results revealed that the risk score combined with other prognostic factors may have a stronger power for OS prediction, with an AUC of 0.809. The ROC curves of TCGA internal validation cohort and the entire TCGA cohort were analysed, and consistent results were observed. The AUC of risk score in TCGA internal validation cohort for OS was 0.707. The predictive value of the IRLP in determining the prognosis was enhanced when applied in combination with the combination of age and clinical stage, with an AUC of 0.763 (Figure 3K). Consistently, the AUC of the risk score in the entire TCGA cohort for OS was 0.740. The prognostic value of IRLP was augmented when applied with the combination of age and clinical stage, with an AUC as high as 0.816 (Figure 3L).
Interestingly, the IRLP was associated with biological subtypes of tumours. Patients with basal-like subtype BC showed substantially higher risk scores (Figure S1J). The correlation between the IRLP and the biological subtype of breast tumours was also verified (Figure S1K and L).
For the convenience of clinical application, we established a nomogram based on six independent prognostic markers: risk score, age, T stage, M stage, N stage and clinical stage in the entire TCGA cohort (Figure 3M). As exhibited in Figure 3N, a good concordance was observed between the actual and nomogram-predicted OS at 3 and 5 years.
In the entire TCGA cohort, the predictive values of four IRLs in patients with BC were also tested separately by performing Kaplan–Meier survival analyses. As expected, higher expression levels of ARHGAP26-AS1, DPYD-AS1 and AC022196.1 were considerably correlated with a favourable prognosis compared to lower expression levels. In contrary, patients with high PURPL expression experienced vastly shorter OS than those with low-PURPL expression (Figure S1M–P).
External Validation of the IRLP in the Qilu Cohort
In the Qilu cohort, the median risk score of samples was set as the cut-off value for risk stratification of patients with BC. As shown in Figure 4A, the Kaplan–Meier survival plot revealed that the low-risk group had a substantially better prognosis (HR = 2.595, 95% CI = 1.219–5.522, p = 0.019). The time-dependent ROC plot suggested that the IRLP might be a stable predictor. Furthermore, the combination of the risks core, age and clinical stage showed a better predictive effect (Figure 4B). The risk score was confirmed as an independent predictor in both univariate (HR = 2.596, 95% CI =1.136–5.931, p = 0.024), and multivariate Cox regression analyses (HR = 3.088, 95% CI = 1.27–7.508, p = 0.013) (Figure 4C and D).
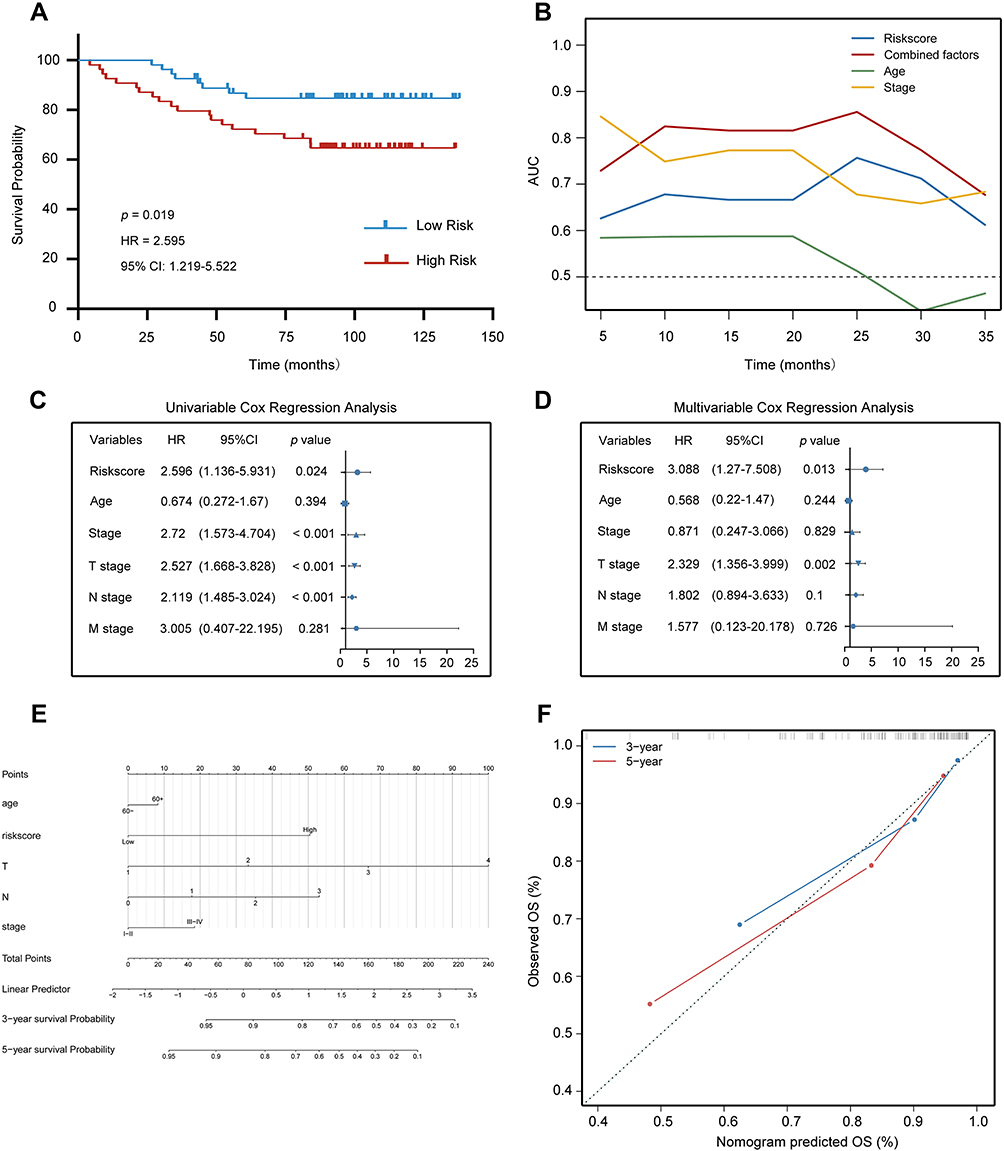 |
Figure 4 Evaluating the predictive power of the IRLP in the Qilu external validation cohort. (A) Kaplan–Meier plot of the high‐ and low‐risk groups. (B) Time-dependent ROC curve analysis for predicting OS of the Qilu external validation cohort. (C and D) Forest plot of univariate (C) and multivariate (D) Cox regression analysis showed that the risk score was an independent risk factor compared with other clinical features in the Qilu external validation cohort. (E) nomogram including the risk score and clinicopathological traits of Qilu external validation cohort. (F) Calibration plot. Abbreviations: HR, hazard ratio; CI, confidence interval. |
For the convenience of clinical application, a nomogram was constructed using the risk score plus clinical information in the Qilu cohort (Figure 4E). Six variables including the risk score, age, TNM stage and clinical stage, were incorporated in nomogram construction. The calibration curve revealed agreement between the actual value and the predicted OS probabilities at 3 and 5 years (Figure 4F).
Analysis of the Biological Functions of the Selected lncRNAs
According to the results, ARHGAP26-AS1, DPYD-AS1, AC022196.1 and PURPL might considerably influence the prognosis of patients with BC. Thus, we transfected BC cells to investigate the biological functions of these lncRNAs.
The overexpression efficiencies of the lncRNAs in BC cell lines were examined using qRT–PCR (Figures 5A, B and S2A). The proliferation of the BC cells was then determined using MTT assays (Figures 5C, D and S2B) and EdU assays (Figures 5E, F and S2C). According to the results, PURPL overexpression substantially increased the proliferation of BC cells, while ARHGAP26-AS1, DPYD-AS1 and AC022196.1 were proven to dramatically diminish cell growth.
 |
Figure 5 Gain-of-function assay of selected immune-related lncRNAs in MDA-MB-231 and MCF-7 cells. (A and B) The overexpression efficiency of selected lncRNAs. (C and D) Effects of selected lncRNAs on cell proliferation were evaluated using the MTT assay. (E and F) Effects of selected lncRNAs on cell proliferation were tested using the EdU assay. Scale bars: 100 μm. (G and H) Effects of selected lncRNAs on cell migration were verified by performing a scratch assay. Scale bars: 200 μm. *p < 0.05; **p < 0.01. |
Wound healing assays were conducted to characterize the migration capacities of BC cells. ARHGAP26-AS1, DPYD-AS1 and AC022196.1 restrained cell mobility. Meanwhile, cells transfected with PURPL exhibited a substantially increased migratory rate compared with the control cells (Figures 5G, H and S2D).
Functional Enrichment Analysis of the IRLP in BC
The entire TCGA cohort was trisected into low-, median- and high-risk score groups to investigate the correlations between the prognostic model and immune functions. High- and low-risk score groups were incorporated into a new cohort for further exploration. Pearson’s correlation analysis was employed to screen IRLP-associated genes with |R|> 0.2. Clinicopathological characteristics showed distributed patterns corresponding to the risk score (Figure 6A). Subsequently, genes positively correlated with the risk score (356 genes) and genes negatively correlated with the risk score (1021 genes) were collectively subjected to GO analysis. As revealed in Figure 6B, the most relevant biological processes included T cell-mediated immunity, regulation of complement activation, and regulation of the inflammatory response.
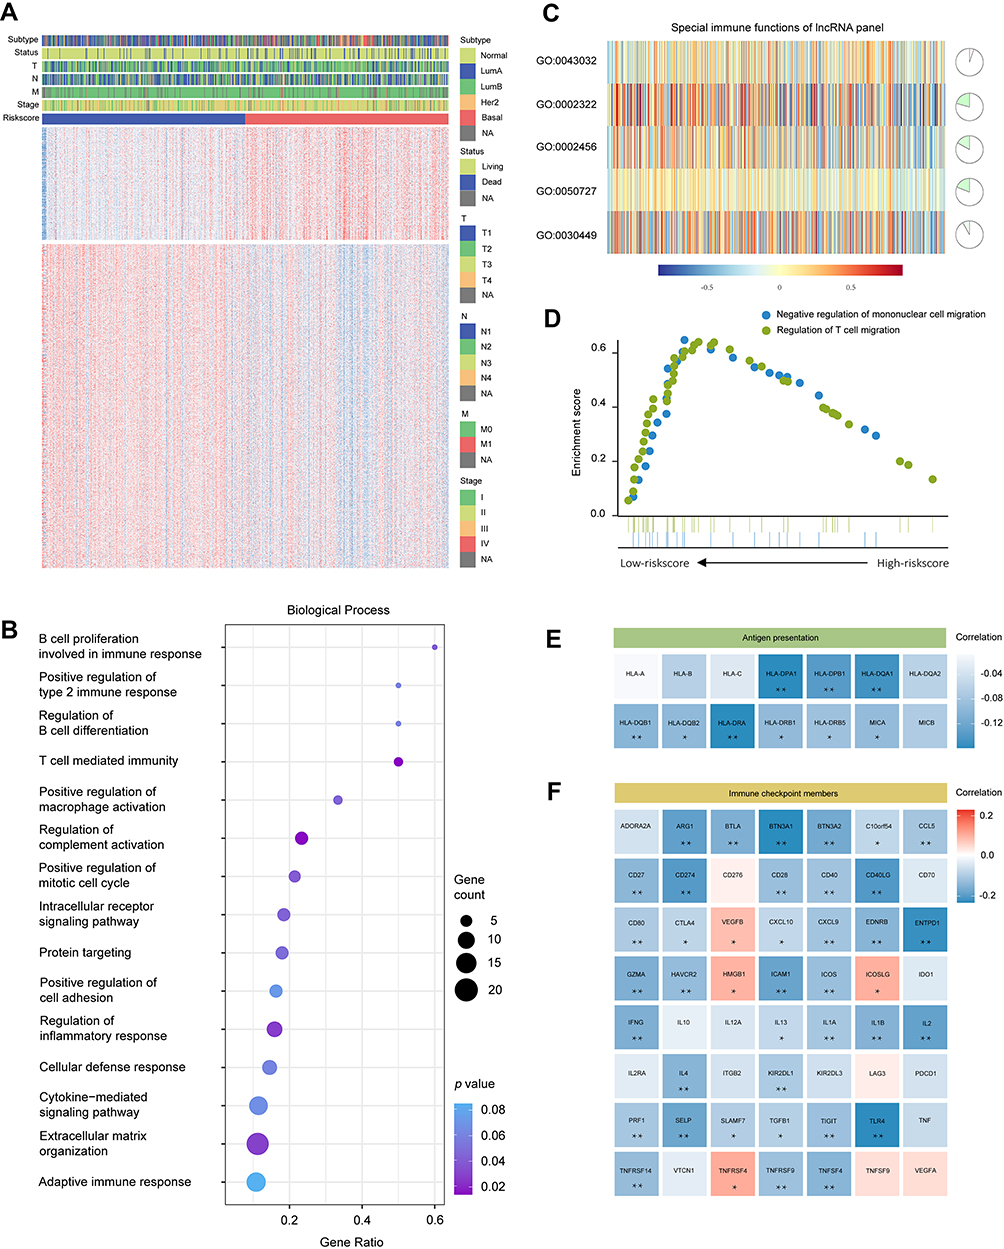 |
Figure 6 The relationship between the risk score and immune functions. (A) Heatmaps showing the genes with the strongest correlations with the risk score. (B) Biological processes of risk score-related genes. (C) The relationship between the IRLP and corresponding GO functions. (D) Gene set enrichment analysis. (E) The different expression levels of the genes associated with antigen presentation in the high- and low-risk score groups. (F) The different expression levels of immune checkpoint-related genes in high- and low-risk score groups. *p < 0.05; **p < 0.01. Abbreviations: Normal, normal-like; LumA, luminal A; LumB, luminal B; Her2, Her2-enriched; Basal, basal-like. |
GSVA was utilized to determine the correlation between the IRLP and tumour immune activities. As shown in Figure 6C, noticeable differences were observed in the positive regulation of macrophage activation (GO: 0043032), B cell proliferation involved in immune response (GO: 0002322), T cell mediated immunity (GO: 0002456), regulation of inflammatory response (GO: 0050727) and regulation of complement activation (GO: 0030449) (p < 0.05). GSEA was subsequently applied to clarify that the genes associated with the negative regulation of mononuclear cell migration and regulation of T cell migration were enriched in the low-risk score group (Figure 6D).
The immune response is modulated by various intracellular signalling pathways and diverse cell-to-cell communication systems.18 We investigated the potential mechanisms by which the IRLP regulated immune activities, by analysing the expression levels of immune modulators, including antigen presentation genes and immune checkpoint genes. According to the Pearson’s correlation analysis, a noticeably negative correlation was observed between the risk score and genes involved in antigen presentation (Figure 6E). Immune checkpoint pathways have attracted increasing attention due to their indispensable roles in regulating immune functions.19 As revealed in Figure 6F, a close relationship was observed between the risk score and the expression levels of immune checkpoint genes. Thus, the IRLP might represent a potential biomarker for patient stratification to receive immunotherapy.
Relationship Between the IRLP and Immune Cell Infiltration
Twenty-two immune-related terms were incorporated to determine the correlations of the infiltrating cells and to comprehensively characterize the landscape of TME immune cell infiltration in BC (Figure 7A). As shown in Figure 7B, we elucidated an immune cell network that depicted immune cell interactions and the prognostic value in patients with BC. Pearson’s correlation analysis was subsequently performed to determine the association between the IRLP and infiltrating immune cell populations. According to Figure 7C, the infiltration of M2 macrophages, M0 macrophages, eosinophils and resting memory CD4 T cells was strongly associated with IRLP. Notably, M2 macrophages had the greatest prognostic value among infiltrating immune cells.
 |
Figure 7 The relationship between the risk score and infiltrated immune cell populations. (A) Immune cell clustering based on the gene expression profile in the entire TCGA cohort. (B) Cellular interaction of the TME cell types in the entire TCGA cohort. (C) The relationship between immune cell populations and the IRLP. (D) The relationship between the immune cell populations and four prognostic lncRNAs. (E–H) The scatter plot shows the correlation of PURPL with the infiltration of immune cell subtypes. M2 macrophages (E), M1 macrophages (F), monocytes (G) and CD8+ T cells (H). *p < 0.05; **p < 0.01. Abbreviation: CI, confidence interval. |
Moreover, Pearson’s correlation analysis was employed to investigate the relationship between the expression of four lncRNAs and the infiltrating immune cell populations. As shown in Figure 7D, the lncRNA PURPL was probably the most important biomarker regulating the infiltration of macrophages. Subsequently, the relationship between PURPL and infiltrating macrophages was studied. M2 macrophage infiltration was vastly facilitated by high expression of PURPL (Figure 7E), whereas the infiltration of M1 macrophages was diminished (Figure 7F). In addition, PURPL regulated the infiltration of monocytes and CD8 T cells (Figure 7G and H).
PURPL Promotes the Recruitment and Polarization of Macrophages
Biological experiments were performed to verify the results of the bioinformatics analysis. The coculture system was utilized to investigate the polarization of macrophages (Figure 8A). As a human monocyte cell line, THP-1 cells are usually stimulated to differentiate into M0 macrophages by PMA treatment (Figure 8B). After coculturing human BC cell lines with PMA-induced THP-1 cells for 48 h, the expression levels of macrophage polarization markers were evaluated. PURPL overexpression in BC cells increased the ARG1 mRNA levels in THP-1-derived macrophages, whereas iNOS expression was substantially attenuated (Figures 8C, D and S3A). Thus, the expression level of PURPL in BC cells played a pivotal role in macrophage polarization in the TME. A chemotaxis assay was applied to examine the effect of PURPL on macrophage recruitments (Figure 8E). As expected, increasing the expression of PURPL in BC cells remarkably increased the migration capability of cocultured macrophages (Figures 8F–I and S3B, C). Cancer cells functionally create an anti-inflammatory microenvironment by secreting various factors.20 We hypothesized that released cytokines in the TME might play a role in the polarization and chemotaxis of macrophages. After reviewing the relevant literature, we selected ten cytokines (CCL2, CCL4, CCL5, CXCL3, IL6, IL10, CSF-1, TGF-β, IFN-γ, and TNF-α) that might regulate the polarization and recruitment of macrophages.21 The mRNA levels of these ten cytokines were assessed using qRT–PCR, and CCL2 was identified (Figures 8J, K and S3D). These data indicated a crucial role for CCL2 in PURPL-mediated macrophage recruitment and polarization.
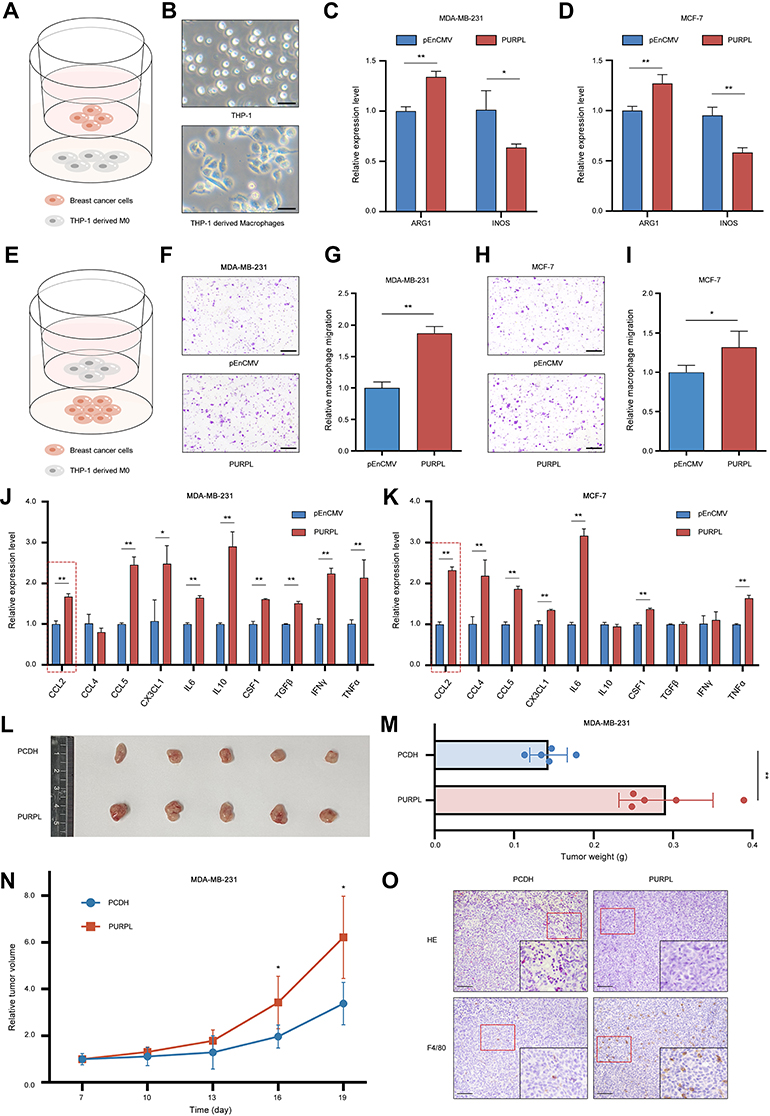 |
Figure 8 PURPL upregulation promotes the recruitment and M2 polarization of macrophages. (A) Schematic illustrating the coculture model of THP-1-derived macrophages with breast cancer cells. (B) The morphology of THP-1 cells and M0 macrophages. Scale bars: 50 μm. (C) qRT–PCR detection of ARG1 and iNOS expression in macrophages cocultured with MDA-MB-231 cells. (D) qRT–PCR detection of ARG1 and iNOS in macrophages cocultured with MCF-7 cells. (E) Schematic illustrating macrophage chemotaxis systems. (F–I) PURPL-overexpressing MDA-MB-231 (F and G) and MCF-7 (H and I) cells promoted the migration of macrophages. Five random fields per chamber were observed to count cells at a magnification of 100×. Each assay was performed in triplicate. Scale bars: 200 μm. (J) A group of cytokines related to macrophage recruitment and polarization as evaluated using qRT–PCR after coculture with PURPL-overexpressing MDA-MB-231 cells. (K) A group of cytokines related to macrophage recruitment and polarization was evaluated using qRT–PCR after coculture with PURPL-overexpressing MCF-7 cells. (L) Subcutaneous tumours formed in nude mice after the injection of MDA-MB-231 cells as described previously (n = 5 mice/group). (M) Tumour weights were measured at the endpoint of the study. (N) Tumour growth curves were recorded every 3 days after subcutaneous injection in nude mice. (O) Representative tumour infiltration of F4/80+ macrophages, as determined using IHC. Scale bars: 100 μm. *p < 0.05; **p < 0.01. |
We examined whether overexpressing PURPL promoted tumour growth in a xenograft model to further determine the role of PURPL in vivo. Consistently, mice containing cells transfected with PURPL had distinctly larger tumour volumes and weights than the control group (Figure 8L–N). All mice were sacrificed after 19 days. IHC analyses of all tumour sections revealed a noticeable increase in the macrophage density, as indicated by the expression of the macrophage marker F4/80, in the PURPL-overexpressing group (Figure 8O). All these data suggested that PURPL substantially contributed to BC progression by promoting the infiltration of macrophages in vivo.
Discussion
BC is the most frequently diagnosed cancer worldwide.22 Due to progress in conventional treatments, such as surgery, chemotherapy, radiotherapy, hormonal therapy and anti-HER2 therapy, the mortality of BC has decreased.23 However, the prognoses of patients are still unsatisfactory. Recent studies have shown that BC is a highly heterogeneous malignancy with distinct biological characteristics. Various staging systems have been reported to predict the clinical outcomes of patients with BC, such as the TNM classification,24 the Nottingham Prognostic Index (NPI),25 St. Gallen criteria26 and Veridex signature.27 Due to the current limitation on statistical property of conventional risk stratification systems, it was demonstrated by a number of researches that multigene signatures calculated by systematic analysis might work as more precise prognostic biomarkers than the traditional clinicopathologic features.28
To date, an increasing number of functional genomic studies have documented an indispensable role for ncRNAs in the progression of neoplasms.29 In BC, Liang et al30 reported that the lncRNA BCRT1 facilitates tumour growth via the miR-1303/PTBP3 axis. According to the results reported by Xiu et al.,31 LINC02273 drives BC metastasis by epigenetically increasing AGR2 transcription. In addition, the lncRNA DILA1 exerts a noticeable inhibitory effect on cyclin D1 degradation and contributes to tamoxifen resistance.32
The immune microenvironment contributes to the progression, metastasis and recurrence of BC, resulting in an unfavourable prognosis. In-depth exploration of the immunologic patterns of the TME has contributed to the rapid development of diverse novel immunotherapeutic strategies as well as the investigation of emerging biomarkers for clinical application.33 LncRNAs play indispensable roles in regulating the immune response and immune cell infiltration during the progression of cancer. Cao et al34 suggested that the lncRNA-MM2P modulates macrophage M2 polarization. In BC studies, GATA3-AS1 was proven to promote tumour growth and suppress immune activation by protecting PD-L1 from degradation.35 Moreover, the lncRNA SNHG1 was proven to manipulate the maturation of Treg cells and impede the immune surveillance through the miR-448/IDO signalling pathway.36
Over the past few decades, the rapid development of RNA-seq technology has resulted in it becoming one of the most frequently utilized approaches, providing us with a new method to investigate human diseases at the molecular level.37 Based on high-throughput sequencing data, an analysis of the molecular profile revealed that specific genotypes might be associated with the TME.38 In the study by Tekpli et al,39 patients with BC from 15 gene expression datasets were divided into three clusters with gradually increasing levels of immune cell infiltration. In recent years, RNA sequencing studies have elucidated the vital roles of lncRNAs in regulating the immune response, inflammation and immune cell infiltration. A lncRNA signature of tumour-infiltrating B lymphocytes constructed by Zhou et al38 showed enormous predictive value for therapeutic response to anti-PD-1 treatment. Sun et al40 identified a lncRNA signature as an indicator of immune cell infiltration of the tumour.
Here, we aimed to construct an immune-based lncRNA risk prediction panel for patients with BC. Four IRLs, AC022196.1, ARHGAP26-AS1, DPYD-AS1 and PURPL, were screened according to the survival information and correlation with immune genes. An immune-related prognostic model was built based on these indicators. The median risk score was set as the cut-off value. The prognostic accuracy of the panel was validated in the TCGA training cohort, the internal validation cohort, the entire cohort and the Qilu external validation cohort. Furthermore, we found that patients with triple-negative BC showed a strikingly higher risk score than patients with other subtypes. Univariate Cox regression, multivariate Cox regression and ROC curve analyses were employed to verify the accuracy of the IRLP prediction. All of these results indicated that IRLP might represent an effective risk factor for patients with BC.
Additionally, we employed functional enrichment analyses to explore the relationship between the IRLP and the immune landscape. The GO analysis is a community-based bioinformatics resource that provides structured, computable knowledge of genes and gene products.41 Developed in 1998, GO analysis has been widely adopted in the life sciences and has become a routine resource for the functional investigation of gene lists.42 In the present study, the risk score-associated genes were evaluated using GO analysis. Our results revealed that the IRLP might play a pivotal role in regulating macrophage activation and manipulating T cell mediated immunity. Moreover, GSEA is a powerful analytical tool that estimates whether a priori defined group of genes exhibits differences between two biological states.43 GSEA revealed that the risk score enormously influenced the migration capability of mononuclear cells and T cells in our study.
As an emerging novel treatment option, immunotherapy has attracted increasing attention in recent years. However, distinguishing patients who might benefit from this therapy is still a great challenge for physicians.44 Antigen presentation is a comprehensive biological process that consists of the production, peptide loading, and localization of MHC molecules.45 Alteration of the antigen processing and presentation pathways is a central element in the dysregulation of immune surveillance.46 We examined various genes corresponding to antigen presentation. According to our results, antigen presentation was remarkably attenuated in the high-risk subgroup. Immune checkpoints are defined as various inherited inhibitory pathways that are important for modulating the duration and intensity of physiological immune responses to reduce tissue damage.19 However, as a pivotal immune resistance mechanism, immune checkpoint proteins are dysregulated by tumours during cancer development.47 Blockade of immune checkpoints might considerably modulate innate and adaptive immune cells and improve the prognosis of patients with cancer.48 Our findings revealed that the risk score exhibited an obvious correlation with immune checkpoint family members. Therefore, the IRLP potentially represents a sensitive indicator for a disrupted antigen presentation pathway and altered immune checkpoint status.
The cell types in the TME play pro- or antitumorigenic roles in tumour progression. Interactions among immune cells, stromal cells, and secreted chemokines might construct premetastatic niches for cancer cells that circulate in the bloodstream.49 The knowledge of the intricate interactions would assist us exploring tumour immune evasion mechanisms and guide the clinical practice of immunotherapies.50 Based on TCGA dataset, we comprehensively analysed the landscape of tumour-infiltrating immune cells. M2 macrophages played key roles in determining the prognosis of patients with BC. According to the bioinformatics analysis, the IRLP was closely related to the phenotype of M2 macrophages, which probably explained the worse prognosis of the high-risk group at the level of tumour immunity. Additionally, according to the results of the Pearson’s correlation analysis, PURPL was assumed to be the central regulator of the infiltration and polarization of macrophages. According to the results of biological assays, PURPL substantially facilitated M2 polarized macrophages in the coculture system, consistent with the results of the bioinformatics analyses.
Cytokines are soluble, low molecular weight secretory proteins that modulate immune and inflammatory responses by controlling the proliferation, differentiation, and activation of immune cells. Based on the substantial research on cancer immunology, these secreted factors in the TME were shown to affect cancer progression by targeting tumour cells directly or mediating the recruitment of immune cells.51 CCL2 is recognized as a chemoattractant for monocytes, memory T lymphocytes, and natural killer (NK) cells.52 In human BC, CCL2 expression correlated with macrophage infiltration in the TME.53 In our study, we overexpressed PURPL in BC cell lines and the mRNA levels of ten chemokines were determined. We showed that PURPL strikingly facilitated the recruitment and polarization of macrophages by inducing secretion of CCL2.
Compared with previous studies, the superiority of the present research was the inclusion of our individual cohort from Qilu Hospital for external validation. Furthermore, cell-based experiments were performed to explore the biological functions of selected indicators. AC022196.1, ARHGAP26-AS1 and DPYD-AS1 were first reported to function as tumour suppressor genes. However, our study still had some drawbacks. Gene expression in diverse datasets was not detected using the same sequencing platform, which probably led to inaccuracy. Additionally, the clinical traits of the patients were relatively deficient. The prediction efficiency would be further improved by including more comprehensive clinical factors.
Conclusions
In this study, we established an IRLP to legitimately predict the prognosis and immune status of patients with BC. According to the bioinformatics analysis, the selected lncRNAs were found to be strongly associated with the tumour immune landscape. PURPL was proven to play an indispensable role in macrophage recruitment and polarization. Our research provides a promising strategy to guide clinical assessment, facilitating the further investigation of individualized immunotherapy in BC treatment.
Abbreviations
TCGA, The Cancer Genome Atlas; DELs, differentially expressed lncRNAs; IRL, immune-related lncRNA; IRG, immune-related gene; FDR, false-discovery rate; LASSO, the least absolute shrinkage and selection operator; ROC, Receiver operating characteristic; AUC, area under the ROC curve; IRLP, four-immune-related-lncRNA panel; OS, overall survival; ncRNA, noncoding RNAs; lncRNAs, Long noncoding RNAs; TME, the tumor microenvironment; qRT-PCR, quantitative Real-Time PCR; FC, fold change; FDR, false-discovery rate; IRDELs, immune-related DELs; GO, Gene ontology; MF, molecular function; BP, biological process; CC, cellular component; GSVA, Gene set variation analysis; GSEA, Gene set enrichment analysis; NK, natural killer.
Data Sharing Statement
All data relevant to the study can be found in supplementary materials or online repositories. The names of the repository/repositories and accession number(s) can be found below: https://figshare.com/, https://doi.org/10.6084/m9.figshare.c.5756168.v1.
Ethics Approval and Informed Consent
This study was approved by the Ethical Committee on Scientific Research of Shandong University Qilu Hospital (licence number: 21106) and complied with the Declaration of Helsinki. Informed consent was obtained from all patients.
Author Contributions
All authors made a significant contribution to the work reported, whether that is in the conception, study design, execution, acquisition of data, analysis and interpretation, or in all these areas; took part in drafting, revising or critically reviewing the article; gave final approval of the version to be published; have agreed on the journal to which the article has been submitted; and agree to be accountable for all aspects of the work.
Funding
This work was supported by National Key Research and Development Program (No. 2020YFA0712400), Special Foundation for Taishan Scholars (No. ts20190971), National Natural Science Foundation of China (No. 81874119; No. 82072912; No. 82004122), China Postdoctoral Science Foundation (No. 2020M682199), Shandong Provincial Natural Science Foundation, China (No. ZR2020QH335, No. ZR2019LZL003), Special Support Plan for National High Level Talents (Ten Thousand Talents Program W01020103), National Key Research and Development Program (No. 2018YFC0114705), Chen Xiao-ping Foundation for the Development of Science and Technology of Hubei Province (CXPJJH121001-2021003), Foundation from Clinical Research Center of Shandong University (No.2020SDUCRCA015), Qilu Hospital Clinical New Technology Developing Foundation (No. 2018-7; No. 2019-3).
Disclosure
The authors declare that there are no conflicts of interest.
References
1. Sung H, Ferlay J, Siegel RL, et al. Global cancer statistics 2020: GLOBOCAN estimates of incidence and mortality worldwide for 36 cancers in 185 countries. CA Cancer J Clin. 2021;71(3):209–249. doi:10.3322/caac.21660
2. Marin-Acevedo JA, Kimbrough EO, Lou Y. Next generation of immune checkpoint inhibitors and beyond. J Hematol Oncol. 2021;14(1):45. doi:10.1186/s13045-021-01056-8
3. Gupta RG, Li F, Roszik J, Lizée G. Exploiting tumor neoantigens to target cancer evolution: current challenges and promising therapeutic approaches. Cancer Discov. 2021;11(5):1024–1039. doi:10.1158/2159-8290.CD-20-1575
4. Hammerl D, Smid M, Timmermans AM, Sleijfer S, Martens JWM, Debets R. Breast cancer genomics and immuno-oncological markers to guide immune therapies. Semin Cancer Biol. 2018;52(Pt 2):178–188. doi:10.1016/j.semcancer.2017.11.003
5. Khalil AM, Guttman M, Huarte M, et al. Many human large intergenic noncoding RNAs associate with chromatin-modifying complexes and affect gene expression. Proc Natl Acad Sci U S A. 2009;106(28):11667–11672. doi:10.1073/pnas.0904715106
6. Kung JT, Colognori D, Lee JT. Long noncoding RNAs: past, present, and future. Genetics. 2013;193(3):651–669. doi:10.1534/genetics.112.146704
7. Crudele F, Bianchi N, Reali E, Galasso M, Agnoletto C, Volinia S. The network of non-coding RNAs and their molecular targets in breast cancer. Mol Cancer. 2020;19(1):61. doi:10.1186/s12943-020-01181-x
8. Bhan A, Soleimani M, Mandal SS. Long noncoding RNA and cancer: a new paradigm. Cancer Res. 2017;77(15):3965–3981. doi:10.1158/0008-5472.CAN-16-2634
9. Luo Y, Yang J, Yu J, et al. Long non-coding RNAs: emerging roles in the immunosuppressive tumor microenvironment. Front Oncol. 2020;10:48. doi:10.3389/fonc.2020.00048
10. Hu Q, Ye Y, Chan LC, et al. Oncogenic lncRNA downregulates cancer cell antigen presentation and intrinsic tumor suppression. Nat Immunol. 2019;20(7):835–851. doi:10.1038/s41590-019-0400-7
11. Hu G, Tang Q, Sharma S, et al. Expression and regulation of intergenic long noncoding RNAs during T cell development and differentiation. Nat Immunol. 2013;14(11):1190–1198. doi:10.1038/ni.2712
12. Bhan A, Mandal SS. Long noncoding RNAs: emerging stars in gene regulation, epigenetics and human disease. ChemMedChem. 2014;9(9):1932–1956. doi:10.1002/cmdc.201300534
13. Xu S, Kong D, Chen Q, Ping Y, Pang D. Oncogenic long noncoding RNA landscape in breast cancer. Mol Cancer. 2017;16(1):129. doi:10.1186/s12943-017-0696-6
14. Lai J, Chen B, Zhang G, Li X, Mok H, Liao N. Molecular characterization of breast cancer: a potential novel immune-related lncRNAs signature. J Transl Med. 2020;18(1):416. doi:10.1186/s12967-020-02578-4
15. Zhang H, Zhang N, Liu Y, et al. Epigenetic regulation of NAMPT by NAMPT-AS drives metastatic progression in triple-negative breast cancer. Cancer Res. 2019;79(13):3347–3359. doi:10.1158/0008-5472.CAN-18-3418
16. Wang L, Yu Z, Wei C, et al. Huaier aqueous extract protects against dextran sulfate sodium-induced experimental colitis in mice by inhibiting NLRP3 inflammasome activation. Oncotarget. 2017;8(20):32937–32945. doi:10.18632/oncotarget.16513
17. Sun Y, Guo C, Ma P, et al. Kindlin-2 association with Rho GDP-dissociation inhibitor α suppresses Rac1 activation and podocyte injury. J Am Soc Nephrol. 2017;28(12):3545–3562. doi:10.1681/ASN.2016091021
18. Thorsson V, Gibbs DL, Brown SD, et al. The immune landscape of cancer. Immunity. 2018;48(4):812–830.e814. doi:10.1016/j.immuni.2018.03.023
19. Topalian SL, Taube JM, Anders RA, Pardoll DM. Mechanism-driven biomarkers to guide immune checkpoint blockade in cancer therapy. Nat Rev Cancer. 2016;16(5):275–287. doi:10.1038/nrc.2016.36
20. Griffith JW, Sokol CL, Luster AD. Chemokines and chemokine receptors: positioning cells for host defense and immunity. Annu Rev Immunol. 2014;32(1):659–702. doi:10.1146/annurev-immunol-032713-120145
21. Unver N. Macrophage chemoattractants secreted by cancer cells: sculptors of the tumor microenvironment and another crucial piece of the cancer secretome as a therapeutic target. Cytokine Growth Factor Rev. 2019;50:13–18. doi:10.1016/j.cytogfr.2019.05.010
22. Loibl S, Poortmans P, Morrow M, Denkert C, Curigliano G. Breast cancer. Lancet. 2021;397(10286):1750–1769. doi:10.1016/S0140-6736(20)32381-3
23. DeSantis CE, Ma J, Gaudet MM, et al. Breast cancer statistics, 2019. CA Cancer J Clin. 2019;69(6):438–451. doi:10.3322/caac.21583
24. Kim JY, Lim JE, Jung HH, et al. Validation of the new AJCC eighth edition of the TNM classification for breast cancer with a single-center breast cancer cohort. Breast Cancer Res Treat. 2018;171(3):737–745. doi:10.1007/s10549-018-4858-z
25. Kwon J, Eom KY, Koo TR, et al. A prognostic model for patients with triple-negative breast cancer: importance of the modified Nottingham prognostic index and age. J Breast Cancer. 2017;20(1):65–73. doi:10.4048/jbc.2017.20.1.65
26. Guo Q, Zhang L, Di Z, et al. Assessing risk category of breast cancer by ultrasound imaging characteristics. Ultrasound Med Biol. 2018;44(4):815–824. doi:10.1016/j.ultrasmedbio.2017.12.001
27. Huang Y, Wang H, Yang Y. Annexin A7 is correlated with better clinical outcomes of patients with breast cancer. J Cell Biochem. 2018;119(9):7577–7584. doi:10.1002/jcb.27087
28. Wang X, Li C, Chen T, et al. Identification and validation of a five-gene signature associated with overall survival in breast cancer patients. Front Oncol. 2021;11:660242. doi:10.3389/fonc.2021.660242
29. Slack FJ, Chinnaiyan AM. The role of non-coding RNAs in oncology. Cell. 2019;179(5):1033–1055. doi:10.1016/j.cell.2019.10.017
30. Liang Y, Song X, Li Y, et al. LncRNA BCRT1 promotes breast cancer progression by targeting miR-1303/PTBP3 axis. Mol Cancer. 2020;19(1):85. doi:10.1186/s12943-020-01206-5
31. Xiu B, Chi Y, Liu L, et al. LINC02273 drives breast cancer metastasis by epigenetically increasing AGR2 transcription. Mol Cancer. 2019;18(1):187. doi:10.1186/s12943-019-1115-y
32. Shi Q, Li Y, Li S, et al. LncRNA DILA1 inhibits cyclin D1 degradation and contributes to tamoxifen resistance in breast cancer. Nat Commun. 2020;11(1):5513. doi:10.1038/s41467-020-19349-w
33. Gajewski TF, Schreiber H, Fu YX. Innate and adaptive immune cells in the tumor microenvironment. Nat Immunol. 2013;14(10):1014–1022. doi:10.1038/ni.2703
34. Cao J, Dong R, Jiang L, et al. LncRNA-MM2P identified as a modulator of macrophage M2 polarization. Cancer Immunol Research. 2019;7(2):292–305. doi:10.1158/2326-6066.CIR-18-0145
35. Zhang M, Wang N, Song P, et al. LncRNA GATA3-AS1 facilitates tumour progression and immune escape in triple-negative breast cancer through destabilization of GATA3 but stabilization of PD-L1. Cell Prolif. 2020;53(9):e12855. doi:10.1111/cpr.12855
36. Pei X, Wang X, LncRNA LH. SNHG1 regulates the differentiation of treg cells and affects the immune escape of breast cancer via regulating miR-448/IDO. Int J Biol Macromol. 2018;118(Pt A):24–30. doi:10.1016/j.ijbiomac.2018.06.033
37. Wang Z, Gerstein M, Snyder M. RNA-Seq: a revolutionary tool for transcriptomics. Nat Rev Genet. 2009;10(1):57–63. doi:10.1038/nrg2484
38. Zhou M, Zhang Z, Bao S, et al. Computational recognition of lncRNA signature of tumor-infiltrating B lymphocytes with potential implications in prognosis and immunotherapy of bladder cancer. Brief Bioinform. 2021;22(3). doi:10.1093/bib/bbaa047.
39. Tekpli X, Lien T, Røssevold AH, et al. An independent poor-prognosis subtype of breast cancer defined by a distinct tumor immune microenvironment. Nat Commun. 2019;10(1):5499. doi:10.1038/s41467-019-13329-5
40. Sun J, Zhang Z, Bao S, et al. Identification of tumor immune infiltration-associated lncRNAs for improving prognosis and immunotherapy response of patients with non-small cell lung cancer. J ImmunoTher Cancer. 2020;8(1):e000110. doi:10.1136/jitc-2019-000110
41. Denny P, Feuermann M, Hill DP, Lovering RC, Plun-Favreau H, Roncaglia P. Exploring autophagy with gene ontology. Autophagy. 2018;14(3):419–436. doi:10.1080/15548627.2017.1415189
42. Gene Ontology Consortium. The gene ontology resource: 20 years and still GOing strong. Nucleic Acids Res. 2019;47(D1):D330–D338. doi:10.1093/nar/gky1055
43. Subramanian A, Tamayo P, Mootha VK, et al. Gene set enrichment analysis: a knowledge-based approach for interpreting genome-wide expression profiles. Proc Natl Acad Sci U S A. 2005;102(43):15545–15550. doi:10.1073/pnas.0506580102
44. Wu J, Li L, Zhang H, et al. A risk model developed based on tumor microenvironment predicts overall survival and associates with tumor immunity of patients with lung adenocarcinoma. Oncogene. 2021;40(26):4413–4424. doi:10.1038/s41388-021-01853-y
45. Lees JR. Targeting antigen presentation in autoimmunity. Cell Immunol. 2019;339:4–9. doi:10.1016/j.cellimm.2018.12.006
46. Reeves E, James E. Antigen processing and immune regulation in the response to tumours. Immunology. 2017;150(1):16–24. doi:10.1111/imm.12675
47. Pardoll DM. The blockade of immune checkpoints in cancer immunotherapy. Nat Rev Cancer. 2012;12(4):252–264. doi:10.1038/nrc3239
48. Patil NK, Guo Y, Luan L, Sherwood ER. Targeting immune cell checkpoints during sepsis. Int J Mol Sci. 2017;18(11):2413. doi:10.3390/ijms18112413
49. El-Kenawi A, Hänggi K, Ruffell B. The immune microenvironment and cancer metastasis. Cold Spring Harb Perspect Med. 2020;10(4):a037424. doi:10.1101/cshperspect.a037424
50. Salemme V, Centonze G, Cavallo F, Defilippi P, Conti L. The crosstalk between tumor cells and the immune microenvironment in breast cancer: implications for immunotherapy. Front Oncol. 2021;11:610303. doi:10.3389/fonc.2021.610303
51. Nagarsheth N, Wicha MS, Zou W. Chemokines in the cancer microenvironment and their relevance in cancer immunotherapy. Nat Rev Immunol. 2017;17(9):559–572. doi:10.1038/nri.2017.49
52. Conti I, Rollins BJ. CCL2 (monocyte chemoattractant protein-1) and cancer. Semin Cancer Biol. 2004;14(3):149–154. doi:10.1016/j.semcancer.2003.10.009
53. Qian BZ, Li J, Zhang H, et al. CCL2 recruits inflammatory monocytes to facilitate breast-tumour metastasis. Nature. 2011;475(7355):222–225. doi:10.1038/nature10138
 © 2022 The Author(s). This work is published and licensed by Dove Medical Press Limited. The
full terms of this license are available at https://www.dovepress.com/terms
and incorporate the Creative Commons Attribution
- Non Commercial (unported, 3.0) License.
By accessing the work you hereby accept the Terms. Non-commercial uses of the work are permitted
without any further permission from Dove Medical Press Limited, provided the work is properly
attributed. For permission for commercial use of this work, please see paragraphs 4.2 and 5 of our Terms.
© 2022 The Author(s). This work is published and licensed by Dove Medical Press Limited. The
full terms of this license are available at https://www.dovepress.com/terms
and incorporate the Creative Commons Attribution
- Non Commercial (unported, 3.0) License.
By accessing the work you hereby accept the Terms. Non-commercial uses of the work are permitted
without any further permission from Dove Medical Press Limited, provided the work is properly
attributed. For permission for commercial use of this work, please see paragraphs 4.2 and 5 of our Terms.
Recommended articles
Establishment and Validation of a Model for Disease-Free Survival Rate Prediction Using the Combination of microRNA-381 and Clinical Indicators in Patients with Breast Cancer
Shen J, Wang M, Li F, Yan H, Wang R, Zhou J
Breast Cancer: Targets and Therapy 2022, 14:375-389
Published Date: 30 November 2022
Chromobox Family Proteins as Putative Biomarkers for Breast Cancer Management: A Preliminary Study Based on Bioinformatics Analysis and qRT-PCR Validation
Tian H, Zhao T, Li Y, Sun N, Ma D, Shi Q, Zhang G, Chen Q, Zhang K, Chen C, Zhang Y, Qi X
Breast Cancer: Targets and Therapy 2022, 14:515-535
Published Date: 30 December 2022
Prognostic Significance of Preoperative Lactate Dehydrogenase to Albumin Ratio in Breast Cancer: A Retrospective Study
He J, Tong L, Wu P, Wu Y, Shi W, Chen L
International Journal of General Medicine 2023, 16:507-514
Published Date: 8 February 2023
The Prognostic Role of HuR Varies Between Different Subtypes of Breast Cancer Patients: Data Mining and Retrospective Analysis
Liao Y, Liao Y, Li J, Li Y, Fan Y
Breast Cancer: Targets and Therapy 2023, 15:135-146
Published Date: 11 February 2023
Construction and Identification of an NLR-Associated Prognostic Signature Revealing the Heterogeneous Immune Response in Skin Cutaneous Melanoma
Geng Y, Sun YJ, Song H, Miao QJ, Wang YF, Qi JL, Xu XL, Sun JF
Clinical, Cosmetic and Investigational Dermatology 2023, 16:1623-1639
Published Date: 26 June 2023