")
Back to Journals » Breast Cancer: Targets and Therapy » Volume 14
Establishment and Validation of a Model for Disease-Free Survival Rate Prediction Using the Combination of microRNA-381 and Clinical Indicators in Patients with Breast Cancer
Authors Shen J, Wang M, Li F, Yan H, Wang R, Zhou J
Received 20 July 2022
Accepted for publication 15 November 2022
Published 30 November 2022 Volume 2022:14 Pages 375—389
DOI https://doi.org/10.2147/BCTT.S383121
Checked for plagiarism Yes
Review by Single anonymous peer review
Peer reviewer comments 3
Editor who approved publication: Professor Pranela Rameshwar
Jun Shen, Meng Wang, Fan Li, Huanhuan Yan, Rui Wang, Jun Zhou
Department of Breast Surgery, The First People’s Hospital of Lianyungang, The First Affiliated Hospital of Kangda College of Nanjing Medical University, Lianyungang, 222002, People’s Republic of China
Correspondence: Jun Zhou, Department of Breast Surgery, The First People’s Hospital of Lianyungang, The First Affiliated Hospital of Kangda College of Nanjing Medical University, Lianyungang, 222002, People’s Republic of China, Tel +86 18961326373, Email [email protected]
Objective: We have found that miR-381 can regulate the proliferation of breast cancer cells by regulating TWIST protein, it can serve as a potential marker for the tumor progression. Thus, we herein establishment and validation of a model for predicting disease progression in patients with breast cancer using a combination of microRNA-381 (miR-381) and clinical indicators.
Methods: Data from 160 breast cancer patients in the First People’s Hospital of Lianyungang were collected, The relationship between miR-381 expression and tumor subtype was analyzed. The Kaplan–Meier (K–M) curve method was used to investigate the disease-free survival rate, while multivariate Cox regression analysis was used to investigate the risk factors affecting the prognosis of the patients. A model for predicting disease progression was subsequently established and validated.
Results: The miR-381 was significantly higher in the stage I patients than stage II/III patients. The miR-381 level of triple-negative breast cancer (TNBC) type was significantly decreased. The miR-381 could be used to effectively predict the prognosis, using cut-off value of 0.2515, with a sensitivity of 65.38% (51.8– 76.85%), specificity of 75.00% (46.77– 91.11%). The K–M survival curve indicated that the patients with higher miR-381 expression had a better prognosis. The miR-381+Ki-67+TN model and TN (T and N in TNM staging) model were established and subsequently compared. The TN model had an area under the curve (AUC) of 0.479 (95% CI 0.329, 0.629); in comparison, the our model had an AUC of 0.719 (95% CI 0.580, 0.857), showing better performance.
Conclusion: The miR-381 expression was correlated with different (TNM) stages and tumor subtypes. The higher the TNM stage, the lower the miR-381 expression in the tumor tissue, while it was significantly decreased in TNBC. A prediction model consisting of combination of miR-381 and Ki-67 and TN indicators could predict disease progression more effectively.
Keywords: miR-381, breast cancer, prognosis, nomogram, predictive model
Introduction
Breast cancer is the most common malignant tumor in women in China,1 surpassing lung cancer and accounting for approximately 25% of malignant tumors in females2 and 15% of related deaths.3 At present, the clinical treatment of breast cancer is based on a combination of multiple disciplines and individualized whole-process management.4 While prognosis has been improved to a certain extent, approximately 25–35% of patients continue to experience disease progression to the advanced stages, often losing any chance of a cure.5,6
The occurrence, development, and prognosis of breast cancer present dynamic processes of abnormal cell proliferation under the influence of multiple factors, multi-gene participation, multi-target regulation, and multi-step coordination.7 While the traditional tumor–node–metastasis (TNM) staging can effectively distinguish the overall survival (OS) rate in patients without distant metastasis at the early stage of diagnosis and treatment,8 however, the use of TN to predict disease progression has not been reported. Clinicians need models that accurately distinguish patients to guide subsequent treatment.
Previous studies have demonstrated that microRNA-381 (miR-381) involves in the dynamic process of breast cancer cell proliferation,9–11 via inactivating mitogen‑activated protein kinase signaling via Fyn down-regulation, thereby promoting the sensitivity of the breast cancer cells to doxorubicin,12 and long non-coding RNA small nucleolar host gene 1 promotes tumor progression and cisplatin resistance in breast cancer via epigenetic silencing of miR-381.13 In the present study, a predictive model involving the detection of miR-381 expression in tumor tissue in combination with the use of clinical indicators was established to determine the disease progression in patients with post-operative breast cancer with a view to guiding clinical decision making for adjuvant therapy.
Materials and Methods
Clinical Tissue Specimens and Data of Patients with Breast Cancer
A total of 160 patients with breast cancer who received surgical treatment from June 2016 to June 2018 were enrolled in the study. None of the patients were treated with chemotherapy or radiotherapy prior to surgery, and all had complete clinical and pathological data and follow-up results. Diagnosis and treatment plans were formulated according to the National Comprehensive Cancer Network and the Chinese Society of Clinical Oncology guidelines.14 The study was approved by the ethics committee, and every patient gave their informed consent. The follow-up was conducted until June 2020, with the duration ranging from 24 to 48 months.
Breast cancer staging analysis was conducted according to the TNM system issued by the International Union Against Cancer (T1 for <20 mm, T2 for 20–50 mm, T3 for >50 mm, and N0 for no lymph node metastasis; N1 for 1–3, N2 for 4–8, and N3 for ≥9). Cases with a >1% expression of estrogen receptor (ER) and progesterone receptor (PR) in the tumor cells were considered positive (1–30% = low expression, >30% = high expression), and a <1% expression was deemed to be negative. Human epidermal growth factor receptor 2 (HER2) positivity/negativity was determined according to the relevant detection guidelines issued by the American Society of Clinical Oncology and the College of American Pathologists. An HER2-positive result was defined as containing an immunohistochemistry (IHC) staining of 3+ (a strong expression in more than 30% of the infiltrating tumor cells), fluorescence in-situ hybridization (FISH) results with more than six copies of the HER2 gene per nucleus, or FISH ratios (chromosome 17/HER2 gene signal) of >2.2, while a negative result was defined in terms of an IHC staining of 0 or 1+, FISH results with an HER2 gene copy number per nucleus of less than 4.0, or a FISH ratio of <1.8.15,16 Breast cancer was classified into four subtypes,17,18 include luminal A, luminal B, human epidermal growth factor receptor 2 (HER-2), and basal-like or triple-negative types. The pathological stage was confirmed according to the AJCC System Seventh Edition TNM Staging System.
The breast tumor tissues were cryopreserved in a specimen bank within a specified period (30 mins, stored in liquid nitrogen at −80°C), with samples removed for analysis at the start of the experiment.
Expression of microRNA-381 in Breast Cancer Tissue as Detected via Reverse Transcription-Quantitative Polymerase Chain Reaction
Total RNA was extracted from the breast cancer tumor tissue and adjacent tissue using TRIzol™ reagent (Life Technologies, CA, USA) according to the instructions. After the frozen specimen is removed, the specimen is quickly cut into tissue blocks, and the breast cancer tissue and adjacent tissue blocks (about 5 cubic millimeters) are ground into powder, and 1mL TRIzol solution is added for grinding. Note that the total volume of the sample is less than 10% of the used volume of TRIzol. The grinding solution was left at room temperature for 5 minutes, and then chloroform was added at a rate of 0.2mL per 1mlTrizol solution. The centrifuge tube was tightly capped and vigorously shaken by hand for 15 seconds. The supernatant was transferred to a new centrifuge tube, and isopropanol was added according to the ratio of 0.5mL isopropanol per milliliter of Trizol solution, placed at room temperature for 10 minutes, and centrifuged at 12000g for 10 minutes. The supernatant was discarded, 75% ethanol was added according to the ratio of at least 1mL of Trizol per milliliter, and the mixture was vortexed and centrifuged at 7500g for 5 minutes at 4 ° C. Discard the supernatant carefully. Then dry at room temperature or under vacuum for 5–10 minutes. The RNA was dissolved in DEPC water at 55 ° C to 60 ° C for 10 minutes. The concentration and purity of RNA were measured by ultramicrotome photometer.
A PrimeScript miRNA cDNA synthesis kit (Takara, Beijing, China) was used to transcribe cDNA from the total RNA, Reaction conditions: 37°C×15 minutes, 85°C×5 seconds, maintained at 4°C, while mRNA quantification was conducted using specific primers and TaqMan MicroRNA Assay (Applied Biosystems, USA), with RNA U6 used as the internal reference. At the end of the reaction process, the system automatically drew the melting curve. Data were analyzed using the 2−ΔCT method. The qPCR primers are listed in Supplementary Table 1.
KMplot (https://kmplot.com/) Was Searched to Explore the Relationship Between the Expression of miR-381 and the Prognosis in Breast Cancer Patients
Statistical Analysis
The correlation between the clinical characteristics and the prognosis was analyzed using Pearson’s x-test and Fisher’s exact test. GraphPad 8.0 was used to plot the Kaplan–Meier (K–M) survival curve and the receiver operator characteristic (ROC) curve, with R 3.6.3 software used for the statistical analysis. Univariate and multivariate regression analyses were conducted with the Cox regression method employed to confirm the relationship between miR-381 content and prognostic outcome. A regression model of miR-381 was then established and validated. The Akaike information criterion was used to select variables for the nomogram.19 The discrimination and calibration of the nomogram were evaluated using concordance index (C-index), area under receiver operating characteristic curve (AUC), time dependent ROC curve was conducted to further test the stability of the model,20 and calibration plots. NRI21 (Net Reclassification Improvement) was used to evaluate the differences between the different models. The net benefits of the nomogram were quantified and compared with those of the TN staging using decision curve analysis (DCA)22 and clinical impact curve analysis (CIC). The calibration plot was used for visualized comparison between prognosis predicted by nomogram and actual ones.
Results
The Characteristics and Pathological Indicators Among the Patients
The baseline characteristics showed that there were significant differences in miR-381 expression, pathological grade, and Ki-67 expression between patients with disease progression and those without disease progression (P<0.05), while the differences between other variables were not statistically significant (Table 1).
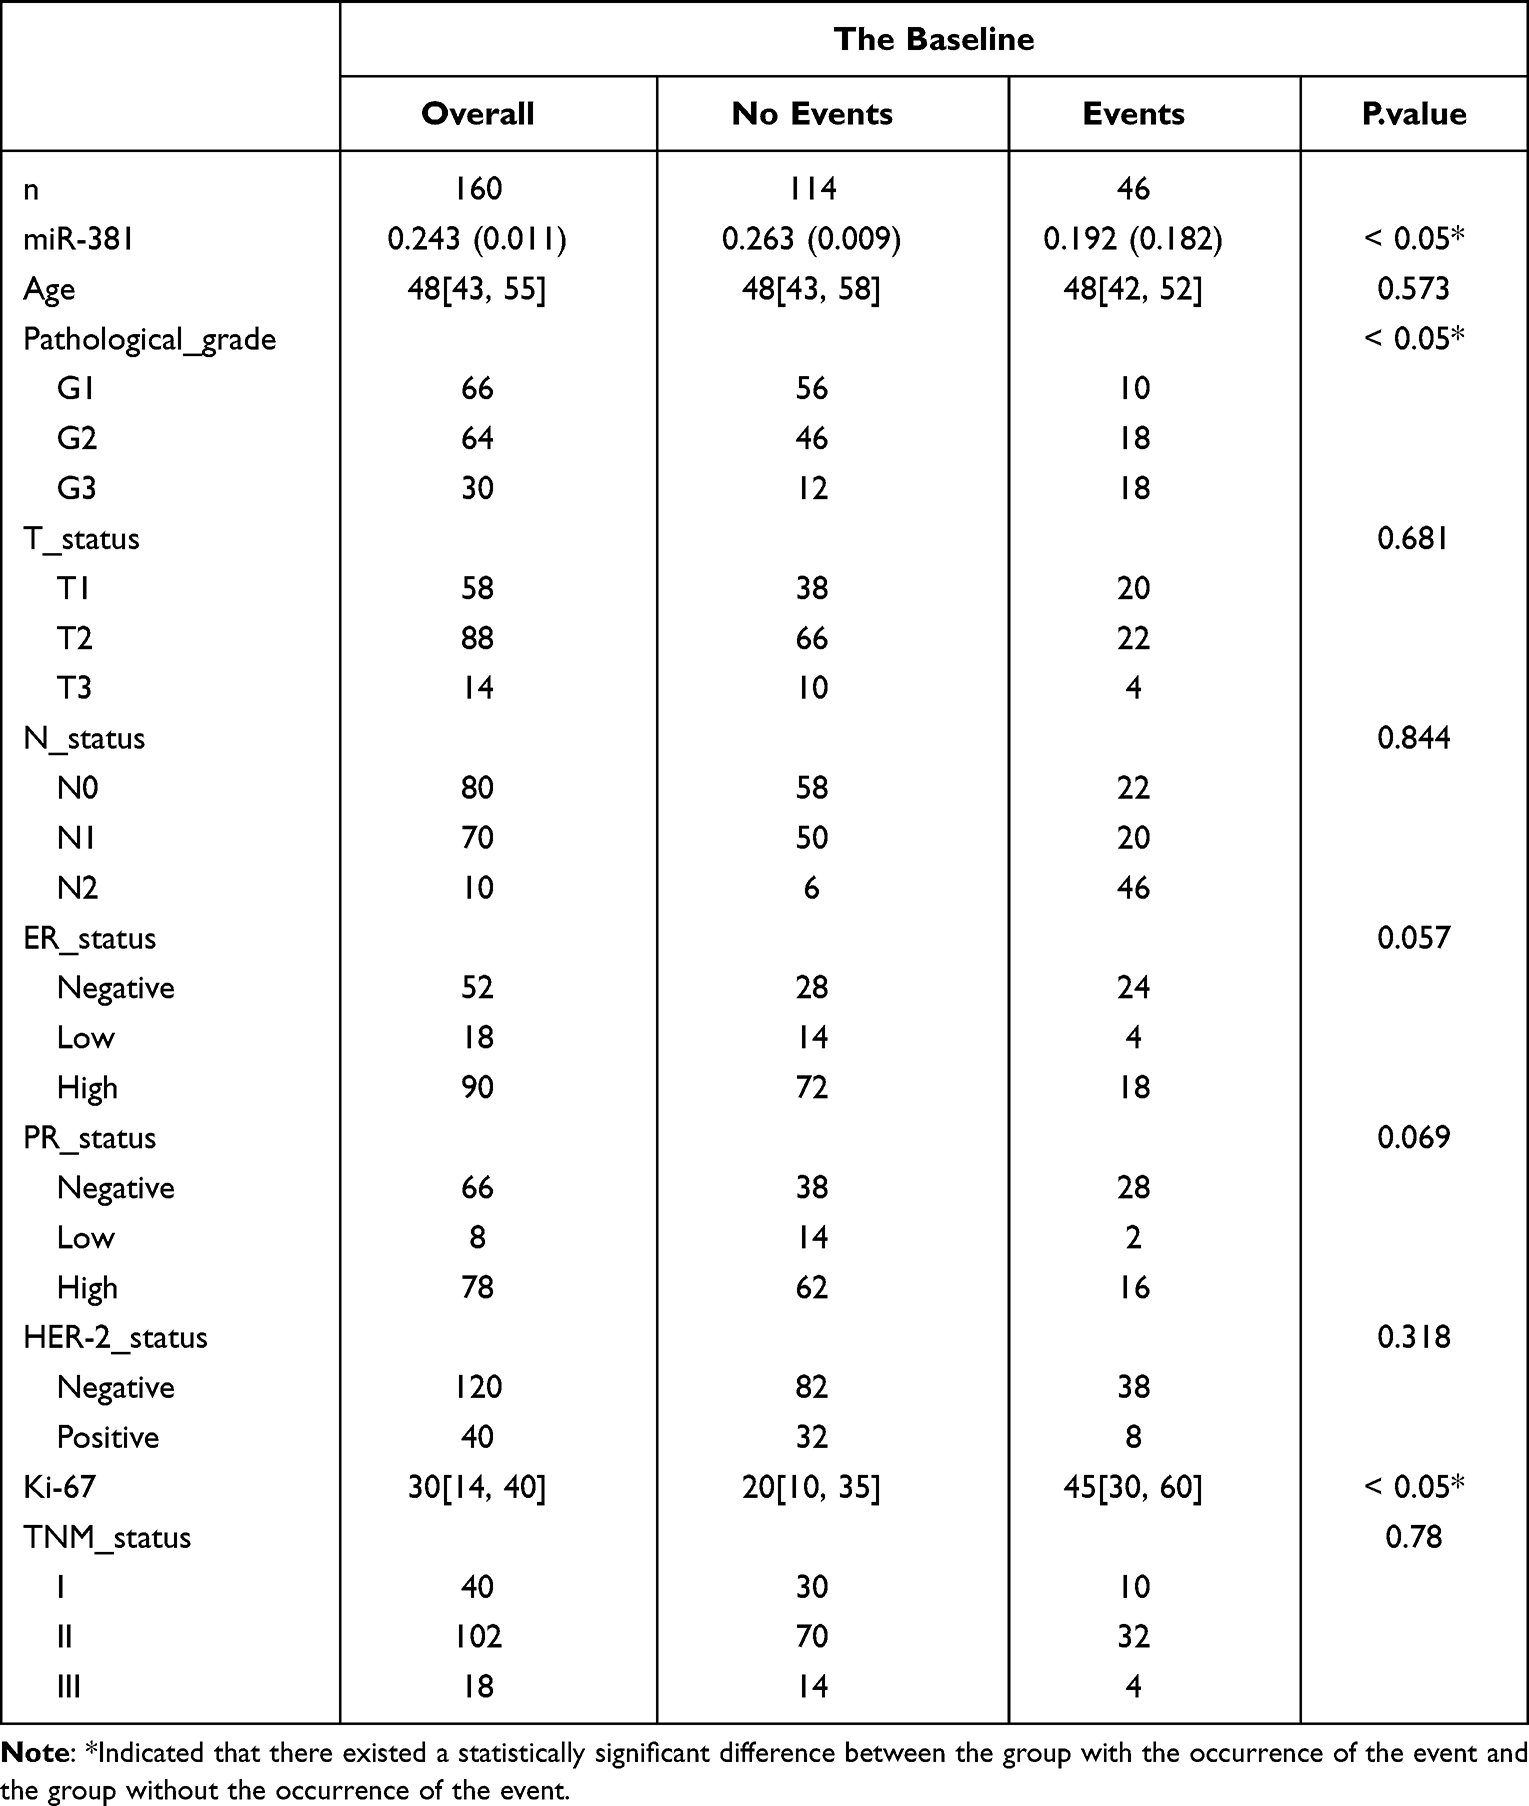 |
Table 1 The Baseline Characteristics |
Differential Expression of miR-381 Across Different Subtypes and Different Stages of Breast Cancer Tissues
The expression of miR-381 had the lowest expression in tumor tissue in patients with triple-negative breast cancer, followed by human epidermal growth factor receptor 2 (HER-2) positive subtype, although the data showed that miR-381 expression in TNBC was lower than that of HER-2 subtype without statistical significance, and miR-381 expression in luminal B patients was higher compared with HER-2 type. The expression of miR-381 in luminal A is the highest, the difference is statistically significant (P<0.05). The expression of miR-381 in the tumor tissues of patients with different TNM stages was also different, there was a statistical difference in the expression of miR-381 in the tumor tissues of patients between stage I and III, as well as stage II and III patients (P<0.05), see Figure 1. But no significant difference was seen between stage I and II patients.
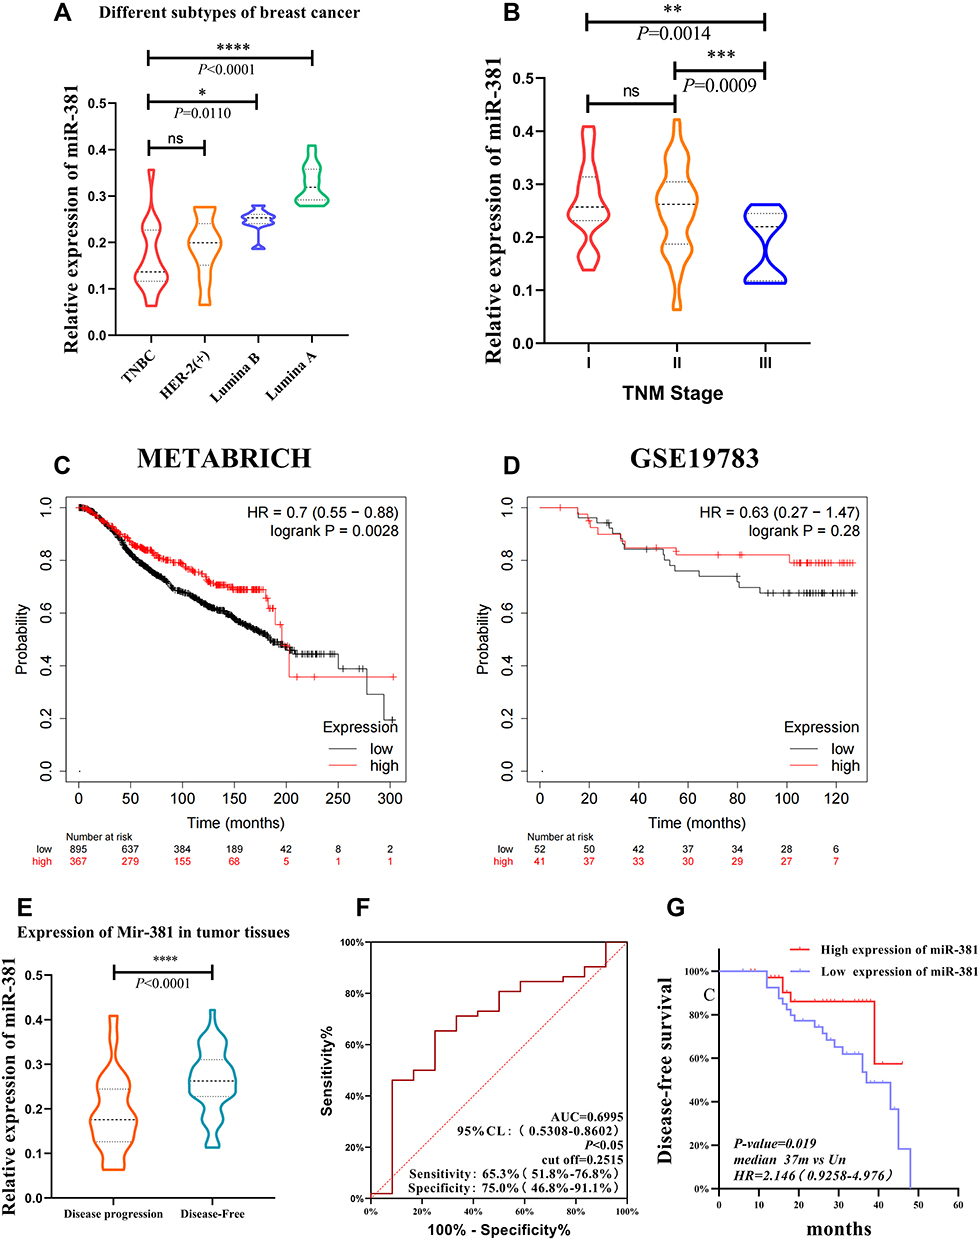 |
Figure 1 The miR-381 expression in the tumor tissue of patients with different TNM stages and molecular subtypes. (A) The miR-381 expression was significantly lower in the TNBC type than in the Luminal A/B of BC with P<0.05, but there is no significantly different between TNBC and Her-2 positive subtype with P=0.9. (B) The expression of miR-381 in the tumor tissues of patients between stage I and III, as well as stage II and III patients (P<0.05). (C) METABRICH data showed high expression indicate a better prognosis in BC with HR=0.7 (0.55–0.88), log rank P=0.0028. (D) In GSE19783 dataset, KMplot showed the similar value of MIR-381 but without significance (HR=0.63 (0.27–1.47), P=0.28). The miR-381 expression in the tumor tissues of patients with different disease progression states, along with the ROC curve and K–M curve. (E) The miR-381 content in the tumor tissue of the patients with disease progression was lower than those without disease progression (*Indicates p < 0.05, **Indicates p < 0.01, ***Indicates p < 0.001, ****Indicates p < 0.0001). (F) The ROC curve suggested a cut-off of 0.2515, with a sensitivity of 65.38% (51.8%–76.85%), a specificity of 75.00% (46.77%–91.11%), and a p-value of 0.0359. (G) The K–M survival curve indicated that the patients with a high miR-381 expression had a better prognosis, with a p-value of 0.019, a median no-events time of 37 m vs Un, and an HR of 2.146 (0.9258–4.976). |
miR-381 Was a Indicator for Survival in BC Patients Using KMPLOT from Public Database
We retrieved miR-381 in KMplot (https://kmplot.com/).23 In METABRICH data set, HR=0.7 (0.55–0.88), log rank P=0.0028, indicating that patients with different expression (median) had significant differences in OS. In the GSE19783 dataset, although the prognosis of patients with high expression might be better, there was no statistical difference (HR=0.63 (0.27–1.47), Log rank P=0.28) (Figure 1).
Expression and Survival Analysis of miR-381 in Breast Cancer Patients with Different Outcomes
The miR-381 content in the tumor tissue of patients with disease progression was lower than in patients without disease progression, and the difference was statistically significant (P < 0.05). The cut-off was 0.2515, with a sensitivity of 65.38% (51.8–76.85%) and a specificity of 75.00% (46.77–91.11%) in the ROC curve. K–M analysis indicated that the patients with high miR-381 expression had better prognoses (Figure 1). We analyzed the expression and survival status in patients in different subtypes (Figure 2), and the results showed that the expression of miR-381 was was significantly downregulated in tumor tissues of patients with disease progression events (P <0.05) than the patients without disease progression in all the subtypes except for Luminal A. We use the cutoff = 0.2515 to distinguish the expression level of miR-381. In survival analysis, it showed no statistical difference.
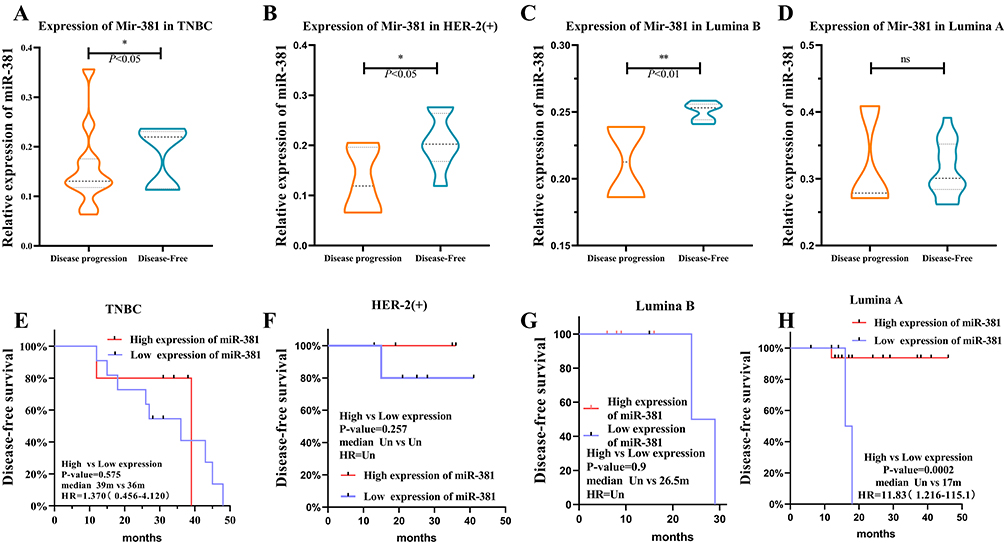 |
Figure 2 The miR-381 expression in patients with disease progression was lower than in patients without disease progression. (A–D) The results showed that the expression of miR-381 was was significantly downregulated in tumor tissues of patients with disease progression events (P <0.05) than the patients without disease progression in all the subtypes except for Luminal A. (E–H) The cut-off was 0.2515, with a sensitivity of 65.38% (51.8–76.85%) and a specificity of 75.00% (46.77–91.11%) in the ROC curve. K–M analysis indicated that the patients with high miR-381 expression had better prognoses. *Indicates p < 0.05, **Indicates p < 0.01. |
Univariate Analysis versus Multivariate COX Regression Analysis
In the univariate analysis, miR-381, Ki-67, were the independent influencing factors. The Cox regression analysis results suggested that miR-381, T stage, and tissue grade were independent prognostic factors (P< 0.05) (Table 2).
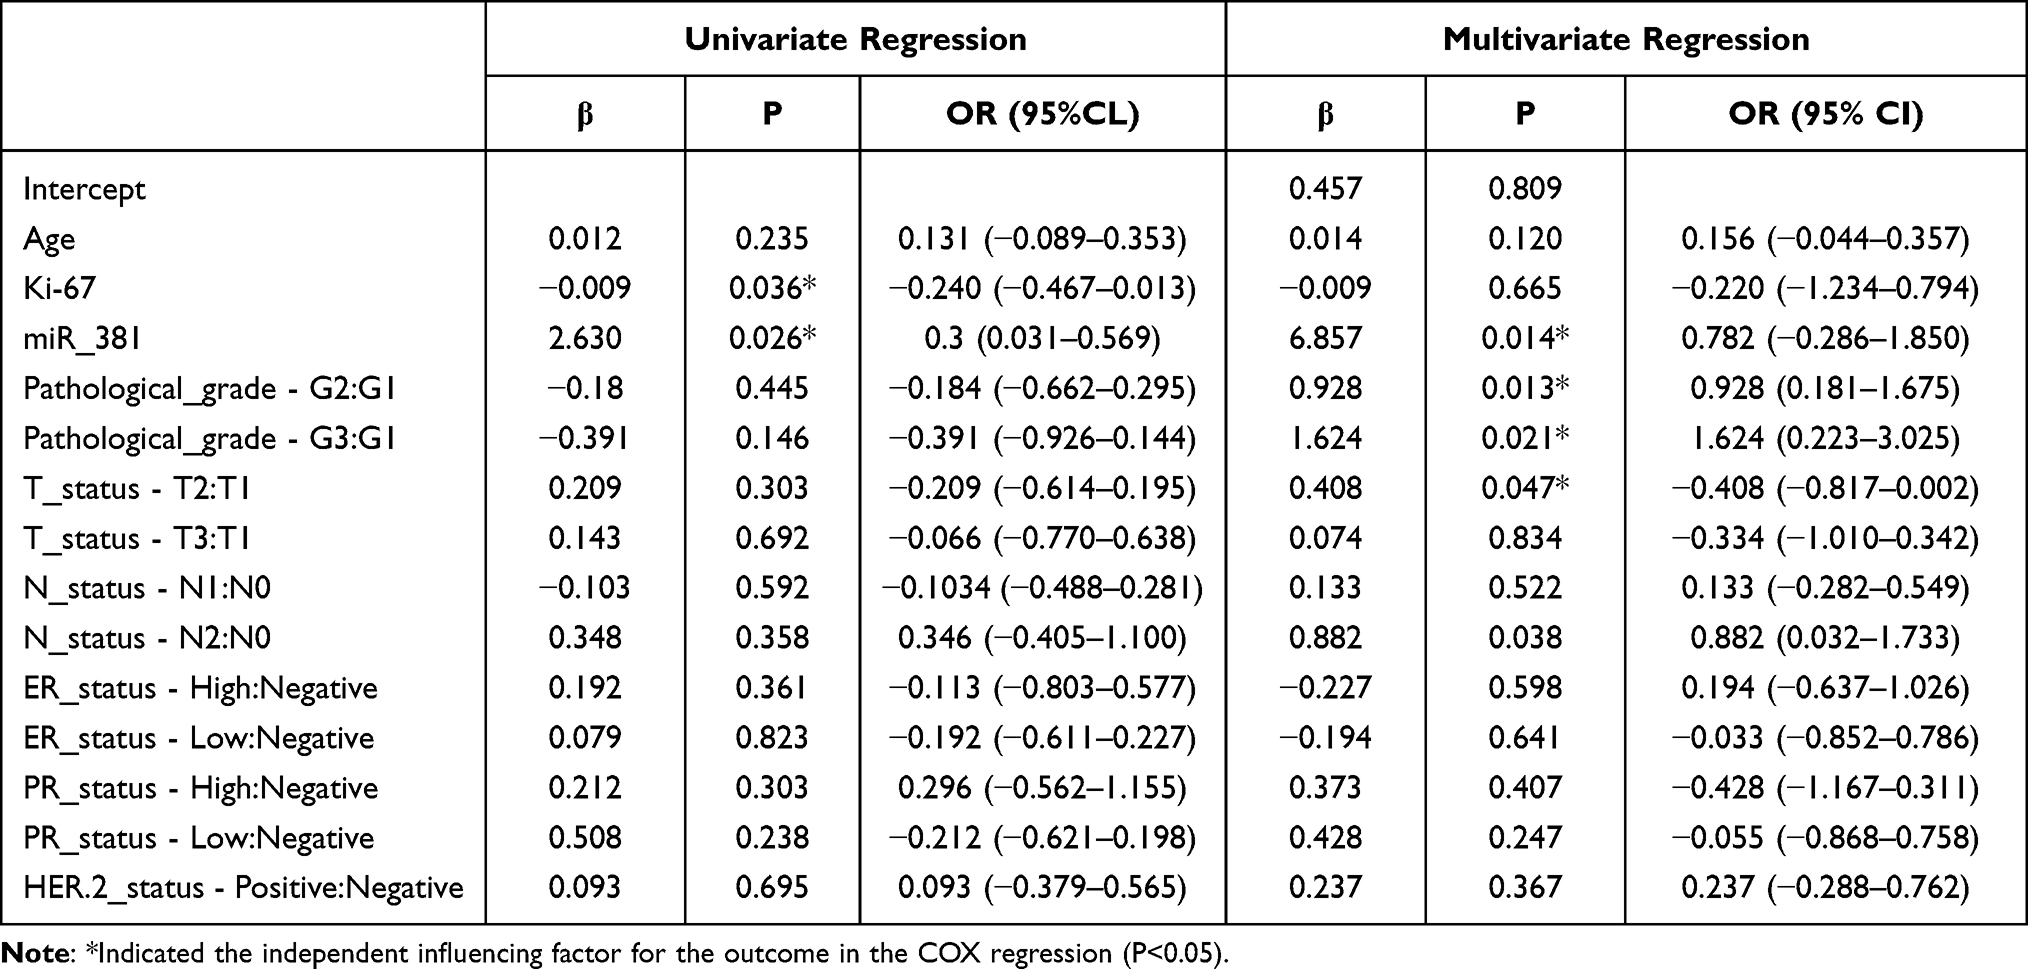 |
Table 2 Univariate Regression and COX Multivariate Regression Analysis |
Variable Screening and Model Establishment
For the establishment and validation of the miR-381 regression model, based on multivariate Cox analysis, the variance inflation factor (VIF) score was determined to assess the collinearity of each variable. Among the independent variables included in this study, the VIF scores of the pathological grade, ER status, PR status, Ki-67, and miR-381 were >5. Therefore, it was deemed that there could be some collinearity among the independent variables and that the concomitant inclusion of the above variables into the regression analysis could result in increased overfitting. Because of this, LASSO (Least absolute shrinkage and selection operator) regression analysis was adopted to further assess and filter the independent variables (Figure 3). This analytical method can be regularized, which helps in reducing high-dimensional data so as to pinpoint relevant factors with the best predictive features,24,25 and employing the LASSO regression model allowed for screening out features with non-zero coefficients.26
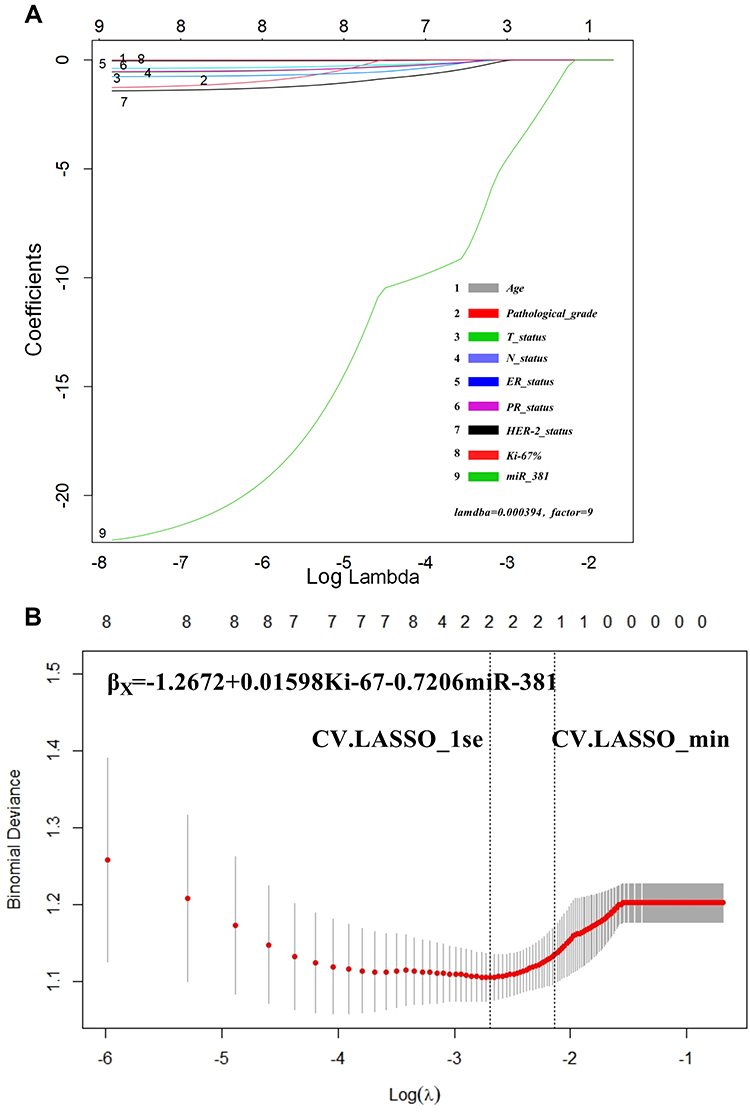 |
Figure 3 LASSO regression results. (A) When the lambda = 0.000394, the model converged to factor = 9, indicating that the included indicators were all statistically significant. The cross-LASSO multi-layer analysis indicated that, in the case of CV.LASSO_1se/CV.LASSO_min, Ki-67 and miR-381 were the significant factors. (B) The model was: βx = −1.2672 + 0.01598 × Ki-67 −0.7206 × miR-381. |
The results indicated that when the lambda function was continuously reduced to 0.000394, the model reached stability with the inclusion of all the variables, indicating that the variables and factors included in this study have good clinical significance. Following further stratified analysis, it was found that when the lambda was equal to cv.lasso_1se and cv.lasso_min, the coefficients of Ki-67 and miR-381 were 0.01598302 and −0.72061321, respectively, and the coefficients of the remaining variables returned to zero. This indicated that among all the variables, Ki-67 and miR-381 were the significant factors, thus allowing for further simplification of the model.
Since distant metastases were not included in this study’s data, and the main purpose of the present modeling was not to address the prediction of OS but to explore the disease-free survival rate within a given period, an analytical model including miR-381, Ki-67, and TN were established for validation and comparison.
Model Comparison and Screening
We analyzed the prediction models containing different factors and compared the differences between the models. In this study, miR-381+Ki-67+T+N model has the highest prediction efficiency, followed by miR-381 model, Ki-67 model, and Ki-67+T+N model The T+N model has the lowest prediction efficiency and almost no prediction ability (Figure 4A). Draw ROC curves of different models and compare AUC between different models. The AUC of miR-381+Ki-67+T+N model is 0.719 (0.580, 0.857), the AUC of miR-381 model is 0.713 (0.575, 0.848), the AUC of Ki-67 model is 0.698 (0.613, 0.742), the AUC of Ki-67+T+N model is 0.712 (0.575, 0.848), and the prediction efficiency of T+N model is the lowest, AUC is 0.479 (0.329–0.629) The NRI index was used to further evaluate the improvement of the model (Figure 5). The AUC of miR-381+Ki-67+T+N model was the largest. We selected it as a reference to compare the improvement between different models. It was found that miR-381+Ki-67+T+N model was significantly improved compared with T+N model, while compared with miR-381 model, Ki-67 model, Ki-67+T+N model was slightly improved. The prediction efficiency and stability of miR-381+Ki-67+T+N model at different time nodes were further judged by the ROC curve of time dependence (Figure 4B). The results suggest that miR-381+Ki-67+T+N model has good prediction efficiency and stability at different time nodes (Table 3).
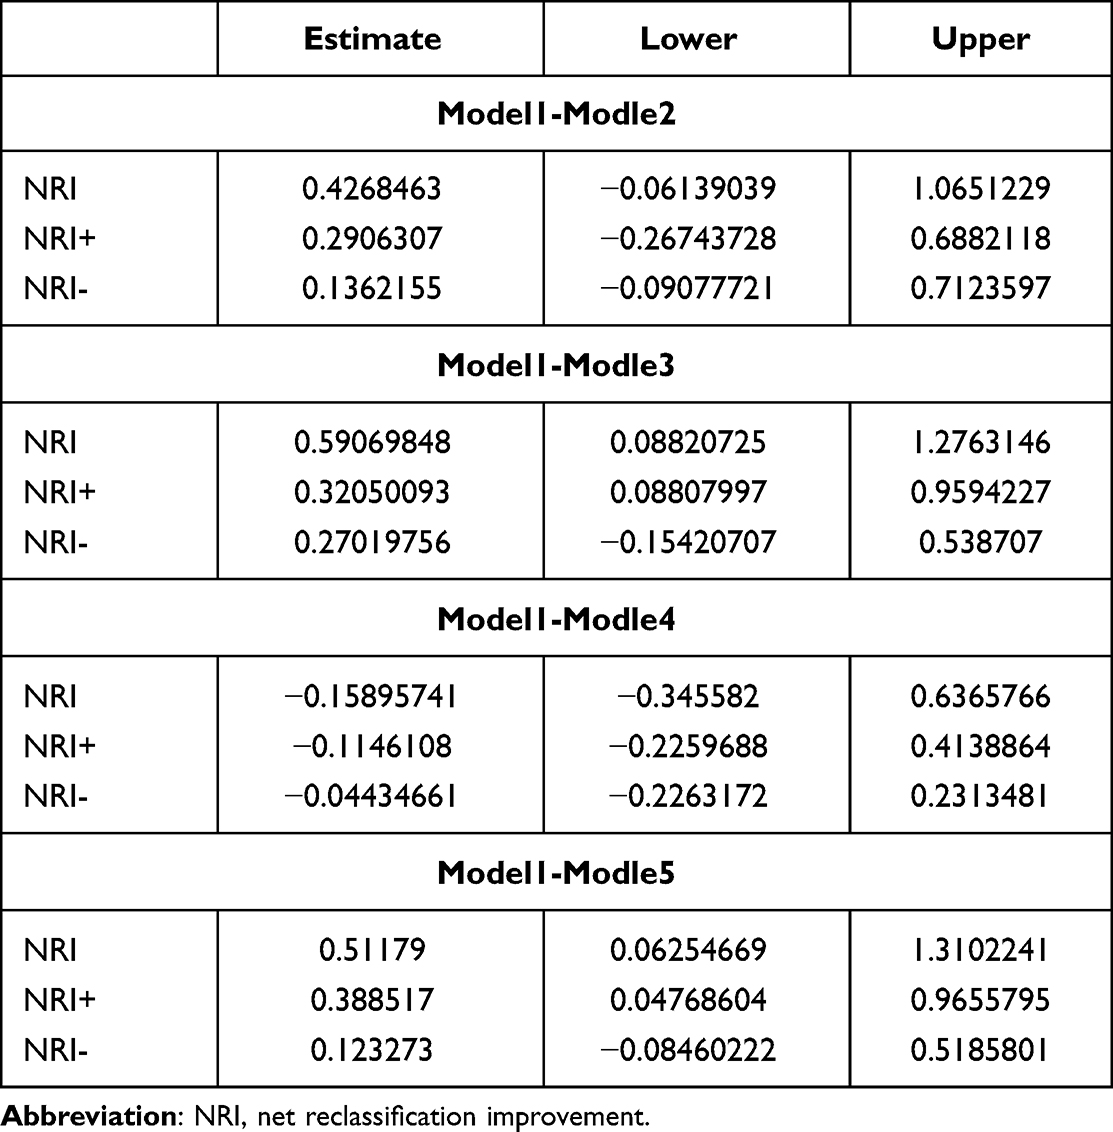 |
Table 3 NRI of Different Models Comparing with miR-381+Ki-67+T+N Model |
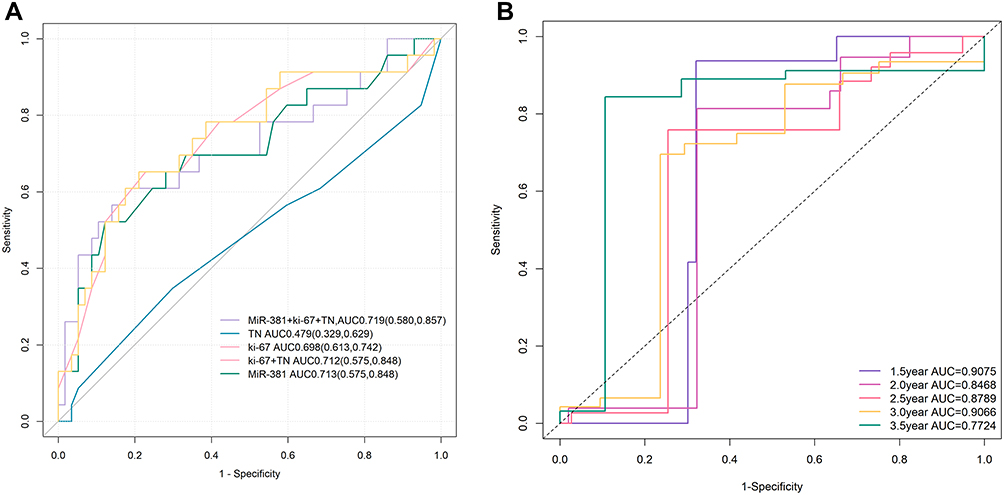 |
Figure 4 (A) The AUC of miR-381+Ki-67+T+N model was the largest. The AUC of miR-381+Ki-67+T+N model is 0.719 (0.580, 0.857), the AUC of miR-381 model is 0.713 (0.575, 0.848), the AUC of Ki-67 model is 0.698 (0.613, 0.742), the AUC of Ki-67+T+N model is 0.712 (0.575, 0.848), and the prediction efficiency of T+N model is the lowest, AUC is 0.479 (0.329–0.629). (B) The ROC curve of time dependence showed that the predictive performance at 1.5 year was AUC=0.9075, at 2 year was AUC=0.8468, at 2.5 year was AUC=0.8789, at 3 year was AUC=0.9066, at 3.5 year was AUC=0.7724. |
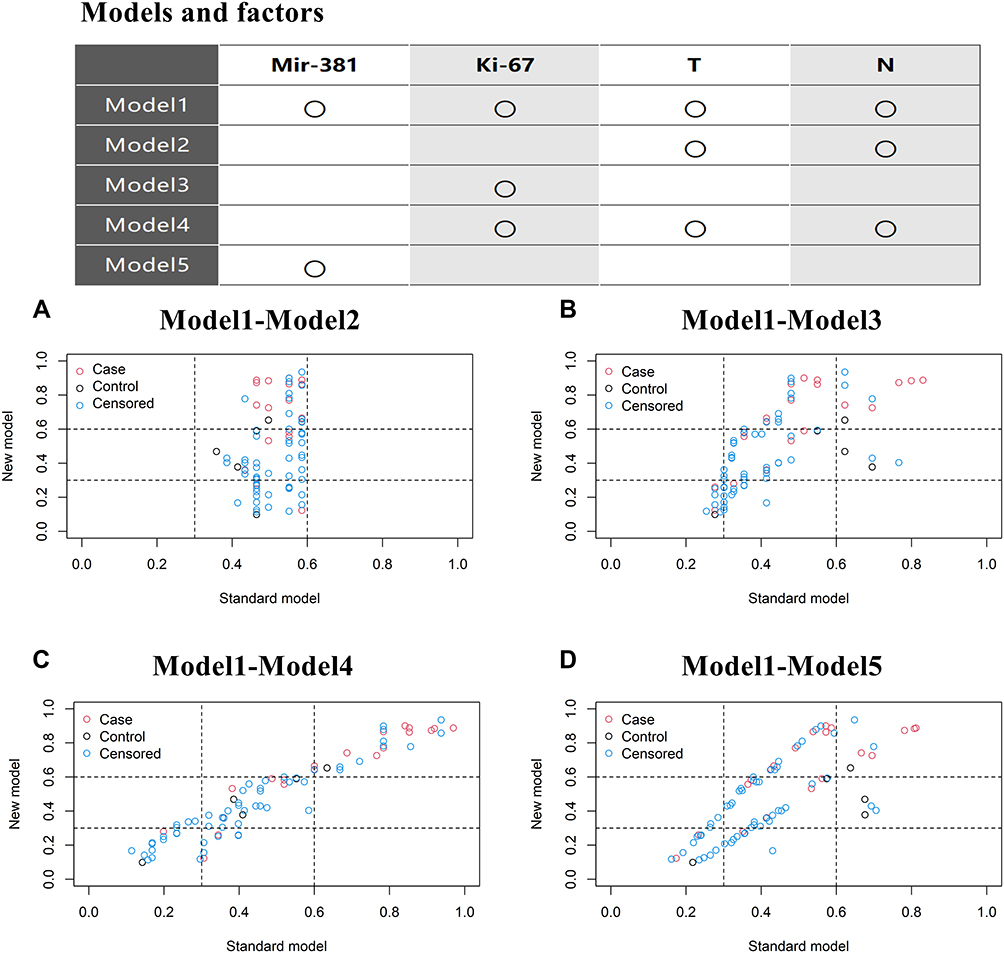 |
Figure 5 The NRI was used to further evaluate the improvement of the model. (A) miR-381+Ki-67+T+N model was better than T+N model; (B–D) Ki-67+T+N model was slightly better than the miR-381, Ki-67 model. |
Visualization was conducted with a nomogram19 (Figure 6). Different variables were included in the nomogram, with scores assigned according to the weights of the variables. The total score could be obtained by adding the assignment of each variable in detail to determine the possibility of disease progression in a specific patient at a three-year and five-year follow-up, with the aim of determining the prognosis.
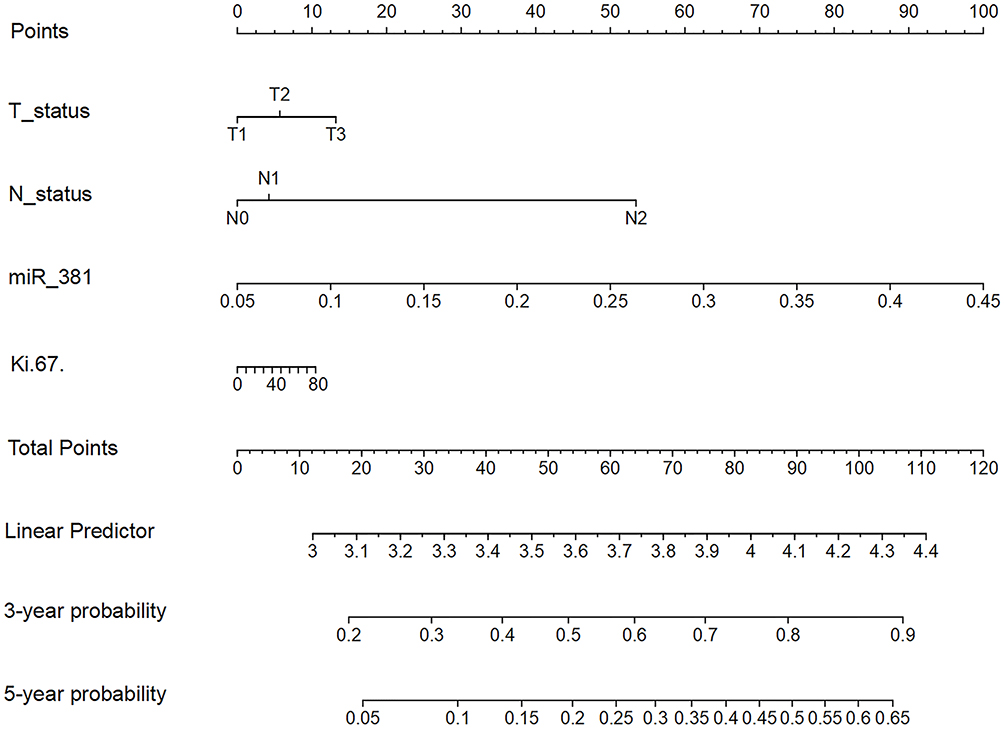 |
Figure 6 The nomogram of the miR-381+Ki-67+T+N models. The TN, miR-381, and Ki-67 model; For example, one patient was T1N0 with a miR-381 content of 2.9 and a Ki-67 of 40%. The model predicted that the risk of the occurrence of disease progression in three years was approximately 0.56, and the risk of the occurrence of a disease progression event in five years was approximately 0.25. |
Model Validation
Concordance Index
It is generally held that a model with a C-index exceeding 0.7 has clinical significance and that a C-index between 0.5 and 0.6 has limited predictive ability, while a model with a C-index exceeding 0.8 can be considered to exhibit good fitness.27 In the calculation of the models’ consistency, it was found that the concordance (C)-index of the miR-381+Ki-67+T+N model was 0.719, with a 95% CI of (0.580, 0.857). We also measured the change of C index at different time of the model (Figure 7A). We found that the C-index of the model was relatively stable and had a high prediction efficiency.
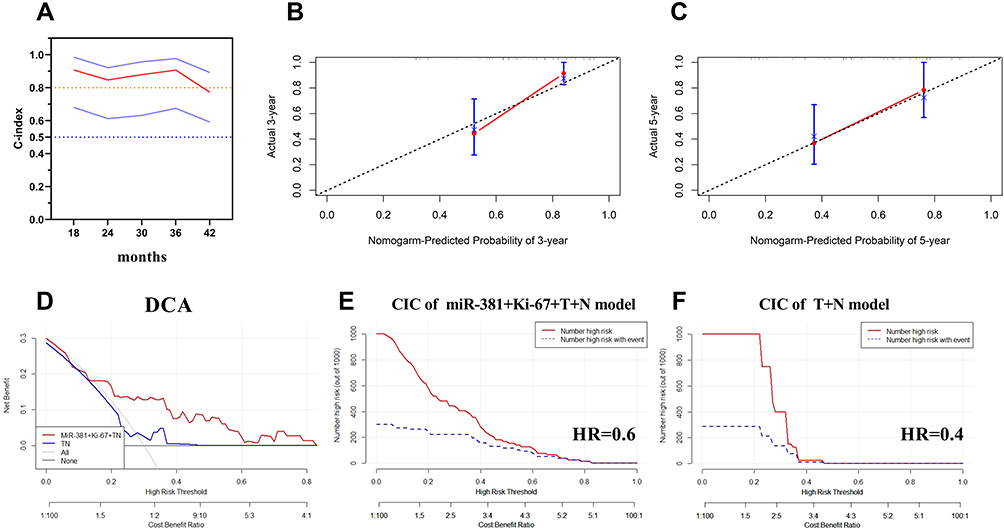 |
Figure 7 The calculation of the models’ consistency using the concordance (C)-index. (A) The concordance (C)-index of the miR-381+Ki-67+T+N model was 0.719, with a 95% CI of (0.580, 0.857); (B and C) The predicted and actual probabilities of disease progression events at three and five years showed the model had good consistency; (D) The DCA curve indicated that the clinical benefit of the miR-381+Ki-67+TN model was superior to the TN model, with a disease progression rate of 30%; (E) CIC of the miR-381+Ki-67+TN model, it demonstrated good performance over the entire range of threshold probabilities; (F) CIC of the TN model, the red curve has a steep downward trend, when HR is about 0.4, the two curves coincide. |
Calibration Curve
First, the nomogram was used to predict the target event probability of the study objects. The predicted probability and the corresponding actual probability of each group of the study objects were then calculated, which were used to evaluate the accuracy of the models. The calibration curves of the predicted and actual probabilities of disease progression events at three and five years were plotted, and it was found that the model had good consistency (Figure 7B and C).
False Positive Rate
The raw dataset was randomly divided into the training group and the test group with a ratio of 3:1, with the false-positive rates subsequently detected in terms of both groups. Here, it was found that the false-positive rate of the model containing miR-381 and Ki-67 was 3.6% in the training group and 3.2% in the test group, while the model without miR-381 and Ki-67 was 12.2% and 11.9%, respectively.
Clinical Benefit Analysis of the Model
Clinical benefit was assessed using decision curve analysis (DCA)22and clinical impact curve analysis (CIC). The DCA curve indicated that the clinical benefit of the miR-381+Ki-67+TN model was superior to the TN model, with a disease progression rate of 30% (Figure 7D). CIC also demonstrated good performance over the entire range of threshold probabilities. Among the 1000 patients, the number of high-risk patients (red solid line) and the number of high-risk patients with events (blue dotted line) are plotted. When HR = 0.6, the assessment of the clinical efficacy of the miR-381+Ki-67+TN model revealed that the risk assessment curve and the actual event curve essentially overlapped, which could be used as the clinical cut-off with a high prediction efficiency (Figure 7E). In the TN model, the red curve (the number of people classified as positive (high risk) by the model at each threshold probability) has a steep downward trend. When the HR is about 0.4, the two curves coincide, and the predictive performance is limited. The details are shown in (Figure 7F).
Discussion
Breast cancer, as a heterogeneous disease, is classified into 4 genetic subtypes: luminal A, luminal B, human epidermal growth factor receptor 2 (HER-2) enriched, and basal-like or triple-negative. Molecular subtypes are associated with survival and response to therapy.28,29 In this study, miR-381 expression was detected in the tumor tissue, The expression of miR-381 was inconsistent in different subtypes. The results showed that the expression of miR-381 was the lowest in tumor tissues of patients with triple-negative breast cancer, followed by human epidermal growth factor receptor 2 (HER-2) enriched type. The expression of miR-381 in luminal B type was higher than that in HER-2 enriched type. The expression of miR-381 in luminal A was the highest, and the expression of miR-381 in tumor tissues of luminal A and B patients was significantly higher than that of TNBC type (P<0.05). The expression of miR-381 in tumor tissues of patients with different TNM stages is also inconsistent. There is no significant difference in the expression of miR-381 in tumor tissues of patients with stage I and II, while there is statistically significant difference in the expression of miR-381 in tumor tissues of patients with stage I and III, and patients with stage II and III (P<0.05). The expression of miR-381 varies in tumor tissues of breast cancer patients with different subtypes and stages, indicating that miR-381 is involved in the occurrence and development of breast cancer. Several studies have demonstrated that miR-381 is associated with tumor proliferation, drug resistance, and epithelial-mesenchymal transition (EMT),30–32 and that the up-regulation of miR-381 in breast cancer can inhibit cell proliferation and increase sensitivity to taxanes and platinum, as well as inhibit the EMT process,10,12,13,33 The expression level of miR-381 in breast cancer tissues is low, and it is negatively correlated with the expression of PTTG1. BPA can inhibit the expression of miR-381-3p, promote the high expression of PTTG1, change the cell cycle, and enhance the proliferation of McF-7 cells,32 miR-381 regulated the Wnt, RB1, MYC pathway in TNBC,34,35 and it can participate in regulation of the expression of FAM234B to influence the survival of HR+patients. In hormone receptor-positive breast cancer, miR-381 is involved in the regulation of FAM234B and has an impact on the prognosis.36 FLVCR1-AS1 regulates BC malignant behavior via sequestering miR-381-3p and then freeing CTNNB1.37 Different studies have shown that miR-381 is involved in the pathological process of breast cancer, which may have clinical significance.
miR-381 was retrieved in KMplot and found in METABRICH and GSE19783 data sets, The conclusion was similar with this study, miR-381 could effectively distinguish the prognosis of breast cancer patients. In METABRICH data set, HR=0.7 (0.55–0.88), log rank P=0.0028, indicating that patients with different expression (median) had significant differences in OS. In the GSE19783 dataset, although the prognosis of patients with high expression might be better, there was no statistical difference (HR=0.63 (0.27–1.47), Log rank P=0.28). This may be related to the small sample size in GSE19783, only 93 patients were enrolled in the study.
The multivariate Cox regression analysis results indicated that miR-381 had a statistically significant effect on prognosis. Meanwhile, the results of the LASSO regression screening of the variables suggested that Ki-67 and miR-381 were significant indicators. miR-381 is involved in multiple processes of breast cancer development and development, and Ki-67 is also a prognostic indicator of invasive breast cancer patients.38,39 It can also be used as a marker of the proliferation ability of breast cancer cells.40 Ki-67 is also one of the indicators affecting local recurrence in early patients.41 Ki-67 has a strong ability to predict lymph node metastasis.42 The clinically important ER, PR, HER2, and other indicators were all masked by the miR-381 content and the Ki-67 expression, indicating that in the prediction of clinical prognosis, the original characteristics of tumor cells could be a more important factor. In the subsequent modeling and prediction, it was found that the miR-381+Ki-67+TN model was significantly superior to the TN model in terms of prognosis, with a p-value of <0.0001.
During real-world clinical practice, the following two scenarios may frequently arise. In the first, two patients (pT2N0cM0 stage IIa) at roughly the same disease stage and with a similar molecular type receive almost the same treatment but have very different prognoses. In the second scenario, two patients are in stage IIa, one with pT1N1cM0 and the one with pT2N0cM0, but whether the prognosis will be exactly the same for each patient is unclear. In view of such scenarios, we can speculate that in the initial stage of tumor development, the patient experiences no discomfort, and medical instruments fail to detect the disease. In other words, it is impossible to know exactly when the patient developed a tumor (t0). The time point when the tumor is discovered in the patient (either through self-examination or a physical examination) is t1, and the period from t1 to t0 remains unknown. The treatment time point (t2) is the time of diagnosis, at which point the disease may be diagnosed according to the patient’s condition. TN staging was performed on patients at this time. We analyzed the prediction models containing different factors and compared the differences between the models. In this study, the prediction efficiency of miR-381 + ki-67 +T+N model was the highest, followed by miR-381 model, Ki-67 model and Ki-67+T+N model. However, T+N model has the lowest predictive efficiency and almost no predictive ability, We boldly hypothesized that TN staging could only represent the time factor of disease for a certain patient, which may be the reason for the low predictive performance of the TN model in this study, because the factors representing tumor characteristics were missing in this model.
The prognoses of the patients were determined according to TNM staging and molecular typing. A simple mathematical model was developed as follows: the tumor growth state = Σ∫ [time * (promoting growth–immune regulation of the body–tumor self-competition)]. Therefore, solely relying on the TNM staging and simple molecular typing may only allow a limited degree of tumor differentiation. Meanwhile, miR-381 may merely reflect the proliferation of tumor cells, and this proliferation creates a problem concerning the time point in TNM staging. For example, a tumor that proliferated rapidly and had a high degree of malignancy could be found through a physical examination during a visit, allowing early treatment and early intervention. There is a certain amount of trial and error in making predictions using simple TNM staging, which could explain the marked difference in the clinical outcomes between two patients with the same disease stage and molecular type. With the addition of miR-381 and Ki-67, the predictive power of the model will increase, thus presenting enhanced clinical guidance.
After confirming the advantages of the predictive ability of miR-381 +Ki-67+TN model, we further analyzed the stability of the model and used the time-dependent ROC curve for different time points. The results showed that the miR-381 +Ki-67+TN model had good predictive ability at different time points, which also reflected the good stability of the model. Finally, we tested the clinical benefit of the model, and found that the model has good clinical benefit, indicating that the model has a certain guiding role in clinical practice. The specific efficacy needs to be confirmed by further research design. The amount of data in our study is small, and the sample size needs to be further expanded for further research.
Conclusion
In this study, miR-381 expression was found to differ between different TNM stages and breast cancer subtypes. A combination of miR-381 and breast cancer-related indicators potentially provides higher efficacy in predicting disease progression, thereby providing a basis for clinical decision making. However, the research sample needs to be expanded for further verification of this study’s findings.
Data Sharing Statement
All data generated or analysed during this study are included in this article. Further enquiries can be directed to the corresponding author.
Ethics Approval and Consent to Participate
The study was conducted in accordance with the Declaration of Helsinki (as was revised in 2013). The study was approved by Ethics Committee of the First People’s Hospital of Lianyungang (KY-20220426003-01). Written informed consent was obtained from all participants.
Acknowledgments
We are particularly grateful to all the people who have given us help on our article.
Funding
There is no funding to report.
Disclosure
The authors declare that they have no competing interests in this work.
References
1. Bray F, Ferlay J, Soerjomataram I, Siegel RL, Torre LA, Jemal A. Global cancer statistics 2018: GLOBOCAN estimates of incidence and mortality worldwide for 36 cancers in 185 countries. CA Cancer J Clin. 2018;68(6):394–424. doi:10.3322/caac.21492
2. Torre LA, Bray F, Siegel RL, Ferlay J, Lortet-Tieulent J, Jemal A. Global cancer statistics, 2012. CA Cancer J Clin. 2015;65(2):87–108. doi:10.3322/caac.21262
3. McGuire S. World Cancer Report 2014. Geneva, Switzerland: World Health Organization, International Agency for Research on Cancer, WHO Press; 2015.
4. Tan XF, Xia F. Long-term fatigue state in postoperative patients with breast cancer. Chin J Cancer Res. 2014;26(1):12–16. doi:10.3978/j.issn.1000-9604.2014.01.12
5. Saphner T, Tormey DC, Gray R. Annual hazard rates of recurrence for breast cancer after primary therapy. J Clin Oncol. 1996;14(10):2738–2746. doi:10.1200/JCO.1996.14.10.2738
6. Colleoni M, Sun Z, Price KN, et al. Annual hazard rates of recurrence for breast cancer during 24 years of follow-up: results from the international breast cancer study group trials I to V. J Clin Oncol. 2016;34(9):927–935. doi:10.1200/JCO.2015.62.3504
7. Bojesen SE, Pooley KA, Johnatty SE, et al. Multiple independent variants at the TERT locus are associated with telomere length and risks of breast and ovarian cancer. Nat Genet. 2013;45(4):371–84, 384e1–2. doi:10.1038/ng.2566
8. Cserni G, Chmielik E, Cserni B, Tot T. The new TNM-based staging of breast cancer. Virchows Arch. 2018;472(5):697–703. doi:10.1007/s00428-018-2301-9
9. Ming J, Zhou Y, Du J, et al. miR-381 suppresses C/EBPα-dependent Cx43 expression in breast cancer cells. Biosci Rep. 2015;35(6). doi:10.1042/BSR20150167
10. Xue Y, Xu W, Zhao W, Wang W, Zhang D, Wu P. miR-381 inhibited breast cancer cells proliferation, epithelial-to-mesenchymal transition and metastasis by targeting CXCR4. Biomed Pharmacother. 2017;86:426–433. doi:10.1016/j.biopha.2016.12.051
11. Pan Z, Ding J, Yang Z, Li H, Ding H, Chen Q. LncRNA FLVCR1-AS1 promotes proliferation, migration and activates Wnt/β-catenin pathway through miR-381-3p/CTNNB1 axis in breast cancer. Cancer Cell Int. 2020;20:214. doi:10.1186/s12935-020-01247-2
12. Mi H, Wang X, Wang F, et al. miR-381 induces sensitivity of breast cancer cells to doxorubicin by inactivation of MAPK signaling via FYN. Eur J Pharmacol. 2018;839:66–75. doi:10.1016/j.ejphar.2018.09.024
13. Zhang M, Yang L, Hou L, Tang X. LncRNA SNHG1 promotes tumor progression and cisplatin resistance through epigenetically silencing miR-381 in breast cancer. Bioengineered. 2021;12(2):9239–9250. doi:10.1080/21655979.2021.1996305
14. Goetz MP, Gradishar WJ, Anderson BO, et al. NCCN guidelines insights: breast cancer, version 3.2018. J Natl Compr Canc Netw. 2019;17(2):118–126. doi:10.6004/jnccn.2019.0009
15. Singletary SE, Allred C, Ashley P, et al. Staging system for breast cancer: revisions for the 6th edition of the AJCC cancer staging manual. Surg Clin North Am. 2003;83(4):803–819. doi:10.1016/S0039-6109(03)00034-3
16. Wolff AC, Hammond ME, Hicks DG, et al. Recommendations for human epidermal growth factor receptor 2 testing in breast cancer: American society of clinical oncology/college of American pathologists clinical practice guideline update. J Clin Oncol. 2013;31(31):3997–4013. doi:10.1200/JCO.2013.50.9984
17. Perou CM, Sørlie T, Eisen MB, et al. Molecular portraits of human breast tumours. Nature. 2000;406(6797):747–752. doi:10.1038/35021093
18. Goldhirsch A, Wood WC, Coates AS, et al. Strategies for subtypes--dealing with the diversity of breast cancer: highlights of the St. Gallen international expert consensus on the primary therapy of early breast cancer 2011. Ann Oncol. 2011;22(8):1736–1747. doi:10.1093/annonc/mdr304
19. Park SY. Nomogram: an analogue tool to deliver digital knowledge. J Thorac Cardiovasc Surg. 2018;155(4):1793. doi:10.1016/j.jtcvs.2017.12.107
20. Li J, Ma S. Time-dependent ROC analysis under diverse censoring patterns. Stat Med. 2011;30(11):1266–1277. doi:10.1002/sim.4178
21. Pepe MS, Fan J, Feng Z, et al. The Net Reclassification Index (NRI): a misleading measure of prediction improvement even with independent test data sets. Stat Biosci. 2015;7(2):282–295. doi:10.1007/s12561-014-9118-0
22. Van Calster B, Wynants L, Verbeek J, et al. Reporting and interpreting decision curve analysis: a guide for investigators. Eur Urol. 2018;74(6):796–804. doi:10.1016/j.eururo.2018.08.038
23. Lánczky A, Győrffy B. Web-based survival analysis tool tailored for medical research (KMplot): development and implementation. J Med Internet Res. 2021;23(7):e27633. doi:10.2196/27633
24. Soldatos CR, Dikeos DG, Paparrigopoulos TJ. Athens insomnia scale: validation of an instrument based on ICD-10 criteria. J Psychosom Res. 2000;48(6):555–560. doi:10.1016/S0022-3999(00)00095-7
25. Friedman J, Hastie T, Tibshirani R. Regularization paths for generalized linear models via coordinate descent. J Stat Softw. 2010;33(1):1–22. doi:10.18637/jss.v033.i01
26. Sauerbrei W, Boulesteix AL, Binder H. Stability investigations of multivariable regression models derived from low- and high-dimensional data. J Biopharm Stat. 2011;21(6):1206–1231. doi:10.1080/10543406.2011.629890
27. Huitzil-Melendez FD, Capanu M, O’Reilly EM, et al. Advanced hepatocellular carcinoma: which staging systems best predict prognosis? J Clin Oncol. 2010;28(17):2889–2895. doi:10.1200/JCO.2009.25.9895
28. Burstein HJ, Temin S, Anderson H, et al. Adjuvant endocrine therapy for women with hormone receptor-positive breast cancer: American society of clinical oncology clinical practice guideline focused update. J Clin Oncol. 2014;32(21):2255–2269. doi:10.1200/JCO.2013.54.2258
29. Voduc KD, Cheang MC, Tyldesley S, et al. Breast cancer subtypes and the risk of local and regional relapse. J Clin Oncol. 2010;28(10):1684–1691. doi:10.1200/JCO.2009.24.9284
30. Tang H, Liu X, Wang Z, et al. Interaction of hsa-miR-381 and glioma suppressor LRRC4 is involved in glioma growth. Brain Res. 2011;1390:21–32. doi:10.1016/j.brainres.2011.03.034
31. Liang Y, Zhao Q, Fan L, et al. Down-regulation of MicroRNA-381 promotes cell proliferation and invasion in colon cancer through up-regulation of LRH-1. Biomed Pharmacother. 2015;75:137–141. doi:10.1016/j.biopha.2015.07.020
32. Yu YZ, Mu Q, Ren Q, et al. miR-381-3p suppresses breast cancer progression by inhibition of epithelial-mesenchymal transition. World J Surg Oncol. 2021;19(1):230. doi:10.1186/s12957-021-02344-w
33. Deng P, Tan M, Zhou W, et al. Bisphenol A promotes breast cancer cell proliferation by driving miR-381-3p-PTTG1-dependent cell cycle progression. Chemosphere. 2021;268:129221. doi:10.1016/j.chemosphere.2020.129221
34. Mohammadi-Yeganeh S, Hosseini V, Paryan M. Wnt pathway targeting reduces triple-negative breast cancer aggressiveness through miRNA regulation in vitro and in vivo. J Cell Physiol. 2019;234(10):18317–18328. doi:10.1002/jcp.28465
35. Wang D-Y, Gendoo D, Ben-David Y, et al. A subgroup of microRNAs defines PTEN-deficient, triple-negative breast cancer patients with poorest prognosis and alterations in RB1, MYC, and Wnt signaling. Breast Cancer Res. 2019;21(1):18. doi:10.1186/s13058-019-1098-z
36. Lyu L, Wang M, Zheng Y, et al. Overexpression of FAM234B predicts poor prognosis in patients with luminal breast cancer. Cancer Manag Res. 2020;12:12457–12471. doi:10.2147/CMAR.S280009
37. Pan Z, Ding J, Yang Z, Li H, Ding H, Chen Q. LncRNA FLVCR1-AS1 promotes proliferation, migration and activates Wnt/β-catenin pathway through miR-381-3p/CTNNB1 axis in breast cancer. Cancer Cell Int. 2020;20(1):214. PMID: 32518523, PMCID: PMC7275497. doi:10.1186/s12935-020-01247-2
38. Davey MG, Hynes SO, Kerin MJ, et al. Ki-67 as a prognostic biomarker in invasive breast cancer. Cancers. 2021;13(17):4455. doi:10.3390/cancers13174455
39. Kanyılmaz G, Yavuz BB, Aktan M, et al. Prognostic importance of Ki-67 in breast cancer and its relationship with other prognostic factors. Eur J Breast Health. 2019;15(4):256–261. doi:10.5152/ejbh.2019.4778
40. Menon SS, Guruvayoorappan C, Sakthivel KM, et al. Ki-67 protein as a tumour proliferation marker. Clin Chim Acta. 2019;491:39–45. doi:10.1016/j.cca.2019.01.011
41. Liang Q, Ma D, Gao R-F, et al. Effect of Ki-67 expression levels and histological grade on breast cancer early relapse in patients with different immunohistochemical-based subtypes. Sci Rep. 2020;10(1):7648. doi:10.1038/s41598-020-64523-1
42. Dihge L, Bendahl PO, Rydén L. Nomograms for preoperative prediction of axillary nodal status in breast cancer. Br J Surg. 2017;104(11):1494–1505. doi:10.1002/bjs.10583
 © 2022 The Author(s). This work is published and licensed by Dove Medical Press Limited. The full terms of this license are available at https://www.dovepress.com/terms.php and incorporate the Creative Commons Attribution - Non Commercial (unported, v3.0) License.
By accessing the work you hereby accept the Terms. Non-commercial uses of the work are permitted without any further permission from Dove Medical Press Limited, provided the work is properly attributed. For permission for commercial use of this work, please see paragraphs 4.2 and 5 of our Terms.
© 2022 The Author(s). This work is published and licensed by Dove Medical Press Limited. The full terms of this license are available at https://www.dovepress.com/terms.php and incorporate the Creative Commons Attribution - Non Commercial (unported, v3.0) License.
By accessing the work you hereby accept the Terms. Non-commercial uses of the work are permitted without any further permission from Dove Medical Press Limited, provided the work is properly attributed. For permission for commercial use of this work, please see paragraphs 4.2 and 5 of our Terms.