Back to Journals » Journal of Inflammation Research » Volume 15
Resistin Concentration in Early Sepsis and All-Cause Mortality at a Safety-Net Hospital in Riverside County
Authors Bonenfant J, Li J, Nasouf L, Miller J, Lowe T ![]() , Jaroszewski L, Qiu X, Thapamagar S
, Jaroszewski L, Qiu X, Thapamagar S ![]() , Mittal A, Godzik A, Klein W, Nair MG
, Mittal A, Godzik A, Klein W, Nair MG ![]()
Received 14 April 2022
Accepted for publication 29 June 2022
Published 13 July 2022 Volume 2022:15 Pages 3925—3940
DOI https://doi.org/10.2147/JIR.S370788
Checked for plagiarism Yes
Review by Single anonymous peer review
Peer reviewer comments 2
Editor who approved publication: Professor Ning Quan
Jeffrey Bonenfant,1,2,* Jiang Li,3,* Luqman Nasouf,1 Joseph Miller,3 Tammy Lowe,1 Lukasz Jaroszewski,3 Xinru Qiu,3 Suman Thapamagar,1,2 Aarti Mittal,1,2 Adam Godzik,3 Walter Klein,1,2,* Meera G Nair3,*
1Department of Medicine, Division of Pulmonary and Critical Care Medicine, Riverside University Health System Medical Center, Moreno Valley, CA, USA; 2Division of Pulmonary, Critical Care, Hyperbaric, Allergy and Sleep Medicine, School of Medicine, Loma Linda University, Loma Linda, CA, USA; 3Division of Biomedical Sciences, School of Medicine, University of California Riverside, Riverside, CA, USA
*These authors contributed equally to this work
Correspondence: Meera G Nair, Division of Biomedical Sciences, School of Medicine, University of California Riverside, 3135 Multidisciplinary Research Building 1, 900 University Avenue, Riverside, CA, CA92521, USA, Tel +951-827-7734, Email [email protected]
Background: Sepsis mortality has remained unchanged for greater than a decade, and early recognition continues to be the most important factor in mortality outcome. Plasma resistin concentration is increased in sepsis, but its mechanism and clinical relevance is unclear. As one function, resistin interacts with toll-like receptor 4 in competition with lipopolysaccharide, a main component of the gram-negative bacterial cell wall. It is not known if the type of infection leading to sepsis influences resistin production. The objective of this study was to investigate whether 1) early plasma resistin concentration can predict mortality, 2) elevated plasma resistin concentration is associated with clinical disease severity scores, such as SOFA, mSOFA and APACHE II, and 3) plasma resistin concentrations differ between gram negative versus other etiologies of sepsis.
Methods: This was an exploratory study in the framework of a prospective observational design. Peripheral venous blood samples were obtained from subjects admitted to the intensive care unit at clinical recognition of sepsis (0 hour) and at 6 and 24 hours. Vasopressor utilization was not a requirement for inclusion. Plasma was analyzed for resistin concentration by ELISA. Cytokine concentrations including IL-6, IL-8, and IL-10 were determined by cytokine bead array. Cytokine data were evaluated against publicly available sepsis RNA expression datasets to compare protein versus RNA expression levels in predicting clinical disease state. Clinical data were collected from electronic health records for clinical severity index calculations and context for interpretation of resistin and cytokine concentrations. Subjects were followed up to 60 days, or until death, whichever came first. Statistical analysis was completed with R package and SPSS software.
Results: Resistin levels were elevated in subjects admitted to the intensive care unit with sepsis. Four-hundred subjects were screened with 45 subjects included in the final analysis. Thirteen of 45 patients were non-survivors. Mortality within 60 days correlated with significantly higher resistin concentrations than in survivors. A resistin concentration of > 126 ng/mL at clinical recognition of sepsis and > 197 ng/mL within the first 24 hours were associated with mortality within 60 days with an area under the curve of 0.82 and 0.88, respectively. Most subjects with resistin concentration greater than these threshold values were deceased prior to 30 days. Resistin concentrations correlated with SOFA, mSOFA, and APACHE II scores in addition to having association with increases in inflammatory and sepsis biomarkers. These associations were validated with analysis of RNA expression datasets.
Conclusion: Plasma resistin concentrations of > 126 ng/mL at clinical recognition of sepsis and > 197 ng/mL within the first 24 hours of clinical sepsis recognition are associated with all-cause mortality. Resistin concentration within this timeframe also has comparable mortality association to well-validated clinical severity indices of SOFA, mSOFA, and APACHE II scores.
Keywords: resistin, gram-negative, sepsis, mortality
Introduction
An overwhelming immune response is the major driving force in the severity and mortality of sepsis. The effects of an inflammatory immune process on morbidity and mortality in the critically ill is considerable.1 The most effective treatment strategy to date in bacterial sepsis is early clinical recognition, followed by the prompt initiation of systemic antibiotics and hemodynamic support, including intravenous fluid resuscitation and vasopressors.2–6 This has been standard of care for the global tissue hypoxia caused by the hemodynamic compromise associated with a systemic inflammatory response against the infective organism.7 Approximately 6–30% of intensive care patients are diagnosed with sepsis and if progression to septic shock ensues the mortality rate has been reported to be 20–30% with recent meta-analyses reporting mortality rates up to nearly 50%.8,9 This is even more notable in locales with lower socioeconomic support and limited resources.10 Improving the early recognition of sepsis, and hence survival, remains a critical healthcare challenge. A single biomarker capable of accurate and early detection of the disease state is needed to triage and optimize the delivery of appropriate treatment. The highest impact potential for such a biomarker lies within low-resource environments.
Resistin is a 12.5 kDa protein initially discovered as an ortholog belonging to the family of murine resistin-like molecules in 2001.11 Since its discovery, resistin has been implicated in an expanding list of acute and chronic inflammatory conditions including, but not limited to, rheumatoid arthritis,12 inflammatory bowel disease,13 systemic lupus erythematosus,14 renal disease,15 cardiovascular disease,16–20 trauma,21 and sepsis.22,23 It is unclear if resistin concentration can predict mortality in critically ill, adult patients with sepsis, and its use as a predictor of clinical severity compared to other inflammatory cytokines or clinical scores needs further investigation. Thus, we investigated human resistin concentration amongst critically ill adult subjects with sepsis. To validate our study alongside prior efforts, we correlated resistin concentrations to sequential organ failure assessment (SOFA) score,24 acute physiology and chronic health evaluation (APACHE) II score,25 and clinical biomarkers. Due to previous investigation suggesting the resistin protein shares a binding site with lipopolysaccharide (LPS) on toll-like receptor (TLR) 4, we investigated through the lens of gram-negative (GN) versus non-gram-negative (non-GN) sepsis. The main aim of this study was to investigate the potential for resistin concentration in early sepsis to predict mortality within 60 days. Secondary aims consisted of exploring associations between early sepsis resistin concentration and clinical disease severity scores and if these resistin concentrations discern between GN and non-GN etiologies of sepsis.
Materials and Methods
Study Design
This was a single-center exploratory study in a prospective observational cohort design. Resistin concentration was assessed in critically ill, adult patients with GN and non-GN sepsis. An additional focus was placed on the ability of resistin concentration to discern between GN and non-GN sepsis with the hypothesis that a relative difference in resistin expression may occur with exposure to LPS endotoxin. Subjects were screened and enrolled consecutively between July 2018 and November of 2018. Subjects were screened based on Sepsis-3 clinical parameters triggering a rapid response team activation protocol with assistance from the hospital’s rapid response nurse-led sepsis team.26 qSOFA was utilized for study inclusion instead of SIRS criteria for standardization purposes due to variability in availability of initial laboratory value results for complete assessment of SIRS criteria in the setting of different temporal and spatial presentations from the emergency department (ED) to the inpatient setting. Inclusion criteria consisted of admission to the intensive care unit, age 18 years or greater, and a qSOFA score of 2 or greater with a known or suspected infection. To include a wide array of comorbid disease processes to accurately represent the subject population, exclusion criteria were kept to a minimum and consisted of incarceration, pregnancy, or declination of consent by the subject or their surrogate. Race was self-reported by subjects or their surrogate decision-maker on a medical questionnaire form. Baseline characteristics included clinical severity indices, inflammatory biomarkers, cytokine concentrations, vasopressor use, invasive ventilation utilization, and admission length of stay as they related to GN sepsis and non-GN sepsis. A one-time peripheral venous blood sample from 19 non-septic volunteers not requiring hospitalization at the time of collection were obtained for baseline resistin levels.
Ethics Statement
This study was approved by a collaborative effort involving the institutional review boards of RUHS Medical Center (1024190–5) and the University of California, Riverside (HS-17-107 and HS-20-121). Formal written consent was obtained from each subject or a designated surrogate decision-maker for inclusion in the study. This study complies with the Declaration of Helsinki.
Primary and Secondary Outcomes
The primary outcome was all-cause mortality in both the GN sepsis and non-GN sepsis groups within 60 days. An interim analysis of all-cause mortality at 30 days was also assessed to establish a timeline for the progression of disease. Secondary outcomes consisted of association of resistin concentration with clinical severity scores, GN sepsis, and non-GN sepsis. Vasopressor use, number of days on invasive ventilation, and length of stay were also assessed.
Study Population and Characteristics
Riverside University Health System (RUHS) Medical Center is a 439-bed tertiary care teaching hospital located in Moreno Valley, California. It operates as a safety-net facility for underserved populations of Riverside County, CA. The coverage area includes most of the Inland Empire region spanning inland Southern California to the Arizona border.
Clinical Evaluation
Time zero (T0) was defined as the initial time point of peripheral venous blood draw at clinical recognition of sepsis in the ED, medical ward, or ICU. T0 was obtained within 60 minutes of rapid response team evaluation for sepsis criteria. If a peripheral venous blood draw was taken immediately prior to rapid response team evaluation, laboratory analysis for the parameters drawn were used as T0 values to minimize unnecessary venipunctures. T6 and T24 blood draws were designated as 6 hours and 24 hours after T0, respectively. Subjects were re-evaluated at 3, 6, and 24 hours. Standard of care sepsis management was implemented at the discretion of the treating physician. SOFA and APACHE II scores were utilized as validated assessments for severity of disease. Modified SOFA (mSOFA) was incorporated into the analysis since it is comparable to SOFA and can be used in subjects lacking data for arterial blood gas analyses.27 Using mSOFA provided a comprehensive inclusion of subjects with and without arterial blood gas analyses.
Clinical Data and Sample Collection
Two tubes containing 10mL each of peripheral venous blood samples were collected at T0, T6, and T24. Plasma resistin concentrations were compared between GN sepsis and non-GN sepsis groups to assess differences based on culture-proven presence of GN organisms. Based on finalized microbiological data, subjects were categorized as either GN sepsis or non-GN sepsis. Subjects with polymicrobial infections, fungal infections, or an indeterminate organism leading to sepsis, such as no growth on microbiological cultures, were categorized into the non-GN sepsis group. Due to the rapid diagnostic availability of point of care lactate analysis, some lactate concentrations reported are point of care results. However, lactate analysis was defaulted to hospital laboratory analyzed specimens when available. Ventilator use for subjects electively intubated for surgical intervention without acute lung injury were not included in total time on invasive ventilator. A medical questionnaire obtaining basic demographic information, chronic medical conditions, and medication use was collected by study personnel.
Laboratory Evaluation
All peripheral venous blood samples were recovered in Vacutainer glass collection tubes with heparin (BD Biosciences), transported at room temperature and processed within 24 hours. Gradient centrifugation with Histopaque-1077 was performed and plasma was recovered for cytokine quantification by cytokine bead array (BD Biosciences), and resistin ELISA (Peprotech). All reagents and plastics used were endotoxin-free.
Statistical and Bioinformatic Analysis
All demographics and outcomes of interest were summarized into comparisons between GN sepsis vs non-GN sepsis groups. Normally distributed continuous variables including age, APACHE II, SOFA, mSOFA, and white blood cell (WBC) count were expressed as mean with standard deviation and median range values. For these normally distributed continuous variables, t-test was utilized for analyzing differences between GN sepsis and non-GN sepsis groups. Continuous variables with skewed distribution, including plasma resistin and cytokine concentrations, were summarized as mean (SD) and median range (interquartile range, IQR). Wilcoxon sum rank test or Wilcoxon exact test were utilized to analyze variables with repeated values. IL-10 was analyzed using Tobit regression due to a zero-inflated outcome. Categorical variables were analyzed using Chi-square test or Fisher exact test to assess the difference between GN sepsis and non-GN sepsis groups. These were summarized as count frequencies and percentages. Correlations between resistin concentration and clinical severity measures, WBC counts, procalcitonin concentration, and cytokine concentrations were estimated using Spearman rank-based method. Estimates for statistical inference of important clinical parameters in relation to resistin concentrations were based on empirical linear regression or logistic regression due to the heterogeneity in variances across these outcomes. A correlation matrix was created using the R package corrplot .28 R package “corrplot”: Visualization of a Correlation Matrix (Version 0.84) is available from https://github.com/taiyun/corrplot. The area under the receiver-operating characteristics (ROC) curves for resistin concentration was used to determine a threshold value between survivors and non-survivors of all-cause mortality at 60 days. A p-value < 0.05 was considered statistically significant.
Plasma cytokine analysis was compared to RNA expression sets using NIH Gene Expression Omnibus archive. NIH GEO archive contains 17 human sepsis expression datasets from 6 platforms with data from 4412 individual samples (NIH GEO archive search was performed on May 27, 2019). We processed and used six of these datasets, focusing on the sets with available longitudinal data: http://immunodb.org/sepsis/.
Results
Baseline Characteristics
A total of 400 subjects were screened for sepsis throughout the hospital during the study period. Fifty-one subjects met inclusion criteria, and 45 subjects admitted to the ICU were included in the final analysis (Figure 1). Excluded subjects were comprised of 1 incarceration, 4 consent declinations, and 1 with cardiogenic shock rather than septic shock at post-hoc analysis. Thirty-two of 45 subjects had culture-proven isolates. Overall culture data revealed 47% gram-negative, 18% gram-positive, and 7% polymicrobial infections. The remaining 29% were indeterminate infections (Figure S1B). The most prominent isolate of GN sepsis was Escherichia coli from the genitourinary tract including extended-spectrum beta lactamase producers. Other etiologies of GN sepsis included Proteus, Pseudomonas, Klebsiella, and Haemophilus species. Of the non-GN sepsis group, organisms cultured were Staphylococcus including methicillin-resistant strains, Actinomyces, Enterococcus, Lactobacillus, and Bacillus (not anthracis) species. Non-GN sepsis etiologies included those subjects with indeterminate or no culture growth. Culture-proven organisms in both GN and non-GN sepsis groups were predominantly from the genitourinary, respiratory, and gastrointestinal systems.
 |
Figure 1 Flow diagram of subject enrollment and outcome. T0 = clinical recognition of sepsis; T24-high = highest measured resistin concentration within 24 hours of clinical sepsis recognition. *Two non-survivors within 30 days and 1 non-survivor within 60 days had polymicrobial infections including GN bacteria. One non-survivor within 30 days was transitioned to comfort care. |
Baseline characteristics of GN sepsis and non-GN sepsis groups were balanced (Table 1). Mean age was 60 ±14.7 years for GN sepsis and 60 ±17.5 for non-GN sepsis. Mean SOFA score for GN sepsis and non-GN sepsis was 8.38 ±4.92 and 9.88 ±4.43, respectively. Vasopressor use in the GN sepsis group was 85.71% with a median of 1 vasopressor agent (IQR 1–6) and in the non-GN sepsis group was 75% with a median of 2 vasopressor agents (IQR 1–5) (Table S1). The use of invasive ventilation in the GN sepsis group was 47.62% with total median time of 61 (IQR 10-1074.5) and in the non-GN sepsis group was 58.33% with a total median time of 115.25 (IQR 6.75–223.25). Intensive care unit length of stay for GN sepsis and non-GN sepsis groups were 3 days (IQR 2–80) and 5 days (IQR 1–37), respectively. Total length of stay for GN sepsis and non-GN sepsis groups were 12 days (IQR 2–132) and 9 days IQR 2–45), respectively. There was no statistical significance between the baseline characteristics of GN sepsis and non-GN sepsis groups.
 |
Table 1 Subject Characteristics and Laboratory Measurements Assessed by Gram-Negative (GN) Sepsis versus Non Gram-Negative (Non-GN) Sepsis |
Clinical and Immune Outcomes of Sepsis
There was no significant difference observed between the GN sepsis and non-GN sepsis groups with respect to age, sex, APACHE II, SOFA, mSOFA, and clinical laboratory parameters of WBC count, lactate concentration, procalcitonin concentration, and cytokine concentrations at T0 including IL-6, IL-8, and IL-10 (Table 1), number of vasopressor medications utilized, invasive ventilation utilization, and both ICU and hospital admission length of stays (Table S1). Overall mortality at 30 days was greater in the non-GN sepsis group having 10 non-survivors (41.67%) than the GN sepsis group with 3 non-survivors (14.29%), but this was without statistical significance. Three subjects in the non-GN group had polymicrobial infections that included culture-proven gram-negative organisms in addition to gram-positive and/or fungal organismal growth within the first 24 hours. All 3 of these subjects were non-survivors. One non-GN sepsis group subject was transitioned to comfort care and was deceased prior to 30 days. Of all deaths, 10 subjects had mortality prior to 30 days and only three subjects between 30 and 60 days.
For an overall perspective of clinical and immune parameters and potential correlations with outcomes, a correlation matrix was performed (Figure 2). There were no strong associations of sepsis etiology (GN vs non-GN). Mortality outcome exhibited the greatest correlation with mSOFA score, followed by resistin concentration (highest measured in 24 hours (T24-high)), and vasopressor use (yes/no). Lactate and procalcitonin (PCT) levels did not show many strong correlations with other parameters. Out of all the detectable cytokines (resistin, IL-6, IL-8), IL-6 and resistin exhibited the most positive correlations with the other parameters, including mortality within 60 days.
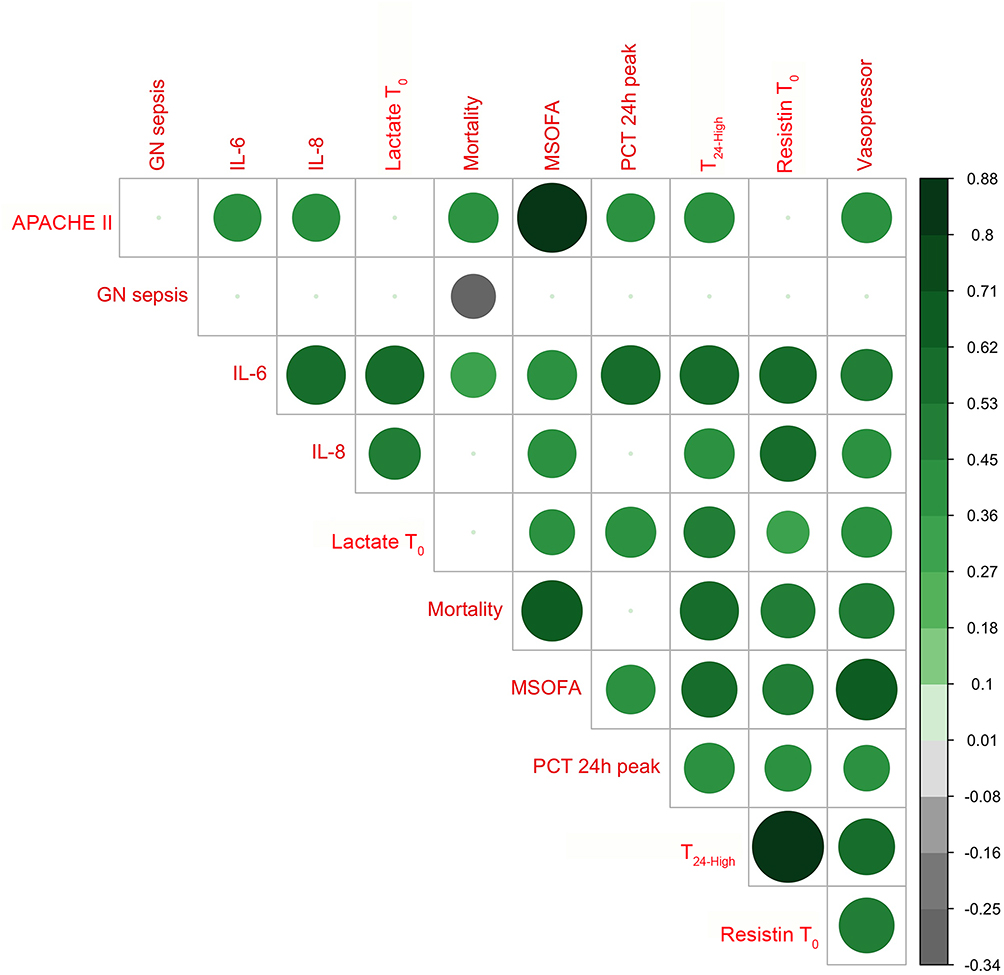 |
Figure 2 Correlation analysis of immune and clinical parameters. Circle size and saturation of color indicate the strength of the correlation; the color shows the direction of the relationship, with positive being green, negative being black. Multiple test correction was used the method of false discovery rate (FDR) and only the pair correlation with FDR < 0.05 presented circles. |
Association of Resistin with Immune and Clinical Parameters
Nineteen non-septic volunteers were used for baseline resistin concentrations (Figure S1A). Volunteers baseline resistin concentrations were similar to those of previous studies with a mean of 20.99 ng/mL and range of 4.98 ng/mL – 62.57 ng/mL.29,30 In the sepsis patients, resistin concentration at T0 showed positive correlation to SOFA, mSOFA, lactate at T0, and initial IL-6 and IL-8 concentrations (Table 2). Resistin concentration at T0 also had positive correlation with highest measured procalcitonin concentration and IL-1ß concentration. Resistin concentration at T24 showed positive correlation with SOFA, mSOFA, lactate at T0, IL-6, and highest measured procalcitonin concentrations. Resistin concentration at T24 had moderate positive correlation with APACHE II, IL-8, and IL-10 concentrations.
 |
Table 2 Correlation Between Resistin Concentration (T0 and T24) and Sepsis-Related Patient Variables (Spearman Rank-Based Correlation Coefficient) |
To evaluate the current study dataset measuring circulating cytokine levels against publicly available datasets, RNA expression sets using NIH Gene Expression Omnibus archive were processed and displayed on an online sepsis platform (http://immunodb.org/sepsis/). This analysis was performed to determine if gene expression levels are reflective of protein levels. Our current protein data is consistent with the NIH GEO RNA expression dataset GSE5451431 in observing that the highest expression of gene coding for resistin (RETN) was in non-survivors and the lowest in non-septic volunteers with sepsis expression in survivors falling between these two extremes and possibly decreasing with time (Figure 3). The consistency was unique for resistin as expression levels for genes coding for IL6 and IL8 were not noticeably related to survival (Figure 3A). Additionally, IL6 and IL8 mRNA levels were high in non-septic volunteers, while the corresponding IL6 and IL8 protein concentrations were low in the non-septic volunteers in our study (Figure 3B). On the other hand, resistin RNA and protein expression matched sepsis disease states (healthy, surviving, and non-surviving) (Figure 3A and 3B). This sepsis data viewer was used to visually evaluate molecular and immune parameters with sepsis severity and outcomes (Figure 3C), where it was shown that resistin and IL-6 protein levels from this current study were positively correlated with each other and mortality. On the other hand, in peripheral blood RNA expression datasets, resistin and IL-6 mRNA did not a show positive correlation, and only resistin mRNA levels are associated with mortality.
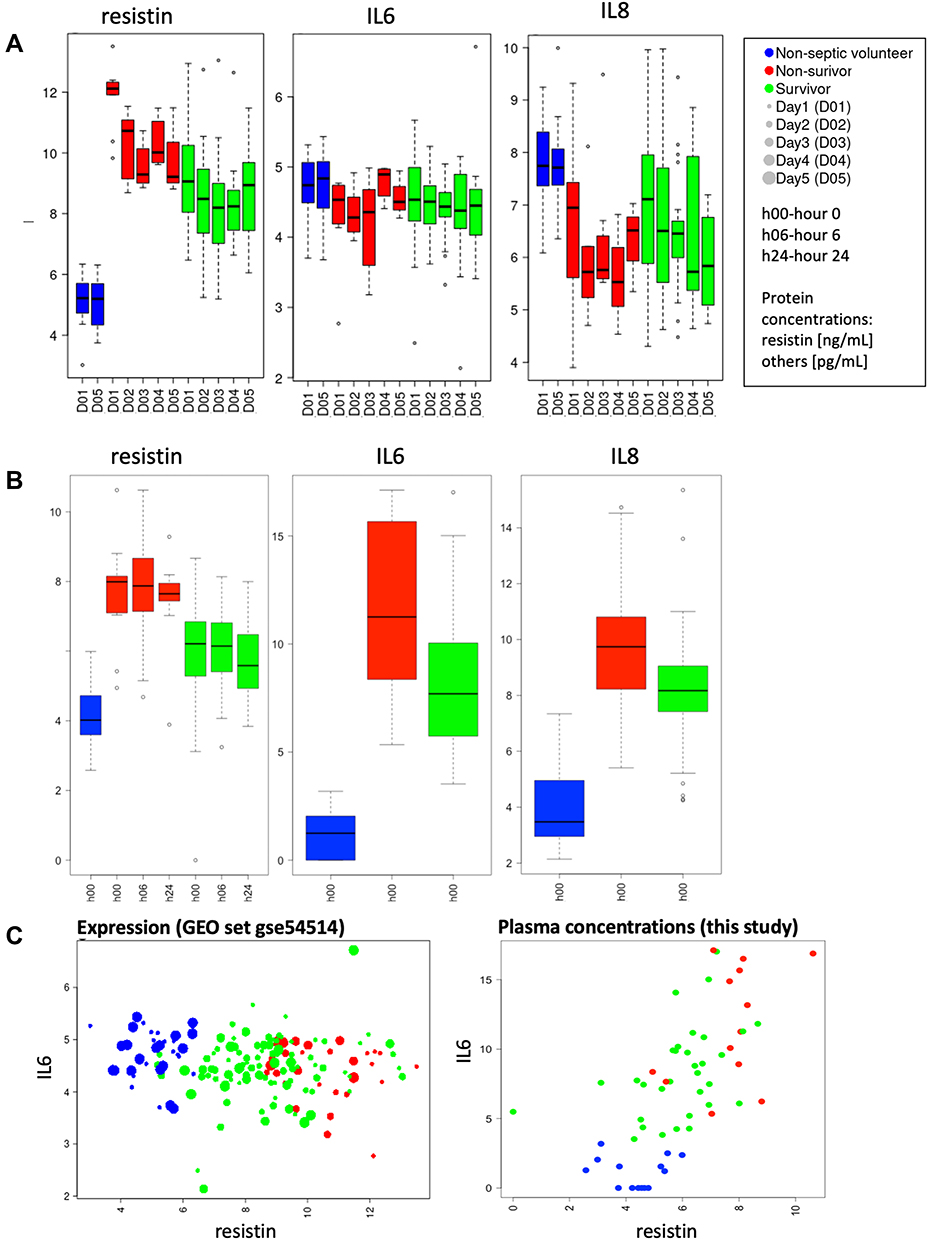 |
Figure 3 (A) Expression of genes coding for resistin, IL6, and IL8 in patients with different sepsis outcomes (GSE54514). (B) Protein levels of resistin (0, 6 and 24h), IL6 and IL8 (0h) in our dataset. (C) Correlations of genes coding for IL-6 and resistin in GSE54514 GEO (left panel) and plasma protein levels of IL-6 and resistin as reported in this study (right panel). Also see: http://immunodb.org/sepsis/. |
Association of Resistin with Sepsis Etiology and Mortality
Higher resistin concentration was associated with mortality in both GN sepsis and non-GN sepsis groups, with no significant difference in baseline resistin between GN and non-GN groups (Figure S1C). Evaluation of circulating resistin at T0 versus highest measured resistin over 24 hours (T24-high) between sepsis survivors and sepsis non-survivors (cumulative death within 60 days) revealed significantly increased resistin in fatal sepsis (Figure 4A and B). A threshold resistin concentration of 126 ng/mL at T0 by receiver operating curve (ROC) analysis was significantly associated with increased mortality at 60 days (p = 0.001) (Figure 4C). Similarly, a threshold resistin concentration determined by ROC analysis of 197 ng/mL for T24-high revealed significant association with mortality within 60 days (p < 0.001) (Figure 4D). ROC area under the curve (AUC) was of 0.82 and 0.88, respectively (Table 3). It should be noted that the majority of subjects with resistin levels greater than these threshold concentrations were deceased prior to 30 days. ROC analysis was performed for GN sepsis and non-GN sepsis groups with respect to T24-high resistin concentration. For the GN sepsis group, there was an AUC of 0.93 (95% CI: 0.80–1.00). Similarly, for the non-GN sepsis group there was an AUC of 0.89 (95% CI: 0.72–1.00). When pooled, AUC was 0.88 (95% CI: 73.65–1.00) (Table 3). ROC curves were compared between resistin concentrations at T0, T24-high, and SOFA, mSOFA, and APACHE II scores. Both T0 and T24-high resistin concentrations when pooled for all subjects showed similar or better sensitivity, specificity, and accuracy to SOFA, mSOFA, and APACHE II scores with respect to all-cause mortality. T24-high resistin concentration had equal or greater sensitivity, specificity, and accuracy for mortality when compared to SOFA scores in the GN and non-GN groups.
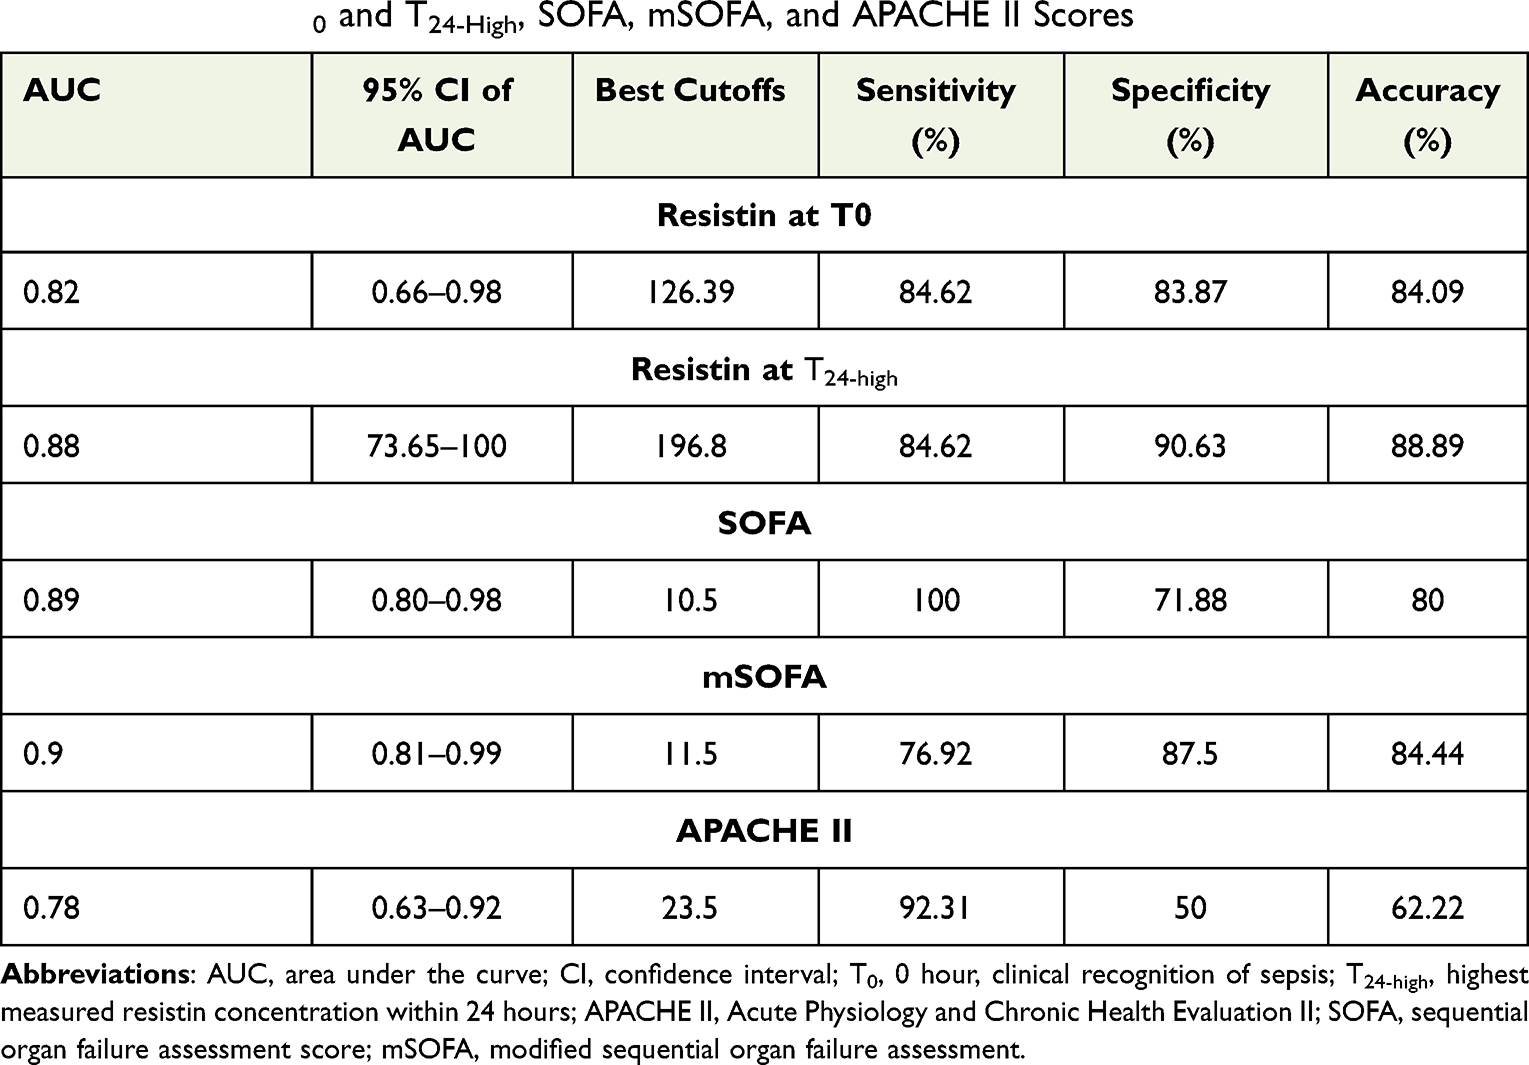 |
Table 3 Comparison of Performance Analysis for Mortality Prediction Between Resistin Concentrations at T0 and T24-High, SOFA, mSOFA, and APACHE II Scores |
 |
Figure 4 Resistin association with all-cause mortality. (A and B). Circulating resistin concentration (ng/mL) at T0 and at T24-high in sepsis survivors (S) and non-survivors (NS). (C) Kaplan-Meier curves for all-cause mortality stratified for resistin concentration threshold of > 126 ng/mL at T0, and (D) stratified for resistin concentration threshold T24-high of > 197 ng/mL. ***p<0.001; ****p<0.0001. |
Discussion
Our data support that elevated resistin concentration of > 126 ng/mL at clinical recognition of sepsis or > 197 ng/mL at any time within the first 24 hours after recognition of sepsis correlates with mortality within 60 days. In addition, resistin concentration correlates with clinical disease severity scores and inflammatory biomarkers. Despite sepsis being well-recognized as a systemic state of inflammation and immune dysregulation, the underlying mechanisms of the inflammatory response and the complexity of the innate immune system remains only partially understood. Although resistin concentration is elevated in a multitude of inflammatory conditions, how it influences the inflammatory cascade remains contentious. The class of TLR signaling, particularly the interaction of TLR4 with gram-negative bacteria with LPS-rich cell walls, may alter the degree of resistin production or signaling. If such a difference exists, its clinical utility as a biomarker would be supported. Correlation of resistin with known biomarkers of inflammation in the context of clinical disease has been demonstrated, including C-reactive protein (CRP), PCT, IL-6, IL-8, and TNF-α.22,23,32,33 Despite these efforts, the role of resistin in health and disease, and whether levels are changed in gram-negative versus other sepsis etiologies, remain poorly understood. The aim of this study was to determine whether resistin concentration within a 24-hour window following sepsis recognition was a useful predictor of sepsis outcomes and mortality. Several studies have investigated early biomarkers of sepsis, including resistin.22,23,32–36 Unique aspects to this study are: 1/ the investigation of resistin changes in the early time window of 24 hours post-sepsis recognition and utility as predictor of 60-day mortality, 2/ the evaluation of the sepsis etiology (gram-negative vs other) and association with resistin concentration, and 3/ the comparison of resistin protein versus gene expression from several RNA-seq datasets.
Resistin Concentrations Between 0 and 24 Hours of Clinical Recognition and Association with Sepsis Outcomes
Resistin levels in sepsis have been demonstrated in multiple prior studies to have positive correlation to validated and frequently used severity of disease classification systems.22,33,37 In this study, it was found that resistin concentrations of > 126 ng/mL at clinical recognition of sepsis or > 197 ng/mL within the first 24 hours of clinical recognition are statistically significant and associated with mortality within 60 days. A previous study showed that non-survivors had higher levels of resistin than survivors, however, these levels were not statistically significant at 28 days.37 The lack of statistical significance between resistin levels of non-survivors and survivors may have been related to the collection times between 24 hours and 2 weeks. A more recent study with focus on resistin at day 0 and day 7 supports the ability of resistin concentration in adult intensive care subjects to be predictive of mortality.33 Our study supports that resistin levels are dynamic early in the course of sepsis and builds on this knowledge by suggesting changes over 24 hours may offer more predictive value. This focus on the early hours of sepsis in our study was intentional to provide a biomarker that may improve early detection of severe disease and significant clinical impact. MacDonald et al22 reported levels of resistin in severe sepsis and septic shock comparable to our study with highest median value approximately 180 ng/mL at clinical recognition. This is similar to the threshold values of T0 resistin at 126 ng/mL and T24-high at 197 ng/mL of our study. We have observed these threshold values to be associated with 60-day mortality, however, the majority of mortality occurred within the first 30 days.
Prior to this current study, there has been no threshold value of resistin concentration reported with a high specificity, sensitivity, and accuracy for predicting mortality. Sepsis-related mortality and resistin concentration has been studied in the neonatal population and may reflect commonalities in adult disease. Cekmez et al reported that resistin concentrations were comparable to CRP, procalcitonin, and IL-6 concentrations in determining neonatal sepsis with a cutoff value of greater than 8 ng/mL, which afforded a 93% sensitivity and 95% specificity for diagnosis of sepsis.32 Aliefendioglu et al reported a resistin concentration of 50 ng/mL as a cutoff for a diagnosis of sepsis in neonates.34 Resistin concentrations have been reported up to the 30–40 ng/mL range in adults without sepsis,30 but it should be noted that baseline concentrations in the neonatal population are generally lower. When reflecting on the substantial difference in body size between neonates and the adult population, it is reasonable to consider that resistin may have greater influence on neonates at lower concentrations than the equivalent concentration in adults.32,34,35 This may be at least in part due to relative body size characteristics although differences in metabolism and immune function also likely have an influence.
Overall, our data suggest early elevation in resistin concentration correlates to SOFA, mSOFA, and APACHE II scores in predicting mortality within 60 days and implicates mSOFA score and T24-high resistin concentration as best correlates of sepsis outcomes. In general, mortality outcomes for all sepsis subjects were consistent with previously published mortality data.6,7 Both resistin concentration at T0 and T24-high afforded greater specificity and accuracy for mortality when sepsis groups were pooled compared to SOFA, mSOFA, or APACHE II scores. The ability to predict similar mortality outcome to well-validated clinical scoring indices through a single plasma laboratory analyte may prove to be advantageous for clinicians treating critically ill patients with sepsis. This objective assessment of mortality risk could prove more rapid, simplistic, easier to obtain and more readily available than the recruitment of a cumbersome allotment of clinical data over the first 24 hours. However, this approach would not replace the importance of the clinical parameters involved in SOFA and APACHE II scores, as they have crucial independent implications for the septic patient.
Resistin Concentration in GN Sepsis and Non-GN Sepsis
Discerning a clinically useful resistin concentration associated with GN sepsis has the potential to impact the choice of initial antimicrobial treatment in the crucial early hours of sepsis. Previous studies have shown that resistin expression is induced by LPS,37–39 the main component of gram negative bacterial cell wall, and that resistin can bind the innate receptor for LPS, TLR4.40,41 Higher concentrations of resistin have been reported in gram-positive sepsis compared to gram-negative sepsis in a subset analysis of a previous study, although without statistical significance.37 In the neonatal population, higher resistin concentrations have been observed in GN sepsis compared to gram-positive sepsis. In this study, the mean resistin concentration at T0 was not found to be significantly different between GN and non-GN sepsis. In this current dataset, it is important to note that the non-GN sepsis category is not explicitly reserved for gram-positive sources. This non-GN sepsis group may have included non-bacterial sources of sepsis such as fungal or viral etiologies, particularly in subjects with indeterminate sepsis etiologies. This must be considered when drawing associations and conclusions regarding the GN sepsis versus non-GN sepsis groups. It is possible that resistin is increased more in bacterial infections in general. Being that all individuals in the GN sepsis group had laboratory confirmed presence of GN bacteremia, it could be that GN presence was not the source of association seen with resistin concentration, but merely a concomitant finding. The non-GN sepsis group did not have unanimous laboratory confirmation of a particular infectious organism, let alone a bacterial organism, with some subjects yielding no cultured organism. The lack of statistical significance in resistin concentration baseline characteristics between GN sepsis and non-GN sepsis may be due to different stages of sepsis at presentation, presence or absence of bacteremia, or a difference in initial inoculum of GN bacteria resulting in different LPS concentrations at the onset of disease.
Resistin and Inflammatory Cytokine Protein Levels and Associations with Public RNA-Seq Datasets
Resistin concentration is elevated alongside known and clinically useful laboratory parameters of sepsis and the inflammatory state such as WBC, lactate, creatinine, d-dimer, CRP, and procalcitonin.23,37 Resistin has been argued to be both superior to CRP in diagnosis of neonatal sepsis as well as inferior to CRP and procalcitonin.13,23,32–35,42 However, successful efforts have been made to correlate resistin levels to the classic inflammatory cytokines IL-6, IL-8, and TNF-α, as well as the anti-inflammatory cytokine IL-10, amongst others.22,23,32,33 Elevation in plasma resistin concentration persists days to weeks after presentation despite decline in IL-6, IL-8, IL-10, and TNF-α.37 Our study agrees with these findings, showing a strong correlation with resistin, IL-6, and IL-8 within the first 24 hours (Table 2, Figure 2). IL-10 more strongly correlated with resistin concentration at T24 than T0, which may be an indication of a counter mechanism to the classical inflammatory cascade.
Comparing the protein data from this current study to publicly available RNA expression datasets for sepsis (http://immunodb.org/sepsis/), consistency in resistin RNA and protein expression was noted: the highest expression of gene coding for resistin (RETN) was in non-survivors and the lowest in non-septic volunteers, with sepsis expression in survivors falling between these two extremes and possibly decreasing with time (Figure 3). This consistency was unique for resistin as expression levels for genes coding for IL-6 and IL-8 were not noticeably related to survival suggesting that IL-6 and IL-8 protein concentrations are more clinically relevant than the corresponding RNA levels in sepsis. This sepsis data viewer provides an effective and efficient tool to assess and compare multiple RNA expression sets and their correlation with sepsis severity, which could prove useful to clinical and biomedical researchers.
Limitations
Our study has limitations. First, our small sample size affords greater potential for statistical error, particularly with statistical inference calculations. Second, these inferential statistical calculations only allow for associations and correlations within our data set and cannot be utilized or extrapolated for cause-and-effect relationships. Third, the non-GN sepsis group was inclusive of all other etiologies of sepsis which added confounding variables of potential fungal, viral, and alternative causative agents for the inflammatory response with potential influence on resistin production outside that of the TLR4 receptor and its downstream effects. The notion of a negative blood culture does not rule out the presence of fastidious organisms. Variability in the clinical severity of sepsis upon presentation and potentially different inoculum of GN bacteremia, hence different concentrations of LPS, may have confounded results. Due to the limitation of sample size, larger studies are indicated to better evaluate this discrepancy. Additionally, the missing T6 and T24 peripheral venous samples from those subjects that died prior to these collection times may have had an additional effect on the interpretation of relationships with secondary clinical outcomes as would the total time on vasopressors, invasive ventilation, and length of stay. Lastly, consideration must be given to the complexity of the immune response and the potential for multiple pathways involving resistin. Continued basic science investigation and further prospective clinical studies are needed to better elucidate the mechanistic relationships of resistin that are clinically relevant. These endeavors could lead to better understanding of early elevations in resistin concentration as they relate to GN sepsis and overall sepsis mortality. Particularly, studies focusing on resistin concentration at multiple early intervals within the first 24 hours of sepsis presentation through dual study arms of high versus low resistin concentration, perhaps differentiated at a threshold near the concentrations denoted in our study, are needed to validate our data trends.
Conclusion
In conclusion, our study showed positive correlation of elevated resistin concentration to mortality, as well as clinical disease severity scores and inflammatory biomarkers. Additionally, we observed threshold concentrations at clinical recognition of sepsis predicting increased mortality risk. A significant difference in resistin concentration between GN sepsis and non-GN sepsis during early sepsis was not seen, likely in part due to sample size limitation. Further justification is needed to clarify this objective. Nonetheless, the correlation of resistin concentration to all-cause mortality and clinical severity scores may prove useful as an early guide in the overall clinical management of patient’s presenting with sepsis, particularly when other diagnostic resources are limited.
Abbreviations
GN, gram-negative; SOFA, sequential organ failure assessment; mSOFA, modified sequential organ failure assessment; APACHE, acute physiology and chronic health evaluation; SIRS, systemic inflammatory response syndrome; IL-6, interleukin-6; IL-8, interleukin-8; IL-10, interleukin-10; IL-1b, interleukin-1 beta; IL-12p70, interleukin-12p70; TNF-α, tumor necrosis factor alpha.
Acknowledgments
This study was supported by the Dean’s innovation grant, UCR School of Medicine to JB and MGN; NIH/NIAID R21AI137830 to MGN. We would like to thank Dr. Hashini Batugedara and Mr. Sang Woo for blood processing, the RUHS Rapid Response Team led by Tammy Lowe for peripheral venous blood sample collection, the Riverside Free Clinic led by Dr. Paul Lyons and Dr. Erica Heinrich for specimen collection from non-septic volunteers, and Dasari Puvvula for assistance with clinical data collection. JB and JL contributed equally, and WK and MN contributed equally to this work.
Disclosure
The authors report no conflicts of interest in this work.
References
1. Beutler B, Poltorak A. Sepsis and evolution of the innate immune response. Crit Care Med. 2001;29(7Suppl):
2. Rivers E, Nguyen B, Havstad S, et al. Early goal-directed therapy in the treatment of severe sepsis and septic shock. N Engl J Med. 2001;345(19):1368–1377. doi:10.1056/NEJMoa010307
3. Rhodes A, Evans LE, Alhazzani W, et al. Surviving sepsis campaign: international guidelines for management of sepsis and septic shock: 2016. Intensive Care Med. 2017;43(3):304–377. doi:10.1007/s00134-017-4683-6
4. Yealy DM, Kellum JA, Huang DT, et al. A randomized trial of protocol-based care for early septic shock. N Engl J Med. 2014;370(18):1683–1693. doi:10.1056/NEJMoa1401602
5. Peake SL, Delaney A, Bailey M, et al. Goal-directed resuscitation for patients with early septic shock. N Engl J Med. 2014;371(16):1496–1506. doi:10.1056/NEJMoa1404380
6. Mouncey PR, Osborn TM, Power GS, et al. Trial of early, goal-directed resuscitation for septic shock. N Engl J Med. 2015;372(14):1301–1311. doi:10.1056/NEJMoa1500896
7. Soong J, Soni N. Sepsis: recognition and treatment. Clin Med. 2012;12(3):276–280. doi:10.7861/clinmedicine.12-3-276
8. Stevenson EK, Rubenstein AR, Radin GT, Wiener RS, Walkey AJ. Two decades of mortality trends among patients with severe sepsis: a comparative meta-analysis*. Crit Care Med. 2014;42(3):625–631. doi:10.1097/CCM.0000000000000026
9. Fleischmann C, Scherag A, Adhikari NK, et al. Assessment of global incidence and mortality of hospital-treated sepsis. Current estimates and limitations. Am J Respir Crit Care Med. 2016;193(3):259–272. doi:10.1164/rccm.201504-0781OC
10. Adhikari NK, Fowler RA, Bhagwanjee S, Rubenfeld GD. Critical care and the global burden of critical illness in adults. Lancet. 2010;376(9749):1339–1346. doi:10.1016/S0140-6736(10)60446-1
11. Steppan CM, Bailey ST, Bhat S, et al. The hormone resistin links obesity to diabetes. Nature. 2001;409(6818):307–312. doi:10.1038/35053000
12. Bokarewa M, Nagaev I, Dahlberg L, Smith U, Tarkowski A. Resistin, an adipokine with potent proinflammatory properties. J Immunol. 2005;174(9):5789–5795. doi:10.4049/jimmunol.174.9.5789
13. Konrad A, Lehrke M, Schachinger V, et al. Resistin is an inflammatory marker of inflammatory bowel disease in humans. Eur J Gastroenterol Hepatol. 2007;19(12):1070–1074. doi:10.1097/MEG.0b013e3282f16251
14. Almehed K, d’Elia HF, Bokarewa M, Carlsten H. Role of resistin as a marker of inflammation in systemic lupus erythematosus. Arthritis Res Ther. 2008;10(1):R15. doi:10.1186/ar2366
15. Ellington AA, Malik AR, Klee GG, et al. Association of plasma resistin with glomerular filtration rate and albuminuria in hypertensive adults. Hypertension. 2007;50(4):708–714. doi:10.1161/HYPERTENSIONAHA.107.095257
16. Reilly MP, Lehrke M, Wolfe ML, Rohatgi A, Lazar MA, Rader DJ. Resistin is an inflammatory marker of atherosclerosis in humans. Circulation. 2005;111(7):932–939. doi:10.1161/01.CIR.0000155620.10387.43
17. Ohmori R, Momiyama Y, Kato R, et al. Associations between serum resistin levels and insulin resistance, inflammation, and coronary artery disease. J Am Coll Cardiol. 2005;46(2):379–380. doi:10.1016/j.jacc.2005.04.022
18. Qiao XZ, Yang YM, Xu ZR, Yang LA. Relationship between resistin level in serum and acute coronary syndrome or stable angina pectoris. J Zhejiang Univ Sci B. 2007;8(12):875–880. doi:10.1631/jzus.2007.B0875
19. Zuniga MC, Raghuraman G, Hitchner E, Weyand C, Robinson W, Zhou W. PKC-epsilon and TLR4 synergistically regulate resistin-mediated inflammation in human macrophages. Atherosclerosis. 2017;259:51–59. doi:10.1016/j.atherosclerosis.2017.02.021
20. Lv M, Liu W. Hypoxia-induced mitogenic factor: a multifunctional protein involved in health and disease. Front Cell Dev Biol. 2021;9:691774. doi:10.3389/fcell.2021.691774
21. Ehrnthaller C, Flierl M, Perl M, et al. The molecular fingerprint of lung inflammation after blunt chest trauma. Eur J Med Res. 2015;20:70. doi:10.1186/s40001-015-0164-y
22. Macdonald SP, Stone SF, Neil CL, et al. Sustained elevation of resistin, NGAL and IL-8 are associated with severe sepsis/septic shock in the emergency department. PLoS One. 2014;9(10):e110678. doi:10.1371/journal.pone.0110678
23. Koch A, Gressner OA, Sanson E, Tacke F, Trautwein C. Serum resistin levels in critically ill patients are associated with inflammation, organ dysfunction and metabolism and may predict survival of non-septic patients. Crit Care. 2009;13(3):R95. doi:10.1186/cc7925
24. Vincent JL, Moreno R, Takala J, et al. The SOFA (Sepsis-related Organ Failure Assessment) score to describe organ dysfunction/failure. On behalf of the working group on sepsis-related problems of the European society of intensive care medicine. Intensive Care Med. 1996;22(7):707–710. doi:10.1007/BF01709751
25. Knaus WA, Draper EA, Wagner DP, Zimmerman JE. APACHE II: a severity of disease classification system. Crit Care Med. 1985;13(10):818–829. doi:10.1097/00003246-198510000-00009
26. Singer M, Deutschman CS, Seymour CW, et al. The third international consensus definitions for sepsis and septic shock (Sepsis-3). JAMA. 2016;315(8):801–810. doi:10.1001/jama.2016.0287
27. Grissom CK, Brown SM, Kuttler KG, et al. A modified sequential organ failure assessment score for critical care triage. Disaster Med Public Health Prep. 2010;4(4):277–284. doi:10.1001/dmp.2010.40
28. Wei T, Viliam S, Package R. “corrplot”: visualization of a correlation matrix; 2017.
29. Malyszko J, Malyszko JS, Kozminski P, Pawlak K, Mysliwiec M. Elevated resistin is related to inflammation and residual renal function in haemodialysed patients. Nephrology. 2007;12(3):246–253. doi:10.1111/j.1440-1797.2007.00782.x
30. Cohen G, Ilic D, Raupachova J, Hörl WH. Resistin inhibits essential functions of polymorphonuclear leukocytes. J Immunol. 2008;181(6):3761–3768. doi:10.4049/jimmunol.181.6.3761
31. Parnell GP, Tang BM, Nalos M, et al. Identifying key regulatory genes in the whole blood of septic patients to monitor underlying immune dysfunctions. Shock. 2013;40(3):166–174. doi:10.1097/SHK.0b013e31829ee604
32. Cekmez F, Canpolat FE, Cetinkaya M, et al. Diagnostic value of resistin and visfatin, in comparison with C-reactive protein, procalcitonin and interleukin-6 in neonatal sepsis. Eur Cytokine Netw. 2011;22(2):113–117. doi:10.1684/ecn.2011.0283
33. Karampela I, Christodoulatos GS, Kandri E, et al. Circulating eNampt and resistin as a proinflammatory duet predicting independently mortality in critically ill patients with sepsis: a prospective observational study. Cytokine. 2019;119:62–70. doi:10.1016/j.cyto.2019.03.002
34. Aliefendioglu D, Gürsoy T, Çağlayan O, Aktaş A, Ovalı F. Can resistin be a new indicator of neonatal sepsis? Pediatr Neonatol. 2014;55(1):53–57. doi:10.1016/j.pedneo.2013.04.012
35. Gokmen Z, Ozkiraz S, Kulaksizoglu S, et al. Resistin–a novel feature in the diagnosis of sepsis in premature neonates. Am J Perinatol. 2013;30(6):513–517. doi:10.1055/s-0032-1329182
36. Qiu X, Li J, Bonenfant J, et al. Dynamic changes in human single-cell transcriptional signatures during fatal sepsis. J Leukoc Biol. 2021;110(6):1253–1268. doi:10.1002/JLB.5MA0721-825R
37. Sundén-Cullberg J, Nyström T, Lee ML, et al. Pronounced elevation of resistin correlates with severity of disease in severe sepsis and septic shock. Crit Care Med. 2007;35(6):1536–1542. doi:10.1097/01.CCM.0000266536.14736.03
38. Lu SC, Shieh WY, Chen CY, Hsu SC, Chen HL. Lipopolysaccharide increases resistin gene expression in vivo and in vitro. FEBS Lett. 2002;530(1–3):158–162. doi:10.1016/s0014-5793(02)03450-6
39. Rajala MW, Lin Y, Ranalletta M, et al. Cell type-specific expression and coregulation of murine resistin and resistin-like molecule-alpha in adipose tissue. Mol Endocrinol. 2002;16(8):1920–1930. doi:10.1210/me.2002-0048
40. Tarkowski A, Bjersing J, Shestakov A, Bokarewa MI. Resistin competes with lipopolysaccharide for binding to toll-like receptor 4. J Cell Mol Med. 2010;14(6B):1419–1431. doi:10.1111/j.1582-4934.2009.00899.x
41. Jang JC, Li J, Gambini L, et al. Human resistin protects against endotoxic shock by blocking LPS-TLR4 interaction. Proc Natl Acad Sci U S A. 2017;114(48):E10399–E10408. doi:10.1073/pnas.1716015114
42. Kibe S, Adams K, Barlow G. Diagnostic and prognostic biomarkers of sepsis in critical care. J Antimicrob Chemother. 2011;66(Suppl 2):ii33–40. doi:10.1093/jac/dkq523
 © 2022 The Author(s). This work is published and licensed by Dove Medical Press Limited. The
full terms of this license are available at https://www.dovepress.com/terms
and incorporate the Creative Commons Attribution
- Non Commercial (unported, 3.0) License.
By accessing the work you hereby accept the Terms. Non-commercial uses of the work are permitted
without any further permission from Dove Medical Press Limited, provided the work is properly
attributed. For permission for commercial use of this work, please see paragraphs 4.2 and 5 of our Terms.
© 2022 The Author(s). This work is published and licensed by Dove Medical Press Limited. The
full terms of this license are available at https://www.dovepress.com/terms
and incorporate the Creative Commons Attribution
- Non Commercial (unported, 3.0) License.
By accessing the work you hereby accept the Terms. Non-commercial uses of the work are permitted
without any further permission from Dove Medical Press Limited, provided the work is properly
attributed. For permission for commercial use of this work, please see paragraphs 4.2 and 5 of our Terms.
Recommended articles
Role of Procalcitonin in Predicting Mortality and Organ Dysfunction at Intensive Care Admission
Suranadi IW, Sinardja CD, Suryadi IA
International Journal of General Medicine 2022, 15:4917-4923
Published Date: 12 May 2022
Predictive Performance of the NEWS‒Lactate and NEWS Towards Mortality or Need for Critical Care Among Patients with Suspicion of Sepsis in the Emergency Department: A Prospective Observational Study
Dadeh AA, Kulparat M
Open Access Emergency Medicine 2022, 14:619-631
Published Date: 17 November 2022
Albumin Level is Associated with Short-Term and Long-Term Outcomes in Sepsis Patients Admitted in the ICU: A Large Public Database Retrospective Research
Cao Y, Su Y, Guo C, He L, Ding N
Clinical Epidemiology 2023, 15:263-273
Published Date: 3 March 2023
Multidrug-Resistant Bacteria on Critically Ill Patients with Sepsis at Hospital Admission: Risk Factors and Effects on Hospital Mortality
Maia MDO, da Silveira CDG, Gomes M, Fernandes SES, Bezerra de Santana R, de Oliveira DQ, Amorim FFP, Neves FDAR, Amorim FF
Infection and Drug Resistance 2023, 16:1693-1704
Published Date: 23 March 2023
LASSO-Based Identification of Risk Factors and Development of a Prediction Model for Sepsis Patients
Hong C, Xiong Y, Xia J, Huang W, Xia A, Xu S, Chen Y, Xu Z, Chen H, Zhang Z
Therapeutics and Clinical Risk Management 2024, 20:47-58
Published Date: 7 February 2024