
Back to Journals » Journal of Inflammation Research » Volume 19
Prediction of Imminent Peritoneal Dialysis-Associated Peritonitis Using Time-Updated Electronic Health Records and Machine Learning: A Temporal Validation Study
Authors Wang Q, Luo Q, Ding Y, Wan S, Zhang Y, Xiong F
Received 27 January 2026
Accepted for publication 26 March 2026
Published 17 April 2026 Volume 2026:19 595197
DOI https://doi.org/10.2147/JIR.S595197
Checked for plagiarism Yes
Review by Single anonymous peer review
Peer reviewer comments 2
Editor who approved publication: Dr Caterina Carollo
Quan Wang,* Qing Luo,* Yanqiong Ding, Sheng Wan, Yanmin Zhang, Fei Xiong
Department of Nephrology, Wuhan No.1 Hospital, Wuhan, 430030, People’s Republic of China
*These authors contributed equally to this work
Correspondence: Fei Xiong, Department of Nephrology, Wuhan No.1 Hospital, No. 215 of Zhongshan Avenue, Wuhan, Hubei, 430030, People’s Republic of China, Tel +86027-85860666, Email [email protected]
Objective: To develop and validate a robust machine learning (ML) model for the onset of peritoneal dialysis-associated peritonitis (PDAP) within three months using time-updated data from routine electronic health record (EHR).
Methods: A retrospective cohort analysis of 1143 unique continuous ambulatory PD (CAPD) patients generating 25,710 quarterly assessments (patient-semesters) from 2017 to 2025 was randomly divided into training (n=8537 observations), internal validation (n=8538), and temporal validation (n=6635 observations, 2024– 2025) sets. Thirty-one EHR variables were processed via low-variance filtering, correlation analysis, and Boruta selection. Nine ML models (including a Stacking ensemble model) were constructed with patient-level stratified 10-fold cross-validation, optimizing for recall to minimize missed diagnoses. The primary outcome was PDAP onset within three months after routine laboratory tests.
Results: In internal validation cohort, the stacking model achieved good performance with area under the curve (AUC) of 0.811 (95% CI 0.792– 0.830) and the highest recall of 0.794 (95% CI 0.769– 0.819). In temporal validation cohort, it maintained robust good classification performance, achieving AUC of 0.795 (95% CI 0.771– 0.819) and the highest recall of 0.833 (95% CI 0.792– 0.874). The SHapley Additive exPlanation analysis identified several key features, supporting model interpretability and clinical utility for PDAP risk stratification.
Conclusion: Integrating time-updated EHR data with ML enables robust and clinically actionable PDAP risk stratification, facilitating timely interventions to optimize CAPD patient management and reduce peritonitis-related complications.
Keywords: peritonitis, machine learning, peritoneal dialysis, risk prediction, dynamic data, time-updated
Introduction
Continuous ambulatory peritoneal dialysis (CAPD) is a vital renal replacement therapy (RRT) for end-stage kidney disease (ESKD) patients, offering home-based flexibility and residual renal function preservation.1 However, PD-associated peritonitis (PDAP) remains a leading complication, severely contributing to morbidity, technique failure, and increased healthcare costs.2–4 Despite advances in antibiotic therapies and catheter care, recurrent PDAP persists, highlighting an urgent need for improved early detection strategies.
Previous studies have identified various clinical and biochemical PDAP risk factors, however, established risk stratification models rely primarily on static baseline measurements.5,6 These models fail to capture the dynamic nature of patients’ clinical trajectories, resulting in suboptimal predictive performance. In addition, most studies focused on PDAP onset within a fixed period, overlooking the variability in recurrence patterns and the need for imminent risk assessment.7,8
Machine learning (ML) offers a promising approach for enhancing predictive accuracy by integrating multidimensional clinical data and exploring nonlinear relationships and interactions among predictors.9,10 In the context of ESKD, though several models have been explored for the onset and prognosis of ESKD patients, comprehensive analyses leveraging time-updated and longitudinal data for PDAP prediction remain scarce.11,12 Moreover, while Zhou et al developed ML models for early-onset PDAP, their approach utilized baseline static data rather than time-updated assessments, limiting real-time risk stratification during long-term CAPD follow-up.13 Hence, this study aimed to develop and validate ML models using routine time-updated data for PDAP occurring within the subsequent three months, time-updated EHR data, capturing temporal fluctuations in patient status to establish a robust, interpretable tool for clinical practice.
Materials and Methods
Study Design and Population
A retrospective cohort study was conducted on CAPD patients treated at Wuhan No.1 Hospital, a large dialysis center in central China, between January 2017 and May 2025. Relevant clinical guidelines for peritoneal dialysis recommend that all patients undergo blood laboratory tests approximately every 3 months, with even more frequent re-evaluations for those with unstable clinical conditions. Moreover, the electronic health record (EHR) system collects routine patient data quarterly, ensuring at least four annual assessments for patients not lost to follow-up (death, hemodialysis transition, or kidney transplantation). On these basis, we selected the 3-month timeframe as the prediction window for this study.
Inclusion criteria were: (1) age ≥ 18 years, (2) CAPD as initial RRT for a minimum of 3 months, and (3) availability of complete EHR data for all predictor variables. Exclusion criteria included: (1) transition from hemodialysis or failed renal transplant, (2) missing or unclear EHR data, (3) transferred to external dialysis centers, and (4) transfer to HD or kidney transplantation at our center within 3 months. Ultimately, this study included 1143 unique CAPD patients generating 25,710 quarterly assessments (patient-semesters) from 2017 to 2025. To ensure no data leakage and preserve the independence of validation sets, we implemented a two-stage splitting strategy:
Temporal split: All observations were divided by calendar time into a derivation cohort (19,075 observations from 854 unique patients, collected between January 2017 and December 2023) and a temporal validation cohort (6,635 observations from 289 unique patients, collected between January 2024 and May 2025). No overlap in calendar time existed between the predictor measurements and outcome windows of the derivation and temporal validation cohorts. Of note, the same patient may contribute observations to both the derivation and temporal validation cohorts, as patients received ongoing CAPD treatment across the study period; however, the strict time-based split eliminates look-ahead bias, as the model is trained exclusively on earlier data and tested on later, unseen future data.
Patient-level stratified split for internal validation: Within the 2017–2023 derivation cohort, we performed a random split at the unique patient to generate the training set (50% of unique patients, contributing 8537 observations) and internal validation set (remaining 50% of unique patients, contributing 8538 observations). This patient-level split ensures that all observations from a single patient are exclusively assigned to either the training or internal validation set, with no patient overlap between the two sets, completely eliminating data leakage between model development and internal validation.
The study was approved by the Wuhan No.1 Hospital Ethics Committee (No.2025–71), with waived informed consent due to retrospective design and patient de-identification.
Data Collection and Processioning
To develop a user-friendly prediction model without imposing additional medical expenses, we included only characteristics that were readily available in the EHR database, such as demographics, dialysis duration, and laboratory findings. A total of 31 variables were extracted from EHRs, and the detailed features included in this study are listed in the Supplemental Table 1. We structured all data in a time-updated format, with each row representing a unique, individual laboratory assessment (from a quarterly follow-up visit), linked to a strictly subsequent, non-overlapping 3-month outcome window for the primary endpoint. For patients with multiple laboratory assessments within a single 3-month period, each assessment was included as a separate observation, with each linked exclusively to the 3-month outcome window following that specific test date. This structure ensures that all predictor variables are measured before the outcome window, with no look-ahead bias or overlap between predictor and outcome data. Each observation is treated as a time-updated risk assessment, reflecting the patient’s most recent clinical status at the time of testing.
The primary outcome is defined as the first onset of PDAP within the 3-month window following the routine laboratory assessment. Peritonitis was defined as meeting at least two of the following criteria:1 turbid peritoneal dialysis effluent;2 a white blood cell counts in peritoneal dialysis effluent exceeding 100/mm3 with 50% polymorphonuclear leukocytes; and3 a positive culture from peritoneal dialysis effluent.
Feature Selection
To address multi-collinearity among clinical variables that could weaken the predictive ability of models, we employed a three-step strategy for feature dimensionality reduction and selection. Initially, low-variance features, which provided minimal discriminative power, were discarded. Subsequently, to reduce redundancy, features exhibiting a high pairwise correlation (Spearman correlation coefficient > 0.8) were removed. Finally, we utilized the Boruta feature selection method, a valuable tool for identifying all relevant features, through the “Boruta” R package to further select important indices.
ML Models Construction and Evaluation
ML models for 3-month PDAP risk stratification were developed using the training dataset. Eight established ML algorithms were selected: Logistic Regression (LR), Random Forest (RF), k-Nearest Neighbors (KNeighbors), Decision Tree (DT), Adaptive Boosting (AdaBoost), eXtreme Gradient Boosting (XGBoost), Light Gradient Boosting Machine (LightGBM), Support Vector Machine (SVM), and a Stacking ensemble classifier. The selection of base models and the meta-model in the stacking framework was guided by both prior research and empirical evaluation during preliminary experiments. In this study, we employed three diverse ML algorithms - LightGBM, RF, XGBoost - as base models. Each base model is trained on the training dataset and generated predictions, which were then used as input features for the meta-learner. The meta-learner, implemented using LR, learned from these predictions and produced the final classification output.14
To address the significant class imbalance between PDAP events and non-event observations in the training set, we applied the Synthetic Minority Over-Sampling Technique (SMOTE) exclusively to the training set, after the patient-level split into training and internal validation sets was completed. SMOTE was used to resample the minority class (PDAP events) to generate a balanced class distribution for model training. Crucially, the model’s final evaluation was performed on pristine, non-synthesized validation sets.
Hyperparameter tuning was conducted via a structured grid search with patient-level stratified 10-fold cross-validation on the training set only. Specifically, the cross-validation folds were split at the unique patient level: all observations from a single patient were assigned to the same fold, ensuring that no patient’s data appeared in both the training and validation subsets during cross-validation. The search spaces for key parameters were defined based on established literature and software conventions, ensuring a systematic and repeatable optimization process focused on maximizing recall.
Model performance was assessed across the internal validation and temporal validation cohorts. Performance metrics, including accuracy, sensitivity, specificity, F1 score, and Brier score were calculated. Discriminatory ability was evaluated using the area under the receiver operating characteristic curve (AUC). The Brier score served as a quantitative measure of both discrimination and calibration, with lower scores indicating superior performance. Calibration plots were utilized to visually assess the agreement between model-predicted probabilities and actual observed outcomes.
Feature Importance and Model Interpretation
Given the inherent complexity of ML models, which often function as “black boxes,” we employed SHapley Additive exPlanations (SHAP) to enhance the interpretability of the best-performing model. SHAP summary analysis provided global insight into overall feature importance across the dataset. For local, instance-level explanations, Local Interpretable Model-agnostic Explanations (LIME) were implemented to clarify the rationale behind individual predictions. Furthermore, SHAP dependence plots were generated for the four most influential features to visualize how variations in each feature impact the model’s output.
Statistical Analysis
Baseline characteristics were compared using t-tests for normally distributed continuous variables, Mann–Whitney U-tests for non-normally distributed variables, and chi-square tests for categorical variables. All analyses were performed in R (version 4.3.2) and Python (version 3.11). Detailed information on the analysis and feature selection is provided in the supplementary materials. A two-sided p-value <0.05 was considered statistically significant.
Result
Baseline Characteristics
The baseline characteristics of all patients are presented in Table 1. Most features, including the 3-month PDAP, differed significantly between two cohorts. The mean age was 58 years, and there were 1022 (5.4%) and 300 (4.5%), respectively, laboratory tests were conducted within three months before the onset of PDAP in both cohorts.
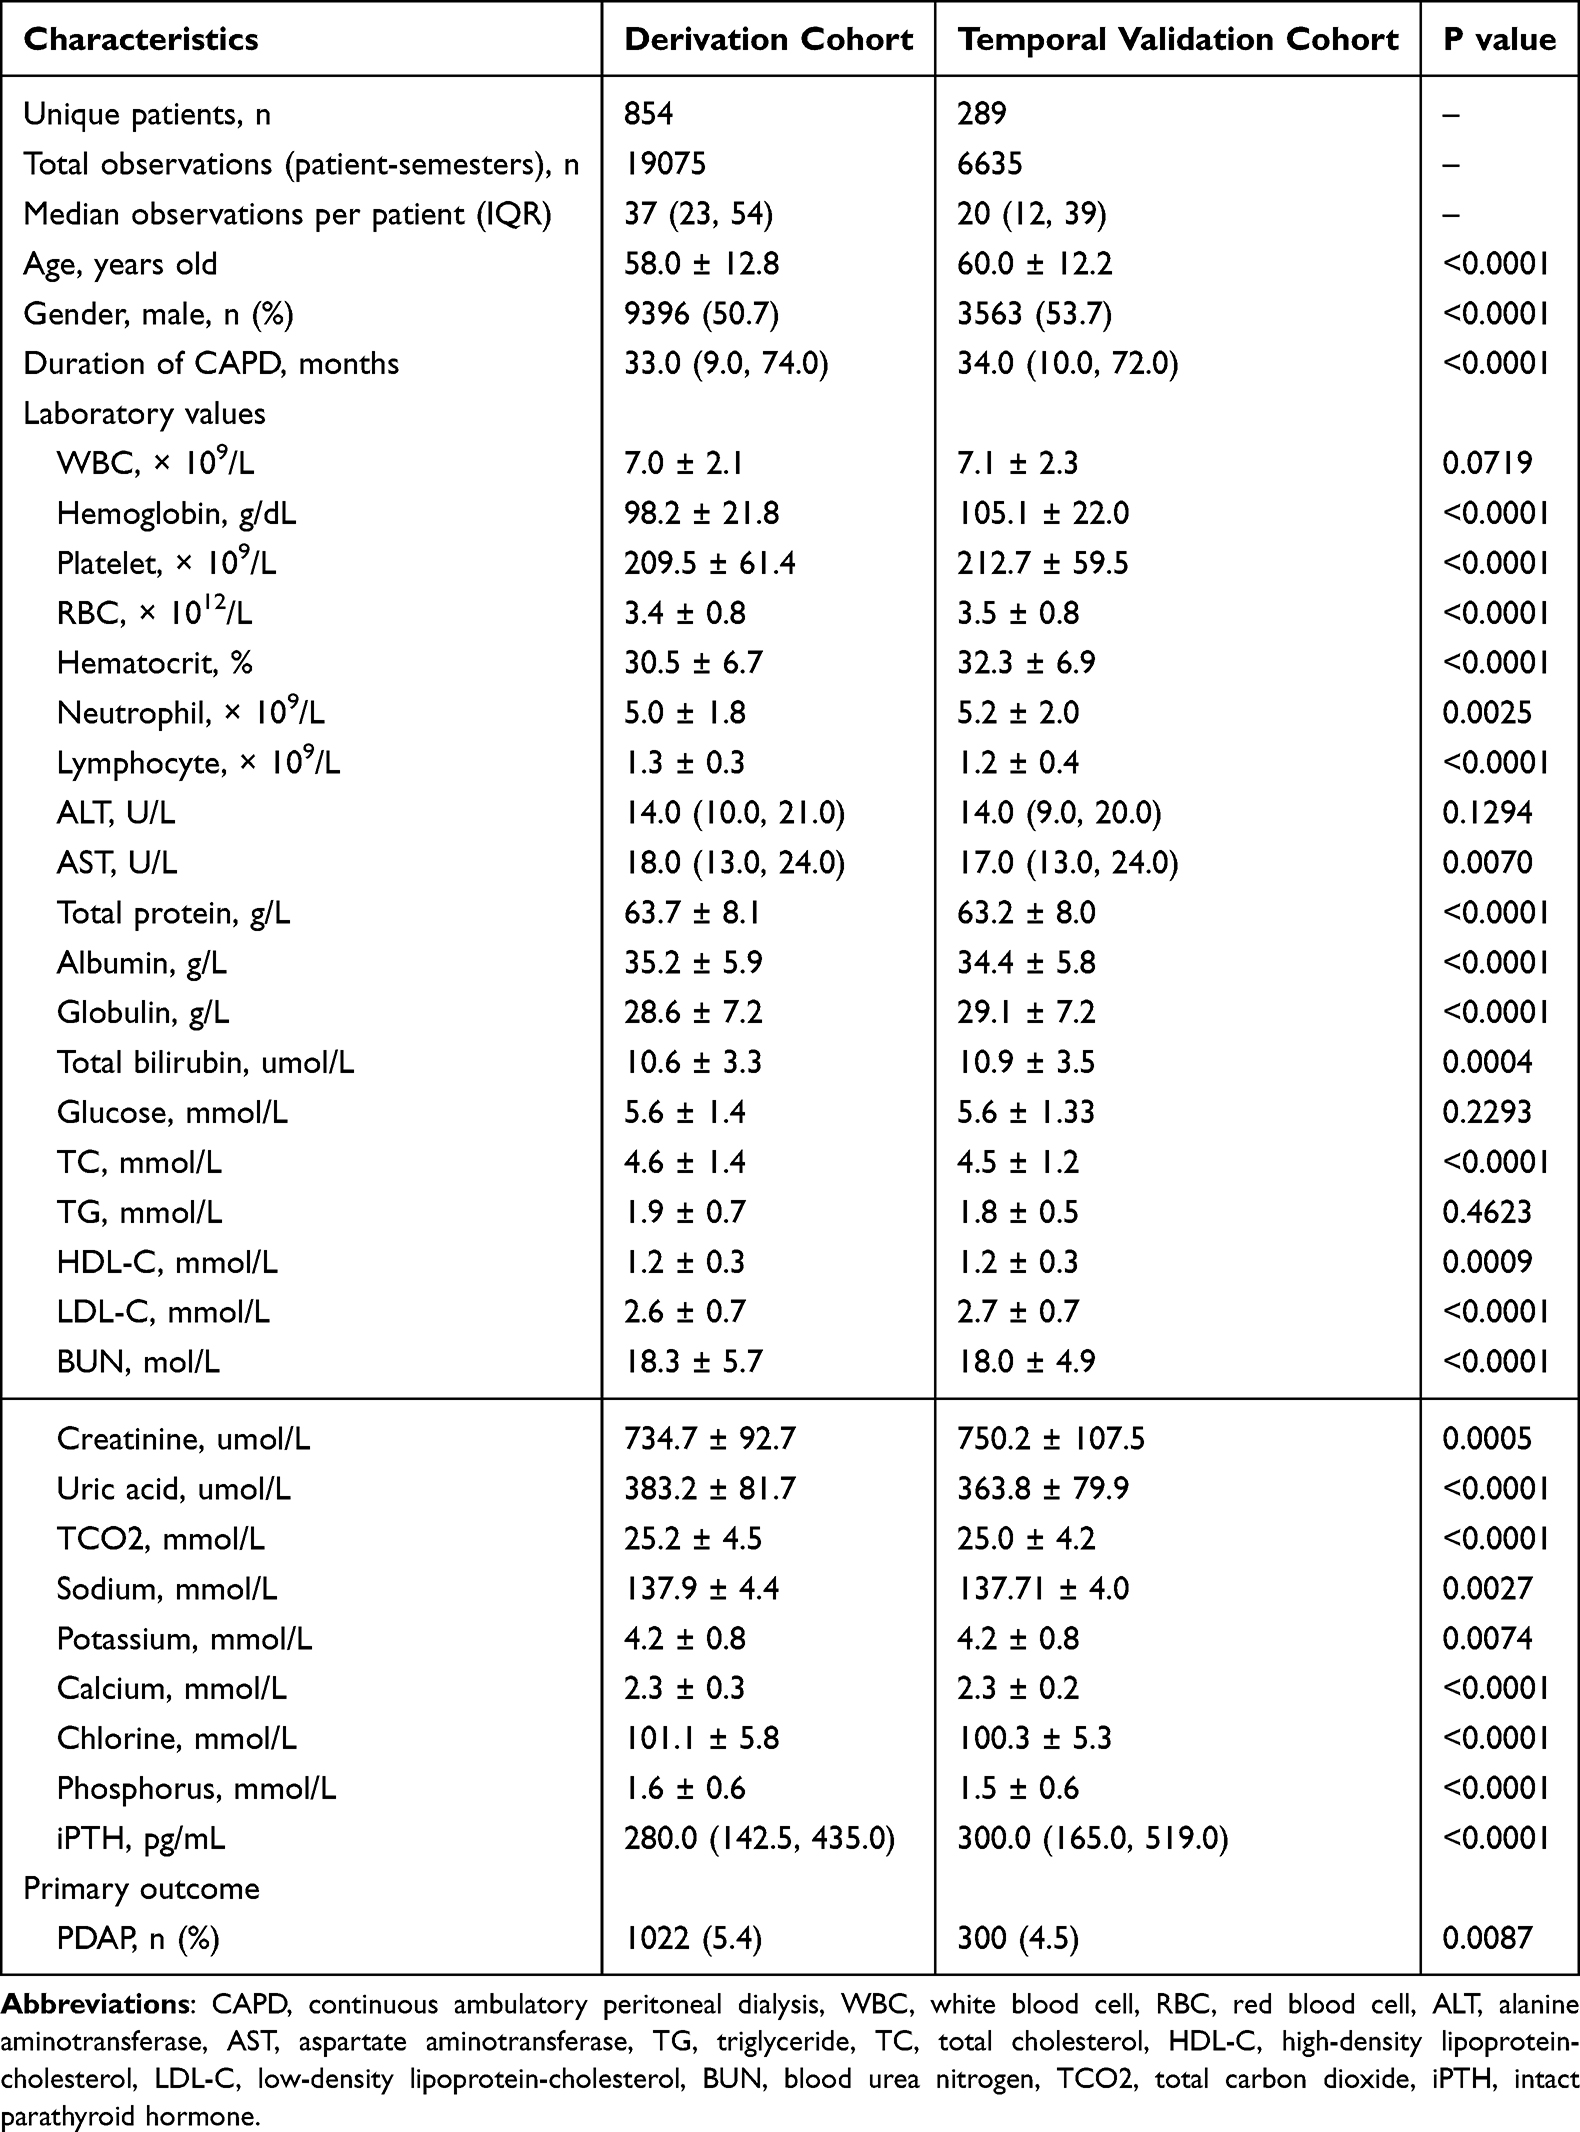 |
Table 1 Comparisons of Baseline Characteristics in All Cohorts |
Construction of ML Models in the Training Set
Three demographic features and 28 blood indices were initially included in this analysis. First, the Spearman correlation analysis indicated that no clinical features had strong correlations with others. Subsequently, the Boruta feature selection method was employed to further identify important features related to PDAP. As displayed in Figure 1, three clinical features (gender, glucose, and intact parathyroid hormone) were identified as less important and were therefore excluded.
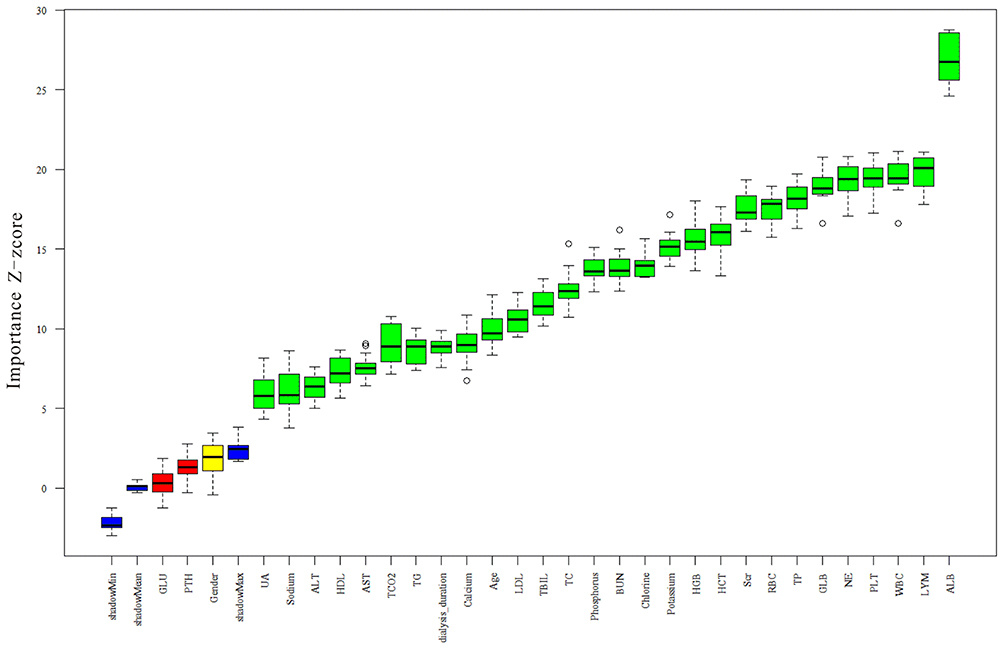 |
Figure 1 The feature importance based on Boruta feature selection method. |
Nine ML techniques were utilized to select important clinical indices and construct predictive models for 3-month PDAP. Figure 2A and Table 2 describes the performance of PDAP risk stratification models in the internal validation dataset. Among these models, stacking model provided the good performance with AUC of 0.811 (95% CI 0.792–0.830) and the highest Recall of 0.794 (95% CI 0.769–0.819), outperforming other models. Additional predictive parameters, including specificity, sensitivity, and Brier score, are presented in Table 2. Calibration curves, confusion matrices, and precision - recall plots indicated satisfactory performance for all nine models (Supplemental Figure 1, Supplemental Figure 3, and Supplemental Figure 5).
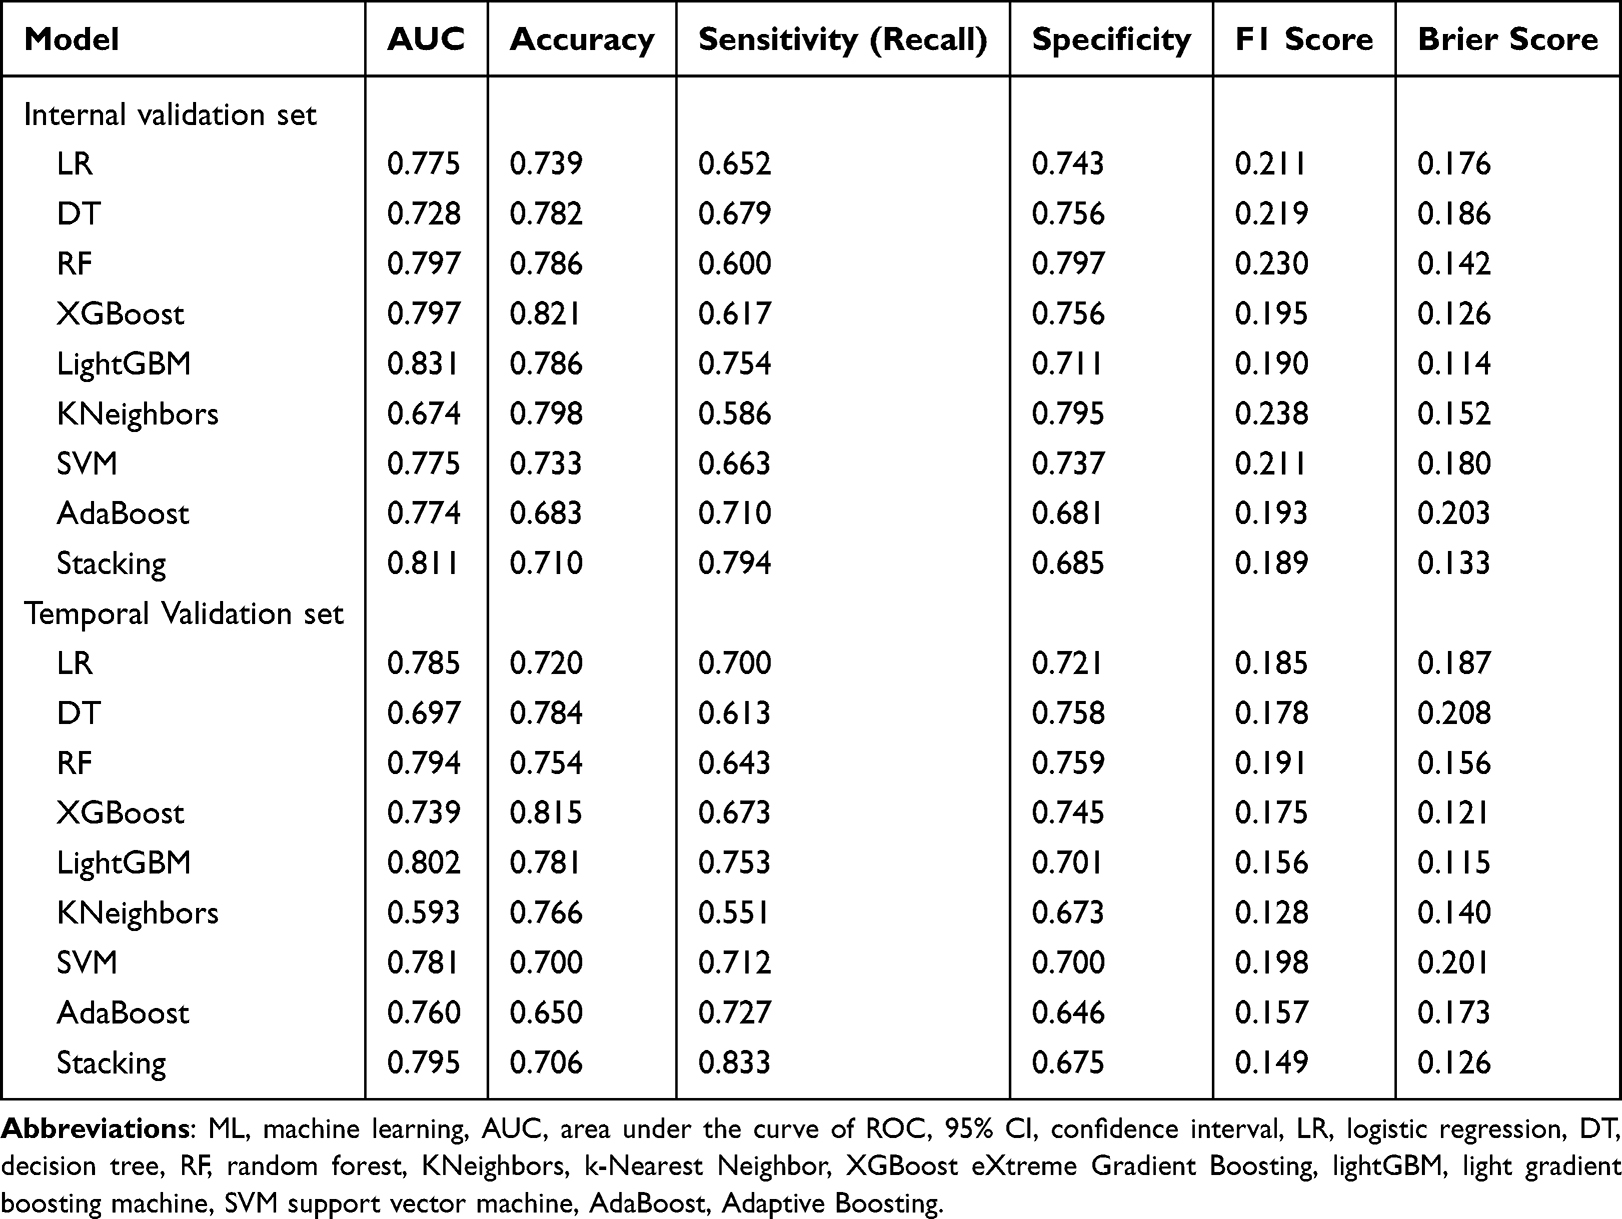 |
Table 2 Performance of the ML Prediction Models Using All Features |
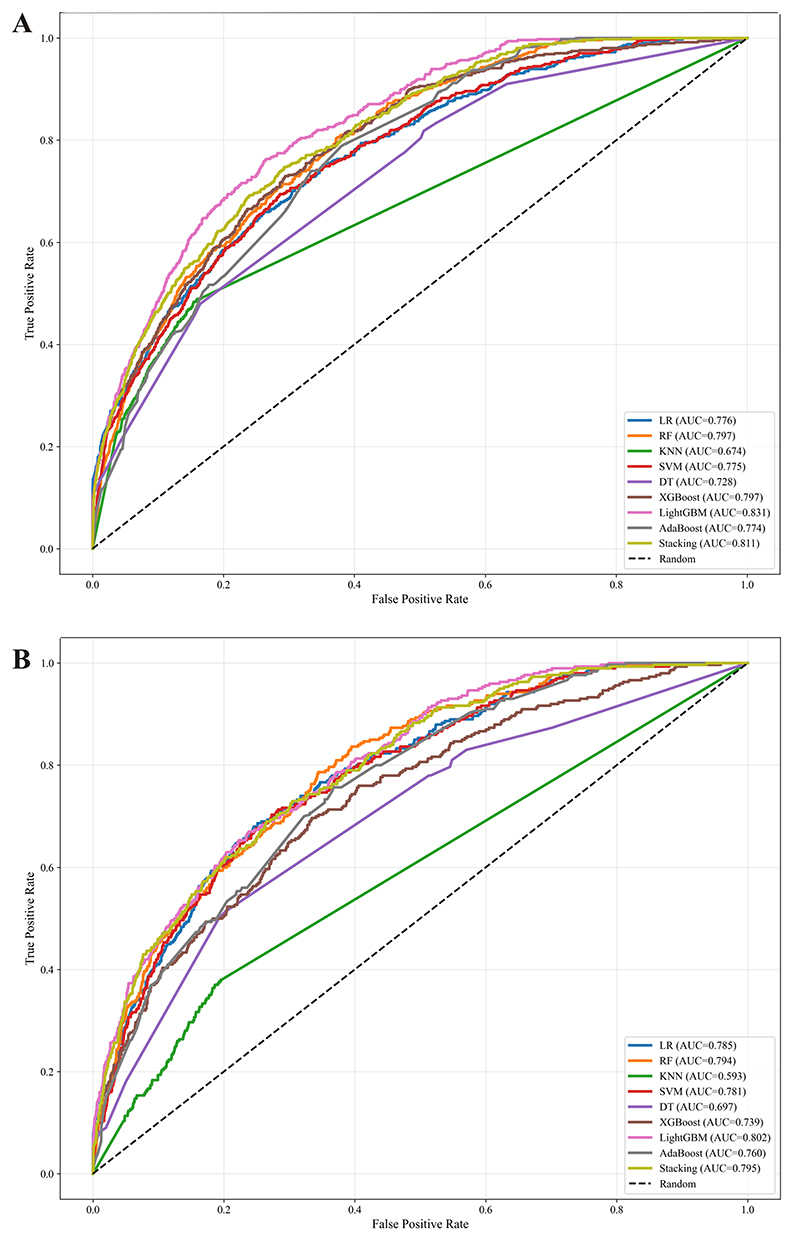 |
Figure 2 The ROC curves of nine machine learning models for the prediction of PDAP in the internal validation cohort (A) and in the temporal validation cohort (B). |
ML Model Interpretations with SHAP
We employed the SHAP method to interpret the stacking model effectively. SHAP analysis provided insights into the stacking model’s functionality at both global and local levels. Global explanations illustrated the overall contributions of top 10 clinical features to the predictive model, assessed using average SHAP values (Figure 3A), and the top 10 features in order of importance are: albumin, hemoglobin, dialysis duration, serum creatinine, potassium, total carbon dioxide, total bilirubin, lymphocytes, white blood cell count, and total protein (Figure 3B). We further explored clinically meaningful pairwise interactions between our top-ranked predictive features to refine the model's clinical interpretability. Notably, we identified a significant synergistic interaction between low serum albumin and prolonged dialysis duration: the risk-increasing effect of hypoalbuminemia on 3-month PDAP onset was markedly amplified in patients with longer dialysis duration, with this combination driving a more substantial elevation in infection risk than either factor alone. For local interpretation, SHAP dependence plots revealed how individual top four features, albumin, total carbon dioxide, serum creatinine, and hemoglobin, influence predictions made by the stacking model (Figure 4A–D). SHAP values less than 0 generally corresponded to predictions of the negative class (indicating low 3-month PDAP risk).
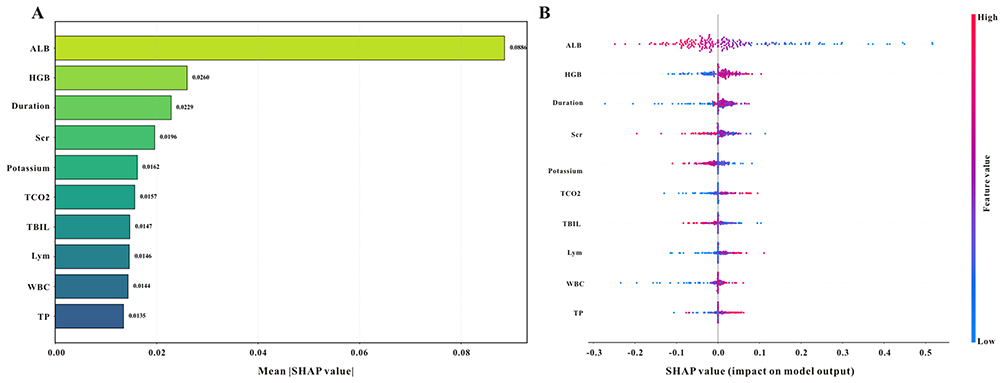 |
Figure 3 Global explanation for the Stacking model by the SHAP analysis. The SHAP summary bar plot (A) and SHAP summary dot plot (B) display the feature importance in the Stacking model. |
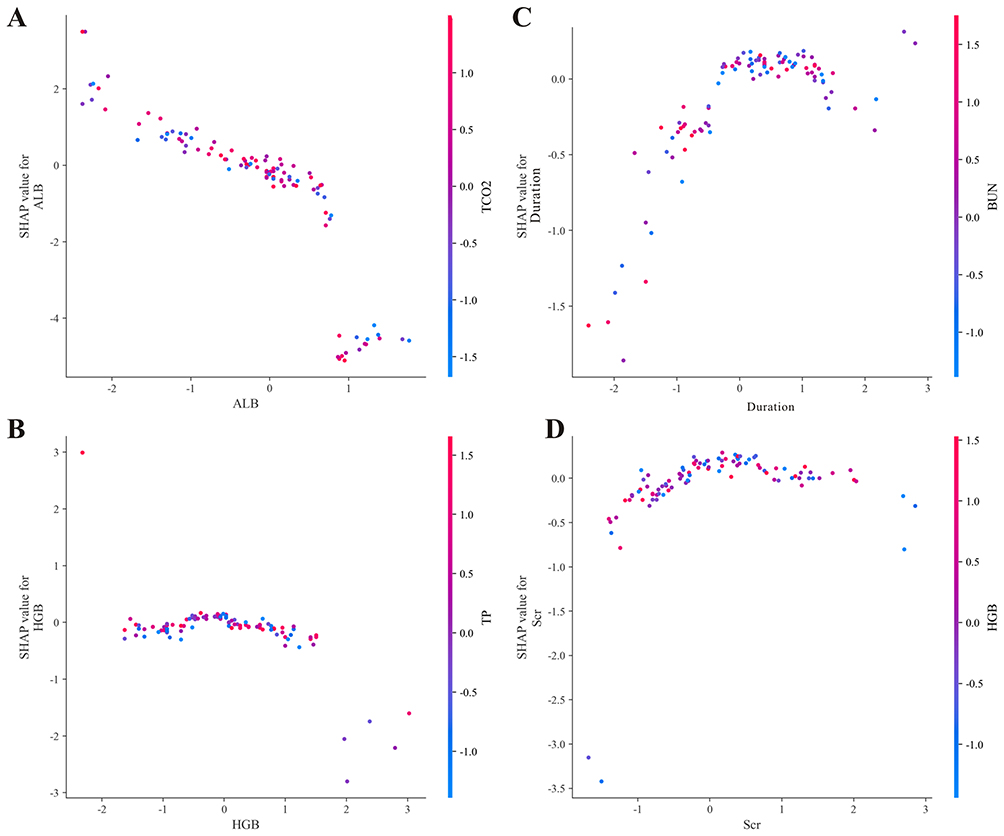 |
Figure 4 (A–D) SHAP dependence plots show the top four key features in the Stacking model. |
Examples of Real Application with the Stacking Model
We presented two additional cases, one with PDAP and the other without PDAP, which were accurately classified by the stacking model using the LIME method to demonstrate the clinical applicability and practical value of the model in real-world clinical scenarios. Figure 5A illustrates a case with PDAP, which was correctly categorized as having peritonitis (the probability of PDAP was 0.84), primarily attributed to the following factors: high levels of neutrophil, low levels of lymphocyte and potassium, and the middle range of albumin, along with the corresponding values of serum creatinine exerted an adverse impact on the final classification result. Notably, the “middle range of albumin” in this case was flagged as a minor risk-contributing factor, which appears to contradict the global finding that low albumin is the strongest predictor of high PDAP risk. This discrepancy is explained by the nonlinear feature interactions captured by the stacking model: in the context of this patient’s multiple other high-risk abnormal parameters, a mid-range albumin level (which is not protective) contributed to the overall risk prediction, rather than acting as an independent risk factor in isolation. This example highlights the importance of instance-level interpretability, as the model integrates all of a patient’s clinical features to generate a personalized risk assessment, rather than relying on population-level threshold effects. Therefore, local interpretation utilizing the LIME algorithm holds significant clinical significance for assisting clinicians in assessing the risk of Peritonitis. We then described a case without PDAP, which was correctly identified as no peritonitis (the probability of PDAP was 0.16), mainly determined by the following conditions: elevated dialysis duration, high levels of age and potassium (Figure 5B).
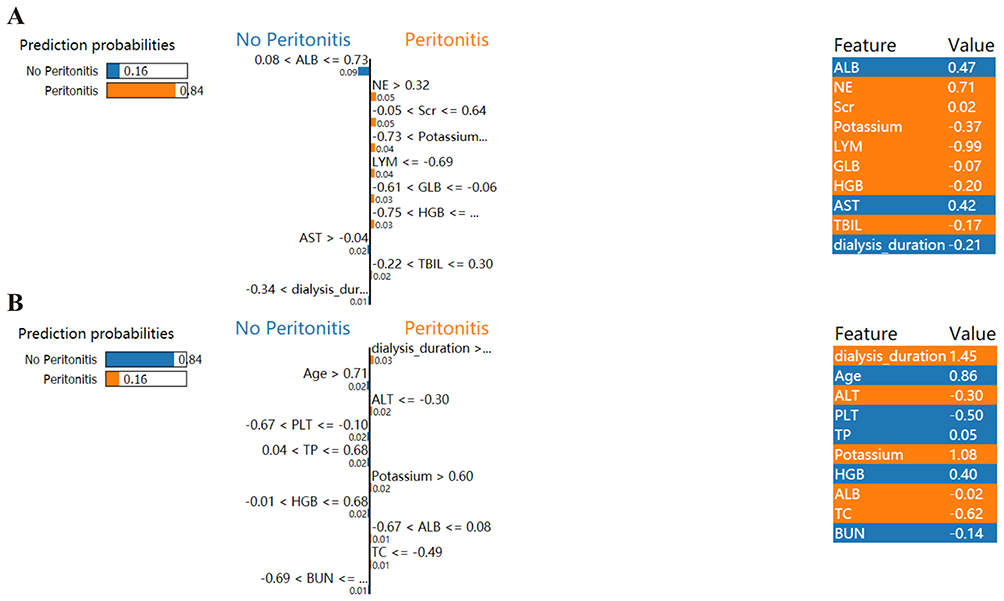 |
Figure 5 Local Interpretable of the Stacking model based on the LIME method. LIME plots for the for the case who was PDAP (A) and the case who was not PDAP (B). |
Temporal Validation of the ML Models
In the temporal validation dataset, the stacking model also had good classification performance with AUC of 0.795 (95% CI 0.771–0.819), and showed the best Recall of 0.833 (95% CI 0.792–0.874) compared to other ML models, a high Recall indicated a lower PDAP missed diagnosis rate (Figure 2B). Additional predictive parameters are also displayed in Table 2. Calibration curves, confusion matrices, and precision - recall plots indicated satisfactory performance for all eight models in the temporal validation cohort (Supplemental Figure 2, Supplemental Figure 4, and Supplemental Figure 6).
Discussion
This study first resorted nine advanced ML models for the subsequent 3-month PDAP in CAPD patients using routinely available and time-updated EHR data and demonstrated that the excellent predictive ability of the stacking model in both internal validation and temporal validation cohorts, highlighting the robustness and universality of the EHR data-based model. Importantly, the SHAP method provides transparent explanation of the stacking model. In brief, these results provide an innovative strategy for the convenient and accurate prediction of PDAP among CAPD patients, emphasizing the importance of routinely available and time-updated EHR data in combination with ML techniques.
PDAP remains a devastating complication, often leading to CAPD technique failure and increased mortality. The recurrence of peritonitis episodes often precipitates technique failure, leading to premature discontinuation of PD and transition to hemodialysis, thereby increasing healthcare burden and adversely affecting patient quality of life.15,16 Epidemiological data indicate a persistent incidence rate of peritonitis in CAPD patients, hence, it’s vital for effective early identification and intervention strategies to mitigate its detrimental sequelae.17 A large number of biomarkers, including inflammatory cytokines,18 nutritional parameters,19,20 and indexes in the peritoneal dialysis effluent and systemic circulation,21,22 had been explored to have predictive value for PDAP in CAPD patients; however, most of those were measured statically and the predictive effectiveness varies. And more importantly, current researches predominantly relied on baseline indicators to predict the incidence of PDAP within a single fixed period, overlooking the imbalance in its occurrence – that is, some patients remain peritonitis-free for extended durations while others experience repeated episodes within a short timeframe. Thus, to some extent, it loses clinical relevance in predicting how a patient’s current results reflect their impending risk of peritonitis, which could otherwise guide timely interventions and then improve their prognosis. In this study, the indices used in our model were easily retrieved and time-updated, and more crucially, the indexes were basic assessment items for all CAPD patients, posing no additional load on them. Our findings extend previous epidemiological correlations by integrating machine learning to quantify risk contributions of these factors dynamically, enabling refined stratification beyond static categorizations. These findings may also inform future clinical guidelines and foster the development of personalized care pathways within the CAPD population.
The identification of anemia, hypoalbuminemia, and prolonged dialysis duration as the top risk factors for PDAP implicates multifactorial pathophysiological pathways involving state of nutrition, immune impairment, and peritoneal membrane alterations. Hypoalbuminemia and anemia reflect malnutrition and systemic inflammation, compromising humoral immunity and tissue repair processes essential for peritoneal defense. Extended dialysis duration is associated with cumulative bioincompatibility-induced mesothelial cell injury and peritoneal fibrosis, leading to impaired peritoneal clearance and local immune dysfunction. These intertwined mechanisms synergistically increase infection risk. Our study advances understanding by integrating these variables into a dynamic predictive model using machine learning, enabling early identification of high-risk patients and facilitating timely interventions.
While traditional risk assessment methods, which rely on a limited set of clinical indicators, often fail to capture the complexity of patient health and multifactorial disease nature, ML has emerged as a powerful alternative by integrating diverse datasets to identify patterns and correlations, thereby enabling more nuanced risk stratification and improved outcome prediction. Recently, ML model plays a significant role in assessing patient risks such as progression to ESKD,23,24 complications related to hemodialysis,25,26 acute kidney injury,27,28 and so on. As for patients with CAPD, ML models had also been widely applied to improve precise diagnosis and outcome prediction for CAPD patients. Lv et al also conducted a study of 68 observations from 38 patients with PDAP who were treated with vancomycin and demonstrated that ML models outperformed conventional regression in evaluating the concentration of vancomycin, which might be useful for controlling of vancomycin in clinical settings.29 Moreover, a recent multicenter prospective cohort study of 675 initiating PD patients and demonstrated that ML models had good predictive value for early-onset PDAP.13 However, a common limitation among these prior ML efforts is their reliance on static modeling frameworks, which utilize baseline or fixed-timepoint measurements. While informative, such models operate under the assumption that risk factors remain constant over time-an assumption often inconsistent with the dynamic clinical trajectory of CAPD patients. In contrast, our study challenges this static paradigm by incorporating a time series clinical data structure. This methodology recognizes that patient risk is fluid and continuously influenced by the most recent laboratory results. The strong performance of our model, particularly its robustness in temporal validation, underscores the critical importance of capturing such dynamism. It further suggests that the trajectory of clinical parameters may be useful for PDAP comparable to or greater than their absolute values at any single time point. More importantly, in contrast to long-term PDAP models, the identification of imminent PDAP risk based on dynamic data serves a fundamentally distinct motivation: to trigger targeted interventions on modifiable factors. The Stacking model can be integrated into EHR systems to automatically generate PDAP risk scores during quarterly follow-ups. High-risk patients could receive enhanced monitoring (eg., monthly laboratory tests, educational interventions on catheter care) and targeted interventions (eg., nutritional support for hypoalbuminemia, anemia management). Low-risk patients could maintain standard follow-up, reducing healthcare burden.
The limitations of this study are noteworthy. First, as a retrospective analysis conducted within a single regional cohort, our study may be susceptible to selection bias and unmeasured confounding, as several prognostically relevant variables including frailty, functional status, medication adherence, and socioeconomic factors were not available in our EHRs. Second, designating the Stacking model as optimal has limitations: while it achieves the highest recall to minimize PDAP missed diagnoses, it has relatively low accuracy, specificity, F1 score, AUC, and Brier score, however, these trade-offs are inevitable when prioritizing the clinically critical goal of reducing missed diagnoses in rare events (particularly considering the adverse consequences of missed diagnosis of PDAP).Furthermore, while our analysis identifies significant predictors, it remains associational and does not provide mechanistic insight or establish causality. Additionally, although our approach utilized time-updated data, it was based on the most recent clinical assessments rather than explicitly modeling the dynamic trajectories of biomarkers over time. These limitations directly inform future research priorities. There is a clear need for prospective, multi-center external validation across diverse populations to verify generalizability.
Conclusions
Using time-updated electronic health record data from 25,710 quarterly assessments of continuous ambulatory peritoneal dialysis patients, we developed machine learning models achieving 79–83% sensitivity for predicting peritonitis within three months. Albumin, hemoglobin, and dialysis duration emerged as key risk factors. However, the high false-positive rate (30%) and single-center retrospective design limit immediate clinical deployment. Multicenter prospective validation, workflow integration studies, and cost-effectiveness analyses are essential next steps before implementation. This approach demonstrates feasibility of dynamic PDAP risk stratification but requires rigorous validation to establish clinical utility.
Data Sharing Statement
The data that support the findings of this study are available from the corresponding author upon reasonable request.
Ethics Approval and Consent to Participate
All procedures were performed in adherence to the Helsinki declaration. The Ethics Committee of Wuhan No. 1 Hospital approved this study (No. 2025-71), and considering that this was a retrospective study and all patients were de-identified or maintained with confidentiality, informed consent was waived by the Ethics Committee of Wuhan No. 1 Hospital.
Acknowledgments
This study adhered to the RECORD (Reporting of studies Conducted using Observational Routinely collected Data) guidelines.
Author Contributions
Quan Wang: Conceptualization, methodology, writing draft, project administration, formal analysis, supervision; Qing Luo: Investigation, formal analysis, validation; Yanqiong Ding, Sheng Wan, and Yanmin Zhang: Data curation, resources; Fei Xiong: Formal analysis, conceptualization, supervision. All authors made a significant contribution to the work reported; took part in revising or critically reviewing the article; gave final approval of the version to be published; have agreed on the journal to which the article has been submitted; and agree to be accountable for all aspects of the work.
Funding
The authors have not declared a specific grant for this research from any funding agency in the public, commercial, or not-for-profit sectors.
Disclosure
The authors have no conflicts of interest to declare.
References
1. Ethier I, Hayat A, Pei J, et al. Peritoneal dialysis versus haemodialysis for people commencing dialysis. Cochrane Database Systemat Rev. 2024;6:CD13800.
2. Akiyama M, Kamei K, Nishi K, et al. Frequency and prognosis of peritoneal dialysis-associated peritonitis in children. Clin Exp Nephrol. 2024;28:692–13. doi:10.1007/s10157-024-02482-x
3. Wang Z, Ma X, Li S, et al. Association between serum potassium, risk and prognosis of peritonitis in peritoneal dialysis patients?-?results from the peritoneal dialysis telemedicine-assisted platform cohort (PDTAP) study. J Nephrol. 2024;37:1985–1996. doi:10.1007/s40620-024-02056-w
4. Nochaiwong S, Noppakun K, Sood MM, et al. Association between peritoneal dialysis-associated peritonitis and the risk of all-cause mortality and cardiovascular death: a time-matched retrospective cohort study. Medical Sciences. 2025;13:249. doi:10.3390/medsci13040249
5. Zhang M, Li X, Zhang Y, et al. Epidemiology, drug resistance, and clinical risk factors of peritoneal dialysis-associated peritonitis: a five-year multicenter study. Front Cell Infect MI. 2025;15:1654246. doi:10.3389/fcimb.2025.1654246
6. He Y, Zhu J, Xiao F, et al. Association of different total bilirubin levels with prognosis of peritoneal dialysis-associated peritonitis. Medicina. 2023;59:1837. doi:10.3390/medicina59101837
7. Wang Y, Wu Z, Huang L, et al. A nomogram for predicting the risk of peritoneal dialysis-associated peritonitis in patients with end-stage renal disease undergoing peritoneal dialysis: model development and validation study. BMC Nephrol. 2025;26:248. doi:10.1186/s12882-025-04165-5
8. Liu G, Li X, Zhao W, et al. Development and validation of a nomogram for predicting gram-negative bacterial infections in patients with peritoneal dialysis-associated peritonitis. Heliyon. 2023;9:e18551. doi:10.1016/j.heliyon.2023.e18551
9. Ngiam KY, Khor IW. Big data and machine learning algorithms for health-care delivery. Lancet Oncol. 2019;20:e262–73. doi:10.1016/S1470-2045(19)30149-4
10. Poweleit EA, Vinks AA, Mizuno T. Artificial intelligence and machine learning approaches to facilitate therapeutic drug management and model-informed precision dosing. Ther Drug Monit. 2023;45:143–150. doi:10.1097/FTD.0000000000001078
11. Hsu C, Huang C, Chen C, Deng Y, Lin S, Wu M. Machine learning models to predict osteoporosis in patients with chronic kidney disease stage 3-5 and end-stage kidney disease. Sci Rep UK. 2025;15:11391. doi:10.1038/s41598-025-95928-5
12. Kanda E, Epureanu BI, Adachi T, Kashihara N. Machine-learning-based Web system for the prediction of chronic kidney disease progression and mortality. PLOS Digital Health. 2023;2(e188):e0000188. doi:10.1371/journal.pdig.0000188
13. Zhou H, Yao C, Song K, et al. Machine learning-based prediction of early-onset peritoneal dialysis-associated peritonitis: the role of the CONUT score. Front Nutr. 2025;12:1681169. doi:10.3389/fnut.2025.1681169
14. Lei J, Zhai J, Zhang Y, Qi J, Sun C. Supervised machine learning models for predicting sepsis-associated liver injury in patients with sepsis: development and validation study based on a multicenter cohort study. J Med Internet Res. 2025;27:e66733. doi:10.2196/66733
15. Al Sahlawi M, Zhao J, McCullough K, et al. Variation in peritoneal dialysis-related peritonitis outcomes in the Peritoneal Dialysis Outcomes and Practice Patterns Study (PDOPPS). American Journal of Kidney Diseases. 2022;79:45–55. doi:10.1053/j.ajkd.2021.03.022
16. Dong X, Yi C, Ye H, et al. A predictive model of treatment effectiveness of refractory peritoneal dialysis-related peritonitis in patients with peritoneal dialysis: a single-center observational study in South China. Clin Kidney J. 2024;17:sfae332.
17. Perl J, Fuller DS, Bieber BA, et al. Peritoneal dialysis-related infection rates and outcomes: results from the Peritoneal Dialysis Outcomes and Practice Patterns Study (PDOPPS). American Journal of Kidney Diseases. 2020;76:42–53. doi:10.1053/j.ajkd.2019.09.016
18. Xu P, Zhang M, Cui S, et al. Gut microbiome and peritoneal inflammation: a new perspective on peritoneal dialysis-associated peritonitis. Renal Failure. 2025;47:2542532. doi:10.1080/0886022X.2025.2542532
19. Zhang Y, He P, He L. Body surface area and treatment failure in peritoneal dialysis-associated peritonitis. Therapeutic Apheresis and Dialysis. 2023;27:926–936. doi:10.1111/1744-9987.14026
20. Wu AH, Mu XD, Chao WY, Lu PY, Yang M, Zhou H. Predictive value of CONUT score and dialysis age for peritoneal dialysis-associated peritonitis. Zhonghua yi xue za zhi. 2023;103:720–726. doi:10.3760/cma.j.cn112137-20221017-02163
21. Yu X, Wang J, Liang C, et al. Elevated effluent lactate independently predicts the adverse outcomes of peritoneal dialysis associated peritonitis. Sci Rep UK. 2025;15:24009. doi:10.1038/s41598-025-09876-1
22. Kolland M, Ribitsch W, Prenner A, et al. Effluent microscopy is a useful adjuvant diagnostic tool in peritoneal dialysis-associated peritonitis. Clin Nephrol. 2022;98:33–41. doi:10.5414/CN110732
23. Wang Y, Shi Y, Xiao T, et al. A klotho-based machine learning model for prediction of both kidney and cardiovascular outcomes in chronic kidney disease. Kidney Diseases. 2024;10:200–212. doi:10.1159/000538510
24. Yu Z, Ning X, Qin Y, et al. Development and validation of a machine learning-based prognostic model for IgA nephropathy with chronic kidney disease stage 3 or 4. Kidney Diseases. 2024;10:436–449. doi:10.1159/000540682
25. Xu X, Xu Z, Ma T, et al. Machine learning for identification of short-term all-cause and cardiovascular deaths among patients undergoing peritoneal dialysis. Clin Kidney J. 2024;17:sfae242. doi:10.1093/ckj/sfae242
26. Zhang Y, Guo J, Yang N, et al. Machine learning to predict postdialysis fatigue in patients undergoing hemodialysis. Renal Failure. 2025;47:2529452. doi:10.1080/0886022X.2025.2529452
27. Cama-Olivares A, Braun C, Takeuchi T, et al. Systematic review and meta-analysis of machine learning models for acute kidney injury risk classification. J Am Soc Nephrol. 2025;36:1969–1983. doi:10.1681/ASN.0000000702
28. Jiang W, Zhang Y, Weng J, et al. Explainable machine learning model for predicting persistent sepsis-associated acute kidney injury: development and validation study. J Med Internet Res. 2025;27:e62932. doi:10.2196/62932
29. Lv B, Liu W, Lu Y, Wang Z, Shi A. Machine learning-based prediction of vancomycin concentration after abdominal administration in patients with peritoneal dialysis-related peritonitis. Therap Apheresis Dialys. 2025;29:106–113. doi:10.1111/1744-9987.14188
 © 2026 The Author(s). This work is published and licensed by Dove Medical Press Limited. The
full terms of this license are available at https://www.dovepress.com/terms
and incorporate the Creative Commons Attribution
- Non Commercial (unported, 4.0) License.
By accessing the work you hereby accept the Terms. Non-commercial uses of the work are permitted
without any further permission from Dove Medical Press Limited, provided the work is properly
attributed. For permission for commercial use of this work, please see paragraphs 4.2 and 5 of our Terms.
© 2026 The Author(s). This work is published and licensed by Dove Medical Press Limited. The
full terms of this license are available at https://www.dovepress.com/terms
and incorporate the Creative Commons Attribution
- Non Commercial (unported, 4.0) License.
By accessing the work you hereby accept the Terms. Non-commercial uses of the work are permitted
without any further permission from Dove Medical Press Limited, provided the work is properly
attributed. For permission for commercial use of this work, please see paragraphs 4.2 and 5 of our Terms.
Recommended articles
Clinical Characteristics of Enterococcus-Associated Peritonitis in Patients with Peritoneal Dialysis
Ni J, Zhou L, Wang H, Yu J, Tong M, Yu D
Infection and Drug Resistance 2023, 16:3399-3405
Published Date: 30 May 2023
Risk Factors for Gout in Taiwan Biobank: A Machine Learning Approach
Liu YR, Nfor ON, Zhong JH, Lin CY, Liaw YP
Journal of Inflammation Research 2024, 17:9847-9856
Published Date: 26 November 2024
Construction and Validation of a Machine Learning-Based Risk Prediction Model for Sleep Quality in Patients with OSA
Tong Y, Wen K, Li E, Ai F, Tang P, Wen H, Guo B
Nature and Science of Sleep 2025, 17:1271-1289
Published Date: 12 June 2025
Machine Learning Models for Identifying the Risk of Chronic Kidney Disease in Patients with Coronary Heart Disease: A Retrospective Study
He T, Zhao J, Hou L, Su K, Li Y
International Journal of General Medicine 2025, 18:7327-7340
Published Date: 5 December 2025
Explainable Machine Learning for Prediction of Early Postoperative Nausea and Vomiting After General Anesthesia
Chang HC, Chen LY, Lin YS
Journal of Multidisciplinary Healthcare 2026, 19:572550
Published Date: 26 February 2026