Back to Journals » International Journal of General Medicine » Volume 18
Machine Learning Models for Identifying the Risk of Chronic Kidney Disease in Patients with Coronary Heart Disease: A Retrospective Study
Authors He T, Zhao J, Hou L, Su K, Li Y
Received 5 August 2025
Accepted for publication 18 November 2025
Published 5 December 2025 Volume 2025:18 Pages 7327—7340
DOI https://doi.org/10.2147/IJGM.S558568
Checked for plagiarism Yes
Review by Single anonymous peer review
Peer reviewer comments 3
Editor who approved publication: Dr Redoy Ranjan
Ting He,1,* Jinbo Zhao,2,* Ling Hou,2 Ke Su,2 Yuanhong Li2
1Department of Central Hospital of Tujia and Miao Autonomous Prefecture, Hubei University of Medicine, Shiyan, Hubei, 442000, People’s Republic of China; 2Cardiovascular Disease Center, Central Hospital of Tujia and Miao Autonomous Prefecture, Hubei University of Medicine, Enshi, Hubei, 445000, People’s Republic of China
*These authors contributed equally to this work
Correspondence: Yuanhong Li, Cardiovascular Disease Center, Central Hospital of Tujia and Miao Autonomous Prefecture, Hubei University of Medicine, 158 Wuyang Avenue, Enshi, Hubei Province, 445000, People’s Republic of China, Email [email protected]
Purpose: Coronary heart disease (CHD) has a significant co-morbid association with chronic kidney disease (CKD), but identification tools for the risk of concomitant CKD in patients with CHD are still lacking. The purpose of this research was to construct machine learning (ML) models for identifying undetected CKD in CHD patients.
Methods: 1786 CHD patients undergoing coronary intervention were retrospectively included. Lasso regression and multifactor logistic regression were used to screen feature variables. Five ML models, ie, logistic regression (LR), support vector machine (SVM), random forest (RF), gradient boosting machine (GBM), and extreme gradient boosting (XGBoost), were constructed. Participants were divided into the training set and validation set in a 7:3 ratio. The evaluation metrics included the area under the curve, calibration curve, and decision curve.
Results: Totally, 1786 CHD patients were enrolled and split into training (70%) and validation (30%) sets. The prevalence of CKD was 21.8% (390/1786). Multivariate logistic regression analysis showed that men, advanced age, hypertension, diabetes mellitus, history of atrial fibrillation (AF), high Gensini, low hemoglobin, low plateletcrit (PCT), high triglycerides (TG), high lipoprotein(a) (Lp(a)), hyperkalemia, high uric acid to albumin ratio (UAR), high systemic inflammation response index (SIRI), low lymphocyte to monocyte ratio (LMR), and high apolipoprotein B to apolipoprotein A1 (ApoB/ApoA1) ratio were the key clinical and laboratory test indicators of CKD. The XGBoost model performed optimally in the validation set (AUC=0.909, 95% CI 0.881 − 0.937). SHapley Additive explanation analysis identified UAR, hypertension, Gensini score, age, and SIRI as the top 5 key features.
Conclusion: The XGBoost model constructed on routine clinical data was effective in identifying CKD risk in CHD patients, with UAR as a novel strong predictor. Decision curve analysis confirmed the clinical utility of the model, indicating that it may be used to guide decisions for enhanced monitoring and early intervention over a wide range of risk thresholds.
Keywords: coronary heart disease, chronic kidney disease, machine learning, XGBoost
Introduction
Cardiovascular diseases (CVD) remain the foremost contributor to mortality globally, accounting for approximately 17.9 million deaths annually (WHO, 2023). Coronary heart disease (CHD) is a major subtype of CVD, with a global prevalence of 113 million (GBD 2021). The prevalence of CVD in China continues to rise. There were 330 million CVD cases, of which 11.39 million were CHD cases, constituting a primary cause of death in the Chinese population.1 Chronic kidney disease (CKD) now constitutes a major global disease burden, affects 13.4% of the global population (approximately 850 million people), and China has the largest number of CKD patients (approximately 150 million), accounting for nearly one-fifth of the global total.2 CHD has a significant co-morbid association with CKD. On the one hand, patients with CKD exhibit substantially elevated incidence and mortality of CVD (including CHD) due to vascular calcification, chronic inflammation, and metabolic disorders.3,4 On the other hand, CHD is often accompanied by renal impairment, and CKD is accorded equivalent risk status to CHD, with the two sharing the same risk factors of atherosclerosis (AS), hypertension, and diabetes mellitus.5,6 Patients with CHD often exhibit an elevated risk of CKD owing to comorbid metabolic diseases such as hypertension and diabetes.7,8 Early identification of CKD risk in patients with CHD is essential to optimize clinical management and reduce complications and mortality.
In incipient CKD, the awareness and diagnosis of CKD are low owing to the lack of clear clinical symptoms.9 Moreover, identifying the risk of concurrent CKD in individuals with CHD still relies on traditional statistical models (eg, Cox regression) in current clinical practice, which are limited in their ability to select variables and capture interactions.10 In recent years, machine learning (ML) has shown tremendous promise in the prediction of the risk of CKD. For example, by integrating variables such as biochemical indicators (eg, urinary proteins, serum creatinine), demographic characteristics (age, gender), and co-morbidities information (diabetes mellitus, hypertension), we can predict the progression of end-stage renal disease (ESKD) more accurately.3,11,12 In addition, ML models have also made progress in the risk stratification of CVDs. For example, some models are constructed using electronic medical record data, and they can identify CHD patients at high risk for acute cardiovascular events.7,11,13 However, existing studies have applied ML to predict the progression of CKD or cardiovascular events, but few studies focus on the risk of CKD in CHD patients. Traditional models (eg, Cox regression) have limitations in variable selection and capturing non-linear interactions, and do not integrate novel composite indicators (eg, UAR, SIRI) reflecting inflammation and nutrition, leading to insufficient predictive accuracy for this population. Due to the overlap in pathomechanisms between the two diseases (eg, arterial calcification, oxidative stress, inflammation),7,14,15 the development of ML-based multimodal models (combining laboratory tests, imaging features, and dynamic physiological parameters) is expected to break through the limitations of the traditional methods.16,17 This direction of research is not only in line with the needs of precision medicine, but also may improve the current situation of patients with comorbid CHD and CKD, who suffer from a high in-hospital mortality rate and a poor prognosis.6,18
This study aimed to construct five ML models (LR, SVM, RF, GBM, XGBoost) based on routine clinical data to identify preexisting CKD in patients with CHD, identify key risk factors via SHAP, especially UAR, and evaluate the optimal model’s clinical utility to guide personalized renal monitoring.
Methods
Study Population
As per the Declaration of Helsinki, this study was approved by the Ethics Committee of the Central Hospital of Enshi Tujia and Miao Autonomous Prefecture. (Approval Number: [2025-110-01]; Date of Approval: [July 29, 2025]). Although the Ethics Committee granted exemption from informed consent for this retrospective medical record analysis, a certificate of approval from the Ethics Committee was provided to the editors to ensure ethical compliance. First, this cross-sectional study exclusively utilized clinical case data, ensuring no adverse consequences or harm to patients. Second, all patient data were anonymized before data access and analysis, enabling medical record review without informed consent. In this study, we retrospectively collected CHD patients who were hospitalized for the evaluation and treatment of CHD and subsequently underwent coronary intervention in the Department of Cardiology, Enshi Tujia and Miao Autonomous Prefecture Central Hospital from January 2022 to December 2024. This cohort included all patients with CHD, including scheduled elective surgery and urgent intervention after an acute coronary syndrome. The study was conducted at the Cardiovascular Disease Center of the Central Hospital of Enshi Tujia and Miao Autonomous Prefecture, a tertiary care center serving a large regional population. The center manages a high volume of CHD patients, with over 2000 CHD-related admissions annually. The inclusion criteria were (i) 18 years of age or older; (ii) with clinically evident CHD. The exclusion criteria were (i) non-atherosclerotic coronary artery disease; (ii) failure to adhere to standard postoperative regimens of statins and antiplatelet agents; (iii) patients with previous definite diagnosis of CKD or renal insufficiency; (iv) all included patients underwent coronary intervention (PCI), while those who used contrast agents within 1 month before admission were excluded to avoid the potential impact of contrast agents on the assessment of renal function; (v) occurrence of other postoperative cardiovascular adverse events; (vi) presence of other systemic diseases, including immune system diseases, hematologic diseases, liver diseases, malignant tumors, and serious infections.
Data Collection
General demographic data of all patients were drawn, encompassing age, gender, and smoking status; medical history, mainly including history of hypertension, diabetes mellitus, and cerebrovascular disease (stroke, cerebral infarction). Laboratory and clinical data were drawn from the first venous blood count of all patients after admission to the hospital, including leukocyte count, neutrophil count, monocyte count, lymphocyte count, platelet count, hemoglobin, albumin (ALB), lipid profile, blood glucose, bilirubin, creatinine, uric acid, and other auxiliary examination results. Patients’ left main and multi-vessel coronary artery disease were recorded based on angiographic findings. The presence of significant coronary artery disease was adjudicated based on coronary angiography findings by two independent interventional cardiologists, with disagreements resolved by a third senior cardiologist (left main disease: stenosis ≥ 50% in left main artery; multi-vessel disease: stenosis ≥ 50% in at least 2 major arteries). The Gensini score was used to evaluate the severity of their coronary artery lesions. The patients were categorized into the CHD combined with CKD group and the CHD without CKD group. The inflammatory indices selected for this study were calculated based on relevant laboratory data, encompassing uric acid to albumin ratio (UAR), aggregate index of systemic inflammation (AISI, neutrophils×monocytes×platelets/lymphocytes), systemic inflammation response index (SIRI, neutrophils×monocytes/lymphocytes), systemic immune-inflammation index (SII, neutrophils×platelets/lymphocytes), neutrophil percentage to albumin ratio (NPAR), neutrophil-to-lymphocyte ratio (NLR), platelet-to-lymphocyte ratio (PLR), lymphocyte-to-monocyte ratio (LMR), and apolipoprotein B to apolipoprotein A1 (ApoB/ApoA1) ratio.
Definition of CKD
The outcome was the presence of undiagnosed CKD on admission. CKD was defined as serum creatinine calculated from the CKD-EPI formula according to the 2024 KDIGO Clinical Practice guidelines19 for the Evaluation and Management of Chronic Kidney disease, based on laboratory data obtained at the time of this admission, in patients with no previous history of CKD or renal insufficiency. The estimated glomerular filtration rate (eGFR) was < 60 mL/min/1.73m2.
Statistical Analysis
In terms of missing data, variables with > 20% missing values were excluded; those with < 20% missing values were imputed using multiple imputation with 5 iterations based on the chained equations method. For data preprocessing, outliers were handled via winsorization, where values exceeding the 99th percentile were capped at the 99th percentile and values below the 1st percentile were floored at the 1st percentile. To control data leakage, all preprocessing steps (including imputation, winsorization, and feature selection) were performed exclusively on the training set, and the same parameters derived from the training set were applied to the validation set to avoid information leakage between sets. For each ML model, patients were randomly divided into training and validation sets in a ratio of 7:3. To reduce the risk of overfitting, this study combined the least absolute shrinkage and selection operator (LASSO) with 10-fold cross-validation to screen characteristics. The screened key variables were further incorporated into a multifactor logistic regression. The hyperparameters were tuned using a grid search strategy, and the hyperparameter tuning of all models was performed by 10-fold cross-validation within the training set. Specifically, the training set was randomly divided into 10 mutually exclusive subsets, and 9 folds were used for training and the remaining 1 fold for validation in turn, cycling 10 times to ensure that each fold was used for validation. The evaluation index of this procedure was the average AUC value under the cross-validation curve. Based on these methods, five ML detection models were developed, including logistic regression, random forest (RF), gradient boosting machine (GBM), support vector machine (SVM), and extreme gradient boosting (XGBoost). Subsequently, discrimination power, accuracy, and clinical applicability were assessed in an internal validation cohort of the model, resulting in the selection of the best model. The discrimination ability was evaluated using the receiver operating characteristic (ROC) curve and the area under the curve (AUC). Model calibration was evaluated visually using a calibration curve and quantitatively using calibration slope, calibration intercept, and Brier score. The clinical utility was evaluated by decision curve analysis (DCA). SHapley Additive exPlanation (SHAP) analysis was implemented to quantify the contributions of variables to identifications, enhancing the interpretability of the optimal model.
Data were processed and analyzed on R 4.5.0. Data distribution patterns determined analytical techniques. Normally distributed data were presented as mean ± standard deviation and analyzed using an independent samples t-test. Non-normally distributed data were presented as median (interquartile range) and analyzed leveraging the Mann–Whitney U-test. Categorical variables were expressed as frequencies and percentages, and group comparisons were made leveraging the chi-square (χ2) test or Fisher’s exact test. Results were considered statistically significant when p < 0.05.
Results
Demographic and Clinical Characteristics
In total, 1786 eligible patients were involved in this research. The study cohort comprised 390 subjects with CHD and CKD and 1396 non-CKD subjects. Their characteristic data are depicted in Table 1. Compared with the non-CKD group, patients in the CKD group were older, had a higher proportion of males, higher prevalence of hypertension, diabetes mellitus, atrial fibrillation, and stroke, and more severe coronary lesions (left main and multi-vessel disease, higher Gensini score) (all P<0.001 or P=0.007; Table 1). In terms of laboratory parameters, individuals in the CKD group had lower hemoglobin, plateletcrit (PCT), total cholesterol (TC), low-density lipoprotein (LDL) and high-density lipoprotein (HDL), higher white blood cell count, red blood cell distribution width (RDW), aspartate transaminase (AST), triglyceride (TG), lipoprotein (a) (Lp (a)), serum potassium, glucose and composite inflammatory/nutritional indicators (UAR, AISI, SIRI, SII, NPAR, NLR, PLR, ApoB/ApoA1 ratio), and lower lymphocyte-to-monocyte ratio (LMR) (all P<0.001; Table 1).
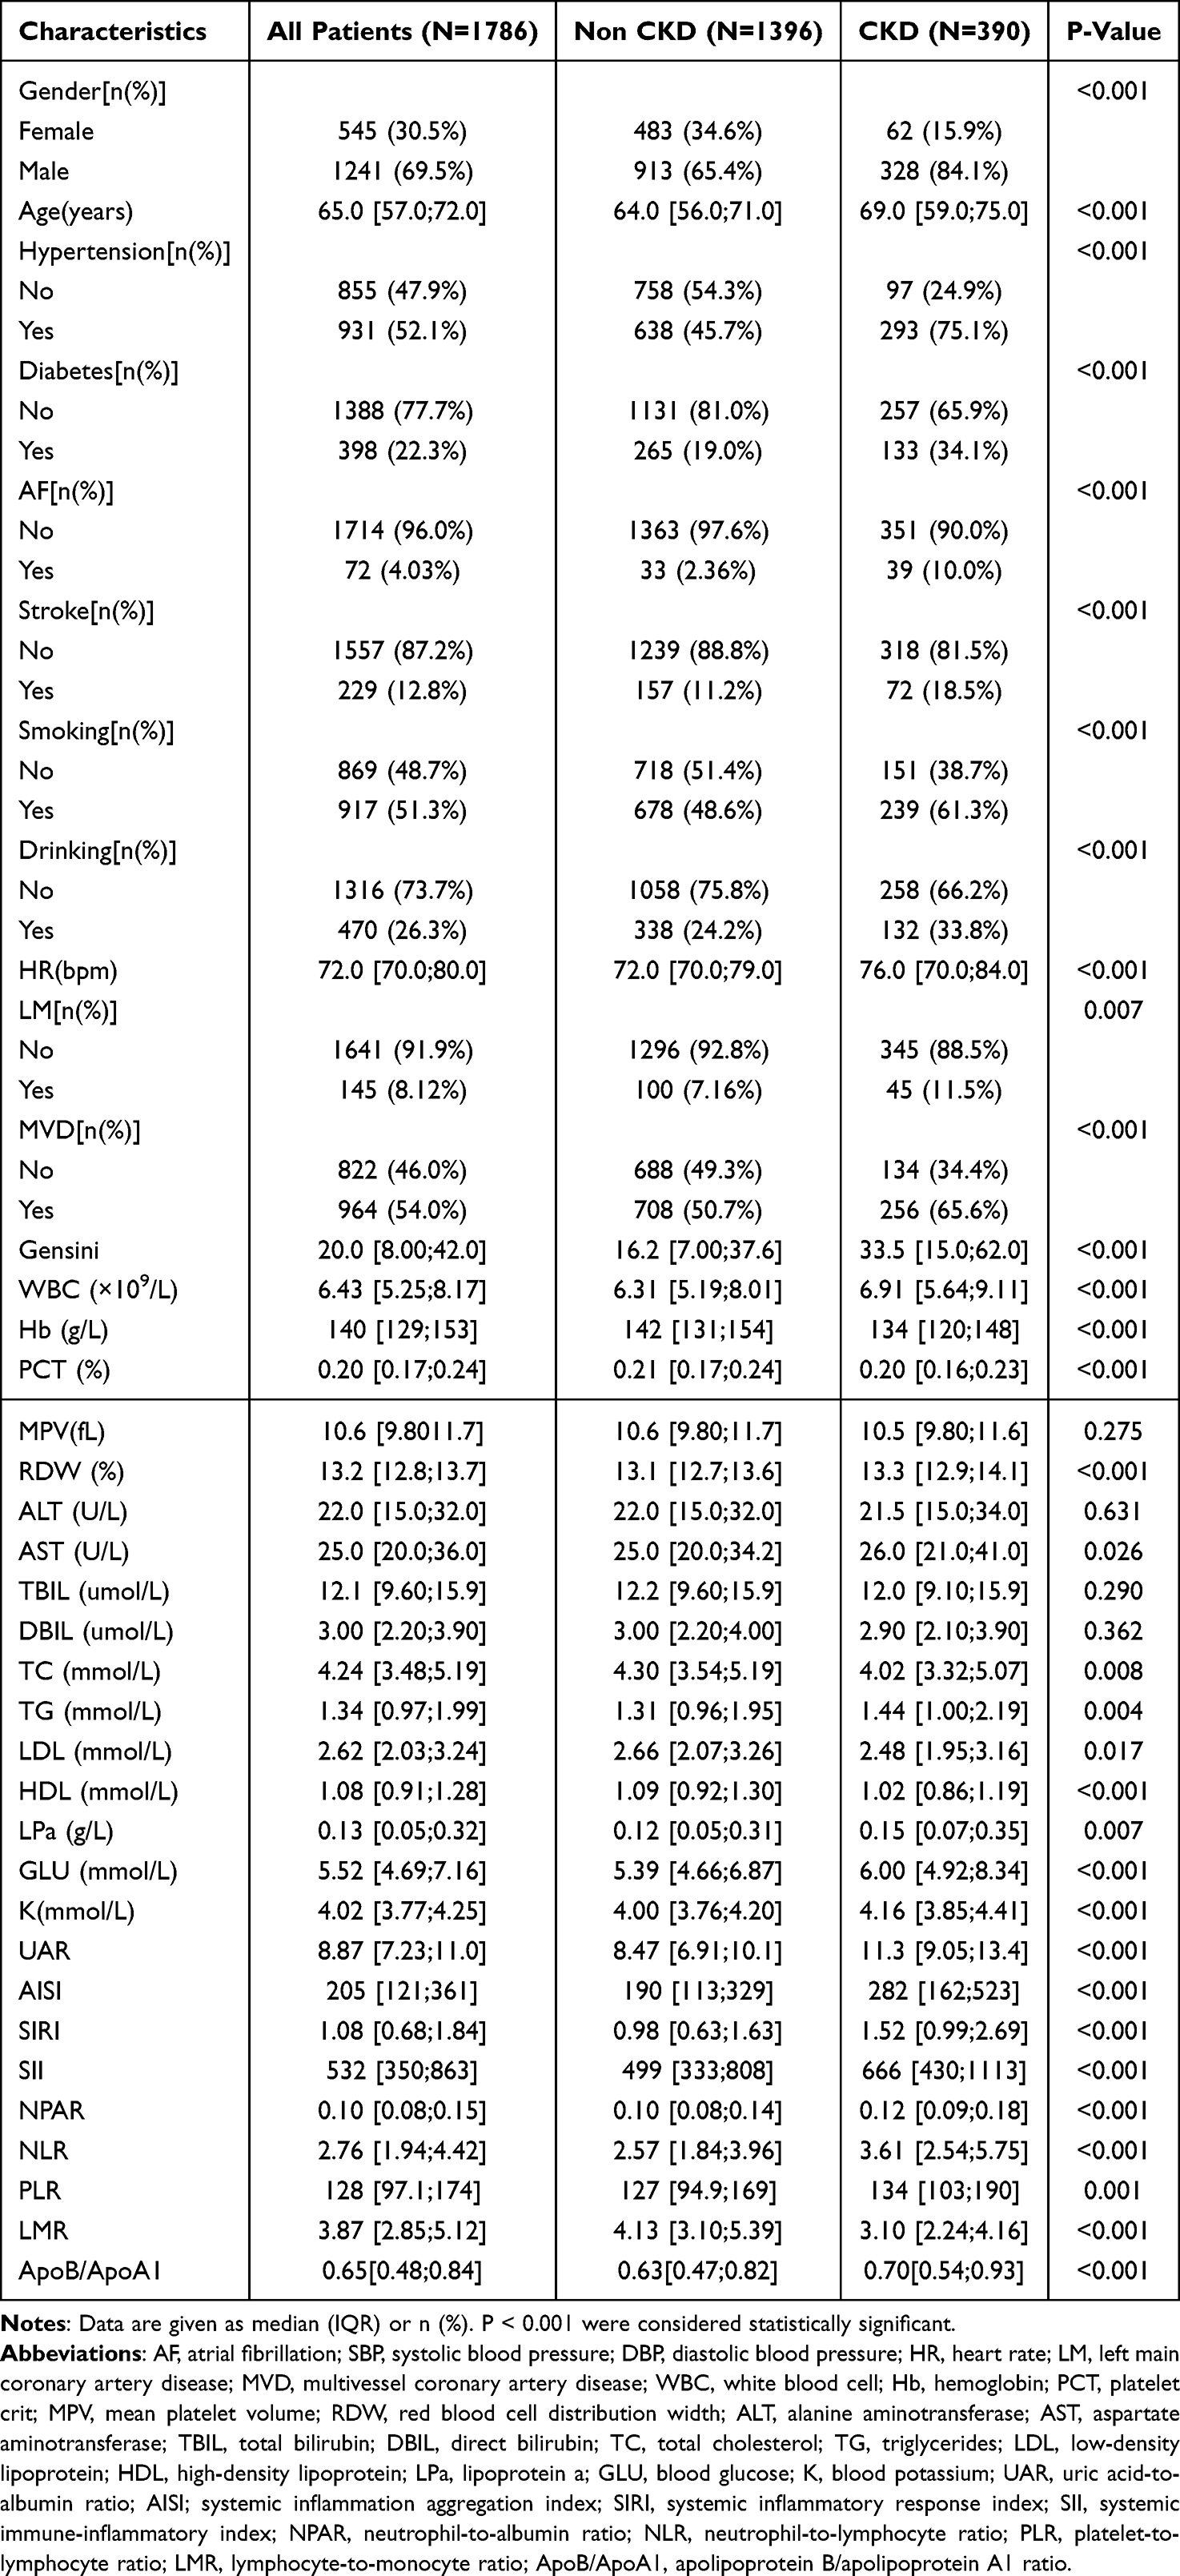 |
Table 1 Clinical Characteristics of the Study Group |
Feature Selection
To avoid multicollinearity, component variables used to calculate composite indicators were excluded before the LASSO regression. The excluded component variables are shown in Supplementary Table S1. The characteristics of the variable coefficients are shown in Figure 1. A 10-fold cross-validation approach was adopted to conduct iterative analysis. The 17 variables that were strongly associated with CHD complicating CKD were gender, age, hypertension, diabetes mellitus, history of AF, smoking status, Gensini, hemoglobin, PCT, RDW, TG, Lp(a), serum potassium, UAR, SIRI, LMR, and ApoB/ApoA1 ratio. Multifactor logistic regression was used to further screen characteristic variables, and the final variables included in the model were gender, age, hypertension, diabetes mellitus, history of AF, Gensini, hemoglobin, PCT, RDW, TG, Lp(a), serum potassium, UAR, SIRI, LMR, and ApoB/ApoA1 ratio. (Table 2).
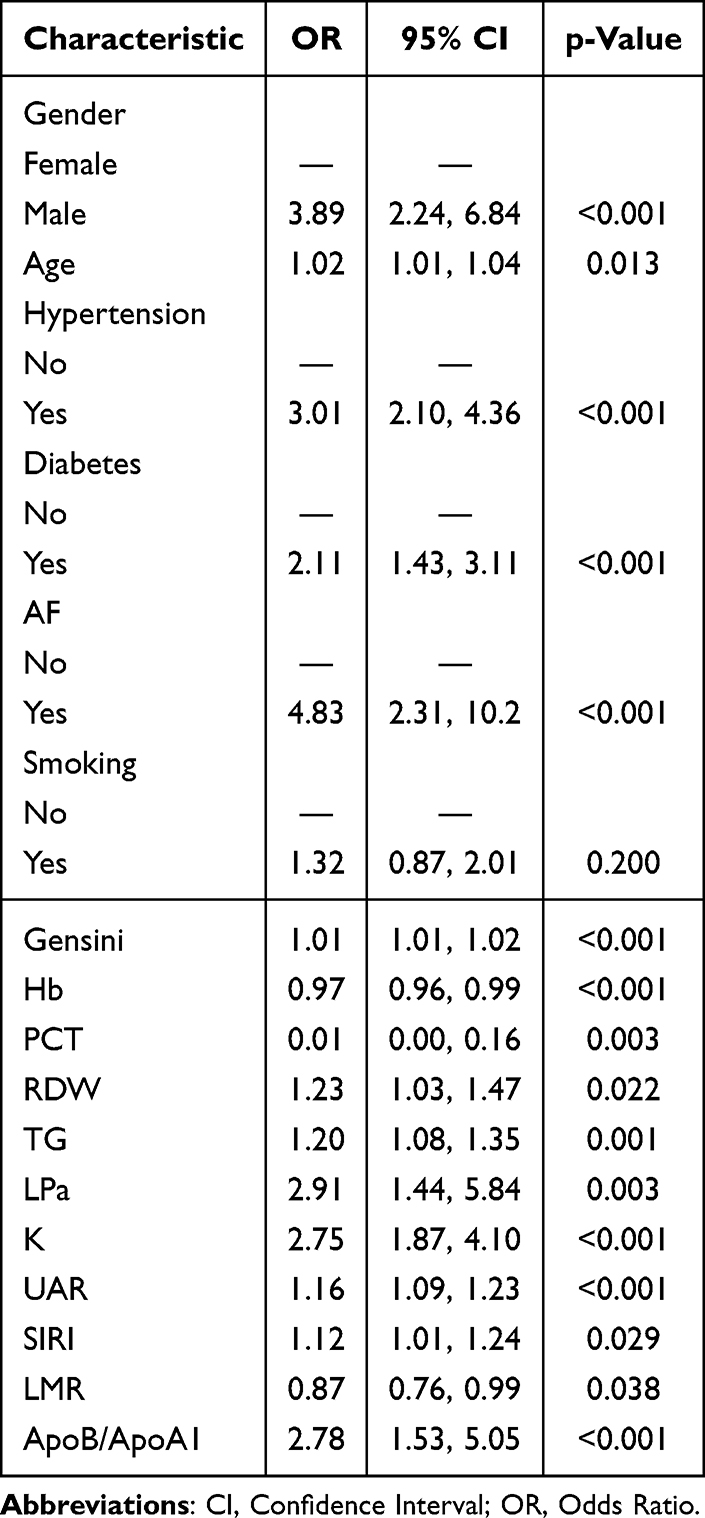 |
Table 2 Multivariate Logistic Regression Analysis Was Performed |
 |
Figure 1 (A) Lasso regression coefficient path plot, the vertical axis represents the regression coefficients of different variables, and the horizontal axis Log (lambda) is the logarithm of the penalty coefficient. (B) The correlation between lamda with binomial deviance. There are two dashed lines in the graph. The left dashed line indicates the minimum mean squared error while the right one indicates one standard error away from the minimum mean squared error. |
Comparisons of Model Performance
Five ML models were constructed to identify the risk of CKD in CHD patients. Table 3 and Figures 2–4 demonstrate the performance metrics of the five ML models. Specifically, Figure 2A shows the ROC curves of different ML models in the training set, and Figure 2B presents those in the validation set. In the validation set, the XGBoost model achieved the highest area under ROC (AUC) value of 0.909 (95% CI 0.881–0.937), followed by LR (AUC=0.905, 95% CI 0.877–0.933), GBM (AUC=0.897, 95% CI 0.867–0.928), SVM (AUC=0.878, 95% CI 0.843–0.914), and RF (AUC=0.873, 95% CI 0.837–0.909). Figure 3A shows the calibration plot for the training set, where most models’ calibration curves closely approach the ideal diagonal line. The calibration plots of the five models in the validation set (Figure 3B) showed satisfactory calibration performance, demonstrating their reliability in prediction. Table 3 lists the calibration slopes, calibration intercepts, and Brier scores for all five ML models in the training and validation sets. The XGBoost model showed an excellent fit. The calibration curves of the five ML models are shown in Supplementary Figures (LR: Figure S1A and B; SVM: Figure S2A and B; RF: Figure S3A and B; GBM: Figure S4A and B; XGBoost: Figure S5A and B). In addition, DCA curves indicated favorable clinical utility across all five models (Figure 4A and B), thus confirming their potential for future clinical decision-making. To further evaluate the classification performance at specific decision thresholds, we calculated the confusion matrix (Supplementary Table S2). The threshold was determined by maximizing the Youden index in the model to balance sensitivity and specificity. The XGBoost model demonstrated outstanding performance in most of these metrics.
 |
Table 3 Comparison of the Performance of the ML Models |
 |
Figure 2 (A) Roc curves predicted by different ML models in the training set. (B) Roc curves predicted by different ML models in the validation set. Abbreviations: AUC, area under curve; LR, Logistic regression; SVM, Support vector machine; RF, Random forest; GBM, Gradient boosting machine; XGBoost, Extreme gradient boosting. |
 |
Figure 3 (A) Calibration curves predicted by different ML models in the training set. (B) Calibration curves predicted by different ML models in the validation set. Abbreviations: LR, Logistic regression; SVM, Support vector machine; RF, Random forest; GBM, Gradient boosting machine; XGBoost, Extreme gradient boosting. |
 |
Figure 4 (A) Decision curves predicted by different ML models in the training set. (B) Decision curves predicted by different ML models in the validation set. Abbreviations: LR, Logistic regression; SVM, Support vector machine; RF, Random forest; GBM, Gradient boosting machine; XGBoost, Extreme gradient boosting. |
Interpretability Analysis
To ascertain the contributions of the variables, the SHAP algorithm was applied to quantify the impact of each characteristic on predicting the risk of CHD with CKD within the XGBoost model. Figure 5A shows a swarm plot, where the horizontal axis denotes the SHAP values while the vertical axis denotes the characteristics ranked by their cumulative SHAP values, allowing us to visually evaluate the impact of each characteristic on the prediction results. Figure 5B depicts the importance of features in descending order. The top ten features were UAR, hypertension, Gensini score, gender, SIRI, serum potassium, hemoglobin, ApoB/ApoA1 ratio, PCT, and diabetes mellitus.
 |
Figure 5 Interpretability analysis of the optimal XGBoost model using SHapley Additive exPlanations (SHAP). (A) Beeswarm plot summarizing the feature impacts on the model output. Each point represents a patient from the validation set. The position on the x-axis is the SHAP value, which indicates the impact of that feature on the prediction for that individual (positive SHAP values increase the predicted risk of CKD). The color represents the actual value of the feature for that patient, from low (blue) to high (red). Features are ordered by their overall importance; (B) Beeswarm plot summarizing the feature impacts on the model output. Each point represents a patient from the validation set. The position on the x-axis is the SHAP value, which indicates the impact of that feature on the prediction for that individual (positive SHAP values increase the predicted risk of CKD). The color represents the actual value of the feature for that patient, from low (blue) to high (red). Features are ordered by their overall importance. Abbreviations: UAR, uric acid-to-albumin ratio; SIRI,systemic inflammatory response index; K,serum potassium; Hb,hemoglobin; ApoB/ApoA1,apolipoprotein B/apolipoprotein A1 ratio; PCT, platelet crit; LMR,lymphocyte-to-monocyte ratio; TG,triglycerides; LPa,lipoprotein a; RDW,red blood cell distribution width; AF,atrial fibrillation. |
Discussion
This study constructed 5 ML models for the risk of CKD in 1786 CHD patients. In this study, XGBoost demonstrated the highest overall performance (AUC=0.909) while maintaining good specificity (0.891) and sensitivity (0.791). Its AUC was significantly higher than that of RF and SVM, comparable to that of GBM, and slightly higher than that of LR. RF showed obvious overfitting (training set: AUC=0.945 vs validation set: AUC=0.873), with a decay of 7.6%, which was higher than that of XGBoost (decay = 5.4%). Considering its excellent performance in the training set (AUC = 0.961) and smaller performance decay in the validation set, XGBoost had the best resistance to overfitting and strong generalizability. The calibration curves of the XGBoost model were close to the ideal diagonal in both the training and validation sets, indicating that the predicted probability matched the actual probability well. The DCA revealed that over a wide range of threshold probabilities (approximately 0.1 to 0.7), the XGBoost model achieved a good net benefit for clinical decision-making. This implies that using the test results of this model to guide clinical decision-making (eg, enhanced surveillance, early intervention) can provide higher clinical benefit for patients. Furthermore, SHAP analysis was employed to detect high-contributing characteristics, revealing the substantial link between the risk of CKD and variables such as UAR, hypertension, Gensini score, gender, SIRI, serum potassium, hemoglobin, ApoB/ApoA1 ratio, PCT, and diabetes mellitus.
Previously, Zhang et al20 developed a nomogram prediction model for the occurrence of CKD in patients with CHD based on the results of multivariate logistic regression analysis (AUC = 0.867). The main variables incorporated into this model were age, uric acid, and a history of diabetes mellitus. In contrast, our XGBoost model (AUC = 0.909) exhibited superior performance, possibly since our model incorporated CHD-specific indicators (eg, Gensini score) and new composite indicators (eg, UAR, SIRI), making it more suitable for patients with CHD. Notably, the XGBoost model demonstrated excellent performance, especially in handling high-dimensional and complex data. Its generalizability and predictive performance far surpassed those of traditional models.
UA participates in various pathological processes, hyperuricemia drives urate crystallization and its deposition in the renal tubulointersitium, leading to chronic inflammation in the kidney (eg, NLRP3 inflammasome activation, release of IL-1β, IL-6 and other cytokines), triggering oxidative stress (reactive oxygen species(ROS)), activating the renin-angiotensin system, all of which contribute to further endothelial dysfunction and vascular smooth muscle cell proliferation, promoting glomerulosclerosis and interstitial fibrosis, and thus accelerating renal damage.21,22 A prospective study involving 755 patients with CKD demonstrated that the rs734553 polymorphism of the GLUT9 gene (associated with abnormal urate transport) was associated with a 2.35-fold increase in the risk of CKD. Furthermore, this association was independent of traditional indicators such as proteinuria and estimated glomerular filtration rate (eGFR), directly confirming the causal relationship between abnormal urate transport and renal injury.23 Hypoalbuminemia, on the other hand, is often associated with inflammation and malnutrition, and it is demonstrated by multiple studies that hypoalbuminemia correlates with renal function deterioration.24,25 UAR is a novel composite index that integrates nutritional status, inflammation, and metabolic syndromes. It comprehensively represents uric acid excretion load (frequently elevated in renal impairment) and nutritional and inflammatory status (indicated by ALB levels), making it a more sensitive and specific predictor than single indicators like uric acid or albumin alone. Previous studies have investigated its accuracy in predicting contrast nephropathy,26 the extent of coronary artery disease in individuals with non-ST-segment elevation myocardial infarction,27 and the prognosis of some diseases (eg, acute kidney injury28,29 and ST-segment elevation myocardial infarction30). In addition, a study by Qin et al has disclosed that elevated UAR is an independent prognostic biomarker for IgA nephropathy (IgAN).31 Although Qin et al have demonstrated the predictive value of UAR for IgA nephropathy, which supports our finding regarding the role of UAR in predicting CKD, UAR as the primary predictor has not been reported in the prediction of CKD in patients with CHD. The current research showed that elevated levels of UAR (OR=1.16, 95% CI 1.09–1.23, P<0.001) were an independent risk factor for CKD in CHD individuals and ranked first in importance among the variables. This suggests that UAR can be a good predictor of CHD complicating CKD. By combining these two markers, ie, uric acid and ALB, a convincing and feasible predictor of kidney disease risk was created.
Elevation of the Gensini score (OR=1.01, 95% CI 1.01–1.02, P<0.001), a quantitative index of the severity of coronary artery lesion, significantly increases the risk of CKD. Its core value lies in (a) early warning: Gensini score combined with markers such as cystatin C and cardiac troponin I (cTnI) to identify high-risk patients before a significant decline in epidermal growth factor receptor (eGF);32,33 (b) risk stratification: scores > 40 require intensive anti-inflammatory and calcium-phosphorus management, and >60 initiates combined cardiorenal and renal followup;34,35 (c) treatment orientation: guiding individualized interventions (eg, lipid-lowering target selection, intensity of blood phosphorus control) to improve long-term prognosis of CKD patients.36 This strongly suggests that systemic AS affects both the coronary arteries and renal arteries/intrarenal microvasculature, with endothelial dysfunction and ischemia serving as the shared underlying pathophysiology. An extensive atherosclerotic load may directly reflect the health of the renal vasculature.
SIRI, as a novel inflammatory marker, combines three complete blood count markers to more systematically and comprehensively reflect the inflammatory state of the body, and is highly correlated with diseases affecting multiple organ systems. In CKD patients, a persistent microinflammatory state accelerates the decline of renal function through oxidative stress, endothelial injury, and fibrosis. A study has shown that elevated SIRI constitutes an independent risk factor for all-cause mortality and cardiovascular mortality in individuals with CKD, and may be of higher significance in the early stages of CKD (stage I to III).37 SIRI may be considered as a valid predictor for assessing the morbidity of CKD, as well as the mortality risk of CKD patients in the general US population.38 The present study demonstrated that high SIRI (OR=1.12, 95% CI 1.01–1.24, P=0.029) played an important role in the diagnosis of CKD in CHD patients.
Hyperkalemia (OR=2.75, 95% CI 1.87–4.10, P<0.001) is a marker of advanced renal insufficiency, which is primarily due to the decreased ability of the kidneys to excrete potassium. Even a mild elevation of serum potassium levels suggests a decrease in glomerular filtration rate (GFR).39 Low hemoglobin (OR=0.97, 95% CI 0.96–0.99, P<0.001) is an early marker and outcome of CKD. The kidney is the main organ for erythropoietin (EPO) synthesis. When renal function is impaired (especially destruction of renal paratubular mesangial cells), EPO synthesis is significantly reduced, causing anemia.40 At the same time, anemia exacerbates renal hypoxia and oxidative stress. Anemia-induced hypoxia further promotes CKD progression by triggering inflammation, fibrosis, and dysregulated angiogenesis.41
HDLs are anti-inflammatory, antioxidant, antithrombotic, and antiapoptotic. They inhibit the progression of AS by removing excess cholesterol through the reverse cholesterol transport (RCT) pathway, making it the only plasma lipoprotein with anti-AS effects.42,43 ApoA1 is a major structural protein, accounting for about 70% of the protein content of HDL.44 ApoB is a notable structural protein in LDL, TG-rich lipoproteins, and lipoprotein(a), critical for their formation, metabolism, and atherogenic properties.45 A high ApoB/ApoA1 ratio is a strong predictor of cardiovascular risk.46 This study confirms that it is also a risk factor for CKD (ApoB/ApoA1, OR=2.78, 95% CI 1.53–5.05, P<0.001), and that high ratios reflect the imbalance between atherogenic lipoprotein particles (represented by ApoB) and protective lipoprotein particles (represented by ApoA1 for HDL). The imbalance also damages the renal microvasculature.
CHEN et al explored the link between four systemic inflammatory markers and all-cause mortality of individuals with CKD in a prospective study. NLR and LMR showed the strongest ability in predicting all-cause mortality in individuals with CKD. High NLR values indicated an increase in chronic inflammation, which was positively linked to all-cause mortality in CKD. In comparison, higher LMR levels conferred protection against adverse clinical outcomes in the CKD population.47 This study yielded similar results: a lower LMR (OR=0.87, 95% CI 0.76–0.99, P=0.038) indicated an increased risk of CKD. Mechanistically, low LMR reflects relative lymphocytopenia (indicating immunosuppression or consumption) and/or monocytosis (suggesting heightened inflammatory states). They collectively suggest that immunological dysregulation contributes to the pathogenesis of CKD.
Multifactor logistic regression clearly showed that male (OR=3.89, 95% CI 2.24–6.84, P<0.001), advanced age (OR=1.02, 95% CI 1.01–1.04, P=0.013), hypertension (OR=3.01, 95% CI 2.10–4.36, P<0.001), diabetes mellitus (OR=2.11, 95% CI 1.43–3.11, P<0.001), and AF (OR=4.83, 95% CI 2.31–10.2, P<0.001) were strong independent predictors of CKD. This is highly consistent with established epidemiologic evidence. Male sex, advanced age, hypertension, and diabetes are recognized risk factors for CKD.48,49 They contribute to the decline in renal function by promoting glomerulosclerosis, tubulointerstitial fibrosis, and vascular injury.50,51 Reduced PCT (OR=0.01, 95% CI 0.00–0.16, P=0.003) was related to an elevated risk of CKD. Mechanistically, inflammation states and immune disorders cause platelet destruction, and thus, PCT decreases. In addition, high TG (OR=1.20, 95% CI 1.08–1.35, P=0.001) and high Lp(a) (OR=2.91, 95% CI 1.44–5.84, P=0.003) were significant risk factors for CKD. Hypertriglyceridemia is associated with insulin resistance and renal lipid deposition.52 Lp(a) has pro-atherogenic and pro-thrombotic properties and may directly damage the glomerular endothelium.53
This study constructed diagnostic models specifically for CKD in patients with CHD was established. It fills the gap of targeted prediction tools in the field, and the results will be of direct guidance to cardiovascular physicians in identifying patients with CHD who may have comorbid or impending CKD. The study incorporates and validates the value of a variety of emerging and readily available hematologic markers (eg, UAR, SIRI, LMR, ApoB/ApoA1) in predicting CKD risk. These composite inflammatory, immune, or nutritional metrics provide early risk signals beyond traditional markers of renal function (eg, creatinine).
This study has several limitations. Its single-center, retrospective design may limit the generalizability of the findings and introduce selection bias. Although the Events Per Variable (EPV ≈ 23) was adequate, and measures were taken to mitigate overfitting, the sample size and the lack of external validation may still affect the stability and applicability of the model. Furthermore, given the cross-sectional design of this study, it is infeasible to infer causal relationships. Finally, while stringent procedures were applied during data preprocessing, the possibility of undetected data leakage in a complex pipeline cannot be fully excluded. Future prospective, multi-center studies with external validation are needed to confirm and extend our findings.
Conclusions
In this study, a series of ML models were successfully constructed and validated for identifying preexisting CKD in CHD patients. Among multiple ML models, XGBoost demonstrated the optimal overall detection performance (validation set AUC=0.909) and a good generalization ability. Decision curve analysis further confirmed the potential net benefit of the XGBoost model in guiding clinical decisions.
Data Sharing Statement
The datasets used and analysed during the current study are available from the corresponding author on reasonable request.
Author Contributions
Ting He and Jinbo Zhao contributed equally to this work and should be considered as co-first authors. All authors made a significant contribution to the work reported, whether that is in the conception, study design, execution, acquisition of data, analysis and interpretation, or in all these areas; took part in drafting, revising or critically reviewing the article; gave final approval of the version to be published; have agreed on the journal to which the article has been submitted; and agree to be accountable for all aspects of the work.
Funding
This research did not receive any specific grant from funding agencies in the public, commercial, or not-for-profit sectors.
Disclosure
The authors declare that they have no competing interests.
References
1. Hu S. Diseases. NCfC, Report. TCTotCCHaD. Report on Cardiovascular Health and Diseases in China 2023:an Updated Summary. Chinese Circulation J. 2024;39(7):625–660. doi:10.3969/j.issn.1000-3614.2024.07.001
2. Wang L, Xu X, Zhang M, et al. Prevalence of Chronic Kidney Disease in China: results From the Sixth China Chronic Disease and Risk Factor Surveillance. JAMA Intern Med. 2023;183(4):298–310. doi:10.1001/jamainternmed.2022.6817
3. Miller ZA, Dwyer K. Artificial Intelligence to Predict Chronic Kidney Disease Progression to Kidney Failure: a Narrative Review. Nephrology. 2025;30(1):e14424. doi:10.1111/nep.14424
4. Luo Q, Hu Y, Chen X, Luo Y, Chen J, Wang H. Effects of Gut Microbiota and Metabolites on Heart Failure and Its Risk Factors: a Two-Sample Mendelian Randomization Study. Front Nutr. 2022;9:899746. doi:10.3389/fnut.2022.899746
5. Gogoi P, Valan JA. Machine learning approaches for predicting and diagnosing chronic kidney disease: current trends, challenges, solutions, and future directions. Int Urol Nephrol. 2025;57(4):1245–1268. doi:10.1007/s11255-024-04281-5
6. Sanmarchi F, Fanconi C, Golinelli D, Hernandez-Boussard T, Capodici A. Predict, diagnose, and treat chronic kidney disease with machine learning: a systematic literature review. J Nephrol. 2023;36(4):1101–1117. doi:10.1007/s40620-023-01573-4
7. Zhu LHF, Zhou Y, Zheng Y, Chen XM. Research progress on artificial intelligence in constructing cardiovascular risk prediction models for chronic kidney disease. Nat Med J China. 2024;104(28):2668–2671.
8. Kwiendacz H, Huang B, Chen Y, et al. Predicting major adverse cardiac events in diabetes and chronic kidney disease: a machine learning study from the Silesia Diabetes-Heart Project. Cardiovasc Diabetol. 2025;24(1):76. doi:10.1186/s12933-025-02615-w
9. Ferris M, Shoham DA, Pierre-Louis M, Mandhelker L, Detwiler RK, Kshirsagar AV. High prevalence of unlabeled chronic kidney disease among inpatients at a tertiary-care hospital. Am J Med Sci. 2009;337(2):93–97. doi:10.1097/MAJ.0b013e318181288e
10. van Rijn MHC, van de Luijtgaarden M, van Zuilen AD, et al. Prognostic models for chronic kidney disease: a systematic review and external validation. Nephrol Dial Transplant. 2021;36(10):1837–1850. doi:10.1093/ndt/gfaa155
11. Bauer MJ, Nano N, Adolf R, et al. Prognostic Value of Machine Learning-based Time-to-Event Analysis Using Coronary CT Angiography in Patients with Suspected Coronary Artery Disease. Radiol Cardiothorac Imaging. 2023;5(2):e220107. doi:10.1148/ryct.220107
12. Mo PC, Hsu HY, Lin CF, et al. Distinguish different sensorimotor performance of the hand between the individuals with diabetes mellitus and chronic kidney disease through deep learning models. Front Bioeng Biotechnol. 2024;12:1351485. doi:10.3389/fbioe.2024.1351485
13. Haratian A, Maleki Z, Shayegh F, Safaeian A. Detection of factors affecting kidney function using machine learning methods. Sci Rep. 2022;12(1):21740. doi:10.1038/s41598-022-26160-8
14. Cachofeiro V, Goicochea M, de Vinuesa SG, Oubiña P, Lahera V, Luño J. Oxidative stress and inflammation, a link between chronic kidney disease and cardiovascular disease. Kidney Int. 2008;72(111):S4–9. doi:10.1038/ki.2008.516
15. Naito K, Anzai T, Yoshikawa T, et al. Impact of chronic kidney disease on postinfarction inflammation, oxidative stress, and left ventricular remodeling. J Card Fail. 2008;14(10):831–838. doi:10.1016/j.cardfail.2008.07.233
16. Meijs C, Handoko ML, Savarese G, et al. Discovering Distinct Phenotypical Clusters in Heart Failure Across the Ejection Fraction Spectrum: a Systematic Review. Curr Heart Fail Rep. 2023;20(5):333–349. doi:10.1007/s11897-023-00615-z
17. Su D, Zhang X, He K, Chen Y, Wu N. Individualized prediction of chronic kidney disease for the elderly in longevity areas in China: machine learning approaches. Front Public Health. 2022;10:998549. doi:10.3389/fpubh.2022.998549
18. Ye Z, An S, Gao Y, et al. The prediction of in-hospital mortality in chronic kidney disease patients with coronary artery disease using machine learning models. Eur J Med Res. 2023;28(1):33. doi:10.1186/s40001-023-00995-x
19. KDIGO. Clinical Practice Guideline for the Evaluation and Management of Chronic Kidney Disease. Kidney Int. 2024;105(4s):S117–s314. doi:10.1016/j.kint.2023.10.018
20. Zhang Y, Huang C, Luo YQ. Risk Factors of Chronic Kidney Disease in Patients with Coronary Heart Disease and Construction of Predictive Model. South China JCardiovas Dis. 2023;29(4):370–374. doi:10.3969/j.issn.1007-9688.2023.04.05
21. Laffin LJ, Bakris GL. Intersection Between Chronic Kidney Disease and Cardiovascular Disease. Curr Cardiol Rep. 2021;23(9):117. doi:10.1007/s11886-021-01546-8
22. Kanbay M, Jensen T, Solak Y, et al. Uric acid in metabolic syndrome: from an innocent bystander to a central player. Eur J Intern Med. 2016;29:3–8. doi:10.1016/j.ejim.2015.11.026
23. Testa A, Mallamaci F, Spoto B, et al. Association of a polymorphism in a gene encoding a urate transporter with CKD progression. Clin J Am Soc Nephrol. 2014;9(6):1059–1065. doi:10.2215/cjn.11041013
24. Wang Y, Wei RB, Su TY, Huang MJ, Li P, Chen XM. Clinical and pathological factors of renal anaemia in patients with IgA nephropathy in Chinese adults: a cross-sectional study. BMJ Open. 2019;9(1):e023479. doi:10.1136/bmjopen-2018-023479
25. Goto M, Wakai K, Kawamura T, Ando M, Endoh M, Tomino Y. A scoring system to predict renal outcome in IgA nephropathy: a nationwide 10-year prospective cohort study. Nephrol Dial Transplant. 2009;24(10):3068–3074. doi:10.1093/ndt/gfp273
26. Şaylık F, Çınar T, Akbulut T, Selçuk M. Serum Uric Acid to Albumin Ratio Can Predict Contrast-Induced Nephropathy in ST-Elevation Myocardial Infarction Patients Undergoing Primary Percutaneous Coronary Intervention. Angiology. 2023;74(1):70–78. doi:10.1177/00033197221091605
27. Çakmak E, Bayam E, Çelik M, et al. Uric Acid-to-Albumin Ratio: a Novel Marker for the Extent of Coronary Artery Disease in Patients with Non-ST-Elevated Myocardial Infarction. Pulse. 2021;8(3–4):99–107. doi:10.1159/000514533
28. Özgür Y, Akın S, Yılmaz NG, Gücün M, Keskin Ö. Uric acid albumin ratio as a predictive marker of short-term mortality in patients with acute kidney injury. Clin Exp Emerg Med. 2021;8(2):82–88. doi:10.15441/ceem.20.024
29. Zhang Y, Xu Z, He W, et al. Elevated Serum Uric Acid/Albumin Ratio as a Predictor of Post-Contrast Acute Kidney Injury After Percutaneous Coronary Intervention in Patients with ST-Segment Elevation Myocardial Infarction. J Inflamm Res. 2022;15:5361–5371. doi:10.2147/jir.S377767
30. Kalkan S, Cagan Efe S, Karagöz A, et al. A New Predictor of Mortality in ST-Elevation Myocardial Infarction: the Uric Acid Albumin Ratio. Angiology. 2022;73(5):461–469. doi:10.1177/00033197211066362
31. Qin A, Yang D, Wang S, et al. Uric acid-based ratios for predicting renal failure in Chinese IgA nephropathy patients. Int J Med Sci. 2023;20(12):1584–1591. doi:10.7150/ijms.85430
32. Mohebi R, van Kimmenade R, McCarthy C, et al. A Biomarker-Enhanced Model for Prediction of Acute Kidney Injury and Cardiovascular Risk Following Angiographic Procedures: CASABLANCA AKI Prediction Substudy. J Am Heart Assoc. 2022;11(10):e025729. doi:10.1161/jaha.122.025729
33. Zhang Q, Wang YF, Hu X, et al. Association of serum cardiac troponin I and severity of coronary stenosis in patients with varied renal functions: a retrospective cohort study. BMJ Open. 2022;12(3):e054722. doi:10.1136/bmjopen-2021-054722
34. Yan BWQ, Lei MM. Correlation between coronary Gensini score and renal function/bilirubin in acute myocardial infarction patients undergoing emergency intervention. Chin J Hemorheol. 2018;28(4):401–405.
35. Liang JZLS. Analysis of the predictive value of Gensini score combined with NT-proBNP in patients with acute myocardial infarction complicated with heart failure after PCI. Chin J Cardiovas Res. 2022;20(6):564–570. doi:10.3969/j.issn.1672-5301.2022.06.018
36. Desai SR, Dhindsa DS, Ko YA, et al. Aggregate Clinical and Biomarker-Based Model Predicts Adverse Outcomes in Patients With Coronary Artery Disease. Am J Cardiol. 2023;203:315–324. doi:10.1016/j.amjcard.2023.06.115
37. Gu L, Xia Z, Qing B, et al. Systemic Inflammatory Response Index (SIRI) is associated with all-cause mortality and cardiovascular mortality in population with chronic kidney disease: evidence from NHANES (2001–2018). Front Immunol. 2024;15:1338025. doi:10.3389/fimmu.2024.1338025
38. Huang P, Mai Y, Zhao J, Yi Y, Wen Y. Association of systemic immune-inflammation index and systemic inflammation response index with chronic kidney disease: observational study of 40,937 adults. Inflamm Res. 2024;73(4):655–667. doi:10.1007/s00011-024-01861-0
39. Chen TK, Knicely DH, Grams ME. Chronic Kidney Disease Diagnosis and Management: a Review. JAMA. 2019;322(13):1294–1304. doi:10.1001/jama.2019.14745
40. She J, Yuan Z, Wu Y, Chen J, Kroll J. Targeting erythropoietin protects against proteinuria in type 2 diabetic patients and in zebrafish. Mol Metab. 2018;8:189–202. doi:10.1016/j.molmet.2017.11.006
41. Wang B, Li ZL, Zhang YL, Wen Y, Gao YM, Liu BC. Hypoxia and chronic kidney disease. EBioMedicine. 2022;77:103942. doi:10.1016/j.ebiom.2022.103942
42. Barter PJ, Nicholls S, Rye KA, Anantharamaiah GM, Fogelman AM. Antiinflammatory properties of HDL. Circ Res. 2004;95(8):764–772. doi:10.1161/01.Res.0000146094.59640.13
43. Kontush A, Chapman MJ. Antiatherogenic function of HDL particle subpopulations: focus on antioxidative activities. Curr Opin Lipidol. 2010;21(4):312–318. doi:10.1097/MOL.0b013e32833bcdc1
44. Ben-Aicha S, Badimon L, Vilahur G. Advances in HDL: much More than Lipid Transporters. Int J Mol Sci. 2020;21(3):732. doi:10.3390/ijms21030732
45. Borén J, Packard CJ, Binder CJ. Apolipoprotein B-containing lipoproteins in atherogenesis. Nat Rev Cardiol. 2025;22(6):399–413. doi:10.1038/s41569-024-01111-0
46. Deng F, Li D, Lei L, et al. Association between apolipoprotein B/A1 ratio and coronary plaque vulnerability in patients with atherosclerotic cardiovascular disease: an intravascular optical coherence tomography study. Cardiovasc Diabetol. 2021;20(1):188. doi:10.1186/s12933-021-01381-9
47. Chen Y, Nie Y, Wu J, et al. Association between systemic inflammatory indicators with the survival of chronic kidney disease: a prospective study based on NHANES. Front Immunol. 2024;15:1365591. doi:10.3389/fimmu.2024.1365591
48. Kalantar-Zadeh K, Jafar TH, Nitsch D, Neuen BL, Perkovic V. Chronic kidney disease. Lancet. 2021;398(10302):786–802. doi:10.1016/s0140-6736(21)00519-5
49. Burnier M, Damianaki A. Hypertension as Cardiovascular Risk Factor in Chronic Kidney Disease. Circ Res. 2023;132(8):1050–1063. doi:10.1161/circresaha.122.321762
50. Wang Y, Wang Y, Jin J, Ma B. Identify the co-expressed genes of hypertensive nephropathy and diabetic nephropathy. Sci Rep. 2025;15(1):19418. doi:10.1038/s41598-025-04679-w
51. Vijay K, Neuen BL, Lerma EV. Heart Failure in Patients with Diabetes and Chronic Kidney Disease: challenges and Opportunities. Cardiorenal Med. 2022;12(1):1–10. doi:10.1159/000520909
52. Liu S, Sun H, Liu J, Wang G. Accessing the relationship between six surrogate insulin resistance indexes and the incidence of rapid kidney function decline and the progression to chronic kidney disease among middle-aged and older adults in China: results from the China health and retirement longitudinal study. Diabet Res Clin Pract. 2024;212:111705. doi:10.1016/j.diabres.2024.111705
53. Zhu Y, Chen S, Chen Z, Wang Y, Fu G, Zhang W. Causal effect of lipoprotein(a) level on chronic kidney disease of European ancestry: a two-sample Mendelian randomization study. Ren Fail. 2024;46(2):2383727. doi:10.1080/0886022x.2024.2383727
 © 2025 The Author(s). This work is published and licensed by Dove Medical Press Limited. The
full terms of this license are available at https://www.dovepress.com/terms
and incorporate the Creative Commons Attribution
- Non Commercial (unported, 4.0) License.
By accessing the work you hereby accept the Terms. Non-commercial uses of the work are permitted
without any further permission from Dove Medical Press Limited, provided the work is properly
attributed. For permission for commercial use of this work, please see paragraphs 4.2 and 5 of our Terms.
© 2025 The Author(s). This work is published and licensed by Dove Medical Press Limited. The
full terms of this license are available at https://www.dovepress.com/terms
and incorporate the Creative Commons Attribution
- Non Commercial (unported, 4.0) License.
By accessing the work you hereby accept the Terms. Non-commercial uses of the work are permitted
without any further permission from Dove Medical Press Limited, provided the work is properly
attributed. For permission for commercial use of this work, please see paragraphs 4.2 and 5 of our Terms.
Recommended articles
Predicting Antibiotic Resistance in ICUs Patients by Applying Machine Learning in Vietnam
Tran Quoc V, Nguyen Thi Ngoc D, Nguyen Hoang T, Vu Thi H, Tong Duc M, Do Pham Nguyet T, Nguyen Van T, Ho Ngoc D, Vu Son G, Bui Duc T
Infection and Drug Resistance 2023, 16:5535-5546
Published Date: 22 August 2023
Risk Factors for Gout in Taiwan Biobank: A Machine Learning Approach
Liu YR, Nfor ON, Zhong JH, Lin CY, Liaw YP
Journal of Inflammation Research 2024, 17:9847-9856
Published Date: 26 November 2024
Construction and Validation of a Machine Learning-Based Risk Prediction Model for Sleep Quality in Patients with OSA
Tong Y, Wen K, Li E, Ai F, Tang P, Wen H, Guo B
Nature and Science of Sleep 2025, 17:1271-1289
Published Date: 12 June 2025
A Machine Learning Model Integrating Tongue Image Features and Myocardial Injury Markers Predicts Major Adverse Cardiovascular Events in Patients with Coronary Heart Disease
Zhou M, Li J, Lim J, Xiao X, Xia Y, Wang Q, Xu Z
International Journal of General Medicine 2025, 18:3739-3765
Published Date: 5 July 2025
Explainable Machine Learning for Prediction of Early Postoperative Nausea and Vomiting After General Anesthesia
Chang HC, Chen LY, Lin YS
Journal of Multidisciplinary Healthcare 2026, 19:572550
Published Date: 26 February 2026