Back to Journals » International Journal of Women's Health » Volume 18
Novel Perspective for Prognostic Stratification and Personalized Therapy in Breast Cancer Patients: Development of Cancer Stem Cells and Metabolism-Associated Prognostic Model
Authors Li W, Li S, Quan S, Han T, Chen J, Zhai C, Xiao D, Fan Z
Received 3 April 2026
Accepted for publication 3 June 2026
Published 19 June 2026 Volume 2026:18 613522
DOI https://doi.org/10.2147/IJWH.S613522
Checked for plagiarism Yes
Review by Single anonymous peer review
Peer reviewer comments 2
Editor who approved publication: Dr Marta Barba
Wanjun Li,1,* Shuo Li,2,* Shaomin Quan,3 Tuo Han,4 Jiaqi Chen,5 Chao Zhai,4 Dong Xiao,4 Zhigang Fan2
1Department of Pathology, 3201 Hospital, Hanzhong, 723000, People’s Republic of China; 2Department of Oncology, 3201 Hospital, Hanzhong, 723000, People’s Republic of China; 3Department of Medical Quality Monitoring, 3201 Hospital, Hanzhong, 723000, People’s Republic of China; 4Department of Thyroid and Breast Surgery, 3201 Hospital, Hanzhong, 723000, People’s Republic of China; 5Department of Radiation Oncology, 3201 Hospital, Hanzhong, 723000, People’s Republic of China
*These authors contributed equally to this work
Correspondence: Zhigang Fan, Department of Oncology, 3201 Hospital, No. 783, Tianhan Avenue, Hanzhong, Shaanxi, 723000, People’s Republic of China, Email [email protected] Dong Xiao, Department of Thyroid and Breast Surgery, 3201 Hospital, No. 783, Tianhan Avenue, Hanzhong, Shaanxi, 723000, People’s Republic of China, Email [email protected]
Background: Breast cancer is a common malignant tumor in the female population, and cancer stem cells (CSCs) and metabolic reprogramming are key factors for tumor progression. This study aimed to construct a CSCs and metabolism-associated prognostic model for breast cancer patients.
Methods: Differentially expressed genes (DEGs) were identified from the GSE42568 dataset and intersected with CSCs-associated genes (from BCSCdb) and metabolism-associated genes (from KEGG). A prognostic model was established via univariate and LASSO Cox regression, validated in GSE7390 and brca_metabric datasets. In addition, functional annotations, immune cell infiltration analysis, drug sensitivity analysis, and immunohistochemical assay were also conducted.
Results: A risk score model established from 12 CSCs and metabolism-associated DEGs (ETFDH, PLA2G4A, ABCA1, ALDH2, ADRA2A, TRIB3, CYB5A, STARD3, UGCG, CACNA1D, ASS1, and GSTP1) showed favorable prognostic predictive value. Immunohistochemical results showed that the expression trends of proteins encoded by these model genes were consistent with those of gene expression in public databases. Multivariate Cox regression analysis revealed that lymph and risk score were independent prognostic factors for breast cancer patients. Functional annotation results clearly revealed significant biological differences between the high- and low-risk groups. In addition, there were differences in immune cell infiltration levels between the two groups, and the expression levels of immune checkpoints were significantly higher in the high-risk group. The results of drug sensitivity prediction showed that there may be different drug responses between high and low risk groups.
Conclusion: The CSCs and metabolism-associated model provides a potential tool for prognostic stratification and personalized treatment guidance in breast cancer.
Keywords: breast cancer, cancer stem cells, metabolism, prognosis, risk score
Introduction
Breast cancer is the most common malignant tumor worldwide and one of the leading causes of cancer-related deaths. The vast majority of affected individuals are females, with its incidence increasing with age.1 The occurrence and development of breast cancer are influenced by multiple factors, including genetic, environmental, and lifestyle-related factors.2 In addition, breast cancer exhibits strong invasiveness, prone to immune evasion and brain metastasis, which further aggravates the burden of disease diagnosis and treatment.3–5 Current main treatment methods for breast cancer include targeted therapy, hormonal therapy, radiotherapy, and surgery. Owing to the significant interindividual heterogeneity in the etiology and pathological characteristics of breast cancer, and despite the significant advancements in surgery and systemic treatment, the prognosis for breast cancer patients has not yet reached the expected level.6,7 Therefore, identifying novel prognostic biomarkers, exploring promising therapeutic targets, and establishing reliable tools for accurate prognostic prediction are crucial for improving the clinical outcomes of breast cancer patients.
Cancer stem cells (CSCs) are defined as a subset of tumor cells with the ability of self-renewal, tumor initiation and tumor maintenance.8,9 CSCs are considered to be the source of breast cancer progression, metastasis, and therapy resistance.10,11 Metabolic reprogramming a core hallmark of cancer supports tumor cell survival and proliferation by altering energy metabolism and biosynthetic pathways.12 Studies have shown that there is a complex relationship between CSCs and metabolic reprogramming, which jointly promote tumor progression.13,14 It has also been reported in breast cancer that CSCs and metabolic reprogramming play a key role in disease development.15,16 Furthermore, studies have also shown that both CSCs and metabolism are associated with breast cancer prognosis.17,18 However, most of these studies focus on a single aspect, and few studies have combined them to construct prognostic prediction models. Given the complex crosstalk between CSCs and metabolic reprogramming, a combined signature may capture complementary prognostic information and provide higher predictive power compared with models based on either aspect alone.
In this study, common genes associated with both CSCs and metabolism were identified, and an attempt was made to integrate these two dimensions (CSCs and metabolism) for the construction of a prognostic risk score model. The Gene Expression Omnibus (GEO), The Cancer Genome Atlas (TCGA) and cBioPortal databases provide extensive gene expression and clinical data, which are helpful for identifying and validating prognostic biomarkers for different patient groups. In this study, the GSE42568 dataset was set as the training set, and the GSE7390, TCGA-BRCA and cBioPortal-brca_metabric datasets were set as the validation sets. The prognostic model and model genes were validated in multiple independent datasets to ensure their robustness. Additionally, the independent prognostic value of the risk score was further evaluated, and a nomogram was constructed by integrating the risk score with clinical characteristics. Furthermore, the associations between the risk score and immune cell infiltration, immune checkpoint expression, as well as drug sensitivity were explored. The research results not only provide new and reliable molecular indicators for the early prognosis stratification of breast cancer patients, but also offer insights for the formulation of more precise and personalized treatment strategies, thus having significant clinical application value and translational research significance.
Materials and Methods
Data Sources
In this study, only tissue-derived datasets containing patients with complete survival information were included in the analysis. The GSE42568 dataset (https://www.ncbi.nlm.nih.gov/geo/query/acc.cgi?acc=GSE42568, platform GPL570) was downloaded from the GEO database, which included 121 tissue samples (104 breast cancer tissue samples and 17 control tissue samples). Meanwhile, the GSE7390 dataset (https://www.ncbi.nlm.nih.gov/geo/query/acc.cgi?acc=GSE7390, platform GPL96) was downloaded from the GEO database for the validation of the prognostic model, which included 198 breast cancer tissue samples. Additionally, the brca_metabric dataset (https://www.cbioportal.org/study/summary?id=brca_metabric) was downloaded from the cBioPortal database, also used for prognostic model validation, which included 2509 breast cancer tissue samples. RNA-seq data of TCGA-Breast Cancer (TCGA-BRCA) (file name: TCGA-BRCA.star_fpkm.tsv) was extracted from the University of California, Santa Cruz (UCSC) Xena database (https://xena.ucsc.edu/), which contained 1091 breast cancer tissue samples and 112 control tissue samples for validating the expression levels of model genes. All datasets were preprocessed prior to analysis with the mean value of duplicate genes taken as the gene expression value and all data subjected to logarithmic transformation followed by scaling to an appropriate range.
Identification and Functional Annotation of Candidate Key CSCs and Metabolism-Associated DEGs
In the GSE42568 dataset, DEGs between breast cancer and control groups were identified using the “limma” package based on the criteria of |log fold change (FC)|≥1 and adjusted P<0.05. CSCs-associated gene data were downloaded from the BCSCdb database (http://dibresources.jcbose.ac.in/ssaha4/bcscdb/index.php), and a total of 8536 CSCs-associated genes were obtained. Metabolism-associated gene data were downloaded from the KEGG database (https://www.kegg.jp/), and a total of 2042 metabolism-associated genes were acquired. The intersection of the above three gene sets (DEGs, CSCs-associated genes, and metabolism-associated genes) was taken as candidate key CSCs and metabolism-associated DEGs for subsequent analyses. Subsequently, Gene Ontology (GO) and Kyoto Encyclopedia of Genes and Genomes (KEGG) enrichment analyses were performed on the obtained candidate key CSCs and metabolism-associated DEGs. In addition, a protein-protein interaction (PPI) network was constructed based on the STRING database (https://string-db.org/) to initially investigate the interactions of candidate key CSCs and metabolism-associated DEGs at the protein level. The interaction score cutoff was set at 0.7, and the network was visualized using Cytoscape software.
Construction of Prognostic Risk Score Model
Based on the GSE42568 dataset, univariate Cox regression analysis was used to evaluate the prognostic value of candidate key CSCs and metabolism-associated DEGs, and genes associated with breast cancer prognosis (p<0.05) were screened out. To further identify key prognosis-related genes in breast cancer, Lasso-Cox regression with 10-fold cross-validation was performed using the glmnet package. Using complete survival data in the training set as the response variable and prognosis-related genes as predictors, variable selection was conducted with L1 regularization (alpha=1). The optimal lambda (lambda.min) with minimum cross-validation error was selected, and genes with non-zero coefficients were identified as key prognostic genes. A risk score formula was established based on the coefficients. The risk score formula is  (Note: n, number of genes; expi: expression value of gene i, βi: regression coefficient of gene i).
According to the median of the risk score, breast cancer patients were divided into high- and low-risk groups. Subsequently, Kaplan-Meier survival curves were plotted using the “survival” and “survminer” packages to evaluate the prognostic differences between different risk groups. In addition, time-dependent receiver operating characteristic (ROC) curve analysis was performed by the “timeROC” package to verify the accuracy of the risk model in predicting 1-, 3-, and 5-year survival of patients. The GSE7390 and brca_metabric datasets were used to validate the risk score.
Risk Score and Clinical Characteristics
Univariate and multivariate Cox analyses were used to assess prognostic independence of risk score and clinical characteristics. The “rms” package was used to construct a nomogram by integrating independent prognostic factors to predict the 1-, 3-, and 5-years survival probabilities of patients. Subsequently, a calibration curve was used to evaluate the prediction accuracy of the nomogram model. To further evaluate the clinical utility of the model, the “ggDCA” package was used to perform decision curve analysis (DCA) for assessing the clinical net benefit of the model under different risk thresholds. In addition, time-dependent ROC curve analysis was also performed by the “timeROC” package to verify the accuracy of the model in predicting 1-, 3-, and 5-year survival of patients. Subsequently, two Cox proportional hazards regression models were established. The baseline clinical model included age, estrogen receptor (ER) status, tumor size, histological grade and lymph node status. The full model (new model) further adds the risk score on the basis of baseline variables. The predictSurvProb function in the pec package was used to estimate event probabilities at different time points. The integrated discrimination improvement (IDI) and continuous net reclassification improvement (NRI) were calculated via the survIDINRI package.
Differential Analysis and Functional Annotation Between High- and Low-Risk Groups
DEGs between high- and low-risk groups were identified using the “limma” package based on the criteria of |logFC|≥1 and adjusted P<0.05. To evaluate the biological function differences between high- and low-risk groups of breast cancer patients, a descending gene list was constructed based on the logFC values of all genes. Subsequently, Gene Set Enrichment Analysis (GSEA) was performed using the reference file (h.all.v2023.2.Hs.symbols.gmt), with the p-value cutoff set to 0.05, and the top 10 most significantly different pathways were finally screened out. In addition, GO and KEGG enrichment analyses were performed on the DEGs.
Characteristic Analysis of Model Genes
Based on the GSE42568, GSE7390, brca_metabric, and TCGA-BRCA datasets, differential expression analysis of model genes was performed between high- and low-risk groups, as well as between breast cancer and control groups using the Wilcoxon test. Additionally, breast cancer patients in the GSE42568 dataset were divided into high- and low-expression groups based on the median expression level of each model gene. Kaplan-Meier analysis was used to compare the survival differences of patients in the high- and low-expression groups of model gene.
Evaluation of Immune Characteristics
In this study, the “CIBERSORT” algorithm was used to evaluate the immune cell infiltration levels in the high- and low-risk groups, and the Wilcoxon test was applied to analyze the statistical significance of differences between the two groups. Subsequently, Pearson correlation analysis was performed to explore the correlation between the risk score and differential immune cells. Additionally, the Wilcoxon test was used to analyze the expression differences of immune checkpoints between the high- and low-risk score groups.
Prediction of Drug Sensitivity
In this study, the “pRRophetic” package was used to predict the median inhibition concentration (IC50) of a series of commonly used clinical antitumor drugs in breast cancer patients, so as to investigate the differences in drug responses between different risk groups. The Wilcoxon test was used to perform statistical analysis on the IC50 values between the high- and low-risk groups.
Immunohistochemical Assay
Tumor tissues and paired adjacent normal tissues were collected from 20 patients with breast cancer and examined by immunohistochemistry. After deparaffinization and rehydration, the tissue sections were subjected to antigen retrieval in 0.01 M citrate buffer. Subsequently, the sections were permeabilized and blocked for endogenous peroxidase using a permeabilization and blocking solution. After blocking with 10% goat serum, sections were incubated with diluted primary antibodies at 4°C overnight, followed by incubation with secondary antibodies at 37°C. DAB reagent was used for color development, and hematoxylin was used for counterstaining. Finally, sections were dehydrated, sealed with neutral balsam, and observed under a light microscope. The primary antibodies included ETFDH (bs-13110R, Bioss, 1:300), CACH3 (bs-3932R, Bioss, 1:300), ALDH2 (bsm-51466M, Bioss, 1:300), ABCA1 (bs-23418R, Bioss, 1:400), ADRA2 (bs-1062R, Bioss, 1:200), Ceramide glucosyltransferase (bs-21562R, Bioss, 1:200), TRIB3 (bs-7538R, Bioss, 1:200), GSTP1 (bs-42396R, Bioss, 1:200), CPLA2/PLA2G4A (bs-7560R, Bioss, 1:200), MLN64 (20,292-1-AP, Proteintech, 1:200), Cytochrome b5 (12,365-1-AP, Proteintech, 1:200) and ASS1 (16,210-1-AP, Proteintech, 1:100). The corresponding genes for ceramide glucosyltransferase, MLN64 and cytochrome b5 were UGCG, STARD3 and CYB5A, respectively.
Results
Identification and Functional Annotation of Candidate Key CSCs and Metabolism-Associated DEGs
A total of 2055 DEGs were identified between breast cancer and control groups (Figure 1A). Subsequently, 2055 DEGs, 8536 CSCs-associated genes, and 2042 metabolism-associated genes were subjected to intersection analysis. A total of 197 common genes were obtained (Figure 1B), which were identified as candidate key CSCs and metabolism-associated DEGs. The results of GO functional enrichment analysis revealed that the candidate key CSCs and metabolism-associated DEGs were significantly enriched in terms such as fat cell differentiation, collagen-containing extracellular matrix and extracellular matrix structural constituent (Figure 1C). The results of the KEGG analysis revealed that the candidate key CSCs and metabolism-associated DEGs were significantly enriched in various signaling pathways such as Cytoskeleton in muscle cells, ECM-receptor interaction, and Focal adhesion (Figure 1D). The PPI network constructed based on the identified as candidate key CSCs and metabolism-associated DEGs consisted of 159 nodes and 378 edges. Among these, multiple interaction pairs such as ABHD5-PNPLA2, ACO1-CS, DLD-PDHA1, and ECHS1-HADH exhibited a combined_score of over 0.9, indicating high interaction reliability (Figure S1).
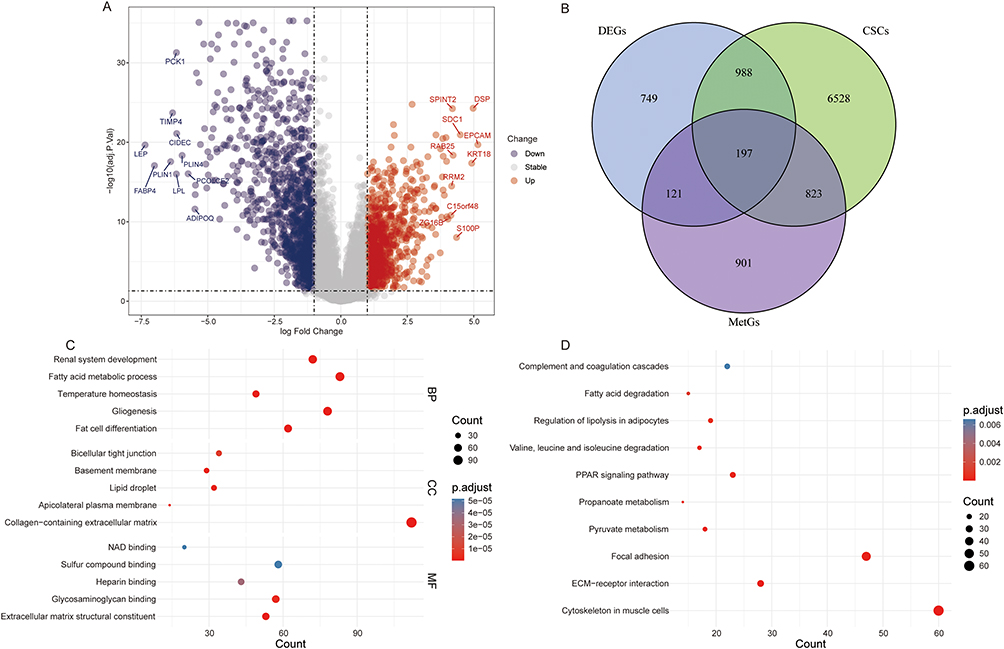 |
Figure 1 Identification and functional annotation of candidate key CSCs and metabolism-associated DEGs. (A) Volcano plot of DEGs between the breast cancer group and the control group in the GSE42568 dataset; (B) Venn diagram of the intersection of DEGs, CSCs-associated genes, and metabolism-associated genes; (C) GO enrichment analysis of candidate key CSCs and metabolism-associated DEGs; (D) KEGG enrichment analysis of candidate key CSCs and metabolism-associated DEGs. |
Construction and Validation of Prognostic Risk Score Model
In the GSE42568 dataset, 27 CSCs and metabolism-associated DEGs related to the prognosis of breast cancer were identified by univariate Cox regression analysis (Figure 2A). Subsequently, 12 CSCs and metabolism-associated DEGs (ETFDH, PLA2G4A, ABCA1, ALDH2, ADRA2A, TRIB3, CYB5A, STARD3, UGCG, CACNA1D, ASS1, and GSTP1) were further identified via LASSO regression analysis for the construction of a risk score model (Figure 2B). The risk score formula is Risk Score= (−0.280×ETFDH) + (−0.045×CACNA1D) + (−0.203×ALDH2) + (−0.131×CYB5A) + (−0.307×ABCA1) + (−0.015×ADRA2A) + (−0.310×UGCG) + (0.270×TRIB3) + (0.215×STARD3) + (0.103×GSTP1) + (0.094×PLA2G4A) + (0.037×ASS1).
 |
Figure 2 Construction of the risk score model. (A) Forest plot of DEGs associated with breast cancer prognosis identified by univariate Cox regression analysis; (B) Visualization of lasso analysis; (C) Risk score distribution in GSE42568 dataset; (D) Survival status in GSE42568 dataset; (E) Model genes expression heatmap in GSE42568 dataset; (F) Survival analysis of the high- and low-risk groups in GSE42568 dataset; (G) Time-dependent ROC curves of the risk score for prediction of 1-, 3-, and 5-year OS in GSE42568 dataset. |
According to the median of the risk score, breast cancer patients were divided into high- and low-risk groups (Figure 2C). The high-risk group had a higher mortality rate (Figure 2D), and most of the model genes were lowly expressed in the high-risk group (Figure 2E). The Kaplan-Meier analysis revealed that the low-risk group had a better survival advantage compared to the high-risk group (Figure 2F). The time-dependent ROC curve results showed that the area under curve (AUC) at 1-, 3-, and 5-years was 0.808, 0.854, and 0.927 respectively (Figure 2G), indicating that the risk model has good prognostic prediction accuracy. Subsequently, the risk model was validated in the GSE7390 (Figure S2A–E) and BRCA-METABRIC (Figure S2F–J) datasets based on the aforementioned formula. The results demonstrated consistency with those obtained from the GSE42568 dataset, which further confirmed the potential clinical application value of the risk score model.
Risk Score and Clinical Characteristics
Univariate and multivariate Cox regression analyses were performed for age, ER, tumor size (size), histological grade (grade), lymph node status (lymph), and risk score. Univariate Cox regression analysis revealed that grade, lymph, and risk score were prognostic risk factors for breast cancer patients (Figure 3A). Additionally, multivariate Cox regression analysis revealed that lymph and risk score were independent prognostic factors for breast cancer patients (Figure 3B). The factors that showed significant differences in univariate and multivariate Cox regression analyses (lymph and risk score) were included in the nomogram model to predict the 1-, 3- and 5-years survival rates of the patients (Figure 3C). The calibration curve indicated that the nomogram model had a good prognostic prediction ability (Figure 3D). Furthermore, the results of DCA curve (Figure 3E) and time-dependent ROC curves (Figure 3F–H) further confirmed that the nomogram and risk score exhibited have good predictive accuracy. The results of IDI and NRI analysis showed that compared with the baseline clinical model, the full model with risk score showed significant improvement in discriminant ability and risk stratification efficiency in 3- and 5-year survival prediction, while no statistical difference was observed in 1-year prediction (Table S1). The IDI and NRI at the 5-year time point reached a significant level, suggesting that the risk score can effectively improve the predictive value of the model for the long-term prognosis of breast cancer patients.
 |
Figure 3 Risk score and clinical characteristics. (A) Forest plot of risk score and clinical characteristics based on univariate Cox regression analysis; (B) Forest plot of risk score and clinical characteristics based on multivariate cox regression analysis; (C) A nomogram predicting 1 -, 3 - and 5-years survival; (D) Calibration curve of the nomogram; (E) DCA curve of risk score and nomogram; (F) ROC curves of nomogram, risk score and lymph for 1-year prediction; (G) ROC curves of nomogram, risk score and lymph for 3-year prediction; (H) ROC curves of nomogram, risk score and lymph for 5-year prediction. **P<0.01; ***P<0.001. |
Identification and Functional Annotation of DEGs Between High- and Low-Risk Groups
A total of 141 DEGs were identified between high- and low-risk groups (Figure 4A). To evaluate the biological function differences between high- and low-risk groups of breast cancer patients, a GSEA analysis was performed. The results showed that pathways such as HALLMARK_E2F_TARGETS, HALLMARK_MYC_TARGETS_V1 or V2, and HALLMARK_MTORC1_SIGNALING exhibited significant differences between the high-risk and low-risk groups (Figure 4B). In addition, GO and KEGG enrichment analyses were performed based on 141 DEGs. The results of GO functional enrichment analysis revealed that the DEGs were significantly enriched in terms such as developmental maturation, brush border membrane and toll-like receptor binding (Figure 4C). The results of the KEGG analysis revealed that the DEGs were significantly enriched in various signaling pathways such as PPAR signaling pathway, Cornified envelope formation and Cholesterol metabolism (Figure 4D).
 |
Figure 4 Identification and functional annotation of DEGs between high- and low-risk groups. (A) Volcano plot of DEGs between high- and low-risk groups; (B) Top 10 pathways in GSEA analysis; (C) GO enrichment analysis of DEGs between high- and low-risk groups; (D) KEGG enrichment analysis of DEGs between high- and low-risk groups. |
Expression of Model Genes
In the GSE42568 dataset, compared with the low-risk group, the expressions of PLA2G4A, TRIB3, STARD3, ASS1, and GSTP1 were up-regulated in the high-risk group, while the expressions of ETFDH, ABCA1, ALDH2, ADRA2A, CYB5A, UGCG, and CACNA1D were down-regulated in the high-risk group (Figure 5A). Subsequently, the expression of the model genes were validated in the GSE7390 (Figure 5B) and brca_metabric (Figure 5C) datasets, and the validation results showed that their expression trends were consistent with those observed in the GSE42568 dataset. Furthermore, in the GSE42568 dataset, compared with the control group, the expressions of TRIB3, STARD3, UGCG, and CACNA1D were up-regulated in the breast cancer group, while the expressions of ETFDH, PLA2G4A, ABCA1, ALDH2, ADRA2A, CYB5A, ASS1, and GSTP1 were down-regulated in the breast cancer group (Figure 6A). The expression of the model genes was verified in the control and breast cancer groups of the TCGA-BRCA dataset (Figure 6B). The results showed that except for CYB5A, the expression trends of the other model genes were consistent with those in the GSE42568 dataset, and the differences were of statistical significance. Additionally, breast cancer patients in the GSE42568 dataset were divided into high- and low-expression groups based on the median expression level of each model gene. The Kaplan-Meier analysis results showed that patients with high expression of PLA2G4A, TRIB3, STARD3 ASS1, and GSTP1 had poor prognosis, while patients with low expression of ETFDH, ABCA1, ALDH2, ADRA2A, CYB5A, UGCG and CACNA1D had poor prognosis (Figure 7).
 |
Figure 5 Expression boxplots of model genes in the high- and low-risk groups. (A) Expression boxplots of model genes in the high- and low-risk groups of the GSE42568 dataset; (B) Expression boxplots of model genes in the high- and low-risk groups of the GSE7390 dataset; (C) Expression boxplots of model genes in the high- and low-risk groups of the cBioPartal-brca_metabric dataset. |
 |
Figure 6 Expression boxplots of model genes in the breast cancer and control groups. (A) Expression boxplots of model genes in the breast cancer and control groups of the GSE42568 dataset; (B) Expression boxplots of model genes in the breast cancer and control groups of the TCGA-BRCA dataset. |
 |
Figure 7 Kaplan-Meier analysis curves of patients in the high- and low-expression groups of model genes. |
Immune Landscape and Drug Sensitivity Prediction
The CIBERSORT results showed that there were significant differences in the infiltration levels of T follicular helper cells, macrophages M2, and dendritic cells resting between high and low-risk groups (Figure 8A). Macrophages M2 was significantly negatively correlated with the risk score (Figure 8B). Moreover, xCell analysis also showed that the infiltration level of macrophages M2 was decreased in the high-risk group (Figure S3), which was consistent with the trend of CIBERSORT results. Immune checkpoint differential analysis results showed that most immune checkpoints were highly expressed in the high-risk group (Figure 8C), suggesting that the high-risk group may be more prone to immune escape. Subsequently, IC50 values for common drugs in the high and low risk groups were calculated. The results showed that the high-risk group exhibited higher sensitivity to A.443654, BI.2536, CGP.60474, CGP.082996, CMK, docetaxel, GNF.2, GW843682X, JW.7.52.1, NSC.87877, NVP.TAE684, and paclitaxel (Figure 9). These findings suggest potential differential drug responses between risk subgroups, warranting further preclinical and clinical validation.
 |
Figure 8 Evaluation of immune characteristics. (A) The immune infiltration levels of each immune cell in low- and high-risk groups; (B) Pearson correlation analysis between Macrophages M2 and risk score; (C) Expression boxplots of immune checkpoints in the high- and low-risk groups. *P<0.05; **P<0.01; ***P<0.001. Abbreviation: ns, no statistical significance. |
 |
Figure 9 The IC50 values of 12 drugs in the high- and low-risk groups. |
Immunohistochemical Verification of the Expression of Model Genes
To further clarify the expression characteristics of model genes in clinical samples, immunohistochemistry was used to detect their expression levels in breast cancer and paired adjacent normal tissues. Immunohistochemical results showed that the protein expression levels encoded by ETFDH, ALDH2, ABCA1, ADRA2A, GSTP1, PLA2G4A, CYB5A and ASS1 were down-regulated in breast cancer tissues, whereas those encoded by CACNA1D, UGCG, TRIB3 and STARD3 were up-regulated (Figures 10 and S4). The expression trends were consistent with the results of public database analysis, which further suggests that these model genes play a key regulatory role in the development of breast cancer, and the specific molecular mechanism remains to be further explored.
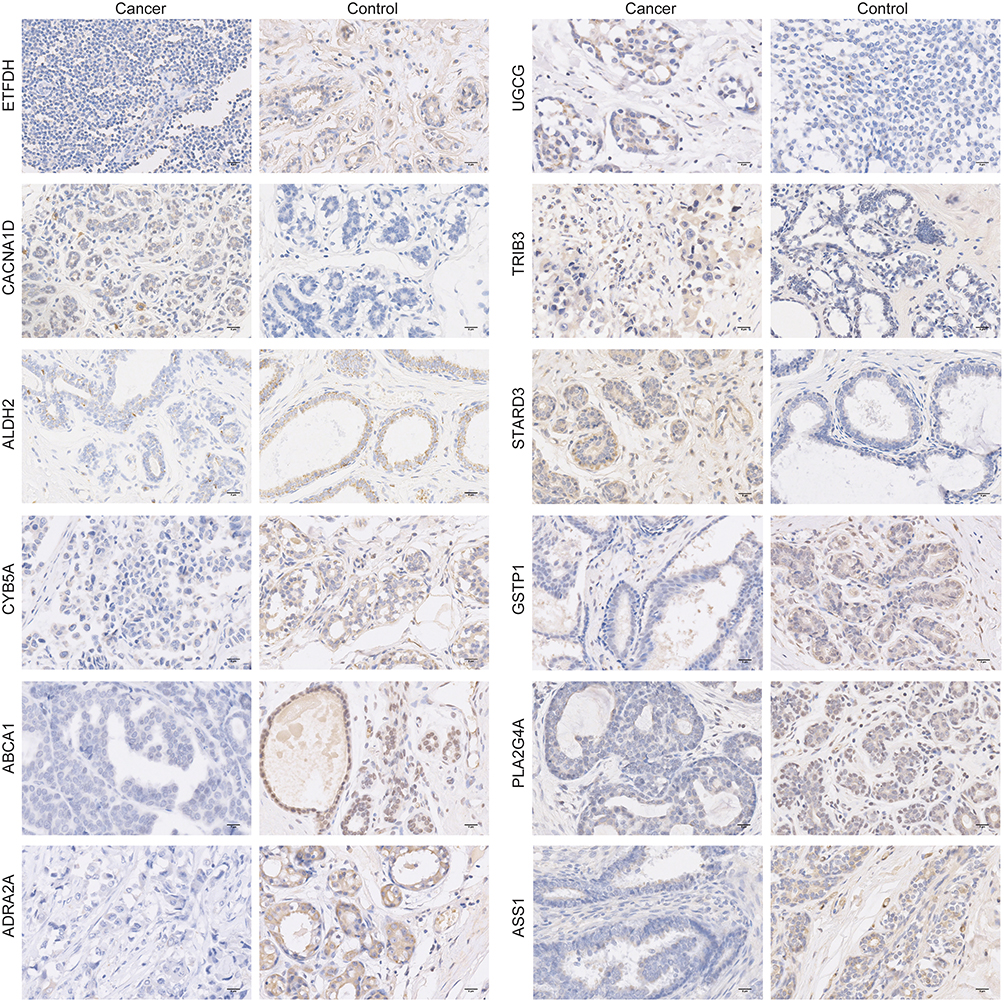 |
Figure 10 Protein expression levels of ETFDH, CACNA1D, ALDH2, CYB5A, ABCA1, ADRA2A, UGCG, TRIB3, STARD3, GSTP1, PLA2G4A and ASS1 in breast cancer tissues detected by immunohistochemistry (400×). |
Discussion
CSCs and metabolic dysregulation are well-recognized as core hallmarks of breast cancer progression. Previous studies have also constructed prognostic models based on CSCs-associated genes and metabolic-associated genes.18,19 However, they were based on only one aspect and did not combine these two aspects for research. Given the complex crosstalk between CSC and metabolic reprogramming, combining the features may have higher predictive ability compared to models based on either aspect alone. Therefore, we conducted a series of analyses based on CSCs and metabolic-associated genes. This study identified 197 candidate key genes by overlapping DEGs with CSCs-associated genes and metabolism-associated genes. Functional enrichment results showed that ECM-receptor interaction and Focal adhesion were important signaling pathways enriched. Notably, ECM-receptor interaction and Focal adhesion play an important role in maintaining CSCs functionality20–22 and regulating metabolic processes.23–25 These results reflect the close crosstalk between CSCs and metabolic dysregulation in the pathological mechanism of breast cancer.
By combining Cox regression analysis with LASSO regression analysis, 12 CSCs and metabolism-associated DEGs associated with breast cancer prognosis were identified from 197 candidate genes, and a prognostic risk score model was constructed based on these 12 CSCs and metabolism-associated DEGs. Based on the median value of the risk score, breast cancer patients were stratified into high- and low-risk groups. Kaplan-Meier analysis revealed that patients in the low-risk group exhibited a significant survival advantage compared with those in the high-risk group. Time-dependent ROC curve analysis showed that the risk score model possessed favorable prognostic predictive accuracy. Moreover, the validation results in other independent datasets showed consistent results with the training set, further confirming the potential clinical application value of the risk score model. Nomogram can be used to predict disease risk or prognosis by combining multiple indicators.26,27 The independent prognostic values of the risk score and lymph node status highlight their pivotal role in breast cancer prognosis prediction. In this study, a nomogram was constructed by integrating these two key factors, which exhibits good excellent survival predictive performance and significant clinical net benefit, which provided a potential practical tool for clinicians to evaluate the prognosis of patients individually.
Differential expression analysis and functional annotation results between the high and low risk groups clearly revealed significant biological differences between the two groups. The E2F family can regulate the proliferation, self-renewal, metastasis and drug resistance of tumor stem cells through various mechanisms.28 Moreover, the E2F score is a marker of breast cancer aggressiveness.29 MYC can promote chemotherapy-resistant breast cancer stem cells through regulation of mitochondrial oxidative phosphorylation.30 mTOR and its related signaling are involved in regulating the cell death of breast cancer stem cells.31 Moreover, the mTOR signaling is also associated with the metabolic reprogramming of breast cancer.32 In this study, GSEA results showed that the HALLMARK_E2F_TARGETS, HALLMARK_MYC_TARGETS_V1 or V2, and HALLMARK_MTORC1_SIGNALING signals were significantly differentially enriched between the high- and low-risk groups. This result further suggests that there are significant differences in the functional characteristics of cancer stem cells and metabolic processes between the two groups, and these differences may be regulated by the above signals. Further exploration of the mechanism of these signals in breast cancer is expected to provide a theoretical basis for the follow-up treatment and management of the disease.
The 12 CSCs and metabolism-associated DEGs composing the risk score model are not only abnormally expressed in breast cancer tissues but also exhibit significant differences between high- and low-risk groups, and are closely associated with breast cancer prognosis. These characteristics collectively highlight the critical regulatory roles of these model genes in breast cancer tumorigenesis and progression. A study has shown that the expression of ETFDH is decreased in gastric cancer tissues and is associated with a poorer overall survival of the patients.33 PLA2G4A can mediate TGF-β-induced epithelial-mesenchymal transition in breast cancer through the PI3k/Akt signaling,34 and also affects the sensitivity of breast cancer to doxorubicin through the ERK and mTOR signaling.35 The expression of the lipid transporter ABCA1 is decreased in human breast cancer tissues,36 and it participates in regulating the metastasis of triple-negative breast cancer.37 ALDH2 is an important prognostic marker for breast cancer,38 and its polymorphisms are closely correlated with breast cancer risk.39 The expression of ADRA2A is significantly correlated with the risk of breast cancer recurrence.40 TRIB3 is overexpressed in breast cancer, maintains breast cancer stemness by activating specific signaling axis (such as the TRIB3-AKT1-FOXO1-SOX2 pathway) to promote cancer initiation and progression.41 CYB5A plays an important role in maintaining the balance of the redox system in cancer cells, with different effects on breast cancer cells of different phenotypes.42 High expression of STARD3 is associated with decreased survival rate of breast cancer patients. Inhibiting its expression can down-regulate the activity of the PI3K/AKT/mTOR pathway and induce apoptosis of MCF-7 cells.43 The Wnt/β-catenin pathway plays an important role in breast cancer progression and breast CSC survival.16 UGCG can regulate therapeutic resistance and disease progression of breast cancer via this pathway.44 Moreover, UGCG also affects the glutamine metabolism of breast cancer cells.45 CACNA1D is abnormally expressed in breast cancer and may play a crucial role in the carcinogenic process and development of BRCA.46 ASS1 also plays a significant role in the progression of breast cancer.47,48 GSTP1 is a predictor for the prognosis and chemotherapy resistance of breast cancer patients.49,50 Collectively, these 12 model genes may exert regulatory effects on the occurrence, progression, and therapeutic response of breast cancer through multiple biological pathways and functional mechanisms.
Multiple immune cell subsets in the tumor microenvironment play critical regulatory roles on the occurrence, progression and metastasis of breast cancer.51 In this study, we analyzed the characteristics of immune cell infiltration between the high- and low-risk groups based on the CIBERSORT algorithm, and the results revealed infiltration differences between the two groups. Additionally, the expression levels of immune checkpoint in the high-risk group were increased, suggesting that the high-risk group may be more prone to immune escape.52 Previous studies have confirmed that macrophages M2 polarization can promote the progression of breast cancer,53,54 while our study found that the infiltration of macrophages M2 was reduced in the high-risk group and was negatively correlated with the risk score. This result may reflect the existence of a unique immunometabolic crosstalk in high-risk breast cancer patients. It is speculated that high-risk tumor cells exhibit remarkably enhanced uptake of key nutrients such as glutamine, which enables them to compete with macrophages M2 for nutritional supplies.55 Glutamine is an essential metabolic substrate for macrophage M2 polarization, and the specific regulatory mechanisms remain to be further investigated. Drug sensitivity prediction showed high-risk patients were more sensitive to conventional chemotherapeutics including docetaxel and paclitaxel. These findings suggest potential differential drug responses between risk subgroups, which may provide a basis for personalized treatment stratification. Nevertheless, this conclusion is merely an in silico observational result from public dataset analysis, and further large-scale prospective clinical validation is urgently required before its reliable clinical application.
However, this study inevitably has certain limitations. Firstly, this model was constructed based on public datasets and has not been validated in clinical samples. Thus, large-sample clinical samples need to be collected for targeted validation studies in the follow-up. Secondly, the specific molecular mechanism of the identified model genes in breast cancer still requires further investigation. In the future, systematic research will be carried out through large-scale in vivo and in vitro experiments. In conclusion, this study developed a novel CSCs and metabolism-associated prognostic model that effectively stratifies breast cancer patients into high- and low-risk groups. This model lays a foundation for the personalized therapeutic stratification of breast cancer and is crucial for improving the prognosis of breast cancer patients.
Data Sharing Statement
The datasets analysed during the current study are available in the GEO, UCSC Xena, cBioPartal databases. The permanent access links to these databases are https://www.ncbi.nlm.nih.gov/geo/, https://xena.ucsc.edu/, and https://www.cbioportal.org/study/summary?id=brca_metabric, respectively. Accession numbers of the datasets used in the current study are GSE42568, GSE7390, TCGA-BRCA, and brca_metabric.
Ethics Approval and Informed Consent
This study was approved by the Ethics Committee of 3201 Hospital (2025-006). This study complied with the Declaration of Helsinki. Written informed consent was obtained from all participants.
Funding
This study was funded by the “Shaanxi Province Health High-level Talents (Team) Cultivation Plan (2024-TD-012)”.
Disclosure
Wanjun Li and Shuo Li are co-first authors for this study. The authors declare no competing interests in this work.
References
1. Katsura C, Ogunmwonyi I, Kankam HK, Saha S. Breast cancer: presentation, investigation and management. Br J Hosp Med. 2022;83(2):1–19. doi:10.12968/hmed.2021.0459
2. Xiong X, Zheng LW, Ding Y, et al. Breast cancer: pathogenesis and treatments. Signal Trans Target Ther. 2025;10(1):49. doi:10.1038/s41392-024-02108-4
3. Zou Y, Wu J, Yuan Z, He X, Tang H. Targeting the neuro-immune crosstalk in breast cancer brain metastases. J Immunother Cancer. 2026;14(4):e014134. doi:10.1136/jitc-2025-014134
4. Luo Y, Tian W, Zhu X, et al. piR-1170 drives brain metastasis and immune evasion via WTAP-mediated m6A methylation reprogramming in triple-negative breast cancer. Mol Cancer. 2026;25(1). doi:10.1186/s12943-026-02568-y
5. Duan F, Zhang C, Wu Z, et al. Copper orchestrates triple-negative breast cancer progression via the STEAP3-dependent CDK16-JAK1 activation. Cancer Lett. 2026;639:218192. doi:10.1016/j.canlet.2025.218192
6. Akram M, Iqbal M, Daniyal M, Khan AU. Awareness and current knowledge of breast cancer. Biol Res. 2017;50(1):33. doi:10.1186/s40659-017-0140-9
7. Fu J, Chen R, Zhang Z, Zhao J, Xia T. An inflammatory-related genes signature based model for prognosis prediction in breast cancer. Oncol Res. 2023;31(2):157–167. doi:10.32604/or.2023.027972
8. Reya T, Morrison SJ, Clarke MF, Weissman IL. Stem cells, cancer, and cancer stem cells. Nature. 2001;414(6859):105–111. doi:10.1038/35102167
9. Biserova K, Jakovlevs A, Uljanovs R, Strumfa I. Cancer stem cells: significance in origin, pathogenesis and treatment of glioblastoma. Cells. 2021;10(3). doi:10.3390/cells10030621
10. Gramatiuk SM, Bagmut IY, Sheremet MI, Maksymyuk VV, Tarabanchuk VV, Moroz PV. The diverse metabolic heterogeneity of stem cells in a BRCA±breast cancer population. J Med Life. 2021;14(3):331–336. doi:10.25122/jml-2020-0105
11. Pinto CA, Widodo E, Waltham M, Thompson EW. Breast cancer stem cells and epithelial mesenchymal plasticity - Implications for chemoresistance. Cancer Lett. 2013;341(1):56–62. doi:10.1016/j.canlet.2013.06.003
12. Pavlova NN, Thompson CB. The emerging hallmarks of cancer metabolism. Cell Metab. 2016;23(1):27–47. doi:10.1016/j.cmet.2015.12.006
13. Yoshida GJ. Metabolic reprogramming: the emerging concept and associated therapeutic strategies. J Exp Clin Cancer Res. 2015;34(1):111. doi:10.1186/s13046-015-0221-y
14. Daniel Y, Lelou E, Aninat C, Corlu A, Cabillic F. Interplay between metabolism reprogramming and epithelial-to-mesenchymal transition in cancer stem cells. Cancers. 2021;13(8). doi:10.3390/cancers13081973
15. Yan L, Wu M, Wang T. Breast cancer stem cells secrete MIF to mediate tumor metabolic reprogramming that drives immune evasion. Cancer Res. 2024;84(8):1270–1285. doi:10.1158/0008-5472.can-23-2390
16. El-Sahli S, Wang L. Cancer stem cell-associated pathways in the metabolic reprogramming of breast cancer. Int J Mol Sci. 2020;21(23). doi:10.3390/ijms21239125
17. Yang X, Yang X, Tang H, Chen X, Wang J, Zhao H. Characterization of stem cell landscape and identification of stemness-relevant prognostic gene signature to aid immunotherapy in breast cancer. Discov Oncol. 2025;16(1):9. doi:10.1007/s12672-025-01742-w
18. Su D, Wang S, Xi Q, et al. Prognostic and predictive value of a metabolic risk score model in breast cancer: an immunogenomic landscape analysis. Briefings Funct Genomics. 2022;21(2):128–141. doi:10.1093/bfgp/elab040
19. Hu H, Zou M, Hu H. A breast cancer classification and immune landscape analysis based on cancer stem-cell-related risk panel. NPJ Precision Oncol. 2023;7(1):130. doi:10.1038/s41698-023-00482-w
20. Mao X, Zhang X, Zheng X, Chen Y, Xuan Z, Huang P. Curcumin suppresses LGR5(+) colorectal cancer stem cells by inducing autophagy and via repressing TFAP2A-mediated ECM pathway. J Nat Med. 2021;75(3):590–601. doi:10.1007/s11418-021-01505-1
21. Liu CL, Chen YJ, Fan MH, Liao YJ, Mao TL. Characteristics of CD133-sustained chemoresistant cancer stem-like cells in human ovarian carcinoma. Int J Mol Sci. 2020;21(18). doi:10.3390/ijms21186467
22. Luo M, Fan H, Nagy T, et al. Mammary epithelial-specific ablation of the focal adhesion kinase suppresses mammary tumorigenesis by affecting mammary cancer stem/progenitor cells. Cancer Res. 2009;69(2):466–474. doi:10.1158/0008-5472.can-08-3078
23. Lee HJ, Jang M, Kim H, et al. Comparative transcriptome analysis of adipose tissues reveals that ECM-receptor interaction is involved in the depot-specific adipogenesis in cattle. PLoS One. 2013;8(6):e66267. doi:10.1371/journal.pone.0066267
24. Rondas D, Tomas A, Soto-Ribeiro M, Wehrle-Haller B, Halban PA. Novel mechanistic link between focal adhesion remodeling and glucose-stimulated insulin secretion. J Biol Chem. 2012;287(4):2423–2436. doi:10.1074/jbc.M111.279885
25. Matrullo G, Filomeni G, Rizza S. Redox regulation of focal adhesions. Redox Biol. 2025;80:103514. doi:10.1016/j.redox.2025.103514
26. Chen Q, Hu L, Chen K. Construction of a nomogram based on a hypoxia-related lncRNA signature to improve the prediction of gastric cancer prognosis. Front Genet. 2020;11:570325. doi:10.3389/fgene.2020.570325
27. Liu Y, Wu L, Ao H, et al. Prognostic implications of autophagy-associated gene signatures in non-small cell lung cancer. Aging. 2019;11(23):11440–11462. doi:10.18632/aging.102544
28. Xie D, Pei Q, Li J, Wan X, Ye T. Emerging role of E2F family in cancer stem cells. Front Oncol. 2021;11:723137. doi:10.3389/fonc.2021.723137
29. Oshi M, Takahashi H. The E2F pathway score as a predictive biomarker of response to neoadjuvant therapy in ER+/HER2. Breast Cancer. 2020;9(7):1643. doi:10.3390/cells9071643
30. Lee KM, Giltnane JM, Balko JM, et al. MYC and MCL1 cooperatively promote chemotherapy-resistant breast cancer stem cells via regulation of mitochondrial oxidative phosphorylation. Cell Metab. 2017;26(4):633–647.e637. doi:10.1016/j.cmet.2017.09.009
31. Prabhu KS, Mariyam Z, Rahman SA, et al. Targeting mTOR and its associated signaling to induce cell death in breast cancer stem cells. Cell Biol Int. 2025;49(11):1493–1506. doi:10.1002/cbin.70071
32. Golden E, Rashwan R, Woodward EA, Sgro A, Wang E, Sorolla A. The oncogene AAMDC links PI3K-AKT-mTOR signaling with metabolic reprograming in estrogen receptor-positive breast cancer. Nat Commun. 2021;12(1):1920. doi:10.1038/s41467-021-22101-7
33. Wu Y, Zhang X, Shen R, et al. Expression and significance of ETFDH in hepatocellular carcinoma. Pathol Res Pract. 2019;215(12):152702. doi:10.1016/j.prp.2019.152702
34. Chen L, Fu H, Luo Y, et al. cPLA2α mediates TGF-β-induced epithelial-mesenchymal transition in breast cancer through PI3k/Akt signaling. Cell Death Dis. 2017;8(4):e2728. doi:10.1038/cddis.2017.152
35. Li Z, Qu M, Sun Y, et al. Blockage of cytosolic phospholipase A2 alpha sensitizes aggressive breast cancer to doxorubicin through suppressing ERK and mTOR kinases. Biochem Biophys Res Commun. 2018;496(1):153–158. doi:10.1016/j.bbrc.2018.01.016
36. Schimanski S, Wild PJ, Treeck O, et al. Expression of the lipid transporters ABCA3 and ABCA1 is diminished in human breast cancer tissue. Horm Metab Res. 2010;42(2):102–109. doi:10.1055/s-0029-1241859
37. Wang Y, Zhou X, Lei Y, et al. NNMT contributes to high metastasis of triple negative breast cancer by enhancing PP2A/MEK/ERK/c-Jun/ABCA1 pathway mediated membrane fluidity. Cancer Lett. 2022;547:215884. doi:10.1016/j.canlet.2022.215884
38. Han Y, Fu Y, Shi Q, et al. The ALDH2, IGSF9, and PRDM16 proteins as predictive biomarkers for prognosis in breast cancer. Clin Breast Cancer. 2023;23(3):e140–e150. doi:10.1016/j.clbc.2022.12.009
39. Ugai T, Milne RL, Ito H. The functional ALDH2 polymorphism is associated with breast cancer risk: a pooled analysis from the breast cancer association consortium. Mol Genetics Genomic Med. 2019;7(6):e707. doi:10.1002/mgg3.707
40. Shkurnikov MY, Galatenko VV, Lebedev AE, Podol’skii VE, Tonevitskii EA, Mal’tseva DV. On statistical relationship between ADRA2A expression and the risk of breast cancer relapse. Bull Exp Biol Med. 2014;157(4):454–458. doi:10.1007/s10517-014-2589-7
41. Yu JM, Sun W, Wang ZH, Liang X, Hua F. TRIB3 supports breast cancer stemness by suppressing FOXO1 degradation and enhancing SOX2 transcription. Nat Commun. 2019;10(1):5720. doi:10.1038/s41467-019-13700-6
42. Tong XY, Yang XZ, Gao SQ, Wang XJ, Wen GB, Lin YW. Regulating effect of cytochrome b(5) overexpression on human breast cancer cells. Molecules. 2022;27(14). doi:10.3390/molecules27144556
43. Korucu AN, Inandiklioglu N. Is STARD3 A new biomarker for breast cancer? European J Breast Health. 2024;20(2):89–93. doi:10.4274/ejbh.galenos.2024.2024-1-7
44. Long L, Wang L, Liang Y, et al. UGCG promotes chemoresistance and breast cancer progression via NF-κB and Wnt/β-catenin pathway activation. Transl Oncol. 2025;52:102241. doi:10.1016/j.tranon.2024.102241
45. Schömel N, Hancock SE, Gruber L. UGCG influences glutamine metabolism of breast cancer cells. Scientific Reports. 2019;9(1):15665. doi:10.1038/s41598-019-52169-7
46. Ouyang Y, Lu W, Wang Y, et al. Integrated analysis of mRNA and extrachromosomal circular DNA profiles to identify the potential mRNA biomarkers in breast cancer. Gene. 2023;857:147174. doi:10.1016/j.gene.2023.147174
47. Luo W, Zou Z, Nie Y, et al. ASS1 inhibits triple-negative breast cancer by regulating PHGDH stability and de novo serine synthesis. Cell Death Dis. 2024;15(5):319. doi:10.1038/s41419-024-06672-z
48. Liu M, Li R, Wang M, et al. PGAM1 regulation of ASS1 contributes to the progression of breast cancer through the cAMP/AMPK/CEBPB pathway. Mol Oncol. 2022;16(15):2843–2860. doi:10.1002/1878-0261.13259
49. Yang SJ, Wang DD, Li J, et al. Predictive role of GSTP1-containing exosomes in chemotherapy-resistant breast cancer. Gene. 2017;623:5–14. doi:10.1016/j.gene.2017.04.031
50. Chen G, Zhang H, Sun L, et al. Prognostic significance of GSTP1 in patients with triple negative breast cancer. Oncotarget. 2017;8(40):68675–68680. doi:10.18632/oncotarget.19824
51. Otterlei Fjørtoft M, Huse K, Rye IH. The tumor immune microenvironment in breast cancer progression. Acta Oncol. 2024;63:359–367. doi:10.2340/1651-226x.2024.33008
52. Gordon SR, Maute RL, Dulken BW, et al. PD-1 expression by tumour-associated macrophages inhibits phagocytosis and tumour immunity. Nature. 2017;545(7655):495–499. doi:10.1038/nature22396
53. Mu X, Shi W, Xu Y, et al. Tumor-derived lactate induces M2 macrophage polarization via the activation of the ERK/STAT3 signaling pathway in breast cancer. Cell Cycle. 2018;17(4):428–438. doi:10.1080/15384101.2018.1444305
54. Li J, Liu Z, Wu X, et al. Anti-metastatic effects of AGS-30 on breast cancer through the inhibition of M2-like macrophage polarization. Biomed Pharmacother. 2024;172:116269. doi:10.1016/j.biopha.2024.116269
55. Cui J, Yan X, Song J. Glutamine metabolism remodels tumor-associated macrophage: mechanistic explorations and new strategies in translational medicine. Front Immunol. 2025;16:1715170. doi:10.3389/fimmu.2025.1715170
 © 2026 The Author(s). This work is published and licensed by Dove Medical Press Limited. The
full terms of this license are available at https://www.dovepress.com/terms
and incorporate the Creative Commons Attribution
- Non Commercial (unported, 4.0) License.
By accessing the work you hereby accept the Terms. Non-commercial uses of the work are permitted
without any further permission from Dove Medical Press Limited, provided the work is properly
attributed. For permission for commercial use of this work, please see paragraphs 4.2 and 5 of our Terms.
© 2026 The Author(s). This work is published and licensed by Dove Medical Press Limited. The
full terms of this license are available at https://www.dovepress.com/terms
and incorporate the Creative Commons Attribution
- Non Commercial (unported, 4.0) License.
By accessing the work you hereby accept the Terms. Non-commercial uses of the work are permitted
without any further permission from Dove Medical Press Limited, provided the work is properly
attributed. For permission for commercial use of this work, please see paragraphs 4.2 and 5 of our Terms.
Recommended articles
A Novel lncRNA Panel for Risk Stratification and Immune Landscape in Breast Cancer Patients

Li C, Wang X, Chen T, Li W, Yang Q
International Journal of General Medicine 2022, 15:5253-5272
Published Date: 27 May 2022
Establishment and Validation of a Model for Disease-Free Survival Rate Prediction Using the Combination of microRNA-381 and Clinical Indicators in Patients with Breast Cancer
Shen J, Wang M, Li F, Yan H, Wang R, Zhou J
Breast Cancer: Targets and Therapy 2022, 14:375-389
Published Date: 30 November 2022
Chromobox Family Proteins as Putative Biomarkers for Breast Cancer Management: A Preliminary Study Based on Bioinformatics Analysis and qRT-PCR Validation
Tian H, Zhao T, Li Y, Sun N, Ma D, Shi Q, Zhang G, Chen Q, Zhang K, Chen C, Zhang Y, Qi X
Breast Cancer: Targets and Therapy 2022, 14:515-535
Published Date: 30 December 2022
Prognostic Significance of Preoperative Lactate Dehydrogenase to Albumin Ratio in Breast Cancer: A Retrospective Study
He J, Tong L, Wu P, Wu Y, Shi W, Chen L
International Journal of General Medicine 2023, 16:507-514
Published Date: 8 February 2023
The Prognostic Role of HuR Varies Between Different Subtypes of Breast Cancer Patients: Data Mining and Retrospective Analysis
Liao Y, Liao Y, Li J, Li Y, Fan Y
Breast Cancer: Targets and Therapy 2023, 15:135-146
Published Date: 11 February 2023