Back to Journals » Journal of Inflammation Research » Volume 19
Mitochondrial Hub Genes in Rheumatoid Arthritis Identified by Machine Learning and Mendelian Randomization with Experimental Validation
Authors Luo X, Dong Z, Song Y, Hu J, Liao S, Ding X ![]()
Received 29 October 2025
Accepted for publication 15 March 2026
Published 27 March 2026 Volume 2026:19 576901
DOI https://doi.org/10.2147/JIR.S576901
Checked for plagiarism Yes
Review by Single anonymous peer review
Peer reviewer comments 2
Editor who approved publication: Dr Ujjwol Risal
Xiaolin Luo,1,* Zhuqing Dong,2,* Yuansong Song,1 Jianwei Hu,1 Shijie Liao,1,2 Xiaofei Ding1
1The First Affiliated Hospital of Guangxi Medical University, Nanning, People’s Republic of China; 2Collaborative Innovation Centre of Regenerative Medicine and Medical Bioresource Development and Application Co-Constructed by the Province and Ministry, Guangxi Medical University, Nanning, People’s Republic of China
*These authors contributed equally to this work
Correspondence: Shijie Liao, Email [email protected] Xiaofei Ding, Email [email protected]
Background: Rheumatoid arthritis (RA) has complex pathological mechanisms, and mitochondria are critical to its occurrence and development while the specific mechanisms remain unclear. This study aimed to identify key mitochondria-related genes in RA via machine learning, validate them by two-sample Mendelian randomization (MR), and provide novel therapeutic target clues.
Methods: RA-associated gene microarray datasets from GEO were curated by R software. Differential expression profiling, LASSO regression, SVM classification and RF modeling were used to screen hub genes and build diagnostic models. GO, KEGG and Metascape analyses clarified their biological roles, and immune infiltration profiling and consensus clustering were performed for immune heterogeneity analysis. MR analysis identified core genes linked to RA susceptibility, followed by drug enrichment and molecular docking. A preliminary RT-qPCR validation was conducted on synovial tissues from a small cohort of 3 RA patients and 3 controls.
Results: A total of 1,432 differentially expressed genes (DEGs) were identified, and six mitochondria-related hub genes (UCP2, BCL2A1, FASN, AKR1B10, IFI27, PDK1) were screened by machine learning. The diagnostic model based on these genes had good discriminatory ability. MR analysis confirmed a causal relationship between BCL2A1 and RA, suggesting it as a potential risk factor. Drug enrichment and molecular docking showed these hub genes could bind to candidate drugs, and the exploratory RT-qPCR assay initially validated the bioinformatics findings. Leave-one-out sensitivity analysis confirmed that the RT-qPCR results exhibited good stability.
Conclusion: Bioinformatics analysis identified UCP2, BCL2A1, FASN, AKR1B10, IFI27, and PDK1 as potential mitochondria-related diagnostic biomarkers for RA and established a corresponding diagnostic model. MR analysis showed a causal relationship between BCL2A1 and RA, indicating that BCL2A1 serves as a risk factor for the disease.
Keywords: rheumatoid arthritis, machine learning, Mendelian randomization, biomarkers, molecular docking
Introduction
Rheumatoid arthritis (RA) is a type of pervasive autoimmune inflammation, with a roughly 1% global prevalence, characterized by progressive cartilage degradation and articular damage that may culminate in disability.1 Its pathological mechanisms are highly complex, involving intricate interactions among genetic, environmental, and immune factors. Emerging evidence has highlighted the critical involvement of mitochondria in RA pathogenesis, linking mitochondrial dysfunction to disease initiation and progression.2,3 As a key node in cellular bioenergetic metabolism, mitochondrial dysfunction impairs the viability, activation, and differentiation of immune and non-immune cell subsets implicated linked to RA development, thereby facilitating RA progression.4 For example, BCL2A1, as a key regulator of the mitochondrial intrinsic apoptosis pathway, is significantly induced in myeloid cells under inflammatory stimulation. By inhibiting myeloid cell apoptosis, maintaining the local chronic inflammatory microenvironment in joints, and promoting bone resorption, this gene participates in the pathological progression of rheumatoid arthritis.5 Against this backdrop, there is a critical need to elucidate the roles of mitochondria-related genes in RA pathogenesis and pursue novel therapeutic breakthroughs.
Over recent years, machine learning approaches have been extensively applied in multiple diseases, significantly improving the efficiency of screening key genes. Diagnostic models constructed based on the screened feature genes provide convenience for clinicians.6,7 Additionally, Mendelian randomization, as a causal inference method, can effectively avoid the bias of traditional observational studies and provide more reliable evidence for the causal relationship between genes and diseases.8
This study aims to systematically screen and identify RA-associated mitochondria-related hub genes via machine learning approaches, construct a diagnostic model, subsequently validate the causal effects between core genes and RA using two-sample MR analysis, and perform drug enrichment analysis and molecular docking to identify potential therapeutic targets. Our research will provide novel mitochondria-related targets for understanding RA pathogenesis and lay a foundation for genetic evidence-based precision treatment strategies.
Methods
Data Source
Transcriptomic data for GSE1919,9 GSE55235,10 GSE55457,10 and GSE7729811 were downloaded from the GEO database (https://www.ncbi.nlm.nih.gov/geo/) as the training set for model construction. This dataset included 44 rheumatoid arthritis (RA) synovial tissue samples and 42 control synovial tissue samples. Additionally, transcriptomic data from GSE9327212—comprising 229 RA peripheral blood samples and 46 control peripheral blood samples—were downloaded as the validation set for model verification. Raw data downloaded from the GEO database were processed using R language and its limma package. First, the raw gene expression matrix was read and converted into a matrix format, and the avereps() function was applied to merge the expression values of multiple probes mapping to the same gene. Subsequently, quantile analysis was performed to determine the necessity of log2 transformation, followed by inter-array normalization using the normalize Between Arrays() function. Finally, sample information files of the control group and RA group were read to extract and integrate the expression data of the two groups for subsequent analyses. Mitochondrial-associated key genes were derived from the Mitocarta 3.0 database,13 which compiles 1,136 human genes with stringently validated mitochondrial targeting annotations. These annotations were comprehensively determined by integrating multi-dimensional techniques, including proteomic analysis, computational modeling, and microscopic observation, ensuring high scientific credibility.
Batch Correction and Differential Expression Analysis
The SVA package in R was employed to perform batch correction on the gene expression matrix of the training dataset, aiming to eliminate confounding factors such as sequencing batches and platforms. Subsequently, principal component analysis (PCA) was conducted to generate scatter plots of sample distributions before and after correction. DEGs between RA and control groups were identified via the Limma package, with criteria defined as adjusted p-value < 0.05 and |logFC| > 0.5. Volcano plots of DEGs were produced using the ggplot2 package. An intersection analysis was performed between the identified DEGs and mitochondrial genes to identify DEGs specifically associated with mitochondrial functions and processes.
Enrichment Analysis
To characterize the functional divergences between RA and control groups in pivotal biological pathways, Gene Set Enrichment Analysis (GSEA) was implemented. Subsequently, to investigate the biological functions of DEGs specifically associated with mitochondria, GO and KEGG enrichment analyses were conducted and visualized, with significant pathways retained at a threshold of p < 0.05. Additionally, the Metascape database (http://metascape.org) was utilized to perform enrichment analysis on these differentially expressed gene sets, with biological pathways retained at a significance threshold of p < 0.05.
Integrative Machine Learning Approaches to Identify Hub Genes
The glmnet package was employed to conduct LASSO regression on mitochondria-associated DEGs. Through this analysis, genes matching the minimal λ value were designated as hub genes. Subsequently, the e1071 package was employed to construct a SVM-RFE model for mitochondria-related DEGs, where the gene count associated with the minimum cross-validation error was designated as hub genes identified by SVM-RFE. For random forest analysis, the randomForest package was used to analyze mitochondria-related DEGs with ntree set to 500, and genes with importance scores >1 were selected as hub genes from this method. Finally, the hub genes obtained from machine learning approaches were intersected to derive the final set of hub genes.
Diagnostic Model Construction and Validation
The rms package was leveraged to construct a diagnostic model using the identified hub genes, which was then converted into a nomogram for subsequent analysis and validation. A calibration analysis was performed using the calibrate function to generate a calibration curve. The clinical utility of the model was evaluated using the rmda package, which generated decision curves to quantify net benefit across a range of clinical thresholds. Subsequently, the pROC package was applied to assess the area under the curve (AUC) values of hub genes and the model in training set samples, and to validate the AUC value of the model in the GSE93272 dataset.
Immune Infiltration Analysis and Hub Gene-Based Classification
Immune cell infiltration was analyzed using the Cibersort algorithm.14 Bar plots were constructed to depict the abundance of immune cells, while boxplots were employed to assess differences in immune cell proportions between RA and control groups. Correlation plots depicting interactions among immune cells and associations between hub genes and immune cells were created using the Corrplot package. Subsequently, clustering analysis was performed based on hub gene expression levels. The analysis was conducted by setting the maximum number of clusters to 9 and repeating the clustering process 50 times.
Mendelian Randomization
Single-nucleotide polymorphisms (SNPs) were employed as instrumental variables, and two-sample MR analysis was conducted to elucidate causal associations between candidate genes and RA. Dataset acquisitions were derived from the publicly available deCODE database (https://www.decode.com) and FinnGen database (https://www.finngen.fi/en). The TwoSampleMR package was employed for analysis, with five methods—including the inverse-variance weighting (IVW) method—used to evaluate associations between feature genes and RA risk. Heterogeneity detection, horizontal pleiotropy detection, and sensitivity analysis were conducted to confirm the robustness of results. Feature genes were retained only if they met the following criteria simultaneously: effect size P < 0.05 by the IVW method, consistent effect directions across all five MR methods, no significant horizontal pleiotropy, and consistency with the direction of differential gene expression.
Drug Enrichment Analysis and Molecular Docking
Drug data were downloaded from the DSigDB database15 for drug enrichment analysis of hub genes. Bar charts and network diagrams were generated to visualize the enrichment counts and interactions between drugs and genes. Three-dimensional conformations of pharmacologic compounds were retrieved from the PubChem database (https://pubchem.ncbi.nlm.nih.gov/), whereas crystallographic protein structures of target genes were acquired from the RCSB Protein Data Bank (https://www.rcsb.org/). Molecular docking of drug-protein interactions was performed using the CB-Dock2 platform.16
Sample Collection and Real-Time Quantitative PCR Assay (RT-qPCR)
This study was conducted in accordance with the Declaration of Helsinki. This study was approved by the Ethics Committee of The First Affiliated Hospital of Guangxi Medical University, and all patients signed informed consent forms. Synovial tissues were collected from 3 RA patients who underwent arthroscopic surgery and 3 patients who received arthroscopic surgery due to traumatic anterior cruciate ligament tear (with detailed information provided in Table 1). The synovial tissues were snap-frozen in liquid nitrogen and then ground. Total RNA was extracted using the Omega RNA extraction kit, and subsequently reverse-transcribed into cDNA using a reverse transcription kit (Thermo Fisher, USA). Quantitative polymerase chain reaction was performed on a PCR instrument (Roche, Germany). GAPDH was used for normalizing Ct values. Gene expression levels were calculated using the 2-ΔΔCq method, followed by t-test or non-parametric test using GraphPad Prism 10 software. A P value < 0.05 was considered statistically significant. Related primer sequences are listed in Table 2. To verify the stability of gene expression difference results with the small sample size, we conducted a leave-one-out sensitivity analysis: each of the six synovial tissue samples was sequentially excluded, and the remaining five samples were used to recalculate the mean FC of gene expression between the RA and control groups. We analyzed the consistency of FC up-/down-regulation trends before and after exclusion and calculated the CV of FC values across multiple iterations to evaluate result stability.
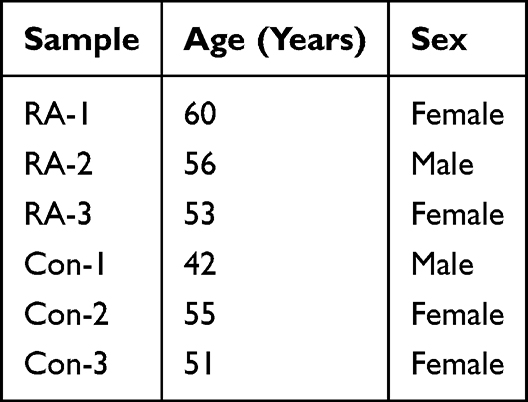 |
Table 1 Sample Details |
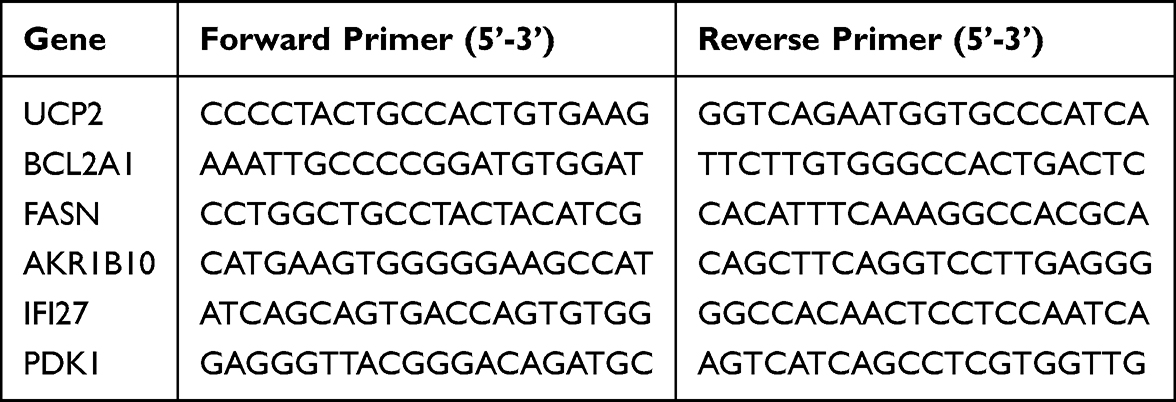 |
Table 2 The Primer Sequences Used in Quantitative Polymerase Chain Reaction |
Result
Mitochondria-Related DEG in RA
Batch correction was performed on the training set datasets (Figure 1A and B). A total of 1,432 DEGs were identified, comprising 812 upregulated and 620 downregulated (Figure 1C). Through intersection analysis of these DEGs with mitochondrial gene sets from the Mitocarta 3.0 database, 39 mitochondrial DEGs were successfully identified (Figure 1D).
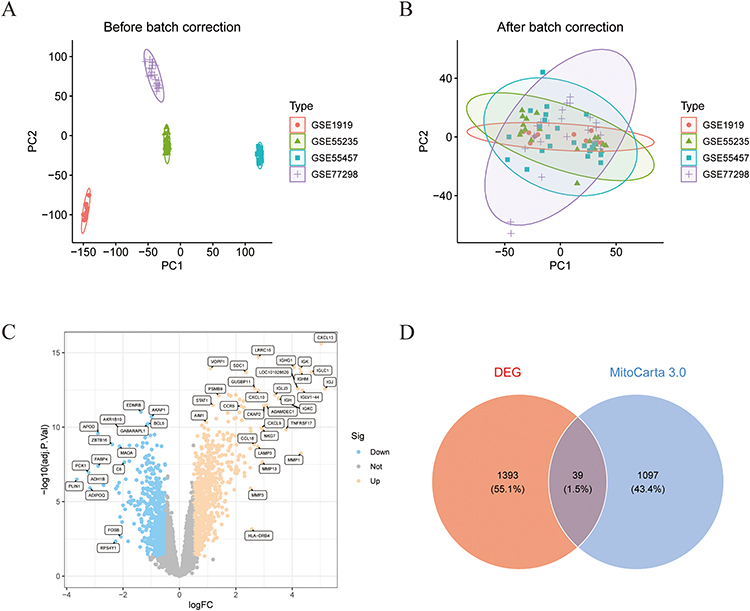 |
Figure 1 Screening of mitochondria-related DEGs. (A and B) PCA results before and after batch correction for GSE1919, GSE55235, GSE55457, and GSE77298 datasets. (C) Volcano plot of DEGs in RA. (D) Identification of mitochondria-related DEGs. |
Enrichment Analysis
GSEA was performed on RA and control groups, with enrichment analysis showing that the RA group was predominantly positively enriched in cell adhesion molecule pathways, chemokine signaling pathways, and cytokine-cytokine receptor interaction pathways (Figure 2A). The control group exhibited negative enrichment primarily in adipocytokine signaling pathways, insulin signaling pathways, etc. (Figure 2B). Subsequently, GO analysis revealed significant enrichment in biological processes (BP) such as small molecule catabolic processes and organic acid catabolism, cellular components (CC) including mitochondrial outer membrane and respiratory chain complex IV, and molecular functions (MF) related to oxidoreductase activity (Figure 2C). KEGG enrichment was observed in metabolic pathways such as fatty acid biosynthesis, fatty acid metabolism, and the AMPK signaling pathway (Figure 2E). Enrichment analysis of these genes in Metascape similarly indicated clustering in metabolic processes and mitochondria-related pathways (Figure 2D).
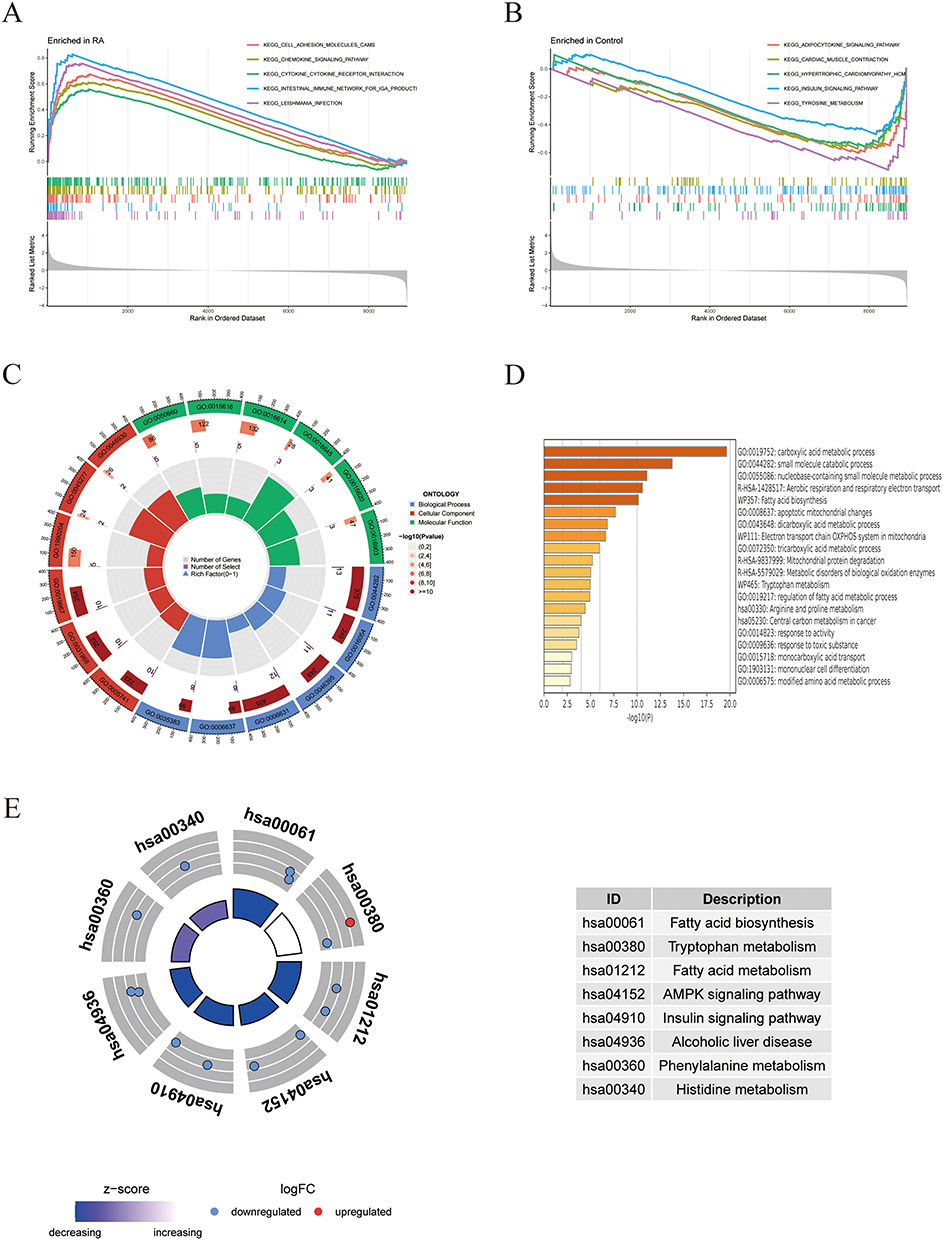 |
Figure 2 Enrichment analysis. (A and B) GSEA was performed between RA group and the control group. (C) GO enrichment analysis was conducted on mitochondria-related DEGs. (D) Metascape enrichment analysis of mitochondria-related DEGs. (E) KEGG enrichment analysis of mitochondria-related DEGs. |
Identification of Potential Biomarkers and Construction of Diagnostic Model for RA
LASSO regression analysis was performed on mitochondria-related DEGs, yielding 9 potential hub genes at the minimum cross-validation error (Figure 3A and B). Subsequently, SVM-RFE analysis identified 8 genes with the lowest cross-validation error and highest accuracy (Figure 3C and D). Finally, Random Forest analysis ranked genes by importance score, and 9 genes with scores >1 were selected (Figure 3E and F). The intersection of genes from these three machine learning methods revealed 6 mitochondria-related hub genes: UCP2, BCL2A1, FASN, AKR1B10, IFI27, and PDK1 (Figure 3G), whose chromosomal locations were visualized (Figure 3H). A diagnostic model for RA was constructed using logistic regression based on these 6 hub genes (Figure 4A). Risk scores were calculated from the expression levels of these core biomarkers and mapped to disease probability. ROC analysis of the hub genes revealed that biomarkers such as AKR1B10 (AUC=0.910) and UCP2 (AUC=0.900) exhibited excellent discriminative capabilities (Figure 4B). The ROC curve of the integrated model showed a high AUC of 0.976 (95% CI: 0.859–1.000) (Figure 4C). The calibration curve demonstrated that the bias-corrected curve closely approximated the ideal diagonal line, confirming a high consistency between the model-predicted disease probabilities and actual outcomes (Figure 4D). DCA supported its practical value in clinical decision-making (Figure 4E). The model was externally validated in the independent dataset GSE93272, where ROC analysis yielded an AUC of 0.709, confirming the model’s generalizability across different cohorts and enhancing its credibility for clinical applications (Figure 4F). The expression levels of hub genes in the training set are shown in Figure 4G, and cross-validation in the external dataset GSE93272 confirmed consistent expression trends for AKR1B10, FASN, IFI27, and BCL2A1, with significant differences in expression levels (Figure 4H).
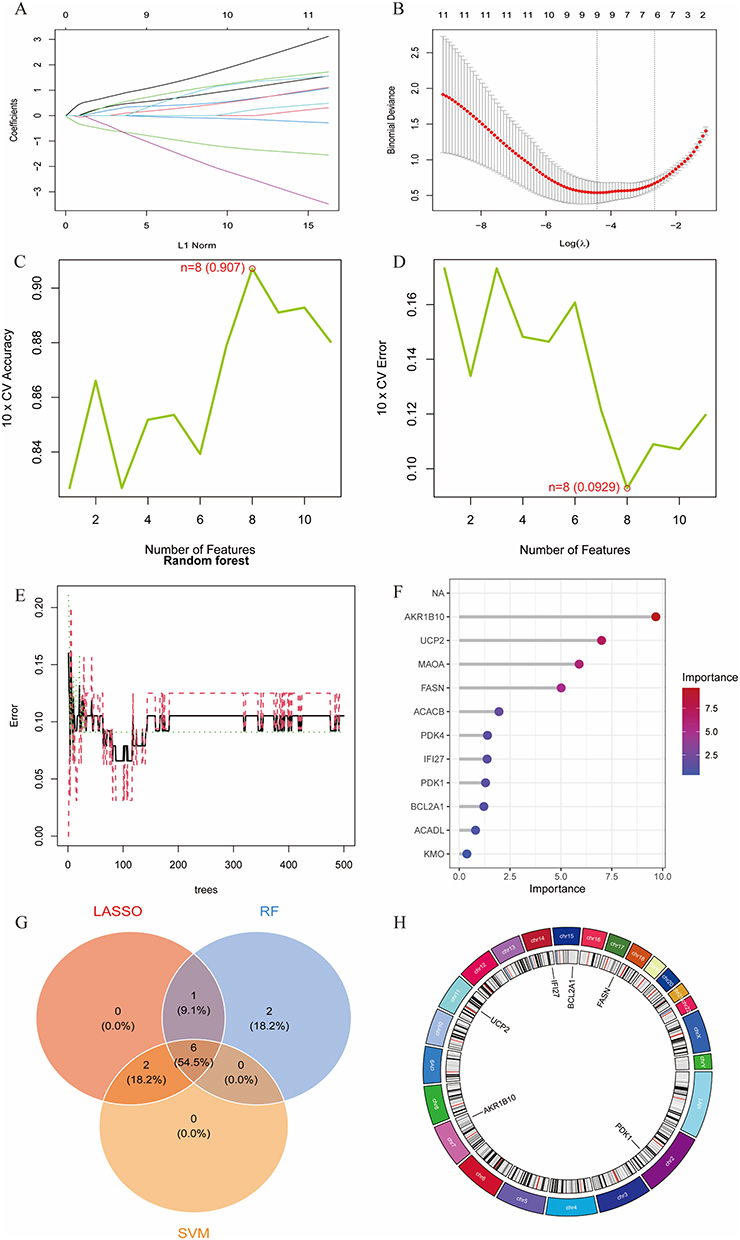 |
Figure 3 Identification of mitochondria-related hub genes for RA using machine learning. (A and B) LASSO regression model identified 9 potential genes. (C and D) SVM-RFE analysis yielded 8 genes. (E and F) Random Forest analysis screened 9 genes. (G) Intersection of genes from three machine learning methods identified mitochondria-related hub genes for RA. (H) Circular visualization of chromosomal locations of the hub genes. |
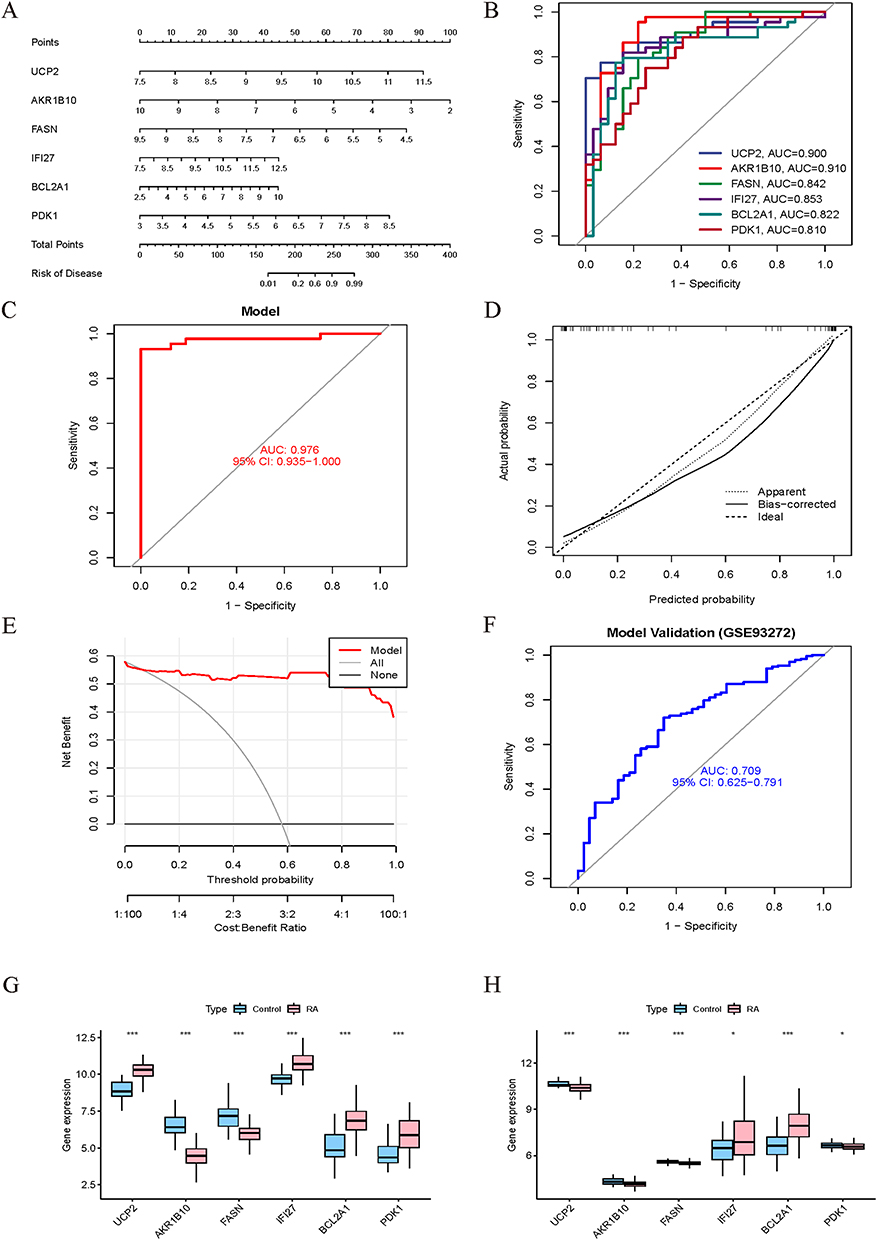 |
Figure 4 Development and validation of the diagnostic nomogram. (A) Construction of a diagnostic model incorporating 6 key hub genes. (B) ROC curves evaluating the predictive performance of individual hub gene. (C) ROC curve analysis of the diagnostic model in the training cohort. (D) Calibration curve of the model. (E) Decision curve of the model. (F) ROC curve of the model in the independent dataset GSE93272. (G and H) Box plot representations of hub gene expression levels in the training (G) and validation (H) datasets. (* P < 0.05, *** P < 0.001). |
Immune Infiltration Analysis and Hub Gene-Based Classification
In this study, the Cibersort algorithm was employed to quantify the infiltration abundances of immune cell subsets within RA and control cohorts (Figure 5A), and the proportion differences of immune cells between the two groups were compared (Figure 5B). Correlation analysis revealed significant interactions among immune cell types (Figure 5C), such as a close correlation between resting NK cells and neutrophils. We also analyzed the correlations between the six hub genes identified by machine learning and immune cells (Figure 5D–J). Consensus clustering was performed on the hub gene expression matrix. Through cumulative distribution function analysis (Figure 6A) and delta area curve analysis (Figure 6B), the optimal number of clusters was determined as k=2 (Figure 6C). To elucidate the associations between distinct molecular subtypes and immune cell infiltration patterns, we evaluated the relative levels of immune cells in the two subtypes (Figure 6D). The C1 subtype exhibited substantially elevated abundances of activated memory CD4⁺ T cells, regulatory T cells (Tregs), and M2 macrophages (p<0.05). Collectively, these findings imply that hub genes may critically modulate the immune microenvironment.
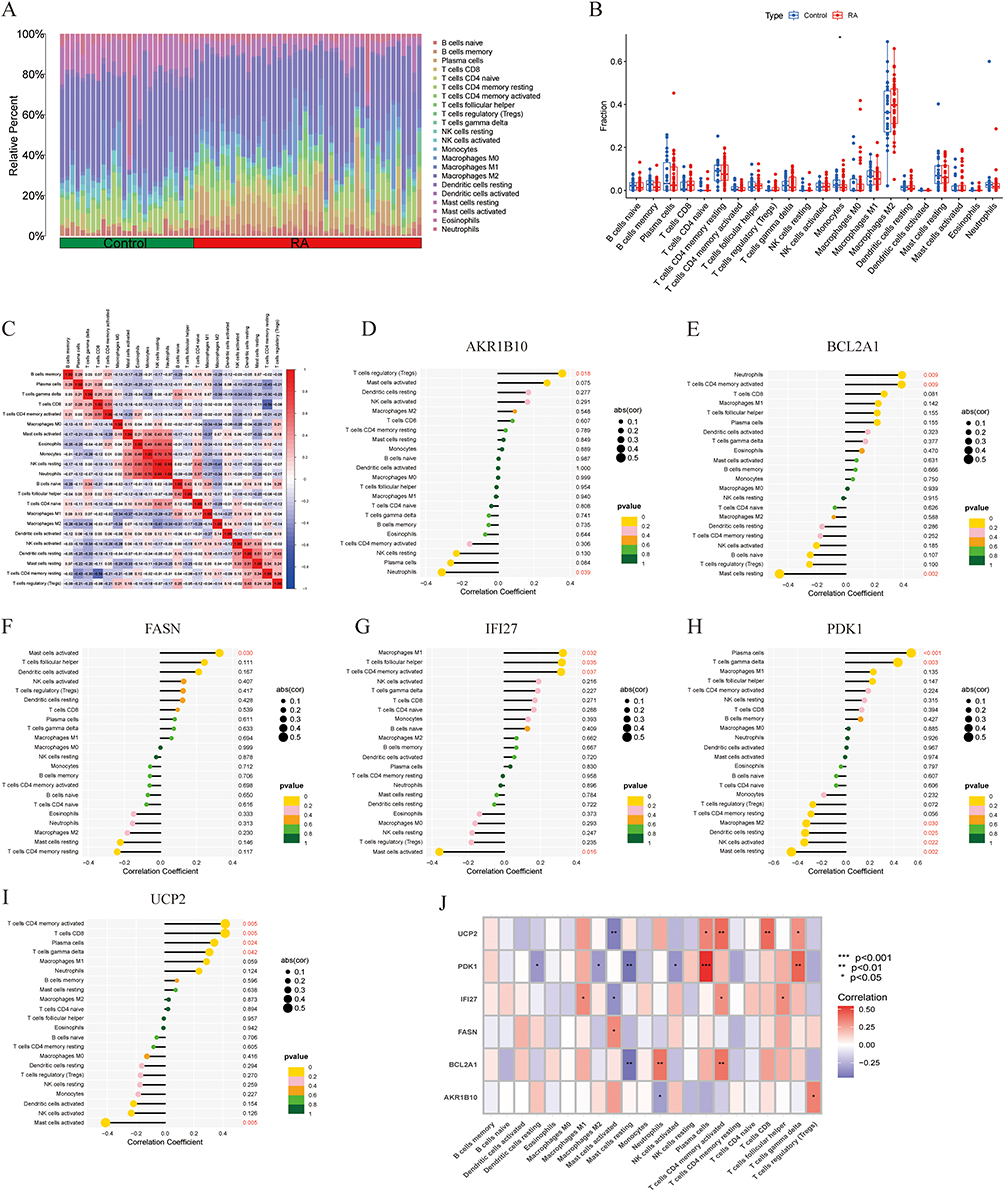 |
Figure 5 Immune cell infiltration patterns and regulatory associations between hub genes and immune cell subsets. (A) Relative percentages of 22 subsets of immune cells in synovial samples from the training set. (B) Differences in immune cell proportions between the RA and control groups. (C) Spearman correlation analysis among immune cells. (D–I) Lollipop plots of the relationships between AKR1B10, BCL2A1, FASN, IFI27, PDK1, UCP2 and immune cells. (J) Correlation heatmap between hub genes and immune cells. Red text: P < 0.05. (* P < 0.05, ** P < 0.01, *** P < 0.001). |
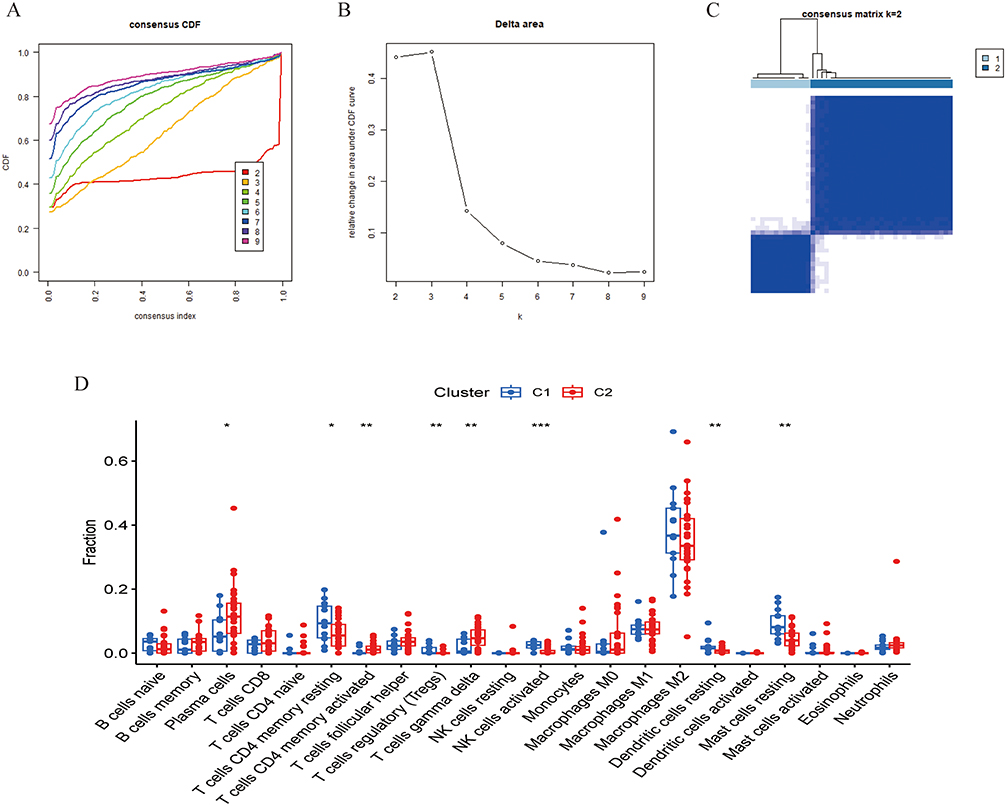 |
Figure 6 Immune molecular subtypes based on hub gene expression. (A) Consensus cumulative distribution function curves evaluating clustering stability of samples across different cluster numbers (k). (B) Delta area curve for determining the optimal number of clusters. (C) Clustering consensus when k=2. (D) Comparison of immune cell proportions between C1 (blue) and C2 (red) subtypes. (* P < 0.05, ** P < 0.01, *** P < 0.001). |
Results of Mendelian Randomization Analysis for Hub Genes and RA
In this investigation, MR was employed to evaluate the putative causal associations between the previously identified six hub genes and RA. For the BCL2A1 gene, a significant positive association with RA was observed, and the causal relationship was visualized (Figure 7A and B). Employing the inverse variance weighted (IVW) approach, a significant association was identified between genetically predicted BCL2A1 expression and RA susceptibility, yielding an odds ratio (OR) of 1.37 (p = 0.021). No heterogeneity (P = 0.448) or pleiotropy (P = 0.853) was detected in the analysis (Figure 7C), further confirming the robustness of the results. During the leave-one-out sensitivity analysis, no genetic polymorphism was detected as a statistical outlier, thereby validating the robustness of causal effect estimates (Figure 7D). Collectively, our findings suggest that the BCL2A1 gene may be a potential risk factor for RA, providing further validation of our bioinformatics analysis. The six instrumental variable SNPs used to evaluate the causal relationship between BCL2A1 and RA, along with the strength of their associations with exposure (BCL2A1 gene expression) and outcome (RA), are detailed in Supplementary Table S1.
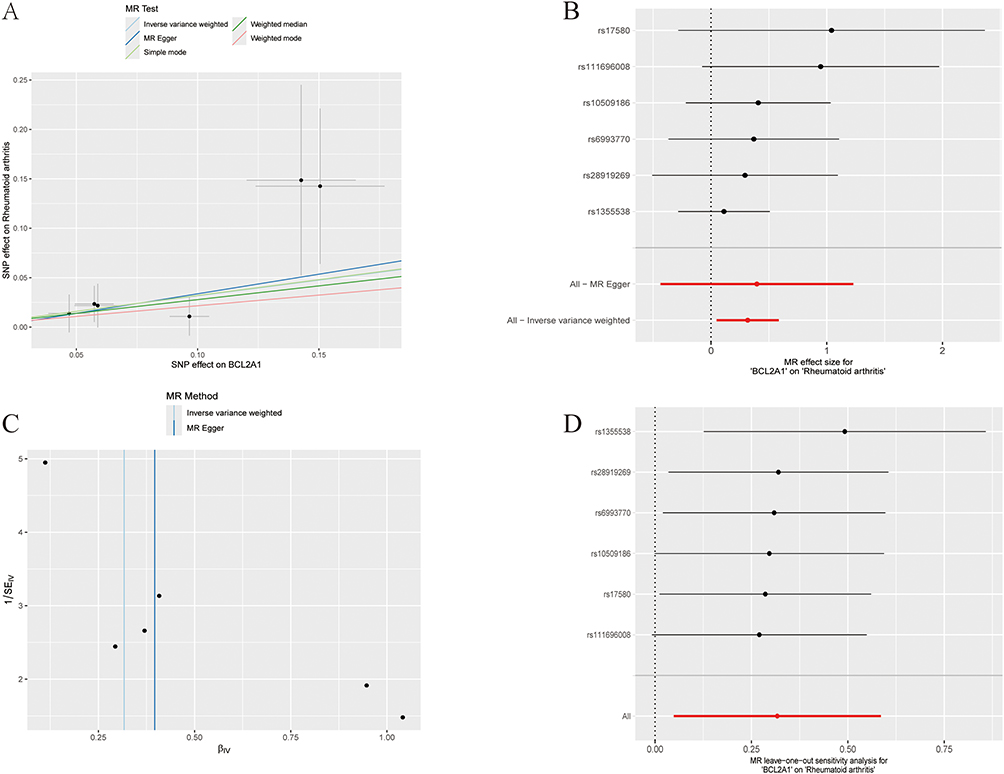 |
Figure 7 Mendelian Randomization Analysis of BCL2A1 and Rheumatoid Arthritis Risk. (A) Scatter plot depicting the estimated causal effect of genetically predicted BCL2A1 expression on RA susceptibility. (B) Forest plot displaying the causal associations of individual SNPs with RA risk. (C) Funnel plot assessing the overall heterogeneity of BCL2A1’s effect on RA. (D) Leave-one-out sensitivity analysis of polymorphisms. |
Drug Enrichment Analysis of Hub Genes
After downloading drug information from the DSigDB database, drug enrichment analysis was performed on the six hub genes. Results showed that fenofibrate was highly associated with two hub genes, potentially serving as a candidate drug molecule for RA (Figure 8A and B). Molecular docking simulations were employed to characterize the interacting interface between fenofibrate and AKR1B10, with the complex exhibiting a binding energy of −9.7 kcal/mol (Figure 8C). The binding site between BCL2A1 (identified in the Mendelian randomization analysis) and mephentermine was subsequently validated, exhibiting a binding energy of −5.5 kcal/mol (Figure 8D). These findings offer new avenues for exploration in precision therapy.
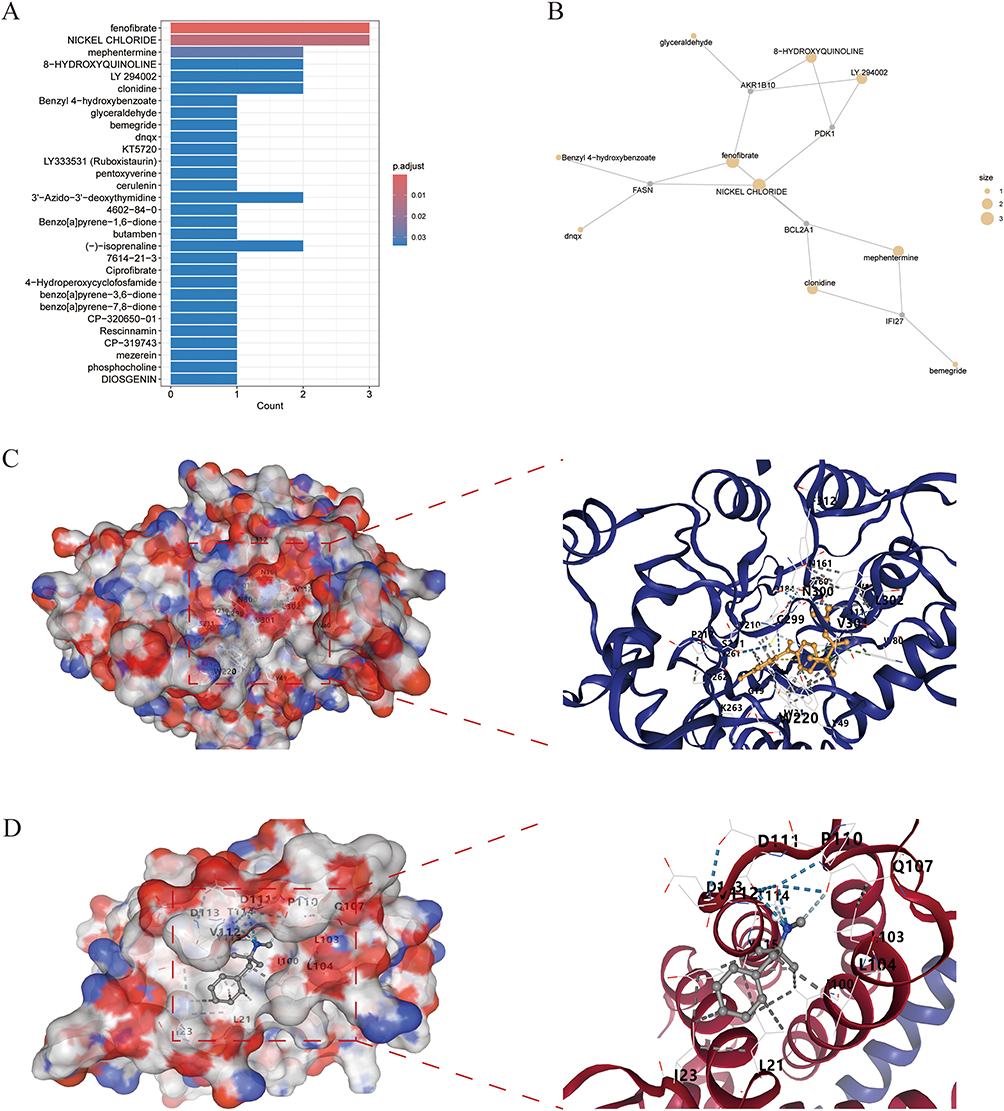 |
Figure 8 Drug enrichment analysis and molecular docking. (A and B) Enrichment analysis of hub genes via the DSigDB database. (C) Molecular docking of fenofibrate with AKR1B10, showing a binding energy of −9.7 kcal/mol. (D) Molecular docking of mephentermine with BCL2A1, showing a binding energy of −5.5 kcal/mol. |
Hub Genes Validation by RT-qPCR
We determined the relative expression levels of 6 hub genes using RT-qPCR, among which BCL2A1, FASN, AKR1B10, IFI27, and PDK1 were consistent with the results of the bioinformatics analysis (Figure 9). This confirms the potential of these genes as potential diagnostic markers for RA. To evaluate the robustness of the RT-qPCR results obtained with the small sample size, a leave-one-out sensitivity analysis was conducted. The results demonstrated that the direction of differential expression of BCL2A1, FASN, AKR1B10, IFI27, and PDK1 remained unchanged following the exclusion of any single sample, with all coefficients of variation (CV) being less than 20% (Table 3). These findings indicated that the expression trends of these genes were not driven by individual outlier samples, and the results thus possessed good reliability.
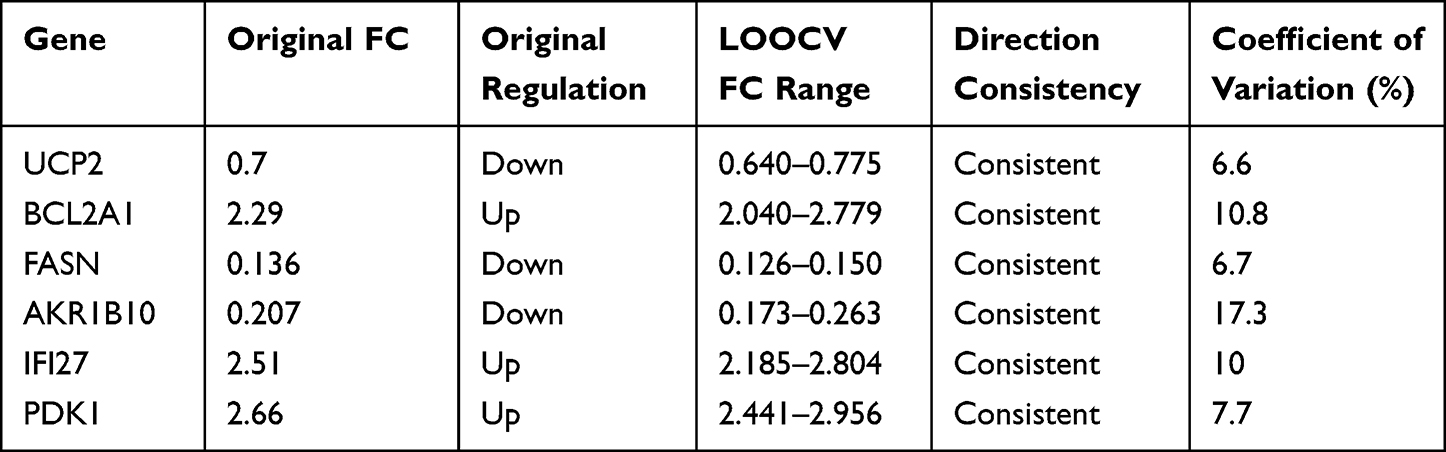 |
Table 3 Leave-One-Out Sensitivity Analysis of the Six Hub Genes |
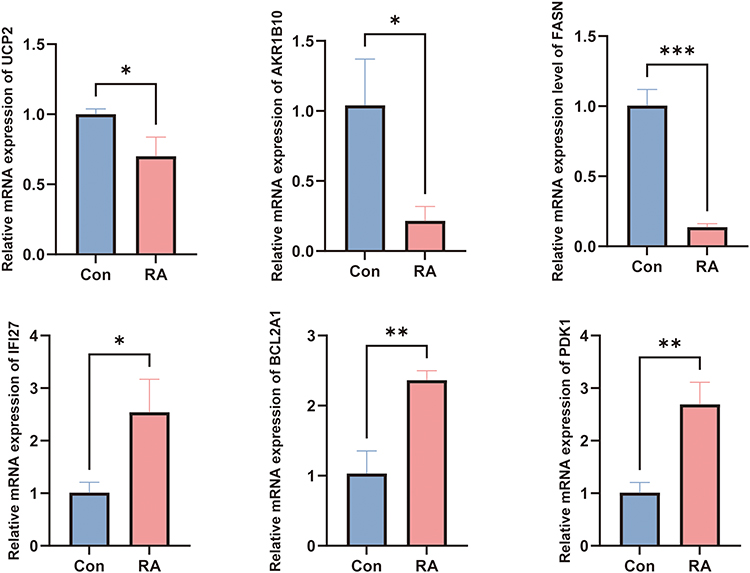 |
Figure 9 Validation of hub gene expression in synovial tissues from RA patients and the control group using RT-qPCR. (* P < 0.05, ** P < 0.01, *** P < 0.001). |
Discussion
Despite significant advancements in treatment strategies for RA, some patients still fail to achieve low disease activity or exhibit non-responsive disease, and most therapies are associated with long-term adverse side effects.17,18 In recent years, growing evidence has suggested a critical role for mitochondria in RA pathogenesis and progression, offering a new perspective for exploring therapeutic targets. Beyond their canonical role in energy metabolism, mitochondria are implicated in the modulation of multiple cellular processes, including calcium ion homeostasis, reactive oxygen species (ROS) synthesis, cell cycle progression, and metabolic pathway regulation.4 Mitochondrial dysfunction exhibits a strong correlation with dysregulated synovial cell physiology, primarily manifested as the induction of pathological synovial inflammation and abnormal cellular hyperproliferation.19 Additionally, mitochondrial dysfunction may contribute to cell damage or hyperactivation associated with RA pathogenesis through abnormal energy metabolism,20 excessive ROS production, and activation of innate immunity.21,22 Against this backdrop, leveraging machine learning approaches to identify mitochondria-related gene biomarkers and potential therapeutic targets for RA holds critical significance for early precision diagnosis and intervention.
Our study provides insights into the molecular framework of RA by identifying and characterizing mitochondria-related DEGs. Through GSEA enrichment analysis, GO/KEGG enrichment analysis, and Metascape enrichment analysis, we provided multi-pathway evidence that an imbalance in mitochondrial homeostasis—including dual abnormalities in structural and metabolic functions—may occur in RA, which is consistent with previous reports of mitochondrial dysfunction in RA.23,24
By comprehensively applying three machine learning algorithms—LASSO regression, SVM, and random forest—we constructed a robust framework for screening RA signature genes. Six core hub genes were ultimately identified: UCP2, BCL2A1, FASN, AKR1B10, IFI27, and PDK1. The predictive model built on these genes demonstrated excellent discriminative performance in internal datasets, and validation in an independent external dataset (GSE93272) of blood sample sequencing showed that the AUC value remained at a high level, indicating good generalizability and clinical application potential. Peripheral blood samples were selected for the validation set owing to their clinical advantages of easy accessibility and repeatable sampling, which endows the constructed diagnostic model with the potential for translation into a clinical indicator for early diagnosis. Furthermore, the diagnostic performance across different tissues further validates the generalizability of our findings. Although previous studies have also developed diagnostic models for RA to assist clinical diagnosis,25–27 the distinctiveness of this model lies in its focus on mitochondria-related RA signature genes, targeting mitochondrial dysfunction as a core pathological feature of RA and highlighting the diagnostic efficacy of mechanism-targeted approaches.
UCP2 is involved in the core regulation of mitochondrial metabolism and oxidative stress. On one hand, it counteracts oxidative stress; on the other hand, UCP2 activity is associated with inflammatory processes.28,29 We hypothesize that increased UCP2 in RA may represent an adaptive response to excessive oxidative damage. BCL2A1, a key anti-apoptotic protein, plays a critical role in cell proliferation and survival.30 Upregulated BCL2A1 expression in osteoclast precursor cells has been shown to inhibit mitochondria-mediated apoptotic pathways, thereby prolonging the survival of osteoclast precursors.30 Elevated BCL2A1 in RA may be linked to uncontrolled synovial cell apoptosis. FASN is a key enzyme in the process of fatty acid synthesis. In the present study, FASN was found to be downregulated in RA, which may lead to a reduction in fatty acid synthesis and subsequently impair the stability and function of cell membranes.31 Notably, the role of FASN in RA remains controversial in existing studies. Consistent with the findings of the present study, Zhang et al reported that FASN expression was decreased in peripheral blood samples from patients with RA; further validation via RNA-seq in RANKL-induced rat bone marrow-derived macrophages undergoing osteoclast differentiation also revealed a significant downregulation of FASN in the RANKL-induced group.32 In addition, another bioinformatics analysis demonstrated that FASN was underexpressed in synovial cells from patients with osteoarthritis (OA) and RA compared with normal controls, suggesting that its downregulation may be involved in the disease process.33 However, conflicting findings have also been reported in the literature. For instance, Su et al demonstrated that FASN overexpression in fibroblast-like synoviocytes (FLSs) of RA led to fatty acid accumulation, which in turn promoted the transformation of these cells into an invasive inflammatory phenotype.34 Additionally, Miao et al found in a collagen-induced arthritis (CIA) mouse model of RA that inhibition of FASN-mediated fatty acid synthesis blocked Th17 cell differentiation, thereby alleviating arthritic symptoms.35 These contradictory observations may be attributed to multiple factors, including cell type specificity, differences in disease stages and sample sources. Future studies are warranted to further elucidate the precise functional role of FASN through single-cell RNA sequencing or cell-type-specific knockout animal models. AKR1B10 participates in fatty acid synthesis and supports cellular energy metabolism. TANG et al identified it as a potential therapeutic target for the traditional Chinese medicine “Tianyu” in RA treatment.36,37 IFI27 is a key player in immune responses and is typically substantially upregulated in inflammatory and autoimmune diseases.38 Sun et al found that PDK1 promotes inflammatory progression in fibroblast-like synovial cells by phosphorylating RSK2,39 which aligns with our analysis showing increased IFI27 and PDK1 levels in the RA group.
Analysis using the Cibersort algorithm revealed close interactions between these hub genes and immune cells. For example, BCL2A1 showed significant positive correlations with neutrophils and CD4⁺ memory activated T cells, suggesting that in RA, BCL2A1 may prolong the survival of pro-inflammatory cells and promote inflammatory progression by inhibiting mitochondria-mediated apoptosis of neutrophils and T cells.40 Based on the expression of the six hub genes, RA patients can be further classified into two distinct subtypes. This subtype analysis provides critical molecular and phenotypic evidence for deciphering the immune heterogeneity of RA and developing subtype-specific therapies, holding promise for advancing precision medicine practices in RA.
Additionally, we performed two-sample MR analysis on these hub genes to investigate whether causal relationships exist between hub genes and RA, further enhancing the reliability of bioinformatics analysis results. Our results indicated that elevated BCL2A1 levels may have a causal relationship with RA development, providing synergistic validation with the previous machine learning screening results. Subsequently, drug enrichment analysis and molecular docking of hub genes showed that these key genes can effectively bind to drugs, offering insights into the repurposing of existing drugs such as fenofibrate and mephentermine. Finally, through RT-qPCR assays on clinical synovial tissue samples, we validated the findings of the bioinformatics analysis, thereby further enhancing the credibility of this study.
Our study also has limitations. First, due to the difficulty in obtaining RA synovial tissue samples, the RT-qPCR experimental validation of this study was a small-sample validation. Although the stability of the gene expression results has been verified by leave-one-out sensitivity analysis, it is still necessary to collect synovial tissue samples through multi-center cooperation to carry out large-sample validation in the future, so as to further improve the external validity of the results. Second, the training set of this study used synovial tissue, and the validation set was peripheral blood samples. Although it has been confirmed that the diagnostic model still has effective discriminative ability in blood samples, it is necessary to carry out cross-tissue external validation in combination with peripheral blood samples for large-sample validation of the same tissue type (synovial tissue) in the future. Finally, although this study obtained the binding characteristics of core genes and candidate drugs through molecular docking, it has not yet conducted a horizontal comparative analysis of binding energy and binding conformation between candidate drugs and known active compounds for RA targeted therapy, nor has it carried out molecular dynamics simulation and in vitro cell experiments to verify the actual effect of the drugs. The relevant results are still preliminary screening conclusions. In the future, it is necessary to carry out pharmacodynamic validation in combination with cell models and animal models to provide a more reliable basis for clinical translation.
Conclusion
This study systematically investigated the role of mitochondria-related genes in the pathogenesis of RA. Through rigorous machine learning algorithms, six hub genes (UCP2, BCL2A1, FASN, AKR1B10, IFI27, PDK1) were identified. The diagnostic model based on these genes demonstrated favorable discriminative performance in both the synovial tissue training set and the peripheral blood validation set. Additionally, MR analysis established a causal relationship between elevated BCL2A1 expression and RA susceptibility. Molecular docking results provided preliminary evidence for subsequent drug screening and clinical translation, and exploratory RT-qPCR experiments verified the expression patterns of the key genes. Leave-one-out sensitivity analysis confirmed the robustness of our findings. Although some of these genes have been previously linked to RA, our study provides a novel, integrated perspective on mitochondria-driven pathological mechanisms in RA. Future studies will focus on large-scale clinical validation and functional mechanistic experiments.
Data Sharing Statement
The datasets generated and analyzed in this study are available in the GEO data repository under the accession numbers GSE1919, GSE55235, GSE55457, GSE77298, and GSE93272. Additionally, the datasets used for Mendelian randomization analysis in this study can be found in the deCODE database (https://www.decode.com) with the exposure ID 3413_50_BCL2A1_BFL1. The rheumatoid arthritis (RA) data is accessible in the FinnGen database at https://storage.googleapis.com/finngen-public-data-r12/summary_stats/release/finngen_R12_RHEUMA_SEROPOS_STRICT.gz. All other data supporting the findings of this study are available from the corresponding author upon reasonable request.
Ethics Approval and Consent to Participate
This study was approved by the Ethics Committee of The First Affiliated Hospital of Guangxi Medical University (Approval Number: 2025-E0863).
Author Contributions
Xiaolin Luo: Conceptualization, Formal analysis, Methodology, Investigation, Validation, Writing - Original Draft
Zhuqing Dong: Conceptualization, Visualization, Methodology, Investigation, Writing - Original Draft
Yuansong Song: Data Curation, Software, Visualization, Formal analysis, Writing - Original Draft
Jianwei Hu: Data Curation, Formal Analysis, Resources, Software, Writing - Original Draft
Shijie Liao: Conceptualization, Investigation, Supervision, Project Administration, Writing - Review & Editing
Xiaofei Ding: Supervision, Project Administration, Validation, Writing - Review & Editing, Conceptualization
All authors took part in drafting, revising or critically reviewing the article; gave final approval of the version to be published; have agreed on the journal to which the article has been submitted; and agree to be accountable for all aspects of the work.
Funding
The authors received no external funding to support this project.
Disclosure
The authors declare that they have no competing interests.
References
1. Smolen JS, Aletaha D, Mcinnes IB. Rheumatoid arthritis. Lancet. 2016;388(10055):2023–17. doi:10.1016/S0140-6736(16)30173-8
2. Clayton SA, Macdonald L, Kurowska-Stolarska M, et al. Mitochondria as key players in the pathogenesis and treatment of rheumatoid arthritis. Front Immunol. 2021;12. doi:10.3389/fimmu.2021.673916
3. Li S, Huo CL, Liu AT, et al. Mitochondria: a breakthrough in combating rheumatoid arthritis. Front Med-Lausanne. 2024;11.
4. Ma C, Wang J, Hong FF, et al. Mitochondrial dysfunction in rheumatoid arthritis. Biomolecules. 2022;12(9):1216. doi:10.3390/biom12091216
5. Åkefeldt SO, Ismail MB, Valentin H, et al. Targeting BCL2 family in human myeloid dendritic cells: a challenge to cure diseases with chronic inflammations associated with bone loss. Clin Dev Immunol. 2013;2013(1):701305.
6. Wang ZC, Gu Y, Huang LD, et al. Construction of machine learning diagnostic models for cardiovascular pan-disease based on blood routine and biochemical detection data. Cardiovasc Diabetol. 2024;23(1). doi:10.1186/s12933-024-02439-0
7. Myszczynska MA, Ojamies PN, Lacoste AMB, et al. Applications of machine learning to diagnosis and treatment of neurodegenerative diseases. Nat Rev Neurol. 2020;16(8):440–456. doi:10.1038/s41582-020-0377-8
8. Davies NM, Holmes MV, Smith GD. Reading Mendelian randomisation studies: a guide, glossary, and checklist for clinicians. BMJ-Brit Med J. 2018;362.
9. Ungethuem U, Haeupl T, Witt H, et al. Molecular signatures and new candidates to target the pathogenesis of rheumatoid arthritis. Physiol Genomics. 2010;42a(4):267–282. doi:10.1152/physiolgenomics.00004.2010
10. Woetzel D, Huber R, Kupfer P, et al. Identification of rheumatoid arthritis and osteoarthritis patients by transcriptome-based rule set generation. Arthritis Res Ther. 2014;16(2). doi:10.1186/ar4526
11. Broeren MGA, de Vries M, Bennink MB, et al. Disease-regulated gene therapy with anti-inflammatory interleukin-10 under the control of the CXCL10 promoter for the treatment of rheumatoid arthritis. Hum Gene Ther. 2016;27(3):244–254. doi:10.1089/hum.2015.127
12. Tasaki S, Suzuki K, Kassai Y, et al. Multi-omics monitoring of drug response in rheumatoid arthritis in pursuit of molecular remission. Nat Commun. 2018;9(1). doi:10.1038/s41467-018-05044-4
13. Rath S, Sharma R, Gupta R, et al. MitoCarta3.0: an updated mitochondrial proteome now with sub-organelle localization and pathway annotations. Nucleic Acids Res. 2021;49(D1):D1541–d7. doi:10.1093/nar/gkaa1011
14. Newman AM, Liu CL, Green MR, et al. Robust enumeration of cell subsets from tissue expression profiles. Nat Methods. 2015;12(5):453–+. doi:10.1038/nmeth.3337
15. Yoo M, Shin J, Kim J, et al. DSigDB: drug signatures database for gene set analysis. Bioinformatics. 2015;31(18):3069–3071. doi:10.1093/bioinformatics/btv313
16. Liu Y, Yang XC, Gan JH, et al. CB-Dock2: improved protein ligand blind docking by integrating cavity detection, docking and homologous template fitting. Nucleic Acids Res. 2022;50(W1):W159–W64. doi:10.1093/nar/gkac394
17. Roodenrijs NMT, Welsing PMJ, Van Roon J, et al. Mechanisms underlying DMARD inefficacy in difficult-to-treat rheumatoid arthritis: a narrative review with systematic literature search. Rheumatology. 2022;61(9):3552–3566. doi:10.1093/rheumatology/keac114
18. Hazlewood GS, Schieir O, Bykerk V, et al. Frequency of symptomatic adverse events in rheumatoid arthritis: an exploratory online survey. J Rheumatol. 2022;49(9):998–1005. doi:10.3899/jrheum.210688
19. Li MZ, Luo XL, Long X, et al. Potential role of mitochondria in synoviocytes. Clin Rheumatol. 2021;40(2):447–457. doi:10.1007/s10067-020-05263-5
20. Kan SY, Duan MM, Liu Y, et al. Role of mitochondria in physiology of chondrocytes and diseases of osteoarthritis and rheumatoid arthritis. Cartilage. 2021;13(2_Suppl):1102s–21s.
21. Meyer A, Laverny G, Bernardi L, et al. Mitochondria: an Organelle of Bacterial Origin Controlling Inflammation. Front Immunol. 2018;9. doi:10.3389/fimmu.2018.00536
22. Banoth B, Cassel SL. Mitochondria in innate immune signaling. Transl Res. 2018;202(52):52–68. doi:10.1016/j.trsl.2018.07.014
23. LóPEZ-Armada MJ, Fernández-Rodríguez JA, Blanco FJ. Mitochondrial dysfunction and oxidative stress in rheumatoid arthritis. Antioxidants-Basel. 2022;11(6).
24. Cui L, Weiyao J, Chenghong S, et al. Rheumatoid arthritis and mitochondrial homeostasis: the crossroads of metabolism and immunity. Front Med-Lausanne. 2022;9.
25. Liu YC, Jiang HX, Kang TL, et al. Platelets-related signature based diagnostic model in rheumatoid arthritis using WGCNA and machine learning. Front Immunol. 2023, 14:1204652.
26. Xie MS, Zhu C, Ye YJ. Ferroptosis-related molecular clusters and diagnostic model in rheumatoid arthritis. Int J Mol Sci. 2023;24(8):7342.
27. jiang MY, Liu KC, Lu SY, et al. Verification of cuproptosis-related diagnostic model associated with immune infiltration in rheumatoid arthritis. Front Endocrinol. 2023;14. doi:10.3389/fendo.2023.1204926
28. Nesci S, Rubattu S. UCP2, a member of the mitochondrial uncoupling proteins: an overview from physiological to pathological roles. Biomedicines. 2024;12(6):1307. doi:10.3390/biomedicines12061307
29. Luby A, Alves-Guerra MC. UCP2 as a cancer target through energy metabolism and oxidative stress control. Int J Mol Sci. 2022;23(23):15077. doi:10.3390/ijms232315077
30. Lee JY, Lee NK. Up-regulation of cyclinD1 and Bcl2A1 by insulin is involved in osteoclast proliferation. Life Sci. 2014;114(2):57–61. doi:10.1016/j.lfs.2014.07.006
31. Xiao Y, Yang Y, Xiong H, et al. The implications of FASN in immune cell biology and related diseases. Cell Death Dis. 2024;15(1):88. doi:10.1038/s41419-024-06463-6
32. Zhang P, Wen Y, Li X, et al. Molecular subtype and RNA transcriptomics validation for rheumatoid arthritis characterized by fatty acid metabolism-related immune landscape. Front Immunol. 2025;16:1611000.
33. Liao CS, He FZ, Li XY, et al. Analysis of common differential gene expression in synovial cells of osteoarthritis and rheumatoid arthritis. PLoS One. 2024;19(5):e0303506.
34. Su JL, Fan XM, Zou YY, et al. Inhibition of aberrant activated fibroblast-like synoviocytes in rheumatoid arthritis by leishmania peptide via the regulation of fatty acid synthesis metabolism. Adv Sci. 2025;12(19). doi:10.1002/advs.202409154
35. Miao Y, Wu X, Xue X, et al. Morin, the PPARγ agonist, inhibits Th17 differentiation by limiting fatty acid synthesis in collagen-induced arthritis. Cell Biol Toxicol. 2023;39(4):1433–1452. doi:10.1007/s10565-022-09769-3
36. Tang L, Guo D, Jia D, et al. Exploring the therapeutic potential of “Tianyu” medicine pair in rheumatoid arthritis: an integrated study combining LC-MS/MS, bioinformatics, network pharmacology, and experimental validation. Front Med Lausanne. 2024;11:1475239.
37. Endo S, Matsunaga T, Nishinaka T. The role of AKR1B10 in physiology and pathophysiology. Metabolites. 2021;11(6):332. doi:10.3390/metabo11060332
38. Shojaei M, Mclean AS. Interferon-stimulated gene IFI27 as a multifaceted candidate target in precision medicine. Trends Immunol. 2025;46(3):219–228. doi:10.1016/j.it.2025.01.008
39. Sun C, Sun Y, Jiang D, et al. PDK1 promotes the inflammatory progress of fibroblast-like synoviocytes by phosphorylating RSK2. Cellular Immunol. 2017;315(27–33):27–33. doi:10.1016/j.cellimm.2016.10.007
40. Chimenti S, Triggianese P, Conigliaro P, et al. The interplay between inflammation and metabolism in rheumatoid arthritis. Cell Death Dis. 2015;6(9):e1887.
 © 2026 The Author(s). This work is published and licensed by Dove Medical Press Limited. The
full terms of this license are available at https://www.dovepress.com/terms
and incorporate the Creative Commons Attribution
- Non Commercial (unported, 4.0) License.
By accessing the work you hereby accept the Terms. Non-commercial uses of the work are permitted
without any further permission from Dove Medical Press Limited, provided the work is properly
attributed. For permission for commercial use of this work, please see paragraphs 4.2 and 5 of our Terms.
© 2026 The Author(s). This work is published and licensed by Dove Medical Press Limited. The
full terms of this license are available at https://www.dovepress.com/terms
and incorporate the Creative Commons Attribution
- Non Commercial (unported, 4.0) License.
By accessing the work you hereby accept the Terms. Non-commercial uses of the work are permitted
without any further permission from Dove Medical Press Limited, provided the work is properly
attributed. For permission for commercial use of this work, please see paragraphs 4.2 and 5 of our Terms.
Recommended articles
Immune Cell Infiltration Analysis Based on Bioinformatics Reveals Novel Biomarkers of Coronary Artery Disease
He T, Muhetaer M, Wu J, Wan J, Hu Y, Zhang T, Wang Y, Wang Q, Cai H, Lu Z
Journal of Inflammation Research 2023, 16:3169-3184
Published Date: 26 July 2023
Association Between Autoimmune Diseases and Sarcopenia: A Two-Sample Mendelian Randomization Study
Su Q, Jin C, Yang Y, Wang J, Wang J, Zeng H, Chen Y, Zhou J, Wang Y
Clinical Epidemiology 2023, 15:901-910
Published Date: 25 August 2023
Machine Learning-Based Predictive Modeling of Diabetic Nephropathy in Type 2 Diabetes Using Integrated Biomarkers: A Single-Center Retrospective Study
Zhu Y, Zhang Y, Yang M, Tang N, Liu L, Wu J, Yang Y
Diabetes, Metabolic Syndrome and Obesity 2024, 17:1987-1997
Published Date: 10 May 2024
Development and Validation of a Cost-Effective Machine Learning Model for Screening Potential Rheumatoid Arthritis in Primary Healthcare Clinics
Wu W, Hu X, Yan L, Li Z, Li B, Chen X, Lin Z, Zeng H, Li C, Mo Y, Wu Y, Wang Q
Journal of Inflammation Research 2025, 18:1511-1522
Published Date: 3 February 2025
Identifying Common Diagnostic Biomarkers and Therapeutic Targets between COPD and Sepsis: A Bioinformatics and Machine Learning Approach
Li X, Xiao Y, Yang M, Zhang X, Yuan Z, Zhang Z, Zhang H, Liu L, Zhao M
International Journal of Chronic Obstructive Pulmonary Disease 2025, 20:1761-1786
Published Date: 28 May 2025