Back to Journals » Journal of Inflammation Research » Volume 16
Immune Cell Infiltration Analysis Based on Bioinformatics Reveals Novel Biomarkers of Coronary Artery Disease
Authors He T, Muhetaer M, Wu J, Wan J, Hu Y, Zhang T, Wang Y, Wang Q, Cai H, Lu Z
Received 8 April 2023
Accepted for publication 8 July 2023
Published 26 July 2023 Volume 2023:16 Pages 3169—3184
DOI https://doi.org/10.2147/JIR.S416329
Checked for plagiarism Yes
Review by Single anonymous peer review
Peer reviewer comments 2
Editor who approved publication: Dr Monika Sharma
Tianwen He,1,2,* Muheremu Muhetaer,1,2,* Jiahe Wu,1,2 Jingjing Wan,1,2 Yushuang Hu,1,2 Tong Zhang,1,2 Yunxiang Wang,1,2 Qiongxin Wang,1,2 Huanhuan Cai,1,2 Zhibing Lu1,2
1Department of Cardiology, Zhongnan Hospital of Wuhan University, Wuhan, People’s Republic of China; 2Institute of Myocardial Injury and Repair, Wuhan University, Wuhan, People’s Republic of China
*These authors contributed equally to this work
Correspondence: Zhibing Lu; Huanhuan Cai, Department of Cardiology, Zhongnan Hospital of Wuhan University, No. 169 Donghu Road, Wuchang District, Wuhan, 430071, People’s Republic of China, Email [email protected]; [email protected]
Background: Coronary artery disease (CAD) is a multifactorial immune disease, but research into the specific immune mechanism is still needed. The present study aimed to identify novel immune-related markers of CAD.
Methods: Three CAD-related datasets (GSE12288, GSE98583, GSE113079) were downloaded from the Gene Expression Integrated Database. Gene ontology annotation, Kyoto Encyclopedia of Genes and Genomes pathway enrichment analysis and weighted gene co-expression network analysis were performed on the common significantly differentially expressed genes (DEGs) of these three data sets, and the most relevant module genes for CAD obtained. The immune cell infiltration of module genes was evaluated with the CIBERSORT algorithm, and characteristic genes accompanied by their diagnostic effectiveness were screened by the machine-learning algorithm least absolute shrinkage and selection operator (LASSO) regression analysis. The expression levels of characteristic genes were evaluated in the peripheral blood mononuclear cells of CAD patients and healthy controls for verification.
Results: A total of 204 upregulated and 339 downregulated DEGs were identified, which were mainly enriched in the following pathways: “Apoptosis”, “Th17 cell differentiation”, “Th1 and Th2 cell differentiation”, “Glycerolipid metabolism”, and “Fat digestion and absorption”. Five characteristic genes, LMAN1L, DOK4, CHFR, CEL and CCDC28A, were identified by LASSO analysis, and the results of the immune cell infiltration analysis indicated that the proportion of immune infiltrating cells (activated CD8 T cells and CD56 DIM natural killer cells) in the CAD group was lower than that in the control group. The expressions of CHFR, CEL and CCDC28A in the peripheral blood of the healthy controls and CAD patients were significantly different.
Conclusion: We identified CHFR, CEL and CCDC28A as potential biomarkers related to immune infiltration in CAD based on public data sets and clinical samples. This finding will contribute to providing a potential target for early noninvasive diagnosis and immunotherapy of CAD.
Keywords: biomarkers, coronary artery disease, CAD, immune infiltration, inflammation, machine learning
Introduction
Coronary artery disease (CAD) is a major cause of death and disability worldwide,1 and has been proved to be triggered by the interaction of environmental and genetic risk factors. It is considered to be a systemic, progressive inflammatory disease. The atherosclerotic plaque formed in CAD accumulates chronically in the subendothelial layer of the coronary artery, leading to severe stenosis of the blood vessels, and thus limiting blood flow, resulting in severe myocardial hypoxia, and eventual death of myocardial cells.2 At present, the gold standard for diagnosing CAD is coronary angiography, but invasive procedures can have postoperative complications with additional costs for patients. Noninvasive early diagnosis can prevent the progression of CAD and effectively reduce its mortality rate, but currently there not a reliable and stable noninvasive clinical diagnostic marker in.3
The most basic pathological mechanism of CAD is atherosclerosis, and the immune response plays an essential role in the formation and development of atherosclerosis.4 At present, it is believed that the inflammatory process induced by atherosclerotic lesions is mediated by cells of the innate and adaptive immune system that are recruited into the arterial intima.5 One study suggests that CD8T cells control monogenesis and macrophage accumulation in early atherosclerosis and play a cytotoxic role therein, and contribute to macrophage death and formation of the necrotic core of the plaque.6 Another study verified that peroxisome proliferator-activated receptor γ (PPAR γ) can reduce inflammation by activating the recruitment of regulatory T cells. Thus, immune cell infiltration is involved in the occurrence and development of CAD.
At present, several studies have shown that some inflammatory factors can be used as biomarkers to predict CAD, including homocysteine (Hcy), high sensitivity C-reactive protein (hs-CRP), and superoxide dismutase (SOD), but the diagnostic efficacy of CAD is not satisfactory.7–9 Some newly discovered biomarkers, including cyclophilin A (CyPA), pentraxin 3 (PTX3), and nucleotide-binding oligomerization domain-like receptor protein 3 (NLRP3) inflammasomes, are being investigated continuously.10–12 However, the actual usage rate of these biomarkers in clinical practice is very low, and there is a lack of research and exploration of immune pathways related to CAD. Therefore, it is important to search for new biomarkers and explore their immune infiltration related pathways, which will help provide insights and support for the early diagnosis and mechanism research of CAD.
Bioinformatics analysis has been used in the exploration of the potential pathophysiological mechanisms of various diseases. In previous studies, the participation of immune cell infiltration and immune-related pathways in the progression of CAD has been confirmed, which highlights the key role of immune mechanisms in atherosclerosis.13 Among the tools available, weighted gene co-expression network analysis (WGCNA) is widely used to mine the gene expression modules most related to disease immune response, and for further screening of the central genes. WGCNA14 is a widely used bioinformatics analysis method that is applied to search clusters (modules) of highly correlated genes, summarize such clusters with module characteristic genes or in module central genes, and correlate modules with each other and external sample traits.15 Furthermore, the machine-learning algorithm and dimension reduction method, least absolute shrinkage and selection operator (LASSO), is a tool that can establish regression models to screen target genes. In this study, WGCNA and LASSO were combined to screen characteristic genes, followed by immune infiltration analysis results and clinical sample validation. Finally, we identified new potential biomarkers related to CAD immune response.
Materials and Methods
Microarray Datasets and Data Preprocessing
The gene expression profiles GSE12288, GSE98583 and GSE113079 of patients with CAD were obtained from the Gene Expression Omnibus database (https://www.ncbi.nlm.nih.gov/). The GSE12288 dataset had 110 gene expressions in CAD patients’ peripheral blood and 112 gene expressions in control human peripheral blood samples, analyzed by Affymetrix Human Genome U133A Array.16 The GSE98583 dataset had gene expressions in peripheral blood samples from 12 CAD and 6 control subjects, analyzed by Affymetrix Human Genome U133A 2.0 Array. The GSE113079 dataset had gene expressions in peripheral blood samples from 93 CAD and 48 control subjects, analyzed by Agilent-067406 Human CBC lncrna + mRNA Microarray v4.0.17 The probe ID of each gene was converted into a gene symbol. The Preprocess Core package of R software was used to homogenize the three data sets while the Limma package for gene screening,18 P<0.05, and |logFC|>0 were used as screening criteria. The Venn Diagram package was applied for identification of common differentially expressed genes (DEGs) in the three datasets.
Functional Enrichment Analysis
The Cluster Profiler package19 was used to enrich and analyze the identified genes in Gene Ontology (GO) and the Kyoto Encyclopedia of Genes and Genomes (KEGG). The GO category includes biological process (BP), molecular function (MF) and cellular component (CC). P<0.05 was set as the significant threshold.
WGCNA Identification of Modules Associated with Clinical Traits
In this study, we conducted WGCNA analysis on the GSE12288 dataset with cross genes, and constructed a gene co-expression network with gene expression data. We then calculated the similarity between nodes and converted the adjacency matrix to Tom matrix. Gene networks/modules were identified by the dynamic pruning tree algorithm. Select the soft threshold powers value, and a screening result of 4 is the most suitable. We associated the previously calculated module features with clinical features to further study the functional modules of the co-expression network. Therefore, the modules subsequently selected were closely related to the clinical characteristics and were selected for subsequent analysis.
Construction of the Protein-Protein Interaction (PPI) Network
The screened module genes were uploaded to the online “search tool for searching interacting genes” (string; http://string-db.org). In order to comprehend the interaction of modular genes a PPI network was further visualized using Cytoscape software (version 3.7.1).20
Selection of Characteristic Genes
Characteristic genes were screened by LASSO, because compared with regression analysis,21 it has advantages in evaluating high-dimensional data. Through the glmnet software package,22 cable analysis was conducted with the steering/punishment parameters using 10-times cross validation. The DEGs in the three data sets were analyzed by LASSO, and the genes that crossed in at least two data sets were taken as characteristic genes. The result was displayed as a Venn diagram. The diagnostic efficacy of the characteristic genes in the three data sets was evaluated by receiver operating characteristic (ROC) curves and the area under the curve (AUC). The characteristic genes with the area under the curve (AUC)≥0.5 and P<0.05 were screened as potential biomarkers.
Immune Infiltration Analysis
“Cell type identification by estimating relative subsets of RNA transcripts” (CIBERSORT) was used to quantify the infiltration degree of 23 types of immune cells in the GSE12288 data set. CIBERSORT algorithm can quantitatively analyze these immune cell subpopulations and identify key subpopulations in diseases. The difference in the immune cell infiltration between CAD and control groups, as well as the correlation between the five characteristic genes and immune cell infiltration were analyzed with the single sample gene set enrichment analysis (ssGSEA) function in the “GSVA” package. The box diagram was used to show the infiltration results between groups, the scatter diagram indicated the correlation between immune cells, and the lollipop diagram represented the correlation between characteristic genes and infiltrating immune cells. Only results with P<0.05 were considered statistically significant and displayed.
Gene Set Variation Analysis
Gene set variation analysis (GSVA)23 is an explicit modeling phenotype method in the R-rich scoring algorithm, and is used to analyze expression data. The correlation analysis between characteristic genes and all genes was carried out in the GSE12288 data set, and the heat maps displayed the top50 genes that are positively related to characteristic genes. According to the results of correlation analysis, we conducted a further single gene GSEA analysis based on the Reactome database (https://reactome.org). The mountain map was used to show the results of the top 20 pathways of each of the five genes. Pathways with P < 0.05 were considered statistically significant.
Patients and Controls
We consecutively recruited CAD patients (n=12, 9 male, 3 female) and normal subjects (n=10, 4 male, 6 female) from Zhongnan Hospital of Wuhan University. All patients in the CAD group underwent coronary angiography surgery in our hospital, and the inclusion criteria were: patients diagnosed with CAD for the first time through coronary angiography. That is, patients who have demonstrated ≥ 50% stenosis in at least one main coronary artery as confirmed by the angiography results. The results of coronary angiography were interpreted by two experienced interventional cardiologists. All healthy subjects in the control group have undergone routine physical examinations in the hospital, and the inclusion were subjects who showed negative results on coronary artery CT or coronary angiography, or were determined to have no CAD related clinical signs and symptoms. The exclusion criteria were: subjects with acute infection, malignant tumors, autoimmune diseases, and severe liver, lung, kidney and other organ dysfunction. Specific information on the patients is provided in Table S1. We collected peripheral blood samples from these patients for clinical sample validation. This study was approved by the Medical Ethics Committee Zhongnan Hospital of Wuhan University, and all patients and their families included in the study were informed of this study and signed informed consent form. This study complies with the the standards set by the Declaration of Helsinki.
Quantitative Polymerase Chain Reaction (qPCR)
The total RNA was extracted from the peripheral blood mononuclear cells (PBMCs) of controls (n=10, 4 male, 6 female) and CAD patients (n=12, 9 male, 3 female) using TRIzol (Invitrogen). The RNA was diluted with DEPC water, and its concentration and purity were detected with ultramicroscopic ultraviolet/visible light and fluorescence spectrophotometer. Hifair III 1st Strand cDNA Synthesis SuperMix Kit (YEASEN, Shanghai, China) and Heiff UNICON Universal Blue qPCR SYBR Green Master Mix (YEASEN) were used according to the manufacturer’s instructions for qPCR reaction, which was run on a CFX96 real-time PCR system. Triplicate reactions were performed to ensure accuracy. Gene expression relative to glyceraldehyde-3-phosphate dehydrogenase (GAPDH) expression was assessed using the 2−∆∆Ct method. The primer sequences are given in Table 1. Characteristic genes with P<0.05 were considered statistically significant.
 |
Table 1 Primers Sequence |
Statistical Analysis
All the bioinformatics analyses and statistical tests were performed with R software 4.2.1. Wilcoxon or Student’s t-test was utilized for analysis of the difference between groups. The correlation between variables was determined using Pearson’s or Spearman correlation test. All statistical P values were two-sided, and P<0.05 was regarded as statistically significant.
Results
Differential Expression Analysis
The box chart in Figure S1 shows the distribution of expression values before and after normalization of the three data sets. The median value of the box chart is at the same level, indicating that the data preprocessing effect was good. According to the described screening thresholds (P<0.05 and |logFC|>0), the data sets were analyzed for differences. Volcanic maps show the DEGs in each data set (Figure 1A–C). A cluster heat maps indicated the first 21 genes, and DEGs were helpful in distinguishing between disease and healthy samples (Figure 1D–F). In the CAD group, 401 genes were upregulated and 519 genes were downregulated in GSE98583, 328 genes were upregulated and 284 genes were downregulated in GSE12288, and 6049 genes were upregulated and 5428 genes were downregulated in GSE113079. A Wayne diagram (Figure 2) showed the genes co-expressed in the three data sets, and at least two data sets were selected for follow-up analysis, including 204 genes that were simultaneously upregulated and 339 genes that were simultaneously downregulated.
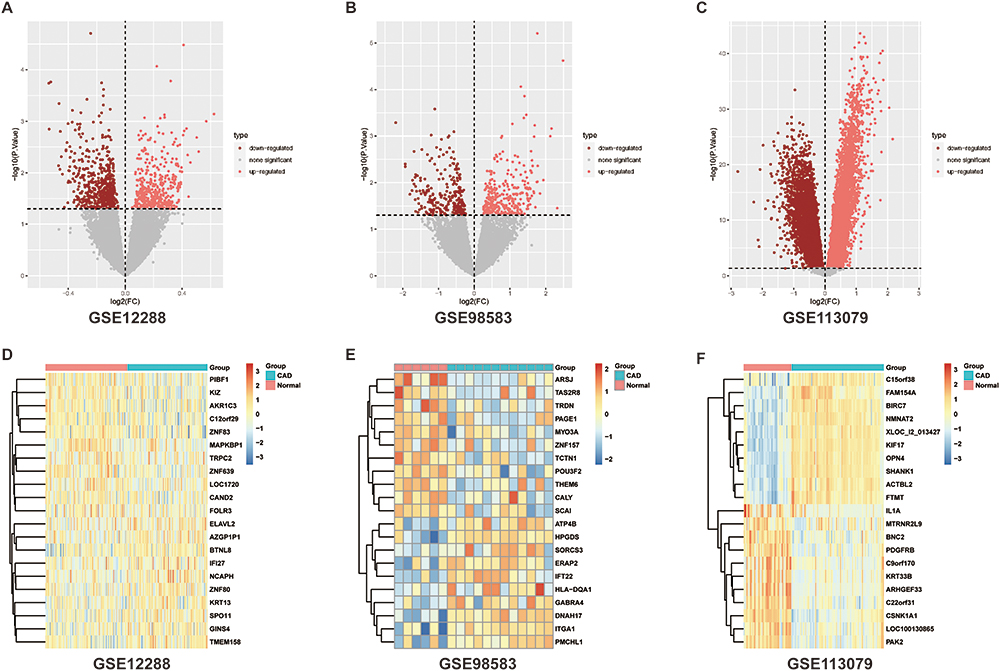 |
Figure 1 Differential analysis of data sets. (A–C) Differential analysis volcano maps and (D–F) differential analysis heat maps using P<0.05, |logFC|>0 to screen differentially expressed genes. Abbreviation: CAD, coronary artery disease. |
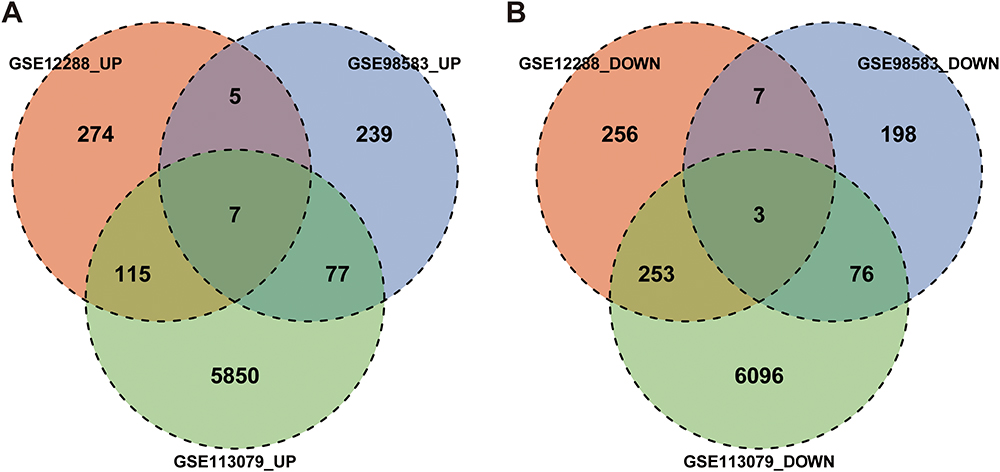 |
Figure 2 Intersection of DEGs. Venn diagrams of (A) upregulated and (B) downregulated DEGs. Abbreviation: DEGs, differentially expressed genes. |
Functional Enrichment Analysis
The co-expressed genes in GSE12288, GSE98583 and GSE113079 were analyzed by GO annotation and KEGG pathway enrichment. Figure 3 shows the first 20 rich GO annotation terms and KEGG pathways. It can be seen that the GO BP analysis mainly focused on “positive regulation of T cell activation”, “positive regulation of leukocyte cell-cell adhesion”, “positive regulation of cell-cell adhesion”, “positive regulation of cell adhesion”, and “positive regulation of lymphocyte differentiation” (Figure 3A). GO CC analysis mainly focused on “membrane raft”, “membrane microdomain”, “centriolar satellite”, “nuclear speck”, and “eukaryotic translation initiation factor 3 complex” (Figure 3B). The analysis of GO MF mainly focused on “SUMO binding”, “protein folding chaperone”, and “mRNA 3’-UTR AU-rich region binding” (Figure 3C). The KEGG pathway analysis mainly focused on “transcriptional misregulation in cancer”, “autophagy animal”, “Th1 and Th2 cell differentiation”, “Th17 cell differentiation”, and “allograft rejection” (Figure 3D).
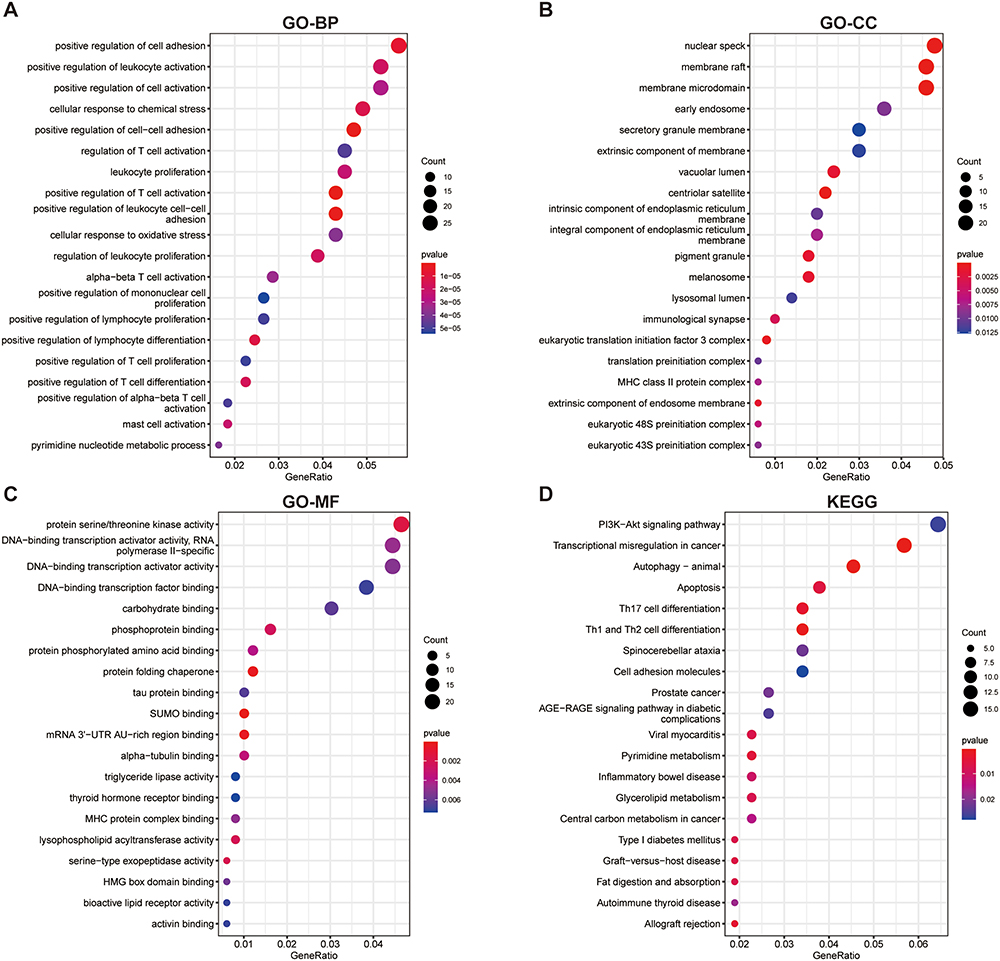 |
Figure 3 GO annotation and KEGG enrichment analyses of differentially expressed genes. (A–C) Enriched GO terms in MF, BP and CC. (D) KEGG pathway enrichment analysis. GO, Gene Ontology; KEGG, Kyoto Encyclopedia of Genes and Genomes; MF, molecular function; BP, biological process; CC, cellular component. |
WGCNA Network Construction and Identification of Key Modules
To construct the WGCNA network, we first calculated the soft threshold power, and improved the co-expression similarity to calculate adjacency. The pick Soft Threshold function in WGCNA was used to analyze the network topology. In the subsequent analysis, we screened the soft threshold power value, which was most appropriate when set to 4. The One-step network construction function of the WGCNA R package was applied to build the gene network, identify the modules, and merge similar modules. Finally, we built three gene co-expression modules, and associated the modules with clinical features and searched for the most important associations. MEturquoise and MEgrey modules were most obviously related to CAD (Figure 4), so we selected the genes of these two modules for subsequent analysis.
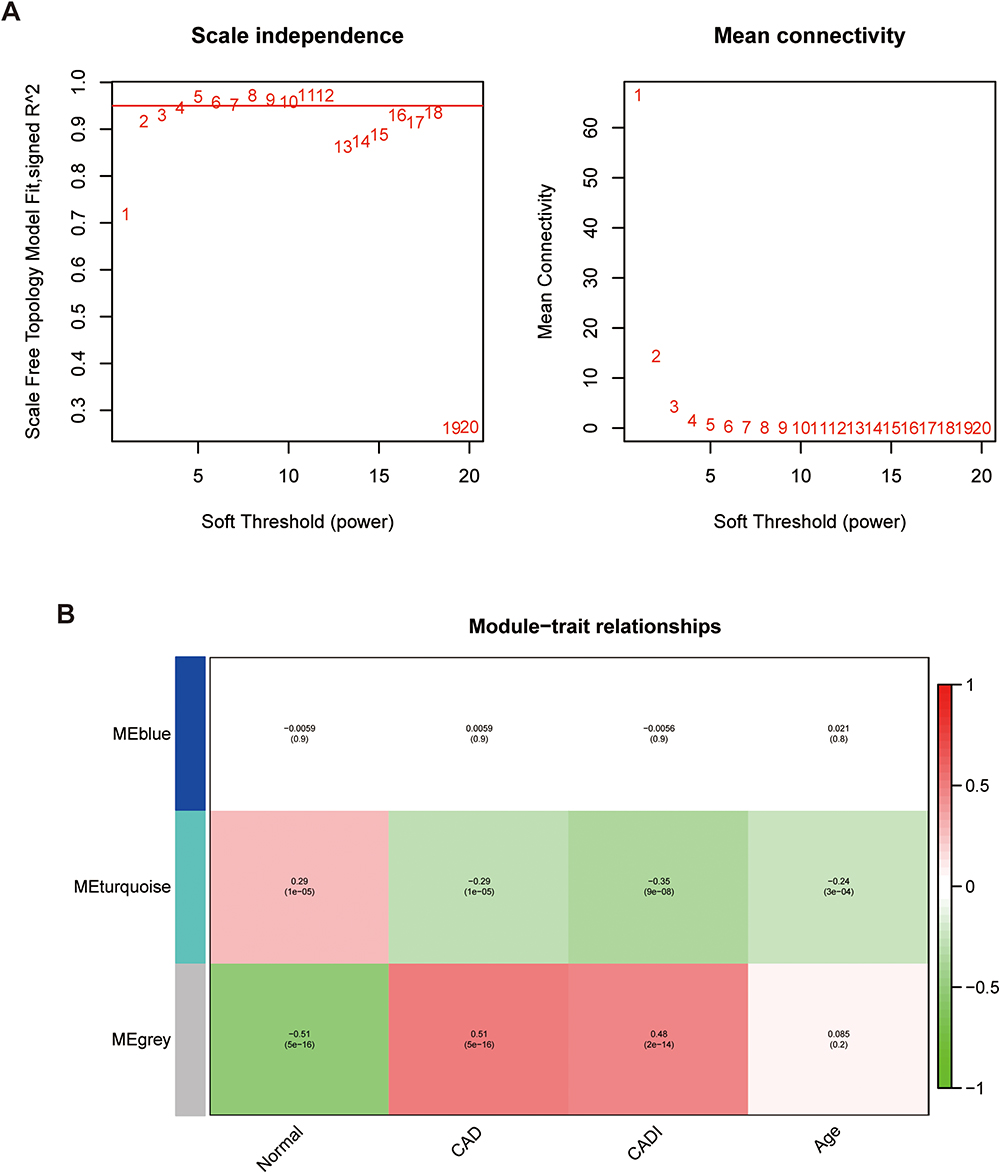 |
Figure 4 Weighted gene co-expression network analysis in GSE12288 dataset using intersection genes. (A) Screening for soft threshold power value, shows 4 is the most appropriate result. (B) Correlations between different gene modules and clinical features. Abbreviations: CAD, coronary artery disease; CADI, Duke CAD index. |
Function Analysis of Key Modules
We analyzed the KEGG pathways of genes in the MEturquoise and MEgrey modules, and determined the pathway of module regulation. The results showed that the pathway of modular regulation mainly focused on “pyrimidine metabolism”, “transcriptional misregulation in cancer”, “glycerolipid metabolism”, “fat digestion and absorption”, and “allograft rejection”, and showed the corresponding genes (Figure S2). We also constructed a protein-protein interaction network of modular genes (Figure S3).
Selection of Characteristic Genes via LASSO
The module genes in the three data sets were analyzed by LASSO regression to screen those that predicted CAD. After crossing, genes that appeared simultaneously in at least two data sets were selected. For the LASSO algorithm, the penalty parameters are adjusted through 10-times cross validation. Through comparison, we selected the minimum standard for constructing the LASSO classifier, and identified five characteristic genes, LMAN1L, DOK4, CHFR, CEL, and CCDC28A, as the final key genes (Figure 5).
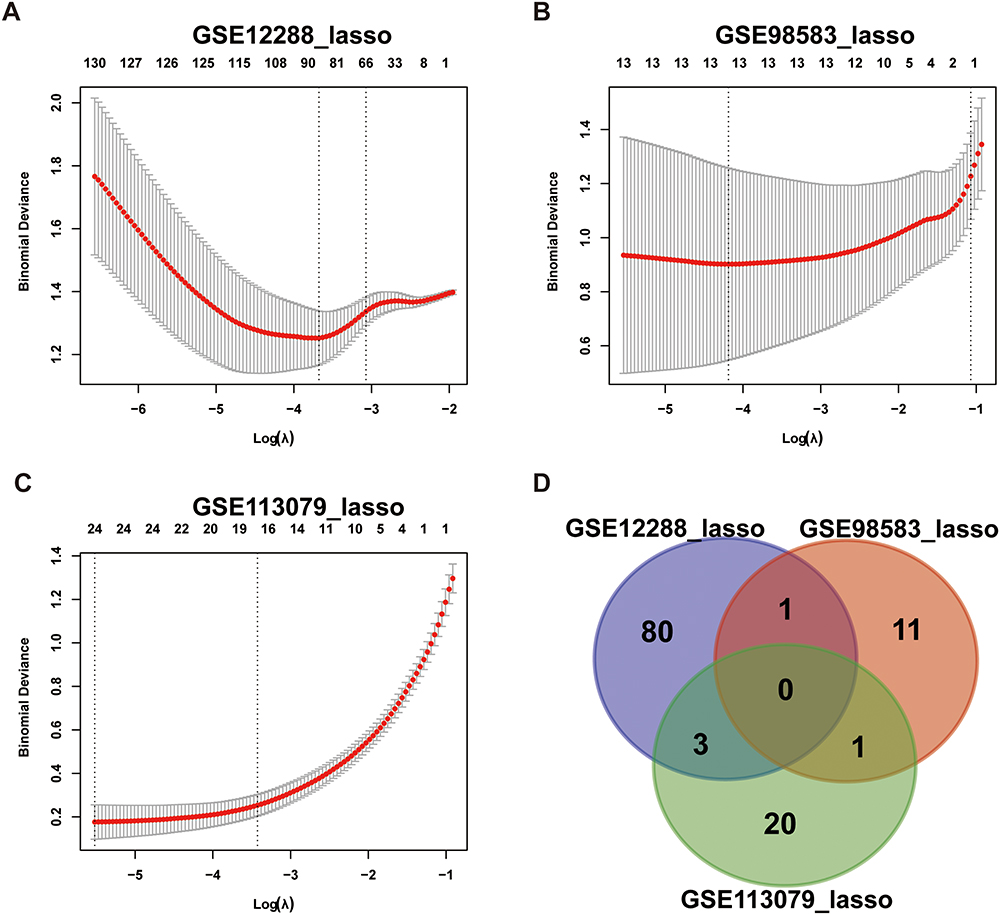 |
Figure 5 LASSO regression analysis module gene screening for key genes in three datasets (A) GSE12288, (B) GSE98583 and (C) GSE113079. (D) Venn diagram of intersection gene. Abbreviation: LASSO, least absolute shrinkage and selection operator. |
Analysis of Immune Cell Infiltration-Related Genes in CAD
We explored differences in the immune microenvironment of CAD patients and healthy controls using the GSVA package and ssGSEA function in R language, and evaluated the immune characteristics according to the expression of infiltrating immune cells. There were significant interactions between immune cell populations in CAD (Figure 6A). The proportion of activated CD8 T cells and CD56 DIM natural killer (NK) cells in CAD samples was lower than that in healthy control samples (Figure 6B). In addition, the analysis showed an interaction between the five characteristic genes and multiple immune cell infiltration. LMAN1L was positively correlated with NK cells, but negatively correlated with activated CD4 T cells. DOK4 had a significant positive correlation with plasmacytoid dendritic cells and monocytes, but a significant negative correlation with activated CD4 T cells. CHFR revealed a significant positive correlation with NK cells, but a significant negative correlation with myeloid-derived suppressor cells (MDSCs), immature B cells, gamma delta T cells and activated CD4 T cells. CEL displayed a significant negative correlation with plasmacytoid dendritic cells. CCDC28A had a significant positive correlation with neutrophils, eosinophils, mast cells, activated CD4 T cells and CD56 bright NK cells (Figure 6C). These findings suggested that these characteristic genes may regulate immune characteristics during the development of CAD.
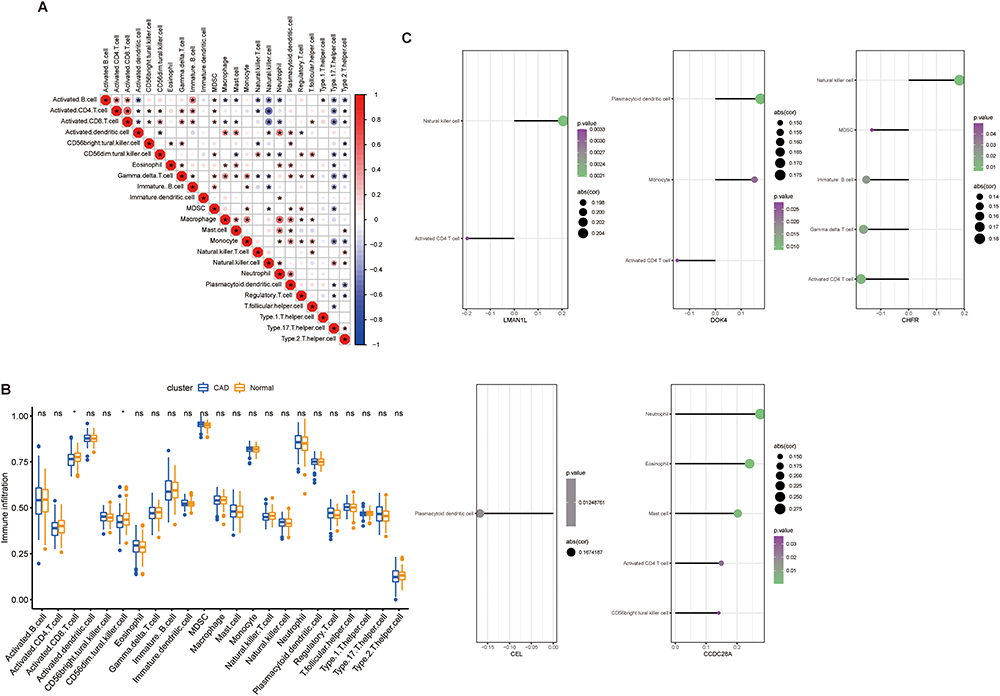 |
Figure 6 GSE12288 dataset for evaluation of the degree of immune cell infiltration. (A) Correlation coefficient diagram shows the relationship between immune cells. (B) Box plot shows the difference in immune cell infiltration between the healthy control group and the CAD group. (C) Lollipop diagrams show the correlation between the characteristic genes and immune cells. *P<0.05, only immune cells with P<0.05 are shown. Abbreviation: CAD, coronary artery disease. |
Establishment and Evaluation of Diagnostic Model of Characteristic Genes
We conducted correlation analysis of the five characteristic genes in the three data sets and evaluated their diagnostic ability through ROC analysis. In GSE12288, the AUCs were 0.561 (LMAN1L), 0.503 (DOK4), 0.591 (CHFR), 0.615 (CEL), and 0.633 (CCDC28A). In GSE98583 they were 0.881, 0.785, 0.654, 0.767 and 0.55, respectively, and 0.958, 0.782, 0.75, 0.834, and 0.888, respectively in GSE113079 (Figure 7). These results illustrated that the five characteristic genes have good diagnostic potential and may be a promising target for prevention and treatment of CAD.
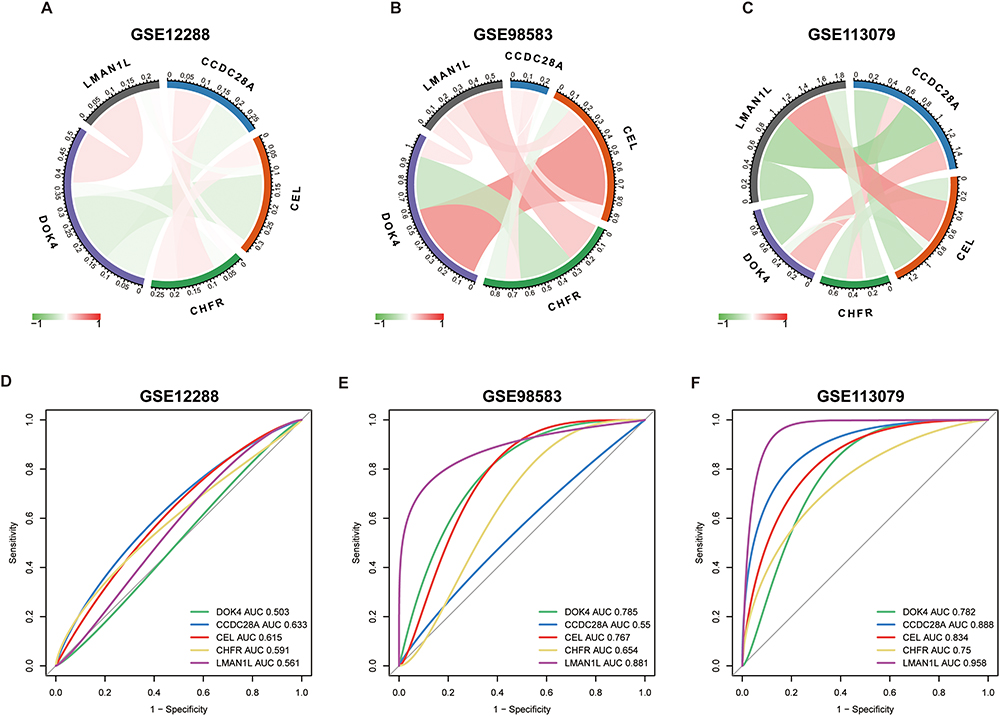 |
Figure 7 Correlation analysis and diagnostic efficacy test of the five characteristic genes. (A–C) Correlation analysis using the three datasets. The red line represents positive correlation, the green line represents negative correlation. (D–F) Diagnostic ROC curves of the five genes. Abbreviations: ROC, receiver operating characteristic; AUC, area under the curve. |
Enrichment Analysis of Characteristic Gene Pathways
The data in GSE12288 were used to analyze the correlation between the five genes and all genes, and the positive correlation top 50 genes were displayed by heat maps (Figure S4). In addition, the five characteristic genes of GSEA were analyzed based on the single genes of Reactome and the top 20 pathways of each gene are shown in Figure 8. After comprehensive analysis, we found that these genes were significantly enriched in the “cell cycle”, “immune response”, and “signal transduction” pathways, among which CEL was significantly negatively correlated with immune regulation pathways such as “immune system”, “signaling by interleukins”, “adaptive immune system” and other pathways. In addition, these genes were also mainly enriched in “ribosome regulation of mitotic cell cycle”, “neurotransmitter receptor and postsynaptic signal transduction”, “cytokine signal in immune system”, “signal transduction”, “immune system”, “post-translational protein modification”, “regulation of HMOX1 expression and activity”, “transcriptional regulation of white adipocyte differentiation”, “collagen formation, protein metabolism”, “metabolism of amino acids and their derivatives”, “hypoxia oxygen dependent proline hydroxylation”, “metabolism of amino acids and vitamins” and other pathways.
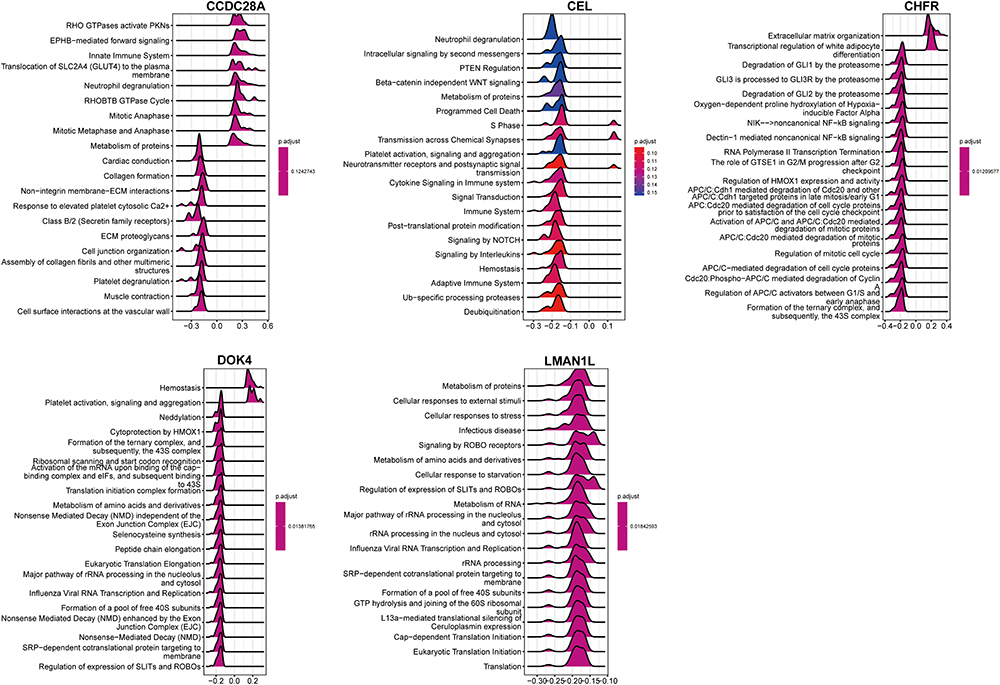 |
Figure 8 Gene set enrichment analysis of single genes in the Reactome database. |
qPCR Verification of Characteristic Gene
To further evaluate the value of the characteristic genes as potential biomarkers, their expression levels were detected in PBMCs isolated from the healthy controls and CAD patients by qPCR. The results showed significant differences in the expression of CEL, CHFR and CCDC28A (Figure 9). However, there was no significant difference in the expression of LMAN1L and DOK4 genes (Figure S5), which may be due to the heterogeneity of the included patients and the relatively small number of cases. The expressions of CEL, CHFR and CCDC28A genes in the peripheral blood of CAD patients were significantly lower than in healthy controls (Figure 9), which was consistent with the predicted results and indicated the potential for these three genes to be biomarkers for CAD diagnosis.
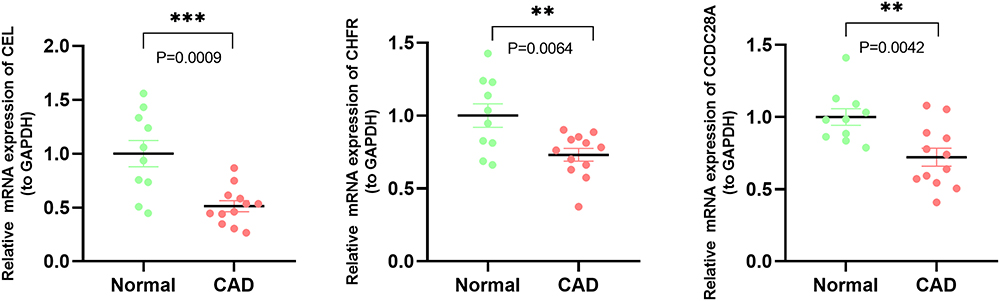 |
Figure 9 qPCR analyses of the expression levels of three characteristic genes. Expression levels of CEL, CHFR and CCDC28A in healthy controls and CAD patients. **P<0.01; ***P<0.001. Abbreviations: GAPDH, glyceraldehyde-3-phosphate dehydrogenase; CAD, coronary artery disease; qPCR, real-time quantitative polymerase chain reaction. |
Discussion
CAD is a major cardiovascular disease and an important cause of death in developed and developing countries.24 Because early diagnosis and recognition are essential for the prevention and treatment of the disease, new noninvasive diagnostic methods, including biomarkers, are needed. The basic pathogenesis of CAD is atherosclerosis,25 which is a complex, persistent and progressive inflammatory disease, characterized by lipid retention and remodeling of the coronary arteries that deliver oxygen and nutrition to the heart tissue, leading to the formation of atherosclerotic plaque and instability.26–28 Many studies have confirmed that immune mediators participate in this process, but as the specific mechanism is still unclear29,30 exploration of the role of immune-related genes in atherosclerotic plaque formation through bioinformatics methods could yield significant results.
From the gene co-expression profiles from CAD patients and healthy controls in the GSE12288, GSE98583 and GSE113079 datasets, we identified 204 DEGs that were upregulated and 339 DEGs that were downregulated. Based on our LASSO analysis, five characteristic genes (LMAN1L, DOK4, CHFR, CEL and CCDC28A) were selected, among which CHFR, CEL and CCDC28A were identified as potential biomarkers of CAD. Our evidence showed that these genes play an important role in the CAD process.
GO enrichment analysis showed that the DEGs were mainly concentrated in “positive regulation of T cell activation”, “positive regulation of leukocyte cell-cell adhesion”, “positive regulation of cell-cell adhesion”, “positive regulation of cell adhesion” and “positive regulation of lymphocyte differentiation”. In addition, KEGG pathway enrichment analysis indicated that the “apoptosis”, “Th17 cell differentiation”, and “Th1 and Th2 cell differentiation” pathways were significantly enriched. A variety of cellular- and molecular-mediated immune mechanisms are involved in the occurrence and development of coronary atherosclerosis,31 and it is currently believed that the interaction of different innate and adaptive immune cells with secreted cytokines and chemokines can activate or regulate immune reactivity to mediate the inflammatory response.32 Current research verifies that both Th1 and Th2 cells play an important role in the development of atherosclerosis, mainly through their different cytokines involved in the inflammatory response, lipid metabolism and other pathways.33,34 Th1 cells can produce a high level of interferon-γ and promote arteriosclerosis by local effects on the arterial wall that affect lipid metabolism.35,36 Th2 cells can antagonize atherosclerosis by secreting interleukin (IL)-4 and IL-10.37,38 The proportions of Th17 and its secreted IL-17 in CAD and atherosclerosis are increased, and positively correlated with the severity of the disease.34 Previous clinical studies have found that the expression of Th17 and IL-17 in peripheral blood of patients with acute coronary syndrome is increased compared with patients with stable angina pectoris and chest pain syndrome.39 Moreover, in vitro studies show that IL-17 can induce and stimulate the cells involved in atherosclerosis (macrophages, dendritic cells, vascular smooth muscle cells), thus causing inflammatory damage and apoptosis.36,38 Our results confirm these immune-related pathways are closely related to CAD, indicating their importance. However, the specific mechanisms by which these immune pathways and their involved inflammatory cytokines and chemokines participate in the occurrence of CAD still need further research.
Immune cell infiltration plays a crucial and complex role in atherosclerosis. Many chemotactic circulating immune cells participate in endothelial injury and lipid infiltration. Our results revealed that the proportions of activated CD8 T cells and CD56 DIM NK cells were decreased in the CAD group (P<0.05), indicating that these two immune cell subpopulations may play a crucial role in CAD related immune pathways. CD8 T cells are considered to be significant participants in atherosclerosis, protecting and promoting atherosclerosis at different stages of disease progression.40 Some studies have shown that in atherosclerotic plaque, CD8 T cells show different levels of activation and cytotoxicity. Some show signs of T cell depletion, especially in symptomatic patients, which may mean gradual adaptation and loss of function of a chronic persistent inflammatory response.40 In addition, studies have proved that a decrease in NK cells can lead to increased serum cholesterol level and plaque area, thus promoting atherosclerosis.41 However, their specific mechanisms in CAD still require further research.
It has been reported that CEL is mainly expressed in vascular endothelium and macrophages.42 Through our KEGG enrichment analysis of the module genes screened by the LASSO algorithm, we found that CEL was mainly enriched in “fat digestion and absorption” and “glycerol ester metabolism”. Previous studies have shown that CEL may regulate the development of atherosclerosis by participating in the interaction between cholesterol and oxidized lipoprotein42 or affecting the metabolism of plasma lipopolysaccharide. Other studies have found that CEL can promote the selective uptake of high-density lipoprotein-related cholesterol esters by liver cells; that is, CEL can prevent atherosclerosis by promoting reverse cholesterol transport and reducing the accumulation of cholesterol in peripheral tissues.43 In addition, our immune infiltration analysis results showed that the expression of CEL was significantly negatively correlated with plasmacytoid dendritic cell, and plasmacytoid dendritic cell were an important link in the initiation of adaptive immune response, participating in the immune inflammatory process of promoting atherosclerosis.44,45 In our study, CEL expression was downregulated in peripheral blood samples from CAD patients, which means that plasmacytoid dendritic cell will be recruited and activated, and promote the occurrence of atherosclerosis, which also confirms the previous view.
CHFR is an E3 ubiquitin-protein ligase, which can be used as a checkpoint to regulate the cell cycle.46 Our research results indicate that the expression of CHFR is downregulated in the peripheral blood of CAD patients. This may affect the DNA damage repair process, leading to vascular endothelial cell damage, thus promoting the occurrence and development of atherosclerosis.47 In addition, CHFR may prolong the half-life of low-density lipoprotein receptor-related protein 1 by preventing its ubiquitination,48 thus affecting the retention and aggregation of low-density lipoprotein. The immune infiltration results showed a significant correlation between CHFR and various immune cell subpopulations, including a significant negative correlation with activated CD4+T cells. This means that the down-regulation of CHFR will lead to the increase of CD4+T activation and play a role in promoting atherosclerosis.49,50 Interestingly, our GSEA results showed that CHFR was also related to the regulation of HMOX1, and HMOX1 may mediate ferroptosis and participate in the progression of atherosclerosis.51 These also provides new insights and evidence for CHFR to become a therapeutic target for CAD.
Interestingly, CCDC28A, LMAN1L and DOK4 were identified for the first time as possibly participating in the CAD process. CCDC28A is a coil domain with proteins, but its specific function has not been determined. As far as we know, it has not been reported to be directly related to CAD, but in our results it was downregulated in the peripheral blood of CAD patients, and significantly related to immune system regulation, cell cycle, intercellular connection and other pathways. Thus, it may be related to the occurrence and development of atherosclerosis, but the specific mechanism is still unclear, and more direct evidence is needed to explore the relationship between this gene and CAD.
Biomarkers in peripheral blood are an effective and noninvasive screening tool for early risk screening and timely progress assessment. The characteristic genes we screened showed good diagnostic efficiency. The AUC values of these genes were >0.5, indicating that they have certain accuracy and specificity in distinguishing CAD samples from normal samples. Finally, it was verified in clinical samples that the expressions of CHFR, CEL and CCDC28A in the peripheral blood of CAD patients were lower, which was consistent with previous research results. In conclusion, these three genes may be potential immune biomarkers of CAD.
Our research had some limitations. Firstly, it was a retrospective study based on public data sets and clinical samples. Prospective cohort studies with a larger sample size are needed to further study the potential of the characteristic genes in predicting disease progression. Secondly, we also have not further quantified these inflammatory cytokines or chemokines related to our findings and explored the specific mechanisms by which they affect CAD. In addition, we need in vitro and in vivo experiments to further explore the immune regulation mechanism of these potential biomarkers involved in CAD.
Conclusion
In this study, we identified five immune-related characteristic genes in the peripheral blood of CAD patients. The results showed that the occurrence and development of CAD may be closely related to immune response and chemokine-mediated signal pathways. Finally, we identified CHFR, CEL and CCDC28A as potential biomarkers of CAD. This research will contribute to the early diagnosis of CAD and customized cardiovascular immunotherapy.
Ethical Statement
The authors are accountable for all aspects of the work in ensuring that questions related to the accuracy or integrity of any part of the work are appropriately investigated and resolved. This study was approved by the Medical Ethics Committee Zhongnan Hospital of Wuhan University (IRB number: 2021009). The patients/participants provided their written informed consent to participate in this study. This study complies with the Declaration of Helsinki.
Acknowledgments
We express our sincere appreciation for the provision of GEO database information online, and we are truly honored to acknowledge the contributions of researchers.
Funding
The study was supported by grants from the National Natural Science Foundation of China (No. 82070425, Zhibing Lu), the Natural Science Foundation of Hubei Province of China (No. 2021CFA011, Zhibing Lu) and the Zhongnan Hospital of Wuhan University Science, Technology and Innovation Seed Fund (No. znpy2019010, Huanhuan Cai).
Disclosure
The authors have no conflicts of interest to declare for this work.
References
1. Sun S, Yu W, Xu H, et al. TBC1D15-Drp1 interaction-mediated mitochondrial homeostasis confers cardioprotection against myocardial ischemia/reperfusion injury. Metabolism. 2022;134:155239. doi:10.1016/j.metabol.2022.155239
2. Guillamat-Prats R, Hering D, Derle A, et al. GPR55 in B cells limits atherosclerosis development and regulates plasma cell maturation. Nat Cardiovasc Res. 2022;1(11):1056–1071. doi:10.1038/s44161-022-00155-0
3. Tu S, He W, Han J, et al. Advances in imaging and treatment of atherosclerosis based on organic nanoparticles. APL Bioeng. 2022;6(4):041501. doi:10.1063/5.0127835
4. Dai Y, Sha X, Song X, et al. Targeted therapy of atherosclerosis vulnerable plaque by ROS-scavenging nanoparticles and MR/fluorescence dual-modality imaging tracing. Int J Nanomedicine. 2022;17:5413–5429. doi:10.2147/IJN.S371873
5. Feinstein MJ, Buzkova P, Olson NC, et al. Monocyte subsets, T cell activation profiles, and stroke in men and women: the Multi-Ethnic Study of Atherosclerosis and Cardiovascular Health Study. Atherosclerosis. 2022;351:18–25. doi:10.1016/j.atherosclerosis.2022.05.007
6. Friebel J, Witkowski M, Wegner M, et al. Cytotoxic CD8(+) T Cells are involved in the thrombo-inflammatory response during first-diagnosed atrial fibrillation. Cells. 2022;12(1):141. doi:10.3390/cells12010141
7. Guieu R, Ruf J, Mottola G. Hyperhomocysteinemia and cardiovascular diseases. Ann Biol Clin. 2022;80(1):7–14. doi:10.1684/abc.2021.1694
8. Zeller J, Bogner B, McFadyen JD, et al. Transitional changes in the structure of C-reactive protein create highly pro-inflammatory molecules: therapeutic implications for cardiovascular diseases. Pharmacol Ther. 2022;235:108165. doi:10.1016/j.pharmthera.2022.108165
9. Saxena P, Selvaraj K, Khare SK, Chaudhary N. Superoxide dismutase as multipotent therapeutic antioxidant enzyme: role in human diseases. Biotechnol Lett. 2022;44(1):1–22. doi:10.1007/s10529-021-03200-3
10. Manaswini N, Sreedevi NN, Thummala S, Saibaba KSS, Mohammed N, Satish OS. Association of serum cyclophilin a levels with severity of coronary artery disease. J Lab Physicians. 2022;14(3):253–259. doi:10.1055/s-0042-1742418
11. Premnath SM, Nanda SK, Ray L, Arokiaraj MC, Ravichandran K. Association of serum pentraxin 3 and high-sensitivity C-reactive protein with severity of coronary stenosis. Int J Appl Basic Med Res. 2022;12(4):249–253. doi:10.4103/ijabmr.ijabmr_203_22
12. Olsen MB, Gregersen I, Sandanger Ø, et al. Targeting the inflammasome in cardiovascular disease. JACC Basic Transl Sci. 2021;7(1):84–98. doi:10.1016/j.jacbts.2021.08.006
13. Lv X, Wang F, Sun M, et al. Differential gene expression and immune cell infiltration in carotid intraplaque hemorrhage identified using integrated bioinformatics analysis. Front Cardiovasc Med. 2022;9:818585. doi:10.3389/fcvm.2022.818585
14. Langfelder P, Horvath S. WGCNA: an R package for weighted correlation network analysis. BMC Bioinform. 2008;9(1):559. doi:10.1186/1471-2105-9-559
15. Wu J, Cai H, Lei Z, et al. Expression pattern and diagnostic value of ferroptosis-related genes in acute myocardial infarction. Front Cardiovasc Med. 2022;9:993592. doi:10.3389/fcvm.2022.993592
16. Castaneda AB, Petty LE, Scholz M, et al. Associations of carotid intima media thickness with gene expression in whole blood and genetically predicted gene expression across 48 tissues. Hum Mol Genet. 2022;31(7):1171–1182. doi:10.1093/hmg/ddab236
17. Yang Y, Wang Z, Xu Y, et al. Knockdown of lncRNA H19 alleviates ox-LDL-induced HCAECs inflammation and injury by mediating miR-20a-5p/HDAC4 axis. Inflamm Res. 2022;71(9):1109–1121. doi:10.1007/s00011-022-01604-z
18. Ritchie ME, Phipson B, Wu D, et al. limma powers differential expression analyses for RNA-sequencing and microarray studies. Nucleic Acids Res. 2015;43(7):e47. doi:10.1093/nar/gkv007
19. Yu G, Wang LG, Han Y, et al. clusterProfiler: an R package for comparing biological themes among gene clusters. OMICS. 2012;16(5):284–287. doi:10.1089/omi.2011.0118
20. Szklarczyk D, Morris JH, Cook H, et al. The STRING database in 2017: quality-controlled protein-protein association networks, made broadly accessible. Nucleic Acids Res. 2017;45(D1):D362–D368. doi:10.1093/nar/gkw937
21. Du J, Boss J, Han P, et al. Variable selection with multiply-imputed datasets: choosing between stacked and grouped methods. J Comput Graph Stat. 2022;31(4):1063–1075. doi:10.1080/10618600.2022.2035739
22. Engebretsen S, Bohlin J. Statistical predictions with glmnet. Clin Epigenetics. 2019;11:123. doi:10.1186/s13148-019-0730-1
23. Hänzelmann S, Castelo R, Guinney J. GSVA: gene set variation analysis for microarray and RNA-seq data. BMC Bioinform. 2013;14(1):7. doi:10.1186/1471-2105-14-7
24. Sharma A, Sharma N, Vats S, et al. Effect of resistance training on body composition, hemodynamic parameters and exercise tolerance among patients with coronary artery disease: a systematic review. Healthcare. 2022;11(1):131. doi:10.3390/healthcare11010131
25. Jang S, Lee MS, Kang SA, et al. Portulaca oleracea L. Extract regulates hepatic cholesterol metabolism via the AMPK/MicroRNA-33/34a pathway in rats fed a high-cholesterol diet. Nutrients. 2022;14(16):3330. doi:10.3390/nu14163330
26. Cong L, Bai Y, Guo Z. The crosstalk among autophagy, apoptosis, and pyroptosis in cardiovascular disease. Front Cardiovasc Med. 2022;9:997469. doi:10.3389/fcvm.2022.997469
27. Jolly AJ, Lu S, Strand KA, et al. Heterogeneous subpopulations of adventitial progenitor cells regulate vascular homeostasis and pathological vascular remodelling. Cardiovasc Res. 2022;118(6):1452–1465. doi:10.1093/cvr/cvab174
28. Lorey MB, Öörni K, Kovanen PT. Modified lipoproteins induce arterial wall inflammation during atherogenesis. Front Cardiovasc Med. 2022;9:841545. doi:10.3389/fcvm.2022.841545
29. Montarello NJ, Nguyen MT, Wong DTL, et al. Inflammation in coronary atherosclerosis and its therapeutic implications. Cardiovasc Drugs Ther. 2022;36(2):347–362. doi:10.1007/s10557-020-07106-6
30. Wen J, Liu C, Deng C. Research progress on the mechanism of aging of vascular endothelial cells and the intervention of traditional Chinese medicine: a review. Medicine. 2022;101(49):e32248. doi:10.1097/MD.0000000000032248
31. Edsfeldt A, Swart M, Singh P, et al. Interferon regulatory factor-5-dependent CD11c+ macrophages contribute to the formation of rupture-prone atherosclerotic plaques. Eur Heart J. 2022;43(19):1864–1877. doi:10.1093/eurheartj/ehab920
32. Mohanta SK, Weber C, Yin C, et al. The Dawn has come for new therapeutics to treat atherosclerosis: targeting neuroimmune cardiovascular interfaces in artery brain circuits. Clin Transl Med. 2022;12(9):e1040. doi:10.1002/ctm2.1040
33. Wang B, Hou X, Sun Y, et al. Interleukin-17A influences the vulnerability rather than the size of established atherosclerotic plaques in apolipoprotein E-deficient mice. Open Life Sci. 2022;17(1):1104–1115. doi:10.1515/biol-2022-0072
34. Wang Q, Wang Y, Xu D. Research progress on Th17 and T regulatory cells and their cytokines in regulating atherosclerosis. Front Cardiovasc Med. 2022;9:929078. doi:10.3389/fcvm.2022.929078
35. Guan T, Emschermann F, Schories C, et al. Platelet SR-PSOX/CXCL16-CXCR6 axis influences thrombotic propensity and prognosis in coronary artery disease. Int J Mol Sci. 2022;23(19):11066. doi:10.3390/ijms231911066
36. Speer T, Dimmeler S, Schunk SJ, et al. Targeting innate immunity-driven inflammation in CKD and cardiovascular disease. Nat Rev Nephrol. 2022;18(12):762–778. doi:10.1038/s41581-022-00621-9
37. Reyes C, Nova-Lamperti E, Duran-Sandoval D, et al. Loxin reduced the inflammatory response in the liver and the aortic fatty streak formation in mice fed with a high-fat diet. Int J Mol Sci. 2022;23(13):7329. doi:10.3390/ijms23137329
38. van Duijn J, de Jong MJM, Benne N, et al. Tc17 CD8+ T cells accumulate in murine atherosclerotic lesions, but do not contribute to early atherosclerosis development. Cardiovasc Res. 2021;117(14):2755–2766. doi:10.1093/cvr/cvaa286
39. Cheng X, Yu X, Ding YJ, et al. The Th17/Treg imbalance in patients with acute coronary syndrome. Clinical Immunology. 2008;127(1):89–97. doi:10.1016/j.clim.2008.01.009
40. Bonacina F, Moregola A, Svecla M, et al. The low-density lipoprotein receptor-mTORC1 axis coordinates CD8+ T cell activation. J Cell Biol. 2022;221(11):e202202011. doi:10.1083/jcb.202202011
41. VanderLaan PA, Reardon CA, Cabana VG, et al. Invariant natural killer T-cells and total CD1d restricted cells differentially influence lipid metabolism and atherosclerosis in low density receptor deficient mice. Int J Mol Sci. 2019;20(18):4566. doi:10.3390/ijms20184566
42. Burchardt P, Zurawski J, Zuchowski B, et al. Low-density lipoprotein, its susceptibility to oxidation and the role of lipoprotein-associated phospholipase A2 and carboxyl ester lipase lipases in atherosclerotic plaque formation. Arch Med Sci. 2013;9:151–158. doi:10.5114/aoms.2013.33176
43. Hui DY, Howles PN. Carboxyl ester lipase: structure-function relationship and physiological role in lipoprotein metabolism and atherosclerosis. J Lipid Res. 2002;43(12):2017–2030. doi:10.1194/jlr.R200013-JLR200
44. Hernández SS, Jakobsen MR, Bak RO. Plasmacytoid Dendritic Cells as a Novel Cell-Based Cancer Immunotherapy. Int J Mol Sci. 2022;23(19):11397. doi:10.3390/ijms231911397
45. Kloc M, Kubiak JZ, Ghobrial RM. Macrophage-, dendritic-, smooth muscle-, endothelium-, and stem cells-derived foam cells in atherosclerosis. Int J Mol Sci. 2022;23(22):14154. doi:10.3390/ijms232214154
46. Liu C, Wu J, Paudyal SC, et al. CHFR is important for the first wave of ubiquitination at DNA damage sites. Nucleic Acids Res. 2013;41(3):1698–1710. doi:10.1093/nar/gks1278
47. Kashima L, Idogawa M, Mita H, et al. CHFR protein regulates mitotic checkpoint by targeting PARP-1 protein for ubiquitination and degradation. J Biol Chem. 2012;287(16):12975–12984. doi:10.1074/jbc.M111.321828
48. Cal R, García-Arguinzonis M, Revuelta-López E, et al. Aggregated low-density lipoprotein induces LRP1 stabilization through E3 ubiquitin ligase CHFR downregulation in human vascular smooth muscle cells. Arterioscler Thromb Vasc Biol. 2013;33(2):369–377. doi:10.1161/ATVBAHA.112.300748
49. Saigusa R, Winkels H, Ley K. T cell subsets and functions in atherosclerosis. Nat Rev Cardiol. 2020;17(7):387–401. doi:10.1038/s41569-020-0352-5
50. Vallejo J, Cochain C, Zernecke A, Ley K. Heterogeneity of immune cells in human atherosclerosis revealed by scRNA-Seq. Cardiovasc Res. 2021;117(13):2537–2543. doi:10.1093/cvr/cvab260
51. Meng Z, Liang H, Zhao J, et al. HMOX1 upregulation promotes ferroptosis in diabetic atherosclerosis. Life Sci. 2021;284:119935. doi:10.1016/j.lfs.2021.119935
 © 2023 The Author(s). This work is published and licensed by Dove Medical Press Limited. The
full terms of this license are available at https://www.dovepress.com/terms
and incorporate the Creative Commons Attribution
- Non Commercial (unported, 3.0) License.
By accessing the work you hereby accept the Terms. Non-commercial uses of the work are permitted
without any further permission from Dove Medical Press Limited, provided the work is properly
attributed. For permission for commercial use of this work, please see paragraphs 4.2 and 5 of our Terms.
© 2023 The Author(s). This work is published and licensed by Dove Medical Press Limited. The
full terms of this license are available at https://www.dovepress.com/terms
and incorporate the Creative Commons Attribution
- Non Commercial (unported, 3.0) License.
By accessing the work you hereby accept the Terms. Non-commercial uses of the work are permitted
without any further permission from Dove Medical Press Limited, provided the work is properly
attributed. For permission for commercial use of this work, please see paragraphs 4.2 and 5 of our Terms.
Recommended articles
Analysis and Validation of Critical Signatures and Immune Cell Infiltration Characteristics in Doxorubicin-Induced Cardiotoxicity by Integrating Bioinformatics and Machine Learning
Huang C, Pei J, Li D, Liu T, Li Z, Zhang G, Chen R, Xu X, Li B, Lian Z, Chu XM
Journal of Inflammation Research 2024, 17:669-685
Published Date: 2 February 2024
Bioinformatics Analysis and Experimental Validation of Mitochondrial Autophagy Genes in Knee Osteoarthritis
Tang K, Sun L, Chen L, Feng X, Wu J, Guo H, Zheng Y
International Journal of General Medicine 2024, 17:639-650
Published Date: 23 February 2024
Cuproptosis-Related Biomarkers and Characterization of Immune Infiltration in Sepsis
Wang Y, Qiu X, Liu J, Liu X, Pan J, Cai J, Liu X, Qu S
Journal of Inflammation Research 2024, 17:2459-2478
Published Date: 22 April 2024
Machine Learning-Based Predictive Modeling of Diabetic Nephropathy in Type 2 Diabetes Using Integrated Biomarkers: A Single-Center Retrospective Study
Zhu Y, Zhang Y, Yang M, Tang N, Liu L, Wu J, Yang Y
Diabetes, Metabolic Syndrome and Obesity 2024, 17:1987-1997
Published Date: 10 May 2024
Comprehensive Analysis of Programmed Cell Death-Related Genes in Diagnosis and Synovitis During Osteoarthritis Development: Based on Bulk and Single-Cell RNA Sequencing Data
Zhou J, Jiao S, Huang J, Dai T, Xu Y, Xia D, Feng Z, Chen J, Li Z, Hu L, Meng Q
Journal of Inflammation Research 2025, 18:751-778
Published Date: 17 January 2025