Back to Journals » Risk Management and Healthcare Policy » Volume 19
Machine Learning–Based Early Prediction of Lower Extremity Deep Vein Thrombosis in the ICU: A Multicenter Study
Received 13 March 2026
Accepted for publication 14 May 2026
Published 25 May 2026 Volume 2026:19 603569
DOI https://doi.org/10.2147/RMHP.S603569
Checked for plagiarism Yes
Review by Single anonymous peer review
Peer reviewer comments 3
Editor who approved publication: Professor Mecit Can Emre Simsekler
Yang Li,1 Ling Xu,1 Yunfeng Chen2
1Department of Intensive Care Medicine, Taixing People’s Hospital, Taixing, Jiangsu, People’s Republic of China; 2Department of Ultrasound, Nanjing Gaochun People’s Hospital, Nanjing, Jiangsu, People’s Republic of China
Correspondence: Ling Xu, Department of Intensive Care Medicine, Taixing People’s Hospital, No. 1 Changzheng Road; No. 98 Runtaisouth Road, Taixing City, Jiangsu Province, 225400, People’s Republic of China, Email [email protected]
Purpose: Deep vein thrombosis (DVT) is a prevalent and life-threatening complication in the Intensive Care Unit (ICU). Traditional risk tools often lack specificity for ICU acquired DVT. This study aimed to develop and externally validate an interpretable machine learning (ML) model for accurate DVT risk prediction in critically ill patients.
Methods: This multicenter retrospective study included 2000 patients from two centers, partitioned into training, internal testing, and external validation sets. LASSO regression and the Boruta algorithm identified robust predictors. Eight ML algorithms were trained and evaluated using the Area Under the Curve (AUC), calibration plots, and Decision Curve Analysis (DCA). The SHapley Additive exPlanations (SHAP) framework was utilized for model interpretability.
Results: The Random Forest (RF) model outperformed other ML algorithms and traditional tools (e.g. Caprini score). It achieved AUCs of 0.869 (95% CI: 0.822– 0.916) in training, 0.850 (95% CI: 0.801– 0.900) in internal testing, and 0.831 (95% CI: 0.771– 0.888) in external validation. SHAP analysis identified six dominant predictors: immobilization duration, D-dimer, femoral vein catheterization, APACHE II score, malignancy, and age. The RF model successfully captured non-linear interactions, particularly exponential risk increases from prolonged immobilization and elevated D-dimer. DCA demonstrated a higher net clinical benefit than default strategies.
Conclusion: Integrating six readily available clinical variables, the RF model offers a robust and interpretable tool for DVT risk stratification, outperforming traditional scores. To facilitate real-world clinical application, an accessible web-based calculator is being developed to guide early, personalized thromboprophylaxis in the ICU.
Keywords: deep vein thrombosis, intensive care units, machine learning, risk prediction, random forest
Introduction
Deep vein thrombosis (DVT) represents one of the most frequent and potentially fatal complications in the intensive care unit (ICU). Despite the widespread implementation of pharmacological and mechanical thromboprophylaxis guidelines, the incidence of DVT in critically ill patients remains alarmingly high, ranging from 5% to over 30% depending on the diagnostic screening methods used.1,2 The consequences of missed or delayed diagnosis are severe. DVT can progress to lethal pulmonary embolism (PE), which is a leading cause of preventable hospital death.3 Furthermore, even non-fatal thrombotic events are associated with prolonged mechanical ventilation, extended ICU length of stay, and long-term sequelae such as post-thrombotic syndrome.4 Therefore, early and accurate identification of high-risk patients is paramount to optimize preventive strategies and allocate healthcare resources effectively.5
Current approaches to DVT risk stratification in the ICU rely heavily on traditional scoring systems, such as the Caprini Risk Assessment Model and the Wells score. However, these tools exhibit significant limitations when applied to the critically ill population. The Caprini score, originally designed for general surgical patients, comprises over 40 variables, making it cumbersome for daily bedside assessment.6 Moreover, because most ICU patients inherently possess multiple risk factors such as immobilization, central venous catheterization, and mechanical ventilation, the Caprini score often suffers from a “ceiling effect,” categorizing nearly all patients as high-risk and thereby diminishing its discriminatory power.7 Similarly, the Wells score depends heavily on subjective symptoms like localized tenderness or pain, which are often unassessable in sedated, comatose, or mechanically ventilated patients.8 Consequently, there is an urgent need for an objective, data-driven, and ICU-specific prediction tool.
In recent years, machine learning (ML) has emerged as a powerful alternative to conventional statistical methods for medical risk prediction.9 Unlike logistic regression or additive scoring systems which assume linear relationships between variables and outcomes, ML algorithms can process high-dimensional data and identify complex, non-linear interactions among risk factors.10 Despite their superior predictive performance, complex ML models are often criticized as “black boxes” because their decision-making processes are opaque to clinicians.11 This lack of transparency hinders their integration into clinical practice, as physicians need to understand the physiological basis behind a risk prediction to trust and act upon it. To address this challenge, the SHapley Additive exPlanations (SHAP) framework has been introduced to provide interpretability, allowing for the visualization of how individual features contribute to model predictions.
In this multicenter retrospective study, we aimed to develop and validate an interpretable machine learning model for the prediction of ICU-acquired DVT. By leveraging a comprehensive dataset from two independent medical centers, we employed a rigorous feature selection strategy utilizing both LASSO regression and the Boruta algorithm to identify the most robust predictors. We compared the performance of multiple machine learning algorithms, specifically highlighting the Random Forest model, against standard logistic regression and traditional clinical scores. Furthermore, we integrated SHAP analysis to visually elucidate the impact of key risk factors, thereby ensuring that the model is not only accurate but also clinically transparent and actionable for intensivists. While machine learning models exhibit excellent predictive performance, their clinical adoption is often hindered by complexity. Therefore, this study aimed not only to develop a robust machine learning model for predicting DVT risk but also to translate this model into a user-friendly web-based calculator for bedside decision-making.
Materials and Methods
Inclusion and Exclusion Criteria
This retrospective cohort study utilized data extracted from the electronic medical records systems of two medical centers in China. A total of 1,500 critically ill patients were consecutively enrolled from Taixing People’s Hospital between January 1, 2020, and October 31, 2025. These patients were randomly divided into a training cohort (n = 1,050) and an internal testing cohort (n = 450) at a ratio of 7:3 using stratified random sampling based on DVT status, in order to maintain a similar proportion of DVT-positive and DVT-negative patients in both subsets. To evaluate the generalizability of the model, an independent external validation cohort including 500 patients who met the same eligibility criteria was collected from Nanjing Gaochun People’s Hospital during the same study period.
Patients were eligible for inclusion if they met the following criteria: (1) aged 18 years or older; (2) were admitted to the Intensive Care Unit (ICU) for critical care management; (3) received routine lower extremity venous ultrasonography screening during their ICU stay to detect asymptomatic deep vein thrombosis (DVT); and (4) had complete clinical records, including baseline demographic data, APACHE II scores, and relevant laboratory biomarkers.
Patients were excluded if they had: (1) evidence of DVT or pulmonary embolism confirmed by ultrasonography or other imaging modalities on admission or within the first 24 hours of ICU admission; (2) received full-dose therapeutic anticoagulation or thrombolytic therapy prior to admission for pre-existing conditions; (3) an ICU length of stay of less than 48 hours, as short-term stays preclude the accurate assessment of immobilization duration; or (4) incomplete essential clinical data, such as missing D-dimer levels or coagulation profiles. Repeated ICU admissions of the same individual were excluded to avoid duplication, and only the data from the first qualifying admission were retained for analysis.
All patient data were anonymized before analysis to ensure confidentiality. The study protocol was reviewed and approved by the Institutional Review Board of the Ethics Committee of Taixing People’s Hospital (Approval No. EC-2026-002), and the requirement for informed consent was waived due to the retrospective nature of the study.
Data Collection
Clinical data were retrospectively extracted from the Electronic Medical Record (EMR) systems of the participating hospitals. Two independent researchers performed the data collection using a standardized case report form.The collected variables covered the following domains based on the patients’ status upon or during ICU admission:
Baseline characteristics included age, gender, body mass index (BMI), and smoking history. We also recorded relevant comorbidities and medical history, specifically hypertension, diabetes mellitus, malignancy, history of VTE (DVT/PE), and any recent trauma or surgery prior to ICU admission. Severity of illness was assessed using the APACHE II score (calculated within the first 24 hours). ICU-specific interventions and status indicators included the use of mechanical ventilation, vasopressor use, and sedation or neuromuscular blockade. We specifically noted the presence of invasive lines, including central venous catheters (CVC) and femoral vein catheterization. Specifically, the duration of immobilization was defined as the total number of consecutive days of bed rest without active ambulation, calculated from the date of ICU admission to the date of the lower extremity venous ultrasound screening. Other key clinical factors recorded were the diagnosis of sepsis, and the administration of anticoagulant prophylaxis. Due to the retrospective nature of this study, specific details such as the exact dosage and timing of initiation for low molecular weight heparin were not strictly standardized across the two centers; thus, prophylaxis was recorded as a binary categorical variable (Yes/No). For all laboratory parameters, including coagulation profiles (APTT and D-dimer), the first measurement obtained within 24 hours of ICU admission was extracted to represent the patient’s baseline physiological status. Serial measurements taken later during the ICU stay or at the time of ultrasound screening were not averaged or utilized for model input, as our objective was strictly to construct an early prediction model based on initial admission characteristics. Data completeness was assessed before model development. Patients with missing essential variables required for outcome definition or model construction, including ultrasound results, D-dimer levels, coagulation profiles, and APACHE II scores, were excluded before cohort partitioning. No imputation was performed, as all six final predictors were complete in the analytic cohort. This complete-case approach was used to avoid uncertainty from imputed values for key clinical predictors and outcome-related variables.
The primary endpoint of this study was the development of ICU-acquired deep vein thrombosis (DVT) during the hospital stay. To ensure the detection of both symptomatic and asymptomatic thrombotic events, a systematic screening protocol was implemented. All enrolled patients underwent routine color Doppler ultrasound examinations of both lower extremities. These examinations were performed by experienced sonographers using a high-resolution ultrasound system equipped with a linear array transducer (frequency 5–10 MHz).12 The screening protocol included: (1) initial screening: performed within 48 to 72 hours of ICU admission to establish a baseline; (2) surveillance: repeated every 2–3 days during the ICU stay, or immediately upon clinical suspicion.13
The diagnostic criteria for DVT were based on standard imaging guidelines, defined as: (1) non-compressibility of the venous segment under probe pressure (the most specific sign); (2) direct visualization of an intraluminal filling defect or thrombus; and (3) absence of spontaneous venous flow or lack of flow augmentation.14,15 The assessment covered the entire deep venous system of the lower limbs, including the common femoral, superficial femoral, popliteal, and calf veins. To minimize observer bias, the sonographers and radiologists interpreting the images were blinded to the patients’ predictor variables and the specific aims of this prediction model study.
Model Construction and Validation
Data Partitioning and Feature Screening Strategy
To facilitate model training and internal validation, the dataset from Hospital A was partitioned into a training set (n = 1,050) and an internal testing set (n = 450) using a stratified random sampling method at a 7:3 ratio. All feature engineering and selection processes were strictly confined to the training set to eliminate the risk of data leakage. Given the potential complexity and high dimensionality of the clinical parameters, a robust intersection approach was employed to isolate the most critical predictors for DVT. Initially, the Least Absolute Shrinkage and Selection Operator (LASSO) regression was utilized. A 10-fold cross-validation procedure was performed to identify the optimal penalty coefficient lambda, effectively shrinking the coefficients of non-informative variables to zero. Concurrently, the Boruta algorithm, a wrapper method built around the Random Forest classifier, was applied to discern relevant features by comparing their importance against randomized shadow attributes. Ultimately, only the variables identified as significant by both LASSO and Boruta were retained as the final candidate predictors. Following feature selection, Spearman’s rank correlation analysis was conducted to assess inter-variable relationships, and a correlation matrix heatmap was generated to detect and exclude any features exhibiting high multicollinearity. To ensure full reproducibility of the computational workflow, a fixed random seed of 123 was used for data partitioning, whereas a seed of 42 was consistently applied for machine learning model training and cross-validation procedures.
Machine Learning Algorithm Implementation
To capture both linear and complex non-linear interactions among the selected predictors, eight distinct machine learning algorithms were implemented and compared: Logistic Regression, Decision Tree, Random Forest, Support Vector Machine, K-Nearest Neighbors, Naive Bayes, Extreme Gradient Boosting, and Light Gradient Boosting Machine. Model optimization was achieved through a rigorous Grid Search technique to fine-tune the hyperparameters for each algorithm. To ensure the generalizability of the training process, a five-fold cross-validation scheme was applied. The performance of these models was systematically benchmarked using multiple metrics, including the Area Under the Receiver Operating Characteristic Curve (AUC), accuracy, sensitivity, specificity, precision, and the F1-score. The algorithm exhibiting the highest overall performance in the training phase was designated as the optimal model for subsequent validation. To ensure the optimal performance and reproducibility of the Random Forest model, hyperparameter tuning was conducted using Grid Search with 5-fold cross-validation. The specific parameter search space is detailed in Supplementary Table S1.
Comprehensive Model Evaluation
The predictive robustness of the optimal model was rigorously tested in the internal testing cohort (n = 450) and the independent external validation cohort from Nanjing Gaochun People’s Hospital (n = 500). Evaluation was conducted across three key dimensions. First, discrimination was quantified using Receiver Operating Characteristic (ROC) curves and AUC values to measure the model’s ability to distinguish between patients with and without DVT. Second, calibration was assessed using calibration plots to visualize the agreement between predicted probabilities and observed frequencies. Third, Decision Curve Analysis (DCA) was performed to evaluate clinical utility by calculating the net benefit of the model across a range of threshold probabilities compared to default intervention strategies. To further verify the stability of the model’s performance in unseen data, five-fold cross-validation was also executed within both the testing and external validation cohorts.
Model Interpretability
To overcome the opaque nature of complex machine learning models and facilitate clinical adoption, the SHapley Additive exPlanations (SHAP) framework was utilized. A SHAP summary plot was generated to rank the features based on their overall contribution to the model’s output and to visualize the directional impact of each variable on the risk prediction. Additionally, SHAP waterfall plots were constructed for representative individual cases. These plots decompose the prediction score, illustrating how specific patient characteristics contributed to the final risk probability, thereby providing transparent support for personalized clinical decision-making.
Statistical Analyses
All statistical analyses and data visualizations were performed using R (version 4.4.2). Continuous variables were assessed for normality via the Shapiro–Wilk test. Normally distributed data are presented as mean ± standard deviation, with group comparisons conducted using Student’s t-tests. Non-normally distributed variables are expressed as median and interquartile range [M (Q1, Q3)] and analyzed via the Mann–Whitney U-test. Categorical variables are reported as frequencies (percentages) and evaluated using Chi-square tests or Fisher’s exact tests (for cell counts <5). Statistical significance was defined as a two-tailed p-value < 0.05. To facilitate the clinical application of our final Random Forest model, an interactive web application was constructed. The web-based calculator was developed using the shiny and bslib packages in R software, providing a graphical user interface for real-time risk stratification based on individual patient characteristics.
Result
Basic Characteristics of the Patients
A total of 2,000 critically ill patients were included in the final analysis, comprising 1,050 in the training cohort, 450 in the internal testing cohort, and 500 in the external validation cohort. The baseline demographic, clinical, and laboratory characteristics are summarized in Table 1. As shown, the cohorts were well-balanced, with no statistically significant differences observed in key variables, including age (P=0.084), BMI (P=0.126), APACHE II scores (P=0.067), or comorbidities (all P>0.05). Importantly, the prevalence of the primary outcome, lower extremity deep vein thrombosis (DVT), was comparable across the training (16.0%), testing (14.4%), and validation (16.8%) cohorts (P=0.582). This lack of significant heterogeneity confirms that the data splitting was random and that the datasets were representative, providing a robust foundation for model development and validation. Regarding initial thromboembolism prophylaxis, out of the 2,000 patients in our cohort, 850 patients received pharmacological prophylaxis, 450 patients received mechanical prophylaxis, 550 received a combination of both, and 150 patients did not receive any form of prophylaxis upon ICU admission. To better contextualize our study population, we categorized patients based on their primary diagnoses upon ICU admission, as summarized in Supplementary Table S2. In our cohort of 2,000 patients, 640 patients (32.0%) were hospitalized primarily for severe respiratory conditions. Cardiac diseases accounted for 480 admissions (24.0%). Among these cardiac patients, 260 were admitted for ischemic heart disease, 120 for arrhythmic events, and 100 for other cardiac-related issues. The remaining cohort included patients admitted for sepsis, severe neurological disorders, and postoperative intensive monitoring, comprising 360 (18.0%), 280 (14.0%), and 240 (12.0%) patients, respectively. Furthermore, reflecting the high clinical acuity of our study population, 1040 patients (52.0%) required intubation and mechanical ventilation during their ICU stay.
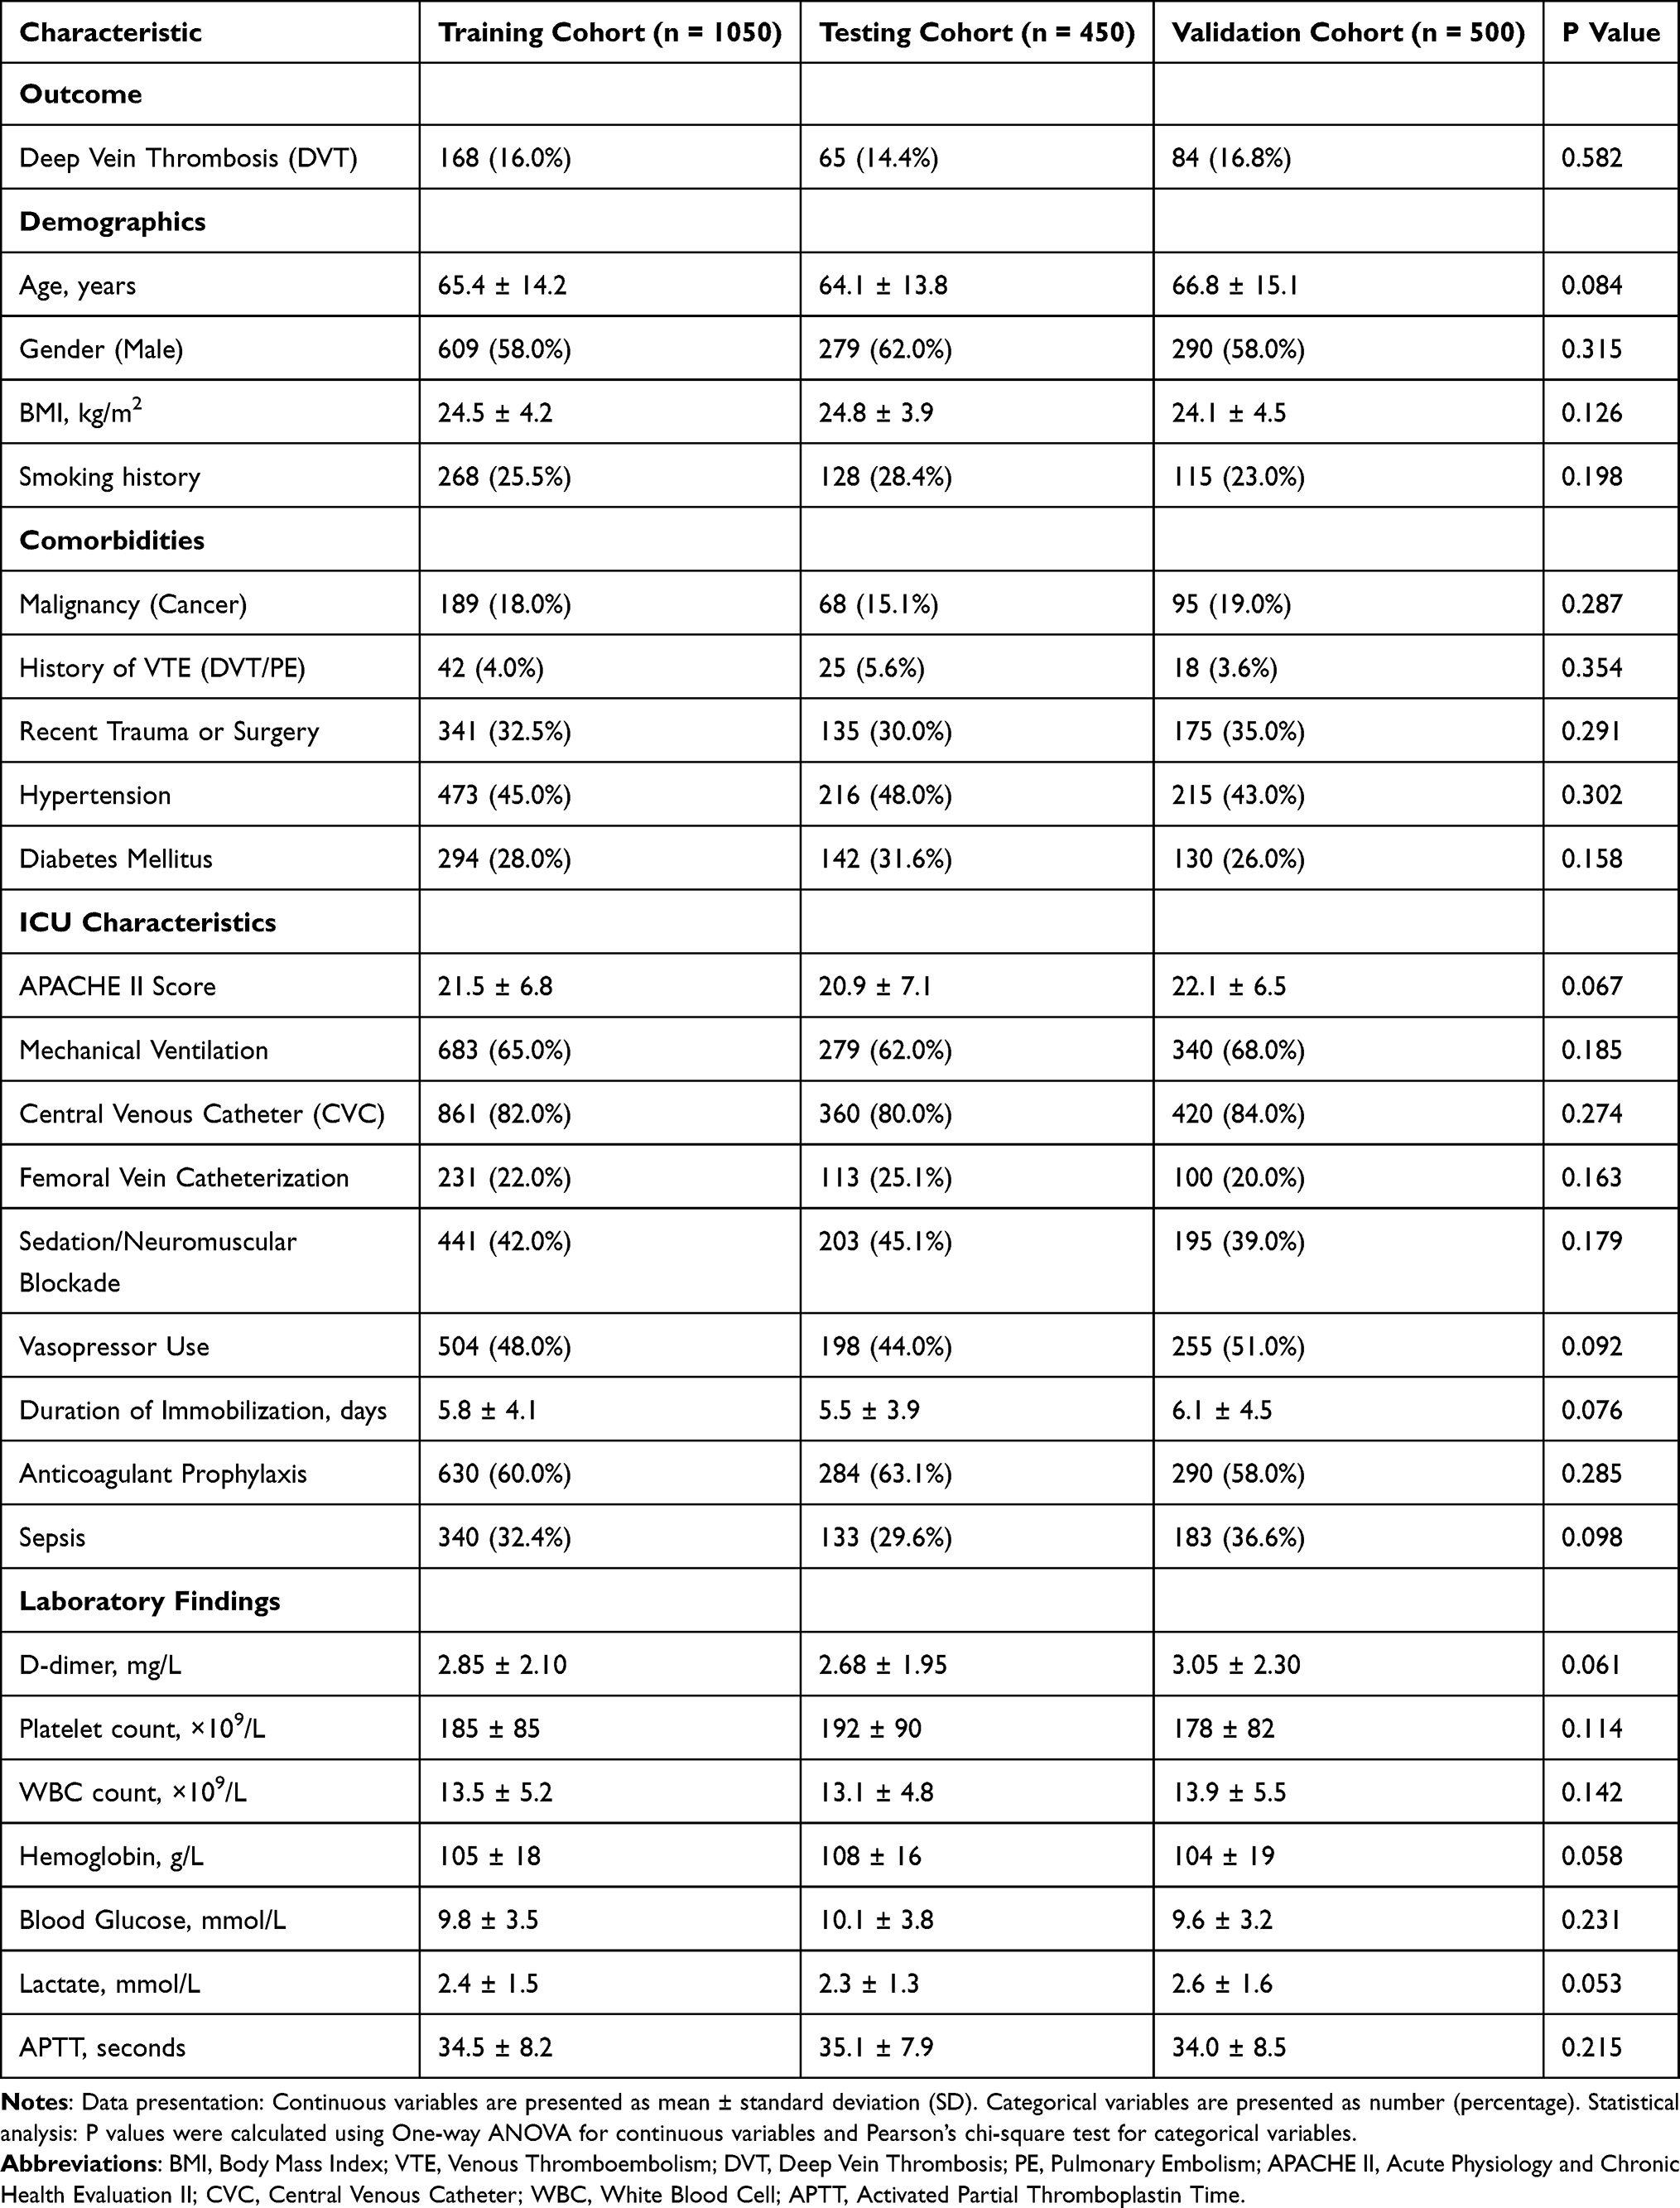 |
Table 1 Baseline Characteristics of Patients in the Training, Testing, and Validation Cohorts |
To standardize the data for the machine learning analysis, twenty-five candidate variables were formatted and assigned specific values as detailed in Table 2. Unlike traditional scoring systems that often dichotomize all data, we retained eleven variables as continuous parameters to preserve information granularity. These included demographic factors (Age, BMI), clinical scores (APACHE II), duration of immobilization, and specific laboratory markers. The remaining fourteen variables were encoded as binary categories. Generally, the presence of a specific risk factor, intervention, or medical history was assigned a value of 1, while the absence was assigned a value of 0. For instance, ICU-specific interventions such as Mechanical Ventilation, Central Venous Catheterization, and Vasopressor Use were dichotomized based on their usage (Yes = 1 vs. No = 0). Similarly, categorical demographics and comorbidities, including Gender (Male = 1), Smoking History (Current = 1), and Malignancy (Yes = 1), were coded logically for algorithmic processing.
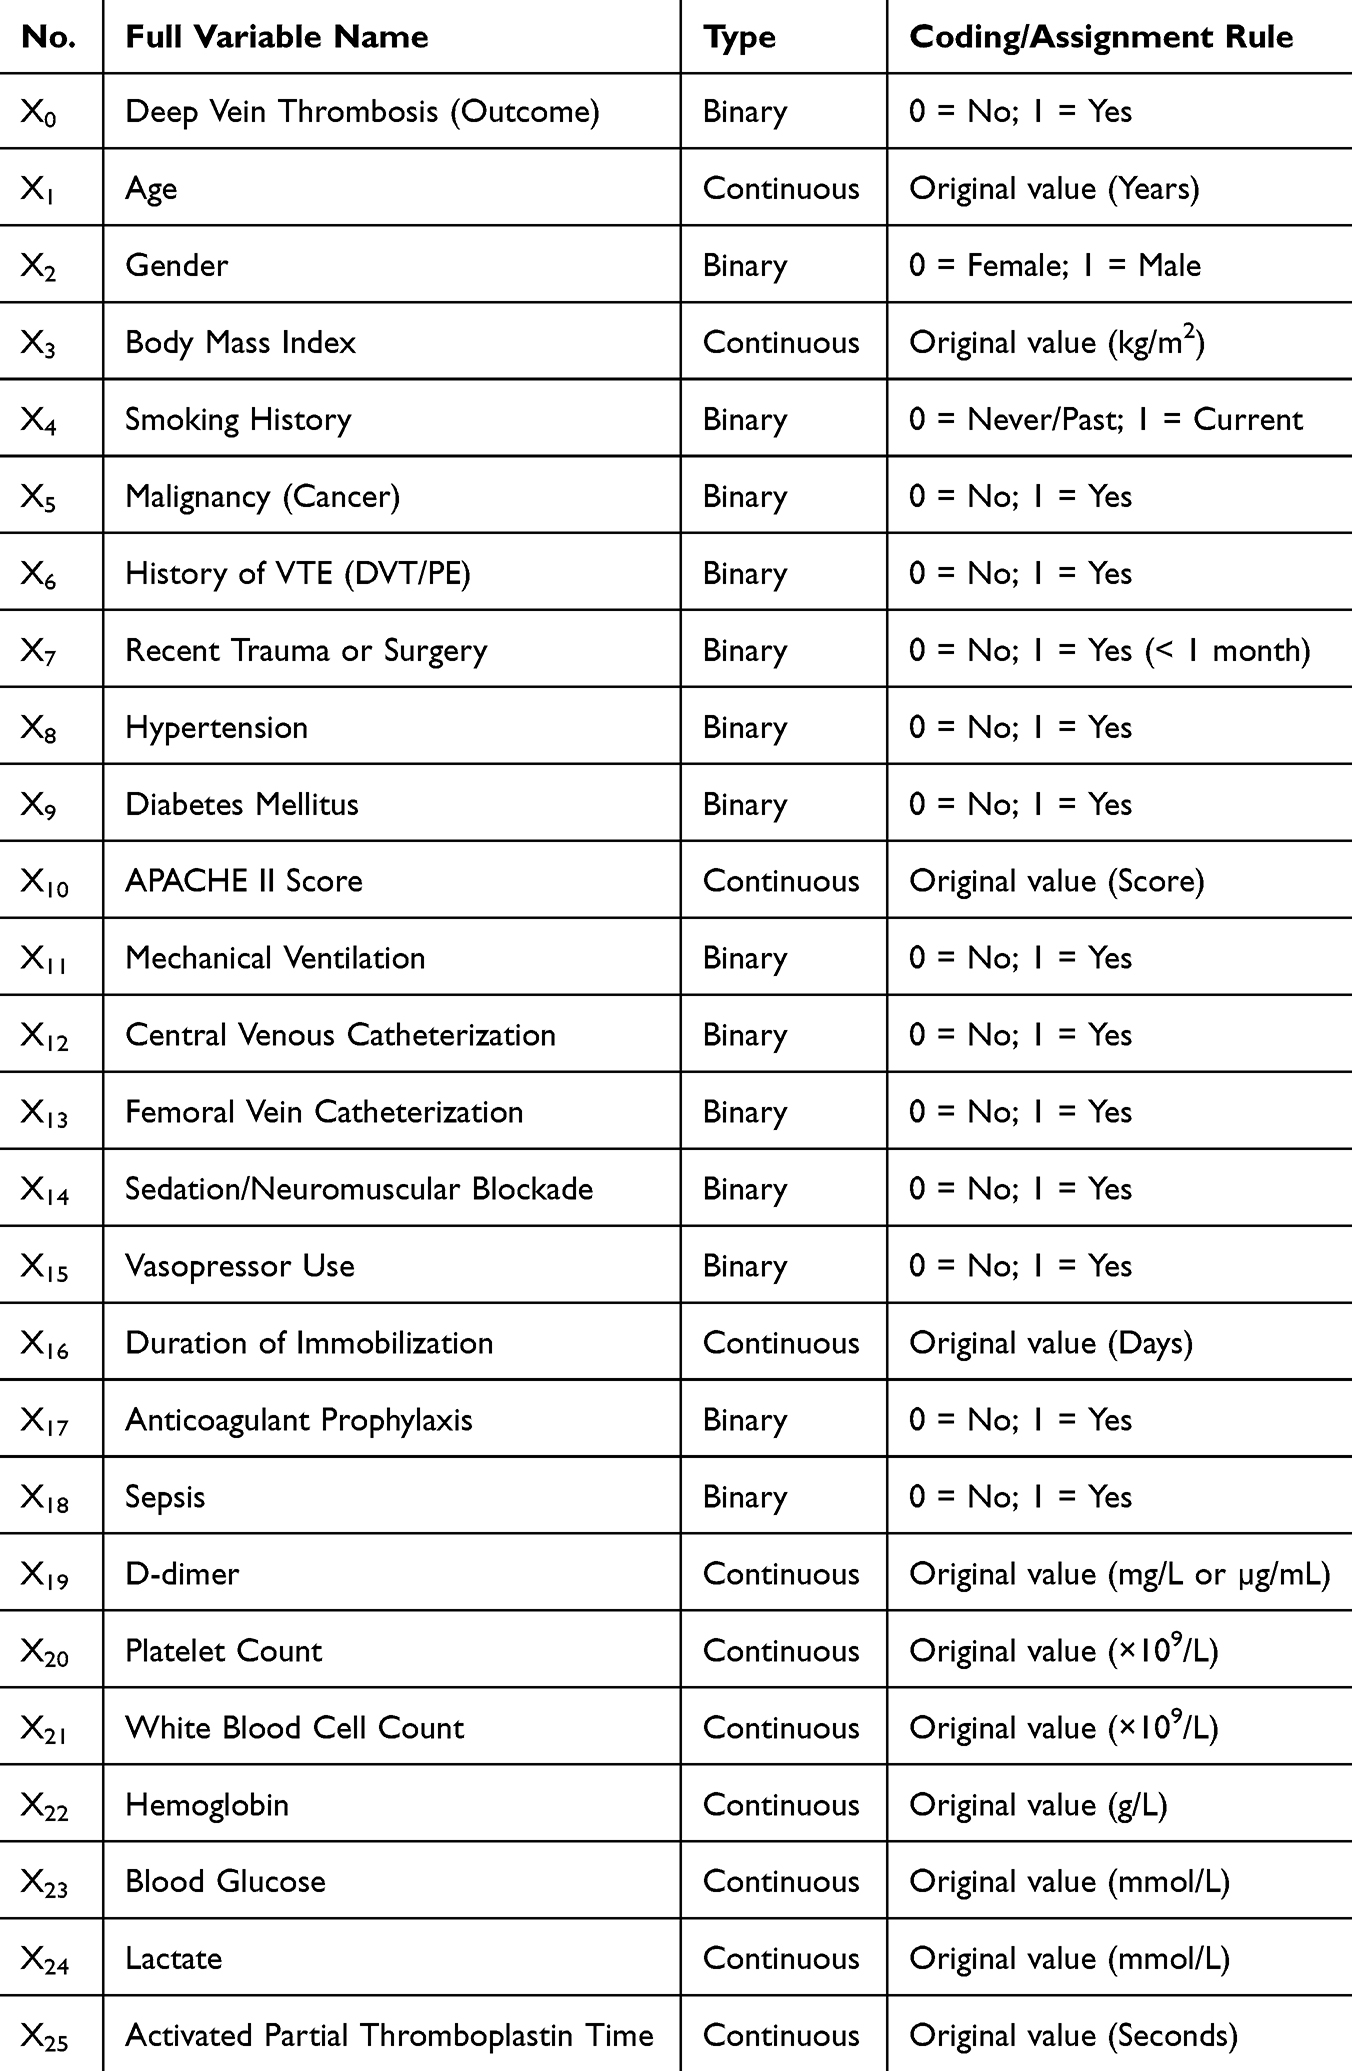 |
Table 2 Variable Assignments |
Feature Selection
To minimize overfitting and identify the most robust predictors for lower extremity deep vein thrombosis (DVT), a dual-method feature selection strategy combining LASSO regression and the Boruta algorithm was implemented.
Initially, the LASSO regression analysis was performed on the training cohort to screen the 25 candidate variables. Figure 1A illustrates the coefficient profiles of the features against the log-lambda sequence, showing how coefficients converge to zero as the penalty increases. The optimal tuning parameter (λ) was determined using 10-fold cross-validation with the minimum binomial deviance criterion. As shown in Figure 1B, the vertical dashed lines represent the optimal λ values (minimum and 1-standard error), resulting in the selection of 8 potential non-zero coefficient variables.
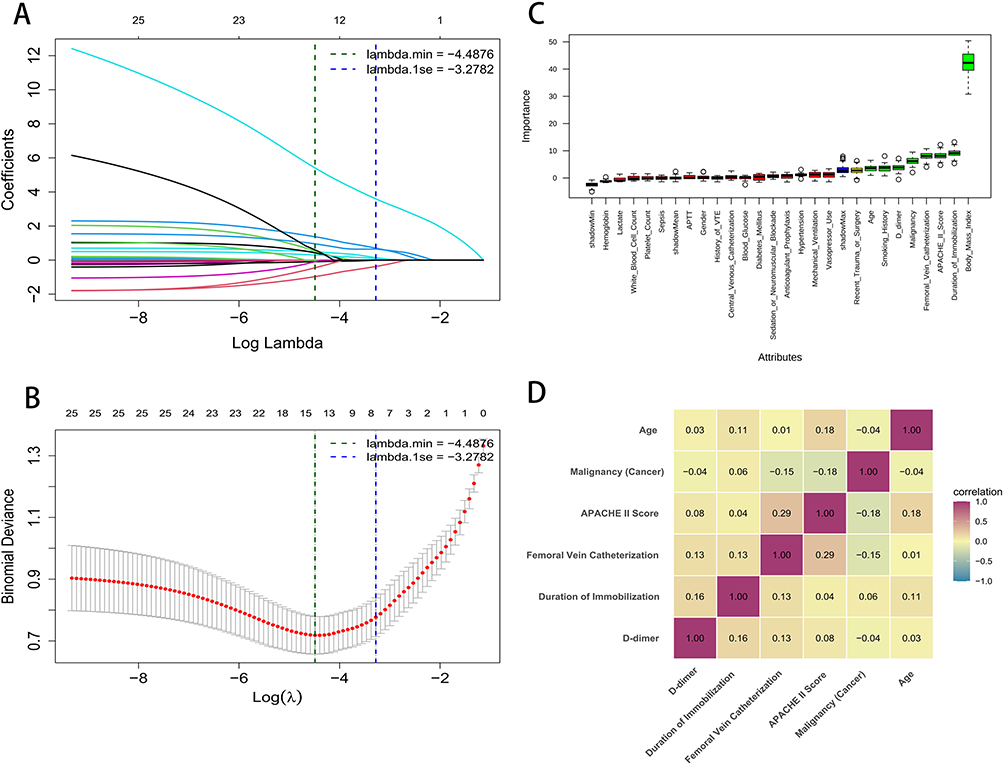 |
Figure 1 Feature selection and correlation analysis. (A) LASSO coefficient profiles of candidate variables. (B) Tuning parameter (λ) selection in the LASSO model using 10-fold cross-validation. Vertical lines indicate the minimum error (left) and 1-standard error (right). (C) Feature importance ranking by Boruta algorithm. Green boxplots denote confirmed important features relative to shadow features. (D) Heatmap of Spearman correlation coefficients among the final selected features. |
To corroborate these findings and ensure feature stability, the Boruta algorithm, a random forest-based wrapper method, was subsequently employed. This method evaluates the importance of features by comparing them against randomized “shadow” attributes. As depicted in Figure 1C, the algorithm confirmed 8 features as statistically significant (shown in green), which performed better than the maximum shadow attribute (shadowMax).
Finally, to construct a parsimonious and clinically applicable model, we extracted the intersection of the variables identified by both the LASSO and Boruta algorithms. This rigorous screening process yielded a final set of six key predictors: Age, Malignancy, APACHE II Score, Femoral Vein Catheterization, Duration of Immobilization, and D-dimer. To assess the independence of these selected features, a Pearson correlation analysis was conducted (Figure 1D). The correlation heatmap demonstrated that the pairwise correlation coefficients between all six variables were low (all |r|<0.30), indicating the absence of significant multicollinearity. Consequently, these six independent predictors were included in the final multivariable modeling.
Model Development and Performance
Based on the six selected features, eight distinct machine learning algorithms (DT, KNN, LGBM, LR, NB, RF, SVM, and XGB) were trained and evaluated. The discriminatory ability of each model was assessed using the Receiver Operating Characteristic (ROC) curves, as illustrated in Figure 2A. Among all tested algorithms, the Random Forest (RF) model exhibited superior performance, achieving the highest Area Under the Curve (AUC) of 0.869 (95% CI: 0.822–0.916). This was followed by the KNN (AUC = 0.758) and XGB (AUC = 0.719) models, while the LGBM model showed the lowest discriminative power with an AUC of 0.583. The comparative performance of these models is further visualized in the lollipop plot in Figure 2B, which clearly highlights the dominance of the RF model over other classifiers.
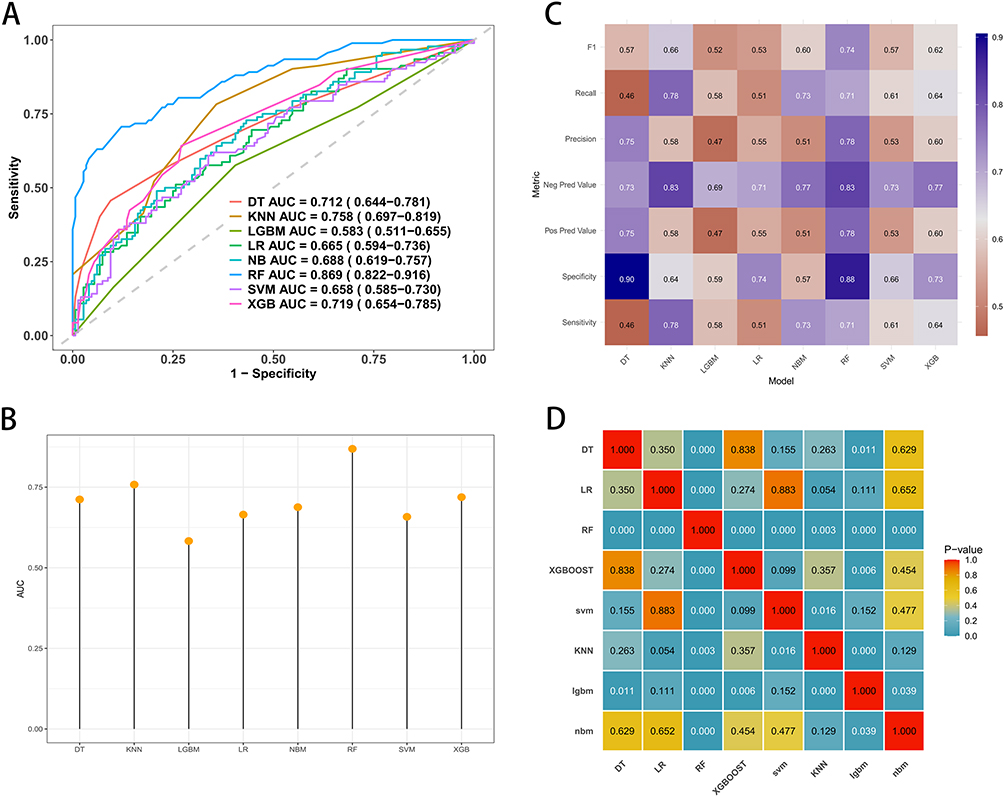 |
Figure 2 Comparison of different machine learning models in the training cohort. (A) ROC curves with corresponding AUC values and 95% confidence intervals. (B) Heatmap of P-values derived from DeLong’s test for pairwise comparisons of AUCs between models. (C) Bar plot summarizing the AUC scores for each classifier. (D) Comprehensive evaluation heatmap displaying multiple performance metrics (Sensitivity, Specificity, F1-score, etc.) across all models. |
To provide a more comprehensive evaluation of clinical utility, we analyzed multiple performance metrics including Sensitivity, Specificity, Precision, F1-score, and Predictive Values, as depicted in the heatmap in Figure 2C. The RF model not only achieved the highest F1-score (0.74), indicating a robust balance between precision and recall, but also demonstrated a high Specificity (0.88) and Precision (0.78). In contrast, while the KNN model showed the highest Sensitivity (0.78), its Specificity was notably lower (0.64), potentially leading to a higher rate of false positives. Similarly, the DT model showed excellent Specificity (0.90) but poor Sensitivity (0.46). Consequently, the RF model was identified as the optimal classifier due to its balanced and robust performance across all evaluation metrics.
Finally, to ensure that the superiority of the RF model was not due to random chance, we performed pairwise comparisons of the AUCs using the DeLong test. The resulting P-value matrix is presented in Figure 2D. The statistical analysis confirmed that the RF model significantly outperformed the other algorithms, including LGBM, SVM, and DT, with P-values < 0.05 (indicated by the distinct color blocks in the matrix). Furthermore, to validate the superiority of advanced machine learning algorithms, we conducted a direct head-to-head comparison between the optimal Random Forest (RF) model and the Logistic Regression (LR) model, which serves as the traditional gold standard statistical method in clinical research. Using the same set of 6 key predictors, the RF model significantly outperformed the LR model across all primary metrics. Specifically, the RF model achieved a higher AUC (0.869 vs. 0.665), sensitivity (0.71 vs. 0.51), and specificity (0.88 vs. 0.74) compared to the traditional LR approach. Delong’s test confirmed that this improvement in predictive discrimination was statistically significant (P < 0.001), highlighting the necessity of utilizing tree-based algorithms to capture complex, non-linear clinical interactions.Although the difference between RF and some models varied, the overall statistical trend reinforces the Random Forest algorithm as the most reliable tool for predicting DVT in this ICU cohort. The final specific hyperparameter values for the optimal Random Forest model were determined and are summarized in Supplementary Table S1.
Model Performance on Both the Testing and External Validation Sets
The predictive performance of the optimized Random Forest model was first evaluated in the internal testing cohort (n=450). As shown in Figure 3A, the model demonstrated excellent discrimination with an AUC of 0.850 (95% CI: 0.801–0.900). To assess the clinical utility of the model, Decision Curve Analysis (DCA) was performed (Figure 3B). The red curve, representing the Random Forest model, consistently remained above the two reference lines (“Treat-all” and “Treat-none”) across a wide range of threshold probabilities, indicating a significant net benefit for clinical decision-making. Furthermore, the calibration plot (Figure 3C) revealed a high degree of agreement between the predicted probabilities and actual observations, with an ideal intercept of −0.00 and a slope of 1.00 (C-statistic: 0.85). To verify the stability of the model within the testing dataset, a 5-fold cross-validation analysis was conducted, yielding a mean AUC of 0.746 (95% CI: 0.683–0.814), as depicted in Figure 3D.
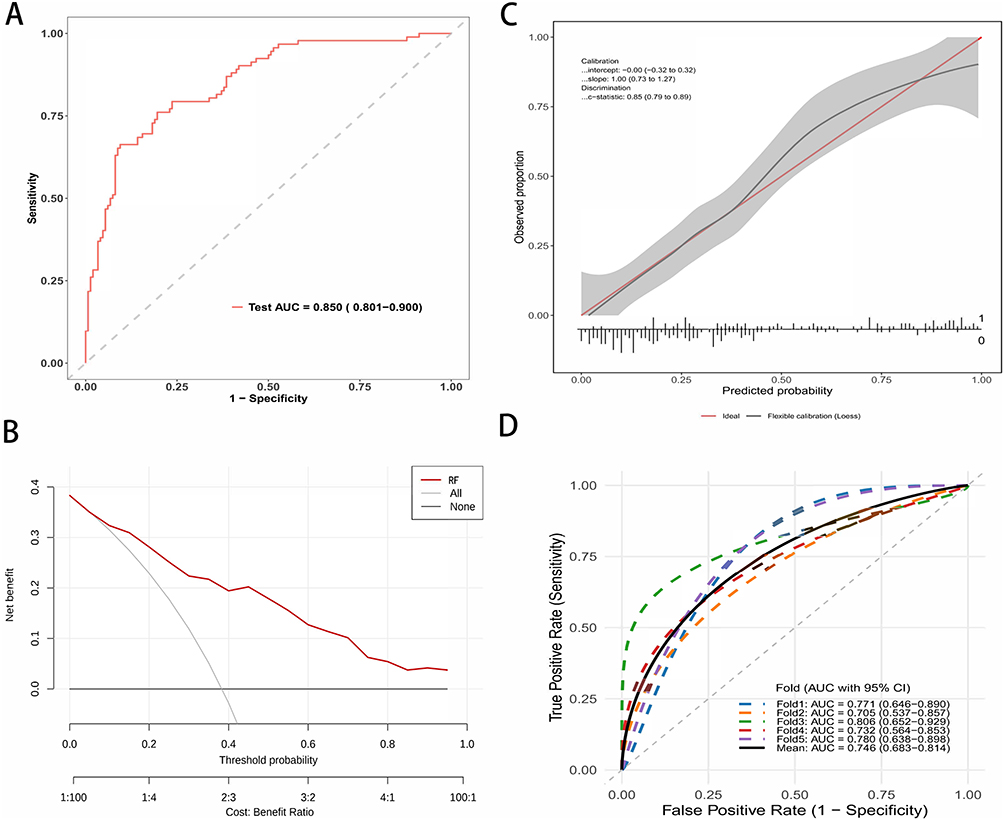 |
Figure 3 Performance evaluation of the Random Forest (RF) model in the Test Cohort. (A) ROC curve illustrating the discrimination performance with an AUC of 0.875. (B) Calibration plot comparing predicted probabilities against observed actual probabilities. The red line represents perfect calibration. (C) Decision curve analysis (DCA) demonstrating the clinical net benefit of the model across different threshold probabilities. (D) ROC curves from 5-fold cross-validation, indicating the model’s stability and robustness. |
To further validate the generalizability and robustness of the model, we assessed its performance in an independent external validation cohort (n=500). The model maintained robust discriminatory power, achieving an AUC of 0.831 (95% CI: 0.771–0.888), which was comparable to the performance in the internal testing set (Figure 4A). Similarly, the DCA for the validation cohort (Figure 4B) confirmed that the model provided a positive net benefit across the majority of threshold probabilities. The calibration of the model remained excellent in the external dataset, as shown in Figure 4C, with a calibration intercept of 0.00 and a slope of 1.00, suggesting that the model did not significantly overestimate or underestimate the risk of DVT in the new population. Finally, the cross-validation analysis on the validation set corroborated these findings (Figure 4D), showing a consistent performance with a mean AUC of 0.718 (95% CI: 0.655–0.783), confirming that the model is reliable and not overfitted to the training data. Comprehensive performance metrics of the RF model, including sensitivity, specificity, precision, F1-score with 95% confidence intervals (CIs), and optimal cut-off values determined by Youden’s index across both internal testing and external validation sets, are detailed in Supplementary Table S3.
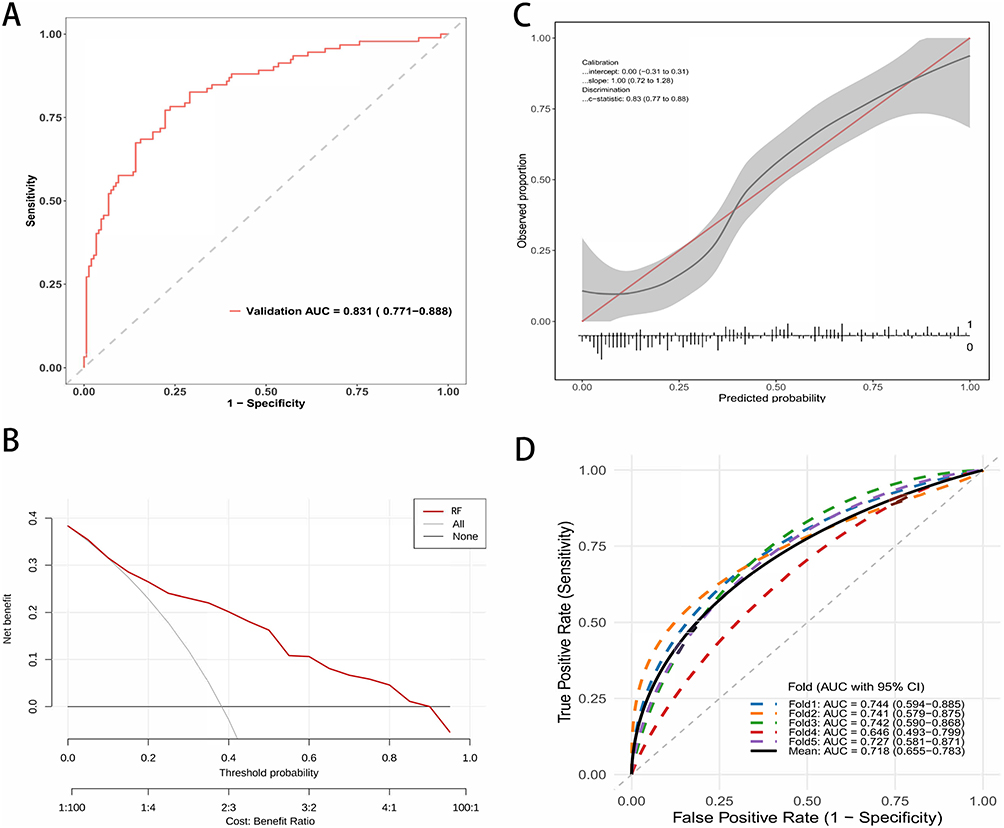 |
Figure 4 External validation of the Random Forest (RF) model in the Validation Cohort. (A) ROC curve of the RF model applied to the external validation cohort. (B) Calibration curve showing the agreement between predicted risks and actual outcomes in the validation cohort. (C) Decision Curve Analysis (DCA) demonstrating the clinical utility of the model in the validation cohort. (D) ROC curves showing the generalization performance of the model (with 5-fold validation) in the validation cohort. |
Model Interpretation
To overcome the “black box” nature of machine learning and provide clinically interpretable insights, we utilized SHAP (SHapley Additive exPlanations) analysis to quantify the contribution of each feature to the model’s predictions.
Figure 5A illustrates the global feature importance ranked by the mean absolute SHAP values. Among the six selected predictors, Duration of Immobilization was identified as the most influential variable, followed closely by D-dimer and Femoral Vein Catheterization. The APACHE II Score, Malignancy, and Age also contributed to the model, albeit to a lesser extent. This hierarchy suggests that factors related to venous stasis and hypercoagulability are the primary drivers of DVT risk in this ICU cohort.
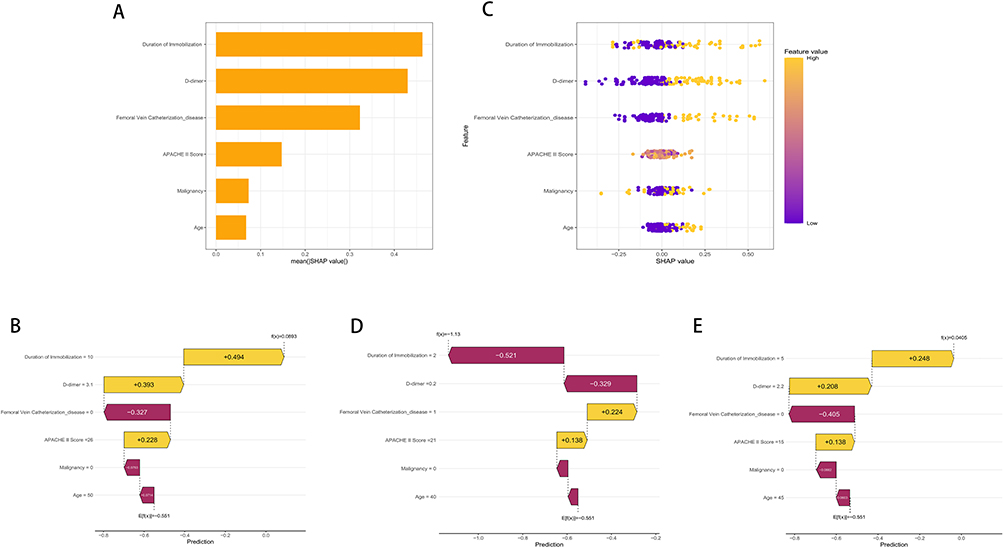 |
Figure 5 SHAP analysis for the interpretability of the optimal Random Forest model. (A) SHAP feature importance plot ranking the global impact of variables on the model’s predictions. (B) SHAP waterfall plot for a representative high-risk patient (f(x)=0.0893), driven by prolonged immobilization and elevated D-dimer. (C) SHAP summary beeswarm plot displaying the distribution and direction of feature effects across the entire cohort. (D) SHAP waterfall plot for a representative low-risk patient (f(x)=−1.13). (E) SHAP waterfall plot for a representative moderate-risk patient (f(x)=0.0405), illustrating the counterbalance between risk-increasing and risk-decreasing factors. |
To demonstrate how the model operates at an individual patient level, we examined specific prediction instances using waterfall plots. Figure 5B depicts a representative high-risk case. The base value of the model was −0.551. For this patient, a prolonged Duration of Immobilization (10 days) and a significantly elevated D-dimer level (3.1 mg/L) acted as strong positive contributors (yellow bars), adding +0.494 and +0.393 to the risk score, respectively. These factors, combined with a high APACHE II Score (26), pushed the final prediction to 0.0893, correctly classifying the patient as high-risk for DVT.
The directionality of these feature impacts is further visualized in the summary beeswarm plot shown in Figure 5C. In this plot, each dot represents a patient, with the color indicating the feature value (yellow for high, purple for low). A consistent pattern was observed across all six predictors. Specifically, higher values of the continuous variables including Duration of Immobilization, D-dimer, APACHE II Score, and Age were primarily concentrated on the right side of the zero axis (positive SHAP values). Furthermore, the presence of the binary risk factors, namely Femoral Vein Catheterization and Malignancy, also corresponded to positive SHAP values as indicated by the yellow dots. This confirms that elevated levels or the existence of these conditions are positively correlated with an increased probability of developing DVT. Conversely, lower values or the absence of these factors (purple dots) clustered on the negative side, indicating a protective effect against thrombosis.
Finally, Figure 5D illustrates a low-risk scenario to contrast with the previous case. Despite the presence of a Femoral Vein Catheter (which contributed +0.224 to the risk), the patient’s short Duration of Immobilization (2 days) and low D-dimer (0.2 mg/L) exerted dominant negative effects (purple bars), contributing −0.521 and −0.329 to the score, respectively. These protective factors effectively counteracted the risk associated with the catheter, resulting in a low final prediction score of −1.13. This nuanced analysis highlights the model’s ability to weigh conflicting clinical factors dynamically. Figure 5E presents a moderate-risk patient near the clinical decision cut-off at f(x) = 0.0405. In this borderline scenario, risk-increasing factors like 5 days of immobilization and elevated D-dimer are delicately counterbalanced by protective factors including the absence of femoral vein catheterization and younger age. This case highlights the precise discriminative ability of the model in ambiguous clinical presentations where traditional scoring tools often fail. Based on the validated Random Forest model, we deployed an accessible web-based risk calculator (https://my-portfolio.shinyapps.io/DVT_Risk_Predictor/). By inputting the patient’s specific parameters, clinicians can instantly obtain the individualized probability of DVT. The application automatically stratifies the patient into low, moderate, or high-risk categories and provides corresponding clinical recommendations.
To further elucidate the non-linear relationships and potential interaction effects of the key predictors with DVT risk, SHAP dependence plots were generated for the top three features (Supplementary Figure 1). Duration of immobilization demonstrated a non-linear positive association, where the marginal contribution to predicted DVT risk escalated rapidly after approximately one week of immobilization. Similarly, D-dimer levels exhibited a progressive, non-linear upward trend with DVT risk. Furthermore, the dependence plots revealed potential interaction effects between clinical variables. Notably, in patients with femoral vein catheterization, those who concurrently experienced prolonged immobilization exhibited the highest SHAP values, suggesting a synergistic effect between catheterization and immobility in escalating DVT risk.
Comparison with the Traditional Clinical Model
To benchmark our developed Random Forest model, we compared its predictive performance against the standard Caprini and Wells risk assessment model.
The full performance metrics (AUC, sensitivity, specificity, PPV, and NPV) for the RF model, Wells score, and Caprini score have been comprehensively detailed in a newly added Supplementary Table S4. As expected, the RF model significantly outperformed both traditional scoring systems in the ICU population.
Furthermore, we assessed the clinical utility of the three models using Decision Curve Analysis (DCA), presented in Figure 6. The analysis revealed that the net benefit curve of RF model was consistently higher than that of Caprini and Wells model across a wide range of threshold probabilities. This suggests that using Random Forest model to guide clinical decisions regarding DVT prophylaxis offers greater net benefit to patients than relying on the traditional models, without increasing the number of unnecessary interventions.
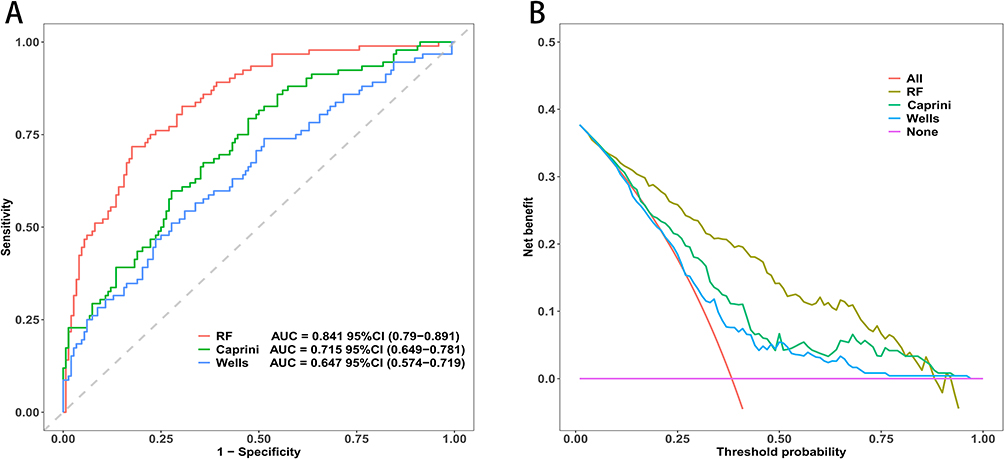 |
Figure 6 Performance comparison between the optimal Random Forest (RF) model and traditional clinical scoring systems. (A) Receiver operating characteristic (ROC) curves demonstrating the discriminative ability of the models. The RF model achieved the highest area under the curve (AUC = 0.841), outperforming both the Caprini score (AUC = 0.715) and Wells score (AUC = 0.647). (B) Decision curve analysis (DCA) evaluating clinical utility. The RF model provides superior net clinical benefit across the majority of threshold probabilities compared to the two traditional scores and default strategies (treat-all or treat-none). |
Discussion
In this multicenter retrospective cohort study, we successfully developed and validated an interpretable machine learning model based on the Random Forest algorithm for the early prediction of ICU-acquired deep vein thrombosis. Our model demonstrated superior discrimination and calibration compared to traditional logistic regression and established clinical scores. Through SHAP analysis, we identified six key predictors that drive thrombotic risk in critically ill patients. These predictors, ranked by importance, are duration of immobilization, D-dimer, femoral vein catheterization, APACHE II score, malignancy, and age. These findings provide a comprehensive risk profile by integrating acute ICU interventions with patient-intrinsic vulnerabilities.
The top three predictors, specifically duration of immobilization, D-dimer, and femoral vein catheterization, closely mirror the classic components of Virchow’s triad involving stasis, hypercoagulability, and endothelial injury.16 Duration of immobilization emerged as the most dominant feature in our model. In the ICU setting, the combination of mechanical ventilation, heavy sedation, and neuromuscular blockade leads to a complete loss of the calf muscle pump function.17 Our analysis suggests a strong dose-response relationship where the risk of venous stasis and subsequent thrombosis rises exponentially with increasing days of bed rest. Ranked second, D-dimer levels serve as a critical biomarker for hypercoagulability. Although D-dimer is often non-specifically elevated in critically ill patients due to infection or systemic inflammation, our results indicate that high baseline levels or sustained elevations are strongly predictive of DVT. This finding suggests that D-dimer reflects the net burden of pro-thrombotic activity in this population.18 Furthermore, femoral vein catheterization was identified as the third most important factor and a key modifiable risk. The insertion of large-bore central venous catheters into the femoral vein not only causes direct mechanical trauma to the vessel endothelium but also physically obstructs venous return.19,20 This finding reinforces current clinical guidelines recommending the subclavian or internal jugular veins over the femoral site to minimize thrombotic complications.
Beyond these acute ICU-specific precipitants, the model highlighted three systemic characteristics, including APACHE II score, malignancy, and age, which reflect the physiological reserve and baseline pro-thrombotic state of the patient. The APACHE II score, a measure of disease severity, was a significant predictor likely because patients with higher scores typically suffer from severe systemic inflammation or organ failure.21 This creates a thrombo-inflammatory environment where cytokine storms activate the coagulation cascade and significantly increase the likelihood of clot formation.22 Malignancy remains a well-established risk factor. Our model reaffirms that active cancer exerts a persistent pro-thrombotic effect, likely through tumor-derived tissue factor and paraneoplastic mechanisms such as Trousseau’s syndrome, making these patients particularly vulnerable even when receiving standard prophylaxis.23 Finally, age represents an immutable risk factor associated with endothelial dysfunction and decreased venous compliance.24 Our model captures how advanced age acts synergistically with acute ICU stressors, placing elderly patients at a disproportionately higher risk compared to younger individuals with similar clinical interventions.
A critical finding of this study is the superior performance of the Random Forest model compared to traditional risk assessment tools. Traditional scoring systems, such as the Caprini or Wells scores, were originally designed for general surgical or medical inpatients rather than the critically ill.25,26 In the ICU environment, nearly all patients exhibit multiple risk factors, meaning that traditional scores often classify almost every patient as high-risk.27,28 This “ceiling effect” drastically reduces the specificity and clinical utility of scores like Caprini in the ICU.29,30 In contrast, our Random Forest model effectively discriminates between patients by capturing complex and non-linear interactions among variables. For example, while standard logistic regression assumes that the risk associated with age or D-dimer is linear and additive, machine learning algorithms can identify that the risk impact of femoral catheterization might be significantly amplified only when combined with a high APACHE II score. This ability to model high-dimensional interactions allows the machine learning approach to outperform both conventional scoring systems and standard linear statistical methods. A major strength of our study is the translation of a complex machine learning algorithm into an intuitive web-based calculator. Traditionally, machine learning models function as “black boxes”, limiting their utility for clinicians. Our online tool bridges this gap, allowing physicians to calculate individualized DVT risk at the bedside simply via a smartphone or computer. This real-time risk stratification can assist in timely prophylactic interventions, potentially reducing the incidence of DVT in high-risk patients.
Several limitations of this study warrant mention. First, the retrospective design inevitably introduces several inherent biases. In addition to potential selection bias related to patient inclusion and exclusion, information bias may have occurred because clinical variables were extracted from existing electronic medical records rather than collected prospectively using a unified protocol. Misclassification bias is also possible, particularly for variables such as immobilization duration, prophylaxis implementation, and comorbidities, which may not have been documented with equal precision across centers. Furthermore, although we included routinely available clinical variables and performed external validation, residual and unmeasured confounding cannot be completely excluded, including differences in clinician decision-making, ultrasound screening frequency, catheter management, and center-specific thromboprophylaxis practices. We also could not fully account for the potential confounding effects of different thromboprophylaxis regimens administered during the ICU stay. Because this was a real-world retrospective study, prophylactic regimens were not strictly standardized across the participating centers. As observed in our cohort, patients received varying modalities of prophylaxis, including pharmacological methods (n = 850), mechanical devices (n = 450), a combination of both (n = 550), or none at all (n = 150), based on individual clinical judgments, localized protocols, and patient-specific contraindications such as bleeding risks. This non-uniform application introduces confounding by indication, where patients perceived to be at higher risk might have received more aggressive prophylaxis, thereby altering their actual DVT outcomes. Although our initial feature selection evaluated general prophylaxis administration and did not retain it in the final model, the lack of granular data regarding specific medication dosages, exact timing of initiation, and compliance with mechanical devices remains a confounding factor that our algorithm could not fully adjust for. Second, population-specific factors may limit the generalizability of our findings. The study population was derived from two hospitals in China and was ethnically homogeneous, which may restrict the applicability of the model to ICU populations with different ethnic backgrounds, genetic thrombotic risks, disease patterns, and healthcare systems. Moreover, regional and institutional differences in ICU management, ultrasound screening, catheter use, and thromboprophylaxis practices may also affect model performance. Future prospective, multinational, multicenter studies are needed to externally validate and recalibrate the model before broader clinical implementation. Third, patients with DVT or pulmonary embolism diagnosed on admission or within the first 24 hours were excluded because our aim was to predict ICU-acquired DVT rather than prevalent thrombosis. However, this exclusion may introduce selection bias and limit the generalizability of the model to ICU patients with pre-existing thrombotic conditions. Fourth, although we used baseline variables obtained within 24 hours of ICU admission to enable early prediction and avoid temporal leakage, we did not incorporate dynamic clinical variables, such as serial changes in D-dimer levels, coagulation parameters, or APACHE II scores, which may provide additional predictive value. Future prospective studies should explore dynamic models that update DVT risk during the ICU stay.
When compared with other recent ML-based ICU-DVT prediction models, our findings exhibit both notable alignments and interesting discrepancies.31,32 Similar to models developed by other institutions, our study confirmed that primary indicators of venous stasis and hypercoagulability, such as immobilization and elevated D-dimer, are universal, leading drivers of thrombotic risk in critically ill patients. However, several top predictors frequently reported in other ML algorithms, such as the use of mechanical ventilation, vasopressor administration, and overall length of ICU stay, were not retained in our final model. These discrepancies can be interpreted through the lens of overlapping variable representations and center-specific clinical practices. In our cohort, the physiological severity and stasis induced by mechanical ventilation and vasopressors were likely comprehensively captured by the APACHE II score and our strictly defined duration of immobilization variable, rendering the former redundant during the rigorous LASSO and Boruta feature selection processes. Furthermore, patient population differences and unit-specific protocols, including aggressive early mobilization programs, varying sedation thresholds, and differences in standardized catheter care between centers, can significantly alter the relative thrombotic impact of specific interventions. For example, our model uniquely retained femoral vein catheterization as a top-three predictor. This highlights that in our specific patient population, direct mechanical endothelial injury from large-bore central lines serves as a more dominant and direct catalyst for lower-extremity DVT than generalized ICU interventions, underscoring the importance of training models that reflect local or regional clinical realities. Potential temporal and hospital-based differences may have influenced data collection and model development. Although the cohorts were collected during the same study period and external validation was performed in an independent hospital, variations in ICU management, ultrasound screening, documentation quality, catheter management, mobilization protocols, and thromboprophylaxis practices may have introduced residual bias that could not be fully eliminated in this retrospective design. Although the DeLong test showed significant AUC differences between models, it only evaluates discrimination and does not assess calibration, clinical utility, or bedside impact. Therefore, its results were interpreted together with calibration plots, performance metrics, and DCA. DCA estimates net clinical benefit, but its conclusions depend on the selected threshold range and assumptions about false-positive and false-negative consequences. Thus, DCA should be considered supportive rather than definitive evidence of improved clinical outcomes. Regarding multicollinearity, pairwise correlations among the final predictors were low, with all absolute coefficients below 0.30. D-dimer and immobilization duration represent different clinical domains, namely hypercoagulability and venous stasis, and were both retained by LASSO and Boruta. The Random Forest model is relatively robust to moderate collinearity, and SHAP dependence plots were used to explore potential non-linear interactions.
To translate our Random Forest model into an actionable clinical tool, we have already developed and deployed a user-friendly web-based application as an initial step. This calculator allows clinicians to input the six key predictors to instantly obtain a patient-specific DVT probability. However, the ultimate goal for seamless clinical implementation is direct integration into hospital Electronic Medical Record (EMR) systems. Because our model relies on only six routinely collected variables, namely age, malignancy, APACHE II score, D-dimer, immobilization duration, and femoral vein catheterization, it is highly suitable for automated EMR extraction. Compared to traditional tools like the Caprini score, which requires the manual evaluation of nearly 40 variables, our model drastically reduces clinician workload. By automating risk stratification, it saves valuable manual chart-review time and eliminates inter-rater variability. Furthermore, by addressing the Caprini score’s tendency to overestimate risk, our model has the potential to generate significant cost savings by reducing unnecessary pharmacological prophylaxis and minimizing the expensive treatments required for preventable bleeding complications.
Despite these clear advantages, several potential barriers to real-world adoption must be addressed. The first barrier is the manual data entry currently required by our standalone web app, which may cause fatigue in a fast-paced ICU environment. The corresponding solution is to leverage modern EMR interoperability protocols to automatically pull these six structured data points directly from the patient chart, rendering the risk calculation entirely passive and invisible to the workflow until an alert is needed. A second barrier is the widespread hesitation among clinicians to trust machine learning algorithms due to their inherent black-box nature. We have fundamentally addressed this by integrating the SHAP framework. Future EMR interfaces can display SHAP-derived visual explanations alongside the risk score, explicitly showing clinicians exactly how much each variable is contributing to a specific patient’s risk. Lastly, the dynamic physiological status of ICU patients presents a challenge for static scoring. This can be resolved by programming the EMR to automatically recalculate the risk score at standard 24-hour intervals or immediately following the generation of new clinical data, such as updated D-dimer laboratory results.
In conclusion, we present a robust Random Forest model that effectively predicts ICU-acquired DVT using six readily available clinical variables. By prioritizing immobilization, D-dimer, and femoral catheterization, while also accounting for APACHE II score, malignancy, and age, this tool offers a practical and interpretable approach to risk stratification. Implementing this model could facilitate early detection and personalized prevention, potentially improving outcomes in critically ill patients.
Data Sharing Statement
The datasets are available from the corresponding author on reasonable request.
Ethical Approval and Consent to Participate
This study adhered to the principles of the Declaration of Helsinki and was approved by the Institutional Review Board of the Ethics Committee of Taixing People’s Hospital (Approval No. EC-2026-002). The informed consent is waived by the ethics committee because this is a retrospective design study. Patient confidentiality and data privacy were strictly safeguarded throughout the study.
Acknowledgments
We would like to express our gratitude to the information technology departments and the ICU staff of Taixing People’s Hospital and Nanjing Gaochun People’s Hospital for their assistance in data retrieval and processing.
Author Contributions
All authors made a significant contribution to the work reported, whether that is in the conception, study design, execution, acquisition of data, analysis and interpretation, or in all these areas; took part in drafting, revising or critically reviewing the article; gave final approval of the version to be published; have agreed on the journal to which the article has been submitted; and agree to be accountable for all aspects of the work.
Funding
The authors declare that no funds, grants, or other support were received during the preparation of this manuscript.
Disclosure
The authors declare that they have no competing interests in this work.
References
1. Minet C, Potton L, Bonadona A, et al. Venous thromboembolism in the ICU: main characteristics, diagnosis and thromboprophylaxis. Crit Care. 2015;19(1):287. doi:10.1186/s13054-015-1003-9
2. Nahum J, Morichau-Beauchant T, Daviaud F, et al. Venous thrombosis among critically ill patients with coronavirus disease 2019 (COVID-19). JAMA Netw Open. 2020;3(5):e2010478. doi:10.1001/jamanetworkopen.2020.10478
3. Lutsey PL, Zakai NA. Epidemiology and prevention of venous thromboembolism. Nat Rev Cardiol. 2023;20(4):248–18. doi:10.1038/s41569-022-00787-6
4. Lauzier F, Muscedere J, Deland É, et al. Thromboprophylaxis patterns and determinants in critically ill patients: a multicenter audit. Crit Care. 2014;18(2):R82. doi:10.1186/cc13844
5. Tini G, Moriconi A, Ministrini S, et al. Ultrasound screening for asymptomatic deep vein thrombosis in critically ill patients: a pilot trial. Intern Emerg Med. 2022;17(8):2269–2277. doi:10.1007/s11739-022-03085-8
6. Guo F, Zhu X, Wu Z, et al. Clinical applications of machine learning in the survival prediction and classification of sepsis: coagulation and heparin usage matter. J Transl Med. 2022;20(1):265. doi:10.1186/s12967-022-03469-6
7. Shim J-G, Ryu K-H, Cho E-A, et al. Machine learning approaches to predict chronic lower back pain in people aged over 50 years. Medicina. 2021;57(11):1230. doi:10.3390/medicina57111230
8. Flechet M, Falini S, Bonetti C, et al. Machine learning versus physicians’ prediction of acute kidney injury in critically ill adults: a prospective evaluation of the AKIpredictor. Crit Care. 2019;23(1):282. doi:10.1186/s13054-019-2563-x
9. Ryan L, Mataraso S, Siefkas A, et al. A machine learning approach to predict deep venous thrombosis among hospitalized patients. Clin Appl Thromb Hemost. 2021;27:1076029621991185. doi:10.1177/1076029621991185
10. Guan C, Ma F, Chang S, et al. Interpretable machine learning models for predicting venous thromboembolism in the intensive care unit: an analysis based on data from 207 centers. Crit Care. 2023;27(1):406. doi:10.1186/s13054-023-04683-4
11. He Y, Huang J, Li N, et al. Artificial intelligence-driven prediction and interpretation of central line-associated bloodstream infections in ICU: insights from the MIMIC-IV database. Front Public Health. 2025;13:1675077. doi:10.3389/fpubh.2025.1675077
12. Roberts L, Rozen T, Murphy D, et al. A preliminary study of intensivist-performed DVT ultrasound screening in trauma ICU patients (APSIT study). Ann Intensive Care. 2020;10(1):122. doi:10.1186/s13613-020-00739-8
13. Mansory EM, Srigunapalan S, Lazo-Langner A. Venous thromboembolism in hospitalized critical and noncritical COVID-19 patients: a systematic review and meta-analysis. TH Open. 2021;05(03):e286–e294. doi:10.1055/s-0041-1730967
14. Magnusson M, Eriksson BI, Kãlebo P, et al. Is colour Doppler ultrasound a sensitive screening method in diagnosing deep vein thrombosis after Hip surgery ? Thromb Haemost. 1996;75(02):242–245. doi:10.1055/s-0038-1650252
15. Hafeez MU, Cuesta I, Siddiqui KA, et al. Evaluation of two-point compression ultrasound as a screening tool for lower extremity deep venous thrombosis in a neurocritical care unit: insights from a single-center study. J Neuroanaesth Crit Care. 2025;12(02):69–75. doi:10.1055/s-0045-1809035
16. Thoppil JJ, Courtney DM, McDonald S, et al. SARS-CoV-2 positivity in ambulatory symptomatic patients is not associated with increased venous or arterial thrombotic events in the subsequent 30 days. The Journal of Emergency Medicine. 2022;62(6):716–724. doi:10.1016/j.jemermed.2021.12.020
17. Sahle BW, Pilcher D, Peter K, et al. Trends and risk factors for omission of early thromboprophylaxis in australian and New Zealand ICUs between 2009 and 2020. Intensive Care Med. 2022;48(5):590–598. doi:10.1007/s00134-022-06672-7
18. Zhang C, Zhang Z, Mi J, et al. The cumulative venous thromboembolism incidence and risk factors in intensive care patients receiving the guideline-recommended thromboprophylaxis. Medicine. 2019;98(23):e15833. doi:10.1097/MD.0000000000015833
19. Tolunay İ, Yıldızdaş RD, Elçi H, et al. Assessment of central venous catheterization and complications in a tertiary pediatric intensive care unit. Turk J Pediatr. 2018;60(1):63–69. doi:10.24953/turkjped.2018.01.009
20. Cui N, Mi S, Jiang C, et al. Deep vein thrombosis in acute respiratory distress syndrome caused by bacterial pneumonia. BMC Pulm Med. 2021;21(1):264. doi:10.1186/s12890-021-01632-1
21. Tian Y, Yao Y, Zhou J, et al. Dynamic APACHE II score to predict the outcome of intensive care unit patients. Front Med. 2022;8:744907. doi:10.3389/fmed.2021.744907
22. Lu W, Zhang J, Qiu Y, et al. Correlations between APACHE-II score and pressure parameters of mechanical ventilation in patients with ARDS and their value in prognostic evaluation. Pak J Med Sci. 2023;39(6). doi:10.12669/pjms.39.6.7190
23. De Vries VA, Müller MCA, Sesmu Arbous M, et al. Time trend analysis of long term outcome of patients with haematological malignancies admitted at Dutch intensive care units. Br J Haematol. 2018;181(1):68–76. doi:10.1111/bjh.15140
24. Toffart A-C, Minet C, Raynard B, et al. Use of intensive care in patients with nonresectable lung cancer. Chest. 2011;139(1):101–108. doi:10.1378/chest.09-2863
25. Zhang C, Mi J, Wang X, et al. Development of a risk assessment tool for venous thromboembolism among hospitalized patients in the ICU. Clin Appl Thromb Hemost. 2024;30:10760296241280624. doi:10.1177/10760296241280624
26. Lu X, Zeng W, Zhu L, et al. Application of the caprini risk assessment model for deep vein thrombosis among patients undergoing laparoscopic surgery for colorectal cancer. Medicine. 2021;100(4):e24479. doi:10.1097/MD.0000000000024479
27. Messelu MA, Ayenew T, Amha H, et al. Machine learning (ML) algorithm to predict mortality of trauma patients admitted to the intensive care units (ICU) in northwest Ethiopia. Nursing in Critical Care. 2025;30(6):e70190. doi:10.1111/nicc.70190
28. Loffredo L, Vidili G, Sciacqua A, et al. Asymptomatic and symptomatic deep venous thrombosis in hospitalized acutely ill medical patients: risk factors and therapeutic implications. Thrombosis J. 2022;20(1):72. doi:10.1186/s12959-022-00433-8
29. Tu K-C, Tau ENT, Chen N-C, et al. Machine learning algorithm predicts mortality risk in intensive care unit for patients with traumatic brain injury. Diagnostics. 2023;13:3016. doi:10.3390/diagnostics13183016
30. Magna A, Maggio E, Vidili G, et al. Rate and predictors of thromboprophylaxis in internal medicine wards: results from the AURELIO study. Thrombosis Research. 2024;243:109148. doi:10.1016/j.thromres.2024.109148
31. Cui C, Yin Q, Long T, et al. Anticoagulation management in intracerebral hemorrhage patients with deep vein thrombosis: insights from unsupervised machine learning and nomogram analysis. Front Neurol. 2026;16:1711123. doi:10.3389/fneur.2025.1711123
32. Cui C, Lan J, Lao Z, et al. Predicting the recurrence of spontaneous intracerebral hemorrhage using a machine learning model. Front Neurol. 2024;15:1407014. doi:10.3389/fneur.2024.1407014
 © 2026 The Author(s). This work is published and licensed by Dove Medical Press Limited. The
full terms of this license are available at https://www.dovepress.com/terms
and incorporate the Creative Commons Attribution
- Non Commercial (unported, 4.0) License.
By accessing the work you hereby accept the Terms. Non-commercial uses of the work are permitted
without any further permission from Dove Medical Press Limited, provided the work is properly
attributed. For permission for commercial use of this work, please see paragraphs 4.2 and 5 of our Terms.
© 2026 The Author(s). This work is published and licensed by Dove Medical Press Limited. The
full terms of this license are available at https://www.dovepress.com/terms
and incorporate the Creative Commons Attribution
- Non Commercial (unported, 4.0) License.
By accessing the work you hereby accept the Terms. Non-commercial uses of the work are permitted
without any further permission from Dove Medical Press Limited, provided the work is properly
attributed. For permission for commercial use of this work, please see paragraphs 4.2 and 5 of our Terms.
Recommended articles
Predicting Antibiotic Resistance in ICUs Patients by Applying Machine Learning in Vietnam
Tran Quoc V, Nguyen Thi Ngoc D, Nguyen Hoang T, Vu Thi H, Tong Duc M, Do Pham Nguyet T, Nguyen Van T, Ho Ngoc D, Vu Son G, Bui Duc T
Infection and Drug Resistance 2023, 16:5535-5546
Published Date: 22 August 2023
Prediction of Acute Kidney Injury in Intracerebral Hemorrhage Patients Using Machine Learning
She S, Shen Y, Luo K, Zhang X, Luo C
Neuropsychiatric Disease and Treatment 2023, 19:2765-2773
Published Date: 11 December 2023
Enhancing Prediction of Myocardial Recovery After Coronary Revascularization: Integrating Radiomics from Myocardial Contrast Echocardiography with Machine Learning
Huang D, Yang X, Ruan H, Zhuo Y, Yuan K, Ruan B, Li F
International Journal of General Medicine 2024, 17:2539-2555
Published Date: 31 May 2024
Risk Factors for Gout in Taiwan Biobank: A Machine Learning Approach
Liu YR, Nfor ON, Zhong JH, Lin CY, Liaw YP
Journal of Inflammation Research 2024, 17:9847-9856
Published Date: 26 November 2024
Construction and Validation of a Machine Learning-Based Risk Prediction Model for Sleep Quality in Patients with OSA
Tong Y, Wen K, Li E, Ai F, Tang P, Wen H, Guo B
Nature and Science of Sleep 2025, 17:1271-1289
Published Date: 12 June 2025