
Back to Journals » International Journal of General Medicine » Volume 19
Machine Learning Identification of Metabolism-Related Biomarkers with Diagnostic Potential for Gastric Cancer: Multi-Dimensional Transcriptomic Validation
Authors Kong W, Wang J, Zhang K, Wang X, Zhang J 
Received 21 January 2026
Accepted for publication 13 April 2026
Published 20 April 2026 Volume 2026:19 594735
DOI https://doi.org/10.2147/IJGM.S594735
Checked for plagiarism Yes
Review by Single anonymous peer review
Peer reviewer comments 2
Editor who approved publication: Dr Ching-Hsien Chen
Weihao Kong,1,2,* Jiawen Wang,1,* Kangjie Zhang,2,* Xingyu Wang,1 Jianlin Zhang1
1Department of Emergency Surgery, The First Affiliated Hospital of Anhui Medical University, Hefei, People’s Republic of China; 2West China Clinical Medical College, West China Hospital, Sichuan University, Chengdu, Sichuan Province, People’s Republic of China
*These authors contributed equally to this work
Correspondence: Xingyu Wang, Department of Emergency Surgery, The First Affiliated Hospital of Anhui Medical University, Hefei, People’s Republic of China, Email [email protected] Jianlin Zhang, Department of Emergency Surgery, The First Affiliated Hospital of Anhui Medical University, Hefei, People’s Republic of China, Email [email protected]
Background: An increasing body of evidence suggests an association between metabolic syndrome and gastric cancer. However, the shared genetic signatures and underlying molecular mechanisms between them remain to be elucidated.
Methods: We obtained transcriptomic data for gastric cancer and metabolic syndrome from the GEO, TCGA, and GTEx databases. Using the Limma and WGCNA algorithms respectively, we identified differential genes and co-expression module genes related to metabolic syndrome and gastric cancer. Lasso and SVM were employed to further screen for hub genes, while XGBoost was utilized to enhance the diagnostic value of these hub genes. CIBERSORT and GSVA were applied to assess the correlation among hub genes for immune infiltration and metabolic scores. Single-cell and spatial transcriptomic analyses were conducted to explore cell subpopulations and tissue distribution of hub genes in gastric cancer. We used qPCR experiments to detect expression differences of hub genes between gastric cancer tissues and normal tissues.
Results: CSE1L, IL32, and CCDC86 were identified as shared hub genes between metabolic syndrome and gastric cancer. These genes were significantly associated with immune cell infiltration and dysregulated metabolic pathways. Single-cell analysis revealed elevated glycolysis across gastric cancer cell subpopulations, accompanied by enhanced cell–cell interactions. Spatial transcriptomic analysis confirmed the upregulation of hub genes in tumor regions. qPCR further verified significantly higher mRNA expression levels of these genes in gastric cancer tissues than in adjacent normal tissues.
Conclusion: CSE1L, IL32, and CCDC86 may represent potential metabolism-related biomarkers associated with gastric cancer and metabolic syndrome. These findings provide additional insight into the molecular links between the two conditions and may support future mechanistic studies and larger-scale clinical validation.
Keywords: metabolic syndrome, gastric cancer, diagnosis, immune infiltration
Introduction
Gastric cancer (GC) remains a significant global health challenge, characterized by a high incidence rate and poor 5-year survival outcomes. Extensive research has identified risk factors such as Helicobacter pylori (H. pylori) infection, Epstein–Barr virus (EBV) infection, and a high-salt diet.1–4 However, the etiology of gastric cancer remains complex and multifactorial. Notably, gastric cancer patients often present with comorbid metabolic syndrome (MetS), which comprises obesity, hypertension, hyperglycemia, and dyslipidemia.5–9 The interplay between MetS and gastric cancer has garnered increasing attention in recent years.
Several studies, including that by Naoki Kimoto, have demonstrated a significant association between MetS and an increased incidence of gastric cancer.10 Huang et al found that among gastric cancer patients who underwent gastrectomy, MetS may serve as a predictive indicator of higher postoperative mortality, higher recurrence rates, and more surgical complications. A prospective cohort study from South Korea, including 108,397 individuals, revealed that MetS is associated with an increased risk of gastric cancer in the Korean population.5 Liu et al, in a study involving 430,036 participants from the UK Biobank, reported that MetS is significantly associated with a 28% increased risk of gastrointestinal cancers.8 Moreover, Luo’s meta-analysis indicated that patients with MetS have a higher incidence of complications and lower overall survival rates compared with those without MetS.9 Li et al further reported that the prevalence of MetS and its components is higher in gastric cancer patients, particularly in those with poorly differentiated and advanced-stage tumors,7 suggesting that metabolic disorders may play a crucial role in the development of gastric cancer.
Although epidemiological and clinical findings have suggested a close association between MetS and gastric cancer, the underlying genetic connections between these two conditions remain largely unexplored. Therefore, to address this gap, we conducted a comprehensive analysis based on transcriptomic data from gastric cancer and MetS. We aimed to identify the most relevant modules linking these two conditions and to screen for shared genes associated with both gastric cancer and MetS for the construction and validation of a diagnostic model. Furthermore, we performed multi-dimensional analyses at the single-cell and spatial transcriptomic levels to further explore the potential mechanisms underlying gastric cancer development, offering new insights into its pathogenesis.
Methodology
Data Acquisition
Transcriptomic datasets were obtained from publicly accessible repositories. The GSE98895 cohort (GEO accession) included peripheral blood mononuclear cell (PBMC) RNA-seq profiles from 20 healthy controls and 20 patients with metabolic syndrome. Gastric cancer analyses incorporated three independent datasets: GSE54129 (21 non-tumor gastric tissues and 111 gastric cancer tissues); GSE113255 (10 histologically normal gastric tissues and 130 gastric cancer tissues); and the TCGA-STAD/GTEx consortium dataset (174 normal gastric tissues and 375 gastric cancer tissues).
Cross-Disease Differential Expression Analysis
To identify shared pathogenic mechanisms between metabolic syndrome and gastric carcinogenesis, multi-cohort differential expression analysis was performed using disease-specific thresholds. For the GSE98895 metabolic syndrome cohort (PBMC transcriptomes), genes with false discovery rate (FDR)-adjusted p-values < 0.05 were considered differentially expressed. In the GSE54129 gastric cancer cohort, DEGs were defined as genes meeting both |log2 fold change| ≥ 0.5 and FDR < 0.05. Intersection analysis of these condition-specific DEG sets was conducted using Venn diagrams to identify commonly upregulated and downregulated genes. Particular emphasis was placed on genes showing concordant dysregulation, with consistent expression trends across both diseases.
Cross-Pathway Enrichment Profiling
Shared differentially expressed genes (DEGs) were comprehensively annotated using two analysis platforms. Primary pathway screening was conducted via the Sangerbox analytical suite (v2.0, http://vip.sangerbox.com/)11 using the Kyoto Encyclopedia of Genes and Genomes (KEGG) module with Fisher’s exact test (P<0.05). Subsequently, Gene Ontology (GO) term enrichment was performed through Metascape’s bioinformatics pipeline (https://metascape.org/).12 This analysis incorporated the hypergeometric algorithm and Benjamini-Hochberg correction. Biological pathways that remained significant in both platforms were retained for downstream interpretation in order to improve the robustness of enrichment results.
Integrative Co-Expression Network Profiling
The technical batch effects across the GSE98895, GSE54129, GSE113255, and TCGA-GTEX transcriptomic datasets were mitigated using the SVA package13 (Supplementary Figure 1). Normalization efficacy was validated by principal component analysis (PCA) of samples before and after correction. Expression matrices from the GSE98895 (metabolic syndrome) and GSE54129 (gastric cancer) cohorts underwent hierarchical clustering to identify and remove outliers. Weighted Gene Co-Expression Network Analysis (WGCNA) was implemented based on a scale-free topology criterion, using a fit index of R2 > 0.85.14 The optimal soft thresholding power was dynamically determined through gradient testing of network connectivity metrics. Module-trait association analysis identified conserved co-expression patterns, with significance thresholds set at Bonferroni-adjusted (P < 0.01). Intramodular hub genes were extracted based on module membership and gene significance. We cross-referenced these network-centric genes with pre-identified signature DEGs using intersection analysis and applied strict consistency criteria for shared pathway annotations.
Diagnostic Model Development and Validation
The identified candidate genes were modeled using two algorithms: least absolute shrinkage and selection operator (Lasso) regression and support vector machine (SVM). Intersection analysis of gene subsets derived from the algorithms identified overlapping candidates for subsequent diagnostic model construction. Hyperparameters were optimized using Bayesian search combined with XGBoost’s built-in tree pruning. The GSE54129 cohort served as the primary training set, while GSE113255, TCGA-GTEX, and GSE98895 datasets were used for validation across multiple cohorts. Model performance was quantitatively assessed through receiver operating characteristic (ROC) curve analysis, precision-recall (PR) curve evaluation, and confusion matrix decomposition.
Immune-Metabolic Profiling
Transcriptomic datasets from the GSE98895 cohort (metabolic syndrome) and the GSE54129 cohort (gastric cancer) were analyzed. A comprehensive characterization of their microenvironments was then performed. Immune cell subset proportions were quantified via CIBERSORTx deconvolution analysis, which used the LM22 signature matrix and 1000 permutations for robust cell-type fraction estimation.15 Metabolic pathway activity was assessed using Gene Set Variation Analysis (GSVA) based on the hallmark/classical metabolism-related gene sets. Spearman’s rank correlation analysis was performed to evaluate the associations among hub gene expression, immune cell infiltration, and metabolic pathway scores.
Single-Cell Transcriptomic Profiling
The GSE167297 cohort included 4 normal samples and 10 tumor samples. These samples were processed with quality control thresholds as follows: nFeature_RNA ranged from 200 to 3000; mitochondrial gene ratio was less than 15%; and hemoglobin gene ratio was less than 3%. The single-cell data were sequentially normalized, log-transformed, and screened for highly variable genes. Thereafter, batch effects across samples were corrected using the Harmony algorithm implemented in Seurat. After integration, cell clusters were annotated according to canonical marker genes of major cell subpopulations. Stacked bar plots were used to display the changes in the proportions of cell subpopulations across different samples. Two-dimensional UMAP plots visualized the annotated cell subpopulations. Wilcoxon tests were conducted to analyze the expression differences of hub genes between normal and tumor samples. The AddModuleScore algorithm was utilized to score common metabolic pathways at the single-cell level. CellChat was employed to explore the interaction strength and number between different cell subpopulations.
Spatial Transcriptomics Analysis
For the spatial transcriptomics analysis, we included the gastric cancer samples GSM7990475 and GSM7990476. Based on the corresponding hematoxylin and eosin (H&E) - stained histological images, two independent pathologists manually assessed and annotated the regions of interest. Accordingly, normal tissue, transitional zones, and tumor tissue were identified in both samples. The spatial expression patterns of the selected hub genes were then examined across these distinct regions, and differences in gene expression among regions were compared to evaluate potential spatial heterogeneity.
Tissue Acquisition and qPCR Analysis
This study retrospectively analyzed paired tumor-normal tissue samples from eight treatment-naïve gastric cancer (GC) patients who underwent radical resection at the First Affiliated Hospital of Anhui Medical University. The study was approved by the Ethics Committee of the First Affiliated Hospital of Anhui Medical University. Additionally, this research was conducted in accordance with the principles outlined in the Declaration of Helsinki. Fresh tissues were rapidly frozen in liquid nitrogen within 5 minutes after resection. They were then stored at −80°C until further processing. We extracted total RNA by lysing the tissue with TRIzol reagent, then sequentially adding chloroform, isopropanol, 75% ethanol, and RNase-free water. We measured RNA concentration using the NanoDrop 2000 spectrophotometer. The purity of RNA was confirmed by an A260/A280 ratio greater than 1.8. Reverse transcription used 1 μg of RNA as the template and the ExonScript RT SuperMix with dsDNase kit (EXONGEN: Chengdu, China). The thermal cycling conditions for reverse transcription were as follows: 25°C for 10 minutes, 55°C for 15 minutes, and 85°C for 5 minutes. We performed qPCR analysis using the Fast SYBR Green qPCR Master Mix kit (EXONGEN: Chengdu, China). The cycling parameters were as follows: 95°C for 5 minutes for enzyme activation, then 40 cycles of 95°C for 5 seconds for denaturation, and 65°C for 20 seconds for annealing. Gene-specific primers are listed in Supplementary Table 1, with GAPDH serving as the endogenous control. We calculated the relative expression levels using the 2−ΔΔCt method.
Results
Differential Analysis
In the metabolic syndrome cohort (GSE98895), we identified 1354 upregulated and 1285 downregulated differentially expressed genes (DEGs) (Figure 1A). In the gastric cancer cohort GSE54129, 2833 genes were upregulated, while 3197 genes were downregulated (Figure 1B). Venn diagram analysis revealed 228 commonly upregulated DEGs and 165 commonly downregulated DEGs shared between the metabolic syndrome and gastric cancer cohorts (Figure 1C and D).
 |
Figure 1 Differential Gene Expression Analysis of Metabolic Syndrome and Gastric Cancer Cohorts. (A) Volcano plot showing differentially expressed genes in the metabolic syndrome cohort. (B) Volcano plot of differential analysis in the gastric cancer cohort. (C) Venn diagram showing differentially upregulated genes commonly expressed in both metabolic syndrome and gastric cancer. (D) Venn diagram showing differentially downregulated genes commonly expressed in both metabolic syndrome and gastric cancer. |
Enrichment Analysis
The enrichment analysis of upregulated genes revealed significant over-representation in the following KEGG pathways: Rap1 signaling pathway, B cell receptor signaling pathway, Primary immunodeficiency, Yersinia infection, Choline metabolism in cancer, Focal adhesion, Leukocyte transendothelial migration, Human T-cell leukemia virus 1 infection, Fc gamma R-mediated phagocytosis, Apoptosis, Regulation of actin cytoskeleton, T cell receptor signaling pathway, Inositol phosphate metabolism, PI3K-Akt signaling pathway, and Pathways in cancer (top 15) (Figure 2A). The GO analysis of upregulated genes indicated primary enrichment in the following biological processes: immune system process, multicellular organismal process, positive regulation of biological process, developmental process, and response to stimulus (top 5) (Figure 2B). For downregulated genes, the KEGG enrichment analysis highlighted significant over-representation in the following pathways: Apelin signaling pathway, Circadian rhythm, Transcriptional misregulation in cancer, cGMP-PKG signaling pathway, Ether lipid metabolism, Signaling pathways regulating pluripotency of stem cells, TGF-beta signaling pathway, Glycerophospholipid metabolism, Terpenoid backbone biosynthesis, Phosphatidylinositol signaling system, Fatty acid metabolism, Th17 cell differentiation, Toxoplasmosis, Butanoate metabolism, and Acute myeloid leukemia (top 15) (Figure 2C). The GO analysis of downregulated genes demonstrated primary enrichment in the following biological processes: localization, cellular process, regulation of biological process, growth, and positive regulation of biological process (top 5) (Figure 2D).
 |
Figure 2 Gene Enrichment Analysis. (A) Kyoto Encyclopedia of Genes and Genomes (KEGG) enrichment analysis of upregulated genes. (B) Gene ontology (GO) enrichment analysis of upregulated genes. (C) Kyoto Encyclopedia of Genes and Genomes (KEGG) enrichment analysis of downregulated genes. (D) Gene ontology (GO) enrichment analysis of downregulated genes. |
WGCNA Analysis
We conducted Weighted Gene Co-expression Network Analysis (WGCNA) on 172 samples, excluding two outlier samples identified after clustering (Figure 3A and B). Based on the scale-free topology fit index and mean connectivity, we determined the optimal power value to be 5 (Figure 3C and D). Fourteen co-expression modules were identified, with genes in the pink module showing significant positive correlations with metabolic syndrome and gastric cancer (Figure 3E–H). Subsequently, we performed Venn diagram analysis to identify the intersection between DEGs and genes in the pink module identified by WGCNA. This analysis revealed 26 shared genes (Figure 3I).
 |
Figure 3 WGCNA Analysis. (A) Sample clustering of the combined metabolic syndrome and gastric cancer cohorts. (B) Clustering after removal of outlier samples. (C and D) Determination of the optimal soft threshold. (E and F) Identification of gene modules. (G) Correlation of the selected module with gastric cancer. (H) Correlation of the selected module with metabolic syndrome. (I) Venn diagram showing the intersection of genes in the selected module and differentially expressed genes. |
Model Construction and Validation
Through Lasso regression analysis, we identified six genes associated with gastric cancer (Figure 4A and B). Meanwhile, the Support Vector Machine (SVM) identified four genes associated with gastric cancer (Figure 4C). Based on the intersection, we identified CSE1L, IL32, and CCDC86 as the candidate genes for constructing a diagnostic model for gastric cancer or metabolic syndrome (Figure 4D). The results of the XGBoost model demonstrated excellent performance using Bayesian method. In the training cohort (GSE54129), both the area under the receiver operating characteristic curve (AUC-ROC) and the area under the precision-recall curve (AUC-PR) were 1.0, and the confusion matrix showed high discriminative power (Figure 4E). In the validation cohort (GSE113255), the AUC-ROC and AUC-PR were 0.923 and 0.994, respectively. The confusion matrix indicated that four normal individuals were misclassified as tumor patients, while seven tumor patients were misclassified as normal individuals (Figure 4F). In the TCGA-GTEX cohort, the AUC-ROC and AUC-PR were 0.963 and 0.980, respectively. The confusion matrix showed that 73 normal individuals were misclassified as tumor patients, while only one tumor patient was misclassified as normal (Figure 4G). In the GSE98895 cohort, the AUC-ROC and AUC-PR were 0.935 and 0.943, respectively. The confusion matrix revealed that two normal individuals were misclassified as metabolic syndrome patients, while three metabolic syndrome patients were misclassified as normal individuals (Figure 4H). Overall, the diagnostic model exhibited good diagnostic performance, although a relatively high false-positive rate was observed in some validation cohorts.
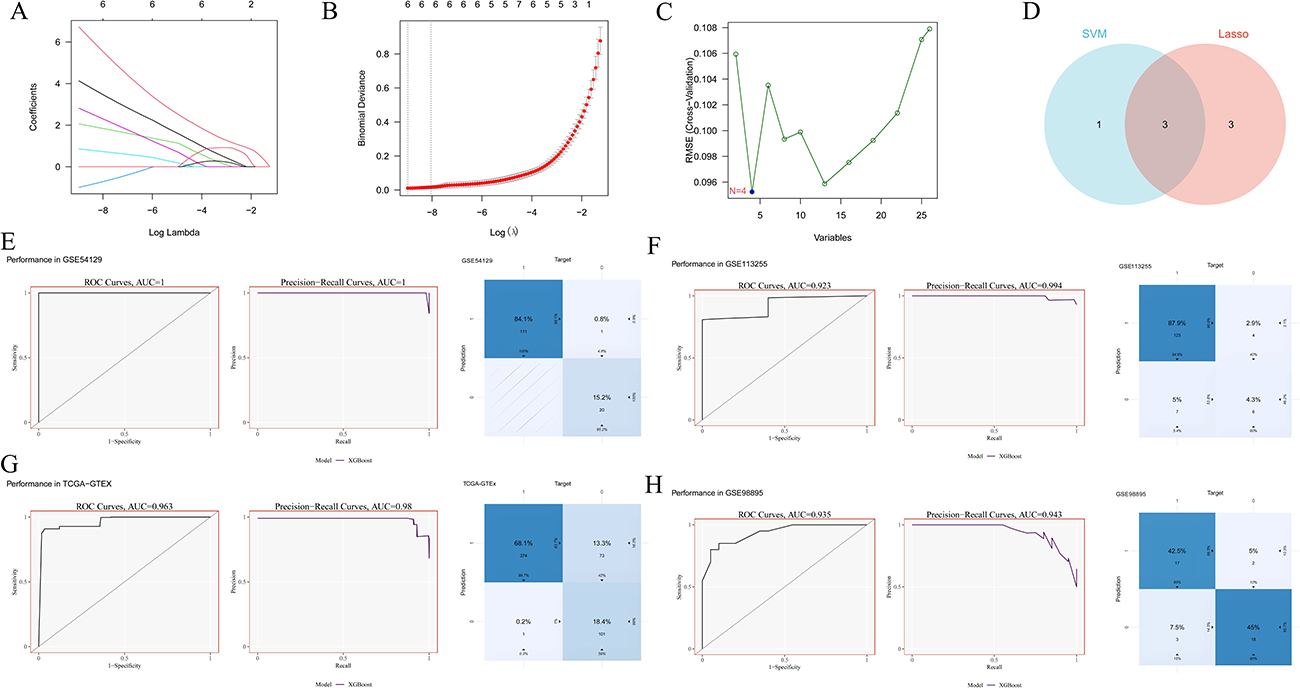 |
Figure 4 Construction and Validation of the Diagnostic Model. (A) Convergence Path of Lasso Regression Coefficients. (B) 10-Fold Cross-Validation for Lasso model. (C) Identification of Optimal Variables in the SVM Model. (D) Intersection of Genes Incorporated in the SVM and Lasso Regression Models. (E) ROC and PR curve areas and confusion matrix for the training set GSE54129. (F) ROC and PR curve areas and confusion matrix for the Validation Set GSE113255. (G) ROC and PR curve areas and confusion matrix for the Validation Set TCGA-GTEx. (H) ROC and PR curve areas and confusion matrix for the Validation Set GSE98895. |
Immune Infiltration and Metabolic Correlation Analysis
In the GSE54129 cohort, significant differences were observed in the abundance of several immune cell types. These included plasma cells, CD4 memory resting T cells, CD4 memory activated T cells, follicular helper T cells, regulatory T cells (Tregs), gamma delta T cells, resting and activated NK cells, monocytes, M0, M1, and M2 macrophages, resting dendritic cells, resting mast cells, eosinophils, and neutrophils (Figure 5A). In contrast, in the metabolic syndrome GSE98895 cohort, significant differences were noted only in CD8 T cells, follicular helper T cells, M0 macrophages, and neutrophils (Figure 5D). Correlation analysis of immune infiltration revealed that, in the GSE54129 cohort, the expressions of CSE1L, IL32, and CCDC86 significantly positively correlated with infiltration of CD4 memory activated T cells, M1 and M0 macrophages, regulatory T cells (Tregs), and activated NK cells. Conversely, these genes showed significant negative correlations with infiltration of CD4 memory resting T cells, resting NK cells, monocytes, resting mast cells, and plasma cells (Figure 5B). In the metabolic syndrome GSE98895 cohort, CSE1L and CCDC86 were negatively correlated with neutrophil infiltration, although the correlation for IL32 did not reach statistical significance (Figure 5E). Metabolic score correlation analysis showed that in the GSE54129 cohort, the expression levels of CSE1L, IL32, and CCDC86 were significantly positively correlated with glycolysis and hypoxia metabolic scores, while showing significant negative correlations with heme metabolism, adipogenesis, bile acid metabolism, fatty acid metabolism, and oxidative phosphorylation metabolic scores (Figure 5C). In the metabolic syndrome cohort GSE98895, IL32 and CCDC86 were significantly positively correlated with glycolysis and oxidative phosphorylation scores (Figure 5F).
 |
Figure 5 Correlation of Hub Genes with Immune Infiltration and Metabolic Pathways. (A) Differences in Immune Cell Infiltration between Normal and Tumor Groups in the GSE54129 Gastric Cancer Cohort. (B) Heatmap of Correlation between Hub Genes and Immune Infiltration in Gastric Cancer in the GSE54129 Cohort. (C) Heatmap of Correlation between Hub Genes and Metabolic Pathway Scores in Gastric Cancer in the GSE54129 Cohort. (D) Differences in Immune Cell Infiltration between Normal and Metabolic Syndrome Patients in the GSE98895 Metabolic Syndrome Cohort. (E) Heatmap of Correlation between Hub Genes and Immune Infiltration in Gastric Cancer in the GSE98895 Cohort. (F) Heatmap of Correlation between Hub Genes and Metabolic Pathway Scores in Gastric Cancer in the GSE98895 Cohort. Notes: *: P<0.05; **: P<0.01; ***: P<0.001. |
Single-Cell Analysis
We conducted quality control (QC) on the single-cell matrix data from the GSE167297 cohort. The pre-QC results are shown in Figure 6A. After applying our QC criteria, the total number of cells included in the study is presented in Figure 6B. Following normalization and batch correction using Harmony with 10 principal components, the results are shown in Figure 6C. The selection of highly variable genes is illustrated in Figure 6D. The clustering results are shown by t-distributed Stochastic Neighbor Embedding (t-SNE) and Uniform Manifold Approximation and Projection (UMAP) in Figures 6E and Figure 6F, respectively. Ultimately, the cells were annotated into eight major cell subtypes: B cells, T cells, myeloid cells, epithelial cells, plasma cells, endothelial cells, myofibroblasts, and mast cells, as shown in Figure 6G. The cell proportion analysis revealed that among all cell types, myeloid cells exhibited the most pronounced increase in tumor tissues compared to normal tissues (Figure 7A). Figure 7B shows UMAP plots of CSE1L, IL32, and CCDC86 expression across cell subtypes in normal and tumor tissues. These plots reveal generally higher gene expression levels in tumor tissues. Visual inspection of these plots indicates that the expression levels of these genes are generally higher in tumor tissues. Wilcoxon rank-sum test analysis showed that only IL32 and CCDC86 exhibited significant differences in expression between normal and tumor tissues, whereas CSE1L did not reach statistical significance (Figure 7C). Further analysis of individual cell subtypes showed significant upregulation of IL32 in B cells, T cells, myeloid cells, epithelial cells, plasma cells, and myofibroblasts in tumor tissues compared to normal tissues. Conversely, CCDC86 was significantly upregulated only in myeloid cells within the tumor microenvironment, with no significant differences in other cell types (Figure 7D). The heatmap illustrating the distribution of CSE1L, IL32, and CCDC86 across different cell subtypes in normal and tumor tissues is shown in Figure 8A and B. Compared to normal tissues, tumor tissues exhibited significantly elevated glycolysis scores in Myeloid cells (P<0.001), Epithelial cells (P<0.001), B cells (P<0.001), Mast cells (P<0.05), Myofibroblasts (P<0.05), Plasma cells (P<0.001) and T cells (P<0.001) (Figures 8C). The expression pattern of IL32 in single-cell analysis showed a notable similarity to the distribution of glycolysis-related gene expression. This finding suggests that IL32 may be associated with glycolytic activity in gastric cancer (Figure 8D). Glycolysis scores were highest in myeloid cells (Figure 9A). Consequently, we stratified myeloid cells into two groups based on the median glycolysis score: high-glycolysis-score and low-glycolysis-score myeloid cells. The high-glycolysis-score myeloid cells exhibited significantly higher interaction frequency and strength (Figure 9B and C). The ligand-receptor interaction bubble plot is shown in Figure 9D. Compared to low-glycolysis-score myeloid cells, high-glycolysis-score myeloid cells showed a marked enhancement of the MIF signaling pathway during interaction with epithelial cells. The specific interaction modes are illustrated in Figures 9E and Figure 9F. Figure 9G shows a heatmap of output and input interactions. The high-glycolysis-score myeloid cells exhibited the strongest output signaling, while B cells had the strongest input signaling. Additionally, a two-dimensional scatter plot (Figure 9H) confirmed that high-glycolysis-score myeloid cells had the average highest interaction strength.
 |
Figure 6 Annotation of Gastric Cancer Single-Cell Dataset GSE167297. (A and B) Quality control and filtering of the single-cell dataset. (C) Integrating Different Samples in the Single-Cell Dataset and Determining Principal Components. (D) Identification of Highly Variable Genes in the Single-Cell Cohort. (E) t-SNE Plot of Single-Cell Clustering Subgroups. (F) UMAP Plot of Single-Cell Clustering Subgroups. (G) UMAP Plot of Annotated Single-Cell Subgroups. |
 |
Figure 7 Distribution and Differential Expression of Hub Genes in the Gastric Cancer Single-Cell Dataset GSE167297. (A) Proportion of distinct cellular subtypes in normal and tumor groups. (B) UMAP Plot of Expression Distribution of Hub Genes in Normal and Tumor Groups. (C) Differential Expression of Hub Genes between Normal and Tumor Groups. (D) Differential Expression of Hub Genes across Cellular Subtypes in Normal and Tumor Groups. Notes: **: P<0.01; ****: P<0.0001. |
 |
Figure 8 Differential Distribution of Glycolysis Pathway in Distinct Cellular Subtypes within the Gastric Cancer Single-Cell Dataset GSE167297. (A) Heatmap of Hub gene expression proportions across cellular subtypes in GSE167297. (B) Heatmap of Expression Levels of Key Genes across Different Cellular Subtypes in GSE167297. (C) Variations in Glycolysis Pathway Scores among Distinct Cellular Subtypes in the Gastric Cancer Single-Cell Dataset GSE167297. (D) Distribution of IL32 and Glycolysis Scores in Normal and Tumor Groups. Notes: *: P<0.05; ***: P<0.001; ns: Not significant. |
 |
Figure 9 Interactions among Distinct Cellular Subtypes in GSE167297. (A) Differential Expression of Glycolysis Scores across Cellular Subtypes. (B) Number of Interactions among Distinct Cellular Subtypes in GSE167297. (C) Strength of Interactions among Distinct Cellular Subtypes in GSE167297. (D) Ligand-Receptor Interaction Bubble Plot. (E) Interaction Network of the MIF Signaling Pathway. (F) Interaction Heatmap of the MIF Signaling Pathway. (G) Interaction Heatmap of Input and Output Signaling Pathways. (H) Two-Dimensional Interaction Intensity Map of Input and Output Signals. |
Spatial Transcriptomics Analysis
We performed spatial transcriptomics analysis on gastric cancer samples GSM7990475 and GSM7990476. Figure 10A and Figure 10B show the expression patterns of CSE1L, IL32, and CCDC86 in these samples. Wilcoxon rank-sum test analysis showed that CSE1L, IL32, and CCDC86 expression was significantly higher in tumor tissues than in normal tissues in both GSM7990475 and GSM7990476 samples (Figure 10C and Figure 10D).
 |
Figure 10 Distribution and Differential Expression of Hub Genes in the Gastric Cancer Single-Cell Spatial Transcriptome. (A and B) Distribution of Hub Genes in the Gastric Cancer Single-Cell Spatial Transcriptome of GSM7990475 and GSM7990476. (C and D) Differential Expression of Hub Genes in the Gastric Cancer Single-Cell Spatial Transcriptome of GSM7990475 and GSM7990476. Notes: *: P<0.05; **: P<0.01; ***: P<0.001. |
qPCR Validation in Tissue Specimens
We validated gene expression in tissue specimens using quantitative real-time PCR (qPCR). The expression levels of CSE1L mRNA (P < 0.05), IL32 mRNA (P < 0.05), and CCDC86 mRNA (P < 0.01) were significantly higher in tumor tissues compared to adjacent normal tissues. These results further support our earlier analyses, including transcriptomic, single-cell, and spatial transcriptomic studies (Supplementary Figure 2).
Discussion
Gastric cancer is a major global health concern with a high incidence rate. Patients with advanced gastric cancer often face poor prognoses.16 This highlights the critical need for early intervention. Accumulating evidence from various studies suggests a potential link between metabolic syndrome and gastric cancer.5–10 Several researchers have identified a significant correlation between these two conditions. Given this association, metabolic dysregulation may contribute to gastric cancer development and progression, and exploring shared biomarkers may improve our understanding of disease mechanisms and support early detection strategies. Moreover, early-stage gastric cancer is associated with a higher survival rate compared to advanced stages. Therefore, identifying biomarkers for the early diagnosis of gastric cancer may have potential clinical value.
In our study, we identified three hub genes for the diagnosis of gastric cancer and metabolic syndrome through co-expression analysis and machine learning. To better understand the mechanisms of gastric cancer, we performed a thorough literature review on three genes of interest—CSE1L, IL32, and CCDC86—using PubMed. Our objective was to explore their potential roles and underlying mechanisms in gastric cancer development and progression. CSE1L, referred to as CAS, is a key functional component of the nuclear pore complex (NPC). It orchestrates the bidirectional transport network between the nucleus and the cytoplasm, facilitating the selective transmembrane transport of macromolecules such as ribosomal subunits and transcription factors. Additionally, it is involved in the dynamic remodeling of chromatin spatial conformation, thereby integrating intranuclear and extranuclear signaling pathways. CSE1L plays a pivotal role in various types of cancer, including gastric cancer, bladder cancer, lung cancer, hematological malignancies, pancreatic cancer, osteosarcoma, and breast cancer.17–24 He et al found that gastric cancer tissues significantly upregulate both mRNA and protein levels of CSE1L compared to adjacent normal tissues. Importantly, elevated CSE1L expression is strongly associated with poor prognosis in gastric cancer patients. Functionally, CSE1L has been shown to promote the migration, invasion, and proliferation of gastric cancer cells. Mechanistically, CSE1L can enhance the antitumor effects of Defactinib by inhibiting FAK phosphorylation, thereby modulating the functional phenotype of gastric cancer cells.19 Similarly, Li et al demonstrated that CSE1L acts as an oncogene in gastric cancer. Their research revealed that suppression of CSE1L leads to decreased expression of MITF and GPNMB, subsequently activating the PI3K/AKT/mTOR and MEK/ERK signaling pathways. This cascade of events ultimately results in the inhibition of tumor growth and metastasis in gastric cancer.20 These findings emphasize the important role of CSE1L in gastric cancer and its potential as a therapeutic target. Interleukin-32 (IL-32) is an emerging cytokine implicated in carcinogenesis and inflammatory processes. Research by Sumiya Ishigami has demonstrated that IL-32 is associated with tumor invasion depth and lymph node metastasis in gastric cancer, and it serves as an independent prognostic risk factor for patients with this malignancy.25 Similarly, studies conducted by Chung-Ying Tsai have identified analogous findings, indicating that elevated IL-32 expression is significantly correlated with tumor aggressiveness and prognosis. Ectopic expression of IL-32 promotes a tumor-promoting phenotype by inducing VEGF, IL-8, MMP9, and MMP2 expression, as well as activating the p-AKT/p-GSK-3β/active β-catenin/HIF-1α signaling pathway.26 The role of CCDC86 in gastric cancer remains largely unexplored. However, Wang et al reported that CCDC86 is significantly upregulated in nasopharyngeal carcinoma (NPC) cell lines and tissues. Moreover, its expression is strongly associated with the prognosis of patients with NPC. CCDC86 enhances proliferation, invasion, and migration of NPC cells by promoting epithelial-mesenchymal transition (EMT) and upregulating matrix metalloproteinases (MMPs). Furthermore, CCDC86 targets EGFR, activating the PI3K/Akt signaling pathway and promoting malignant tumor behavior.27 Taken together, these previous findings provide biological plausibility for the involvement of CSE1L and IL32 in gastric cancer, whereas the role of CCDC86 remains to be clarified. Our multi-omics analyses suggest that these genes may be associated with immune infiltration and metabolic dysregulation in gastric cancer, but the underlying mechanisms require further experimental confirmation.
Nonetheless, our study has several limitations that warrant consideration. First, it primarily relies on public datasets; although we validated our findings using clinical samples, the qPCR validation cohort was relatively small, and further validation in larger, independent cohorts is needed to consolidate the results. Second, the diagnostic model may exhibit a modest false-positive rate, which could be improved by integrating additional datasets and refining model parameters. Therefore, its clinical utility should be interpreted cautiously at the current stage. Third, while CSE1L and IL32 have been previously reported in gastric cancer, CCDC86 remains largely unexplored, and its underlying mechanisms require further investigation. Finally, although we observed associations between immune infiltration and glycolysis, these represent correlations rather than established causal relationships; further functional studies are required to clarify their mechanistic roles. In particular, in vitro and in vivo experiments will be necessary to determine whether these hub genes directly regulate metabolic remodeling and immune interactions in gastric cancer.
Overall, our findings identify metabolism-related biomarkers with diagnostic potential in gastric cancer and highlight possible links between metabolic dysregulation and immune interactions. While these results are promising, they should be interpreted with caution given the above limitations. Future studies should focus on mechanistic investigation, functional validation, and large-scale clinical validation to determine the robustness and translational relevance of these biomarkers.
Data Sharing Statement
Data can be requested from the corresponding author (Jianlin Zhang) upon reasonable request.
Ethical Approval
The study was approved by the Ethics Committee of the First Affiliated Hospital of Anhui Medical University and conducted in accordance with the principles outlined in the Declaration of Helsinki.
Acknowledgments
I am grateful to GEO, TCGA, and GTEx for providing publicly accessible resources that enable our exploration and analysis.
Author Contributions
All authors made a significant contribution to the work reported, whether that is in the conception, study design, execution, acquisition of data, analysis and interpretation, or in all these areas; took part in drafting, revising or critically reviewing the article; gave final approval of the version to be published; have agreed on the journal to which the article has been submitted; and agree to be accountable for all aspects of the work.
Funding
The completion of this study was made thanks to the support from The University Natural Science Research Project of Anhui Province (2022AH051130), The University Natural Science Research Project of Anhui Province (2023AH053322), Basic and Clinical Collaboration Enhancement Program Foundation of Anhui Medical University (2023xkjT038).
Disclosure
The authors report no conflicts of interest in this work.
References
1. Alsina M, Arrazubi V, Diez M, Tabernero J. Current developments in gastric cancer: from molecular profiling to treatment strategy. Nat Rev Gastroenterol Hepatol. 2023;20(3):155–18. doi:10.1038/s41575-022-00703-w
2. Christodoulidis G, Koumarelas KE, Kouliou MN, Thodou E, Samara M. Gastric cancer in the era of epigenetics. Int J Mol Sci. 2024;25(6):3381. doi:10.3390/ijms25063381
3. Sundar R, Nakayama I, Markar SR, et al. Gastric cancer. Lancet. 2025;405(10494):2087–2102. doi:10.1016/S0140-6736(25)00052-2
4. Krzysiek-Maczka G, Brzozowski T, Ptak-Belowska A. Helicobacter pylori-activated fibroblasts as a silent partner in gastric cancer development. Cancer Metast Rev. 2023;42(4):1219–1256. doi:10.1007/s10555-023-10122-1
5. Huang D, Shin WK, De la Torre K, et al. Association between metabolic syndrome and gastric cancer risk: results from the Health Examinees Study. Gastric Cancer. 2023;26(4):481–492. doi:10.1007/s10120-023-01382-5
6. Huang Z, Zhou J, Chen L, Zhang Y. Metabolic syndrome and clinical outcomes of patients with gastric cancer: a meta-analysis. Hormone Metab Res. 2023;55(5):333–342. doi:10.1055/a-2038-5830
7. Li F, Du H, Li S, Liu J. The association between metabolic syndrome and gastric cancer in Chinese. Front Oncol. 2018;8:326. doi:10.3389/fonc.2018.00326
8. Liu Y, Yan C, Yin S, et al. Genetic risk, metabolic syndrome, and gastrointestinal cancer risk: a prospective cohort study. Cancer Med. 2023;12(1):597–605. doi:10.1002/cam4.4923
9. Luo Y, Liu JS, Dai B, Qian K. The influence of metabolic syndrome on gastric cancer: a meta-analysis. Asian J Surg. 2021;44(12):1596–1597. doi:10.1016/j.asjsur.2021.08.014
10. Kimoto N, Miyashita Y, Yata Y, et al. Metabolic syndrome is linked to most cancers incidence. Heart Vessels. 2025;40(4):350–360. doi:10.1007/s00380-024-02474-7
11. Chen D, Xu L, Xing H, et al. Sangerbox 2: enhanced functionalities and update for a comprehensive clinical bioinformatics data analysis platform. iMeta. 2024;3(5):e238. doi:10.1002/imt2.238
12. Zhou Y, Zhou B, Pache L, et al. Metascape provides a biologist-oriented resource for the analysis of systems-level datasets. Nat Commun. 2019;10(1):1523. doi:10.1038/s41467-019-09234-6
13. Johnson WE, Li C, Rabinovic A. Adjusting batch effects in microarray expression data using empirical Bayes methods. Biostatistics. 2007;8(1):118–127. doi:10.1093/biostatistics/kxj037
14. Langfelder P, Horvath S. WGCNA: an R package for weighted correlation network analysis. BMC Bioinform. 2008;9:559. doi:10.1186/1471-2105-9-559
15. Newman AM, Steen CB, Liu CL, et al. Determining cell type abundance and expression from bulk tissues with digital cytometry. Nat Biotechnol. 2019;37(7):773–782. doi:10.1038/s41587-019-0114-2
16. Zhao L, Niu P, Wang W, et al. Application of survival quilts for prognosis prediction of gastrectomy patients based on the surveillance, epidemiology, and end results database and China national cancer center gastric cancer database. J Nat Cancer Center. 2024;4(2):142–152. doi:10.1016/j.jncc.2024.01.007
17. Cheng DD, Lin HC, Li SJ, Yao M, Yang QC, Fan CY. CSE1L interaction with MSH6 promotes osteosarcoma progression and predicts poor patient survival. Scient Rep. 2017;7:46238. doi:10.1038/srep46238
18. Duan L, Tadi MJ, Maki CG. CSE1L is a negative regulator of the RB-DREAM pathway in p53 wild-type NSCLC and can be targeted using an HDAC1/2 inhibitor. Scient Rep. 2023;13(1):16271. doi:10.1038/s41598-023-43218-3
19. He X, Wang Y, Zhang Y, Sahu A, Almhanna K, Liu Y. CSE1L in enhancing the effect of defactinib on gastric cancer cells via the inhibition of FAK phosphorylation. Transl Cancer Res. 2024;13(12):6905–6918. doi:10.21037/tcr-24-2049
20. Li Y, Yuan S, Liu J, et al. CSE1L silence inhibits the growth and metastasis in gastric cancer by repressing GPNMB via positively regulating transcription factor MITF. J Cell Physiol. 2020;235(3):2071–2079. doi:10.1002/jcp.29107
21. Liu XY, Wang YH, Wang J, Quan JK, Li XD, Guan KP. The role of CSE1L silencing in the regulation of proliferation and apoptosis via the AMPK/mTOR signaling pathway in chronic myeloid leukemia. Hematology. 2023;28(1):1–9. doi:10.1080/16078454.2022.2161201
22. Wang YS, Peng C, Guo Y, Li Y. CSE1L promotes proliferation and migration in oral cancer through positively regulating MITF. Eur Rev Med Pharmacolog Sci. 2020;24(10):5429–5435. doi:10.26355/eurrev_202005_21327
23. Zhang X, Zhang X, Mao T, et al. CSE1L, as a novel prognostic marker, promotes pancreatic cancer proliferation by regulating the AKT/mTOR signaling pathway. J Cancer. 2021;12(10):2797–2806. doi:10.7150/jca.54482
24. Tai CJ, Shen SC, Lee WR, et al. Increased cellular apoptosis susceptibility (CSE1L/CAS) protein expression promotes protrusion extension and enhances migration of MCF-7 breast cancer cells. Exp Cell Res. 2010;316(17):2969–2981. doi:10.1016/j.yexcr.2010.07.019
25. Ishigami S, Arigami T, Uchikado Y, et al. IL-32 expression is an independent prognostic marker for gastric cancer. Med Oncol. 2013;30(2):472. doi:10.1007/s12032-013-0472-4
26. Tsai CY, Wang CS, Tsai MM, et al. Interleukin-32 increases human gastric cancer cell invasion associated with tumor progression and metastasis. Clin Cancer Res. 2014;20(9):2276–2288. doi:10.1158/1078-0432.CCR-13-1221
27. Wang Z, Zhou T, Chen X, et al. CCDC86 promotes the aggressive behavior of nasopharyngeal carcinoma by positively regulating EGFR and activating the PI3K/Akt signaling. Neoplasma. 2023;70(6):761–776. doi:10.4149/neo_2023_221021N1039
 © 2026 The Author(s). This work is published and licensed by Dove Medical Press Limited. The
full terms of this license are available at https://www.dovepress.com/terms
and incorporate the Creative Commons Attribution
- Non Commercial (unported, 4.0) License.
By accessing the work you hereby accept the Terms. Non-commercial uses of the work are permitted
without any further permission from Dove Medical Press Limited, provided the work is properly
attributed. For permission for commercial use of this work, please see paragraphs 4.2 and 5 of our Terms.
© 2026 The Author(s). This work is published and licensed by Dove Medical Press Limited. The
full terms of this license are available at https://www.dovepress.com/terms
and incorporate the Creative Commons Attribution
- Non Commercial (unported, 4.0) License.
By accessing the work you hereby accept the Terms. Non-commercial uses of the work are permitted
without any further permission from Dove Medical Press Limited, provided the work is properly
attributed. For permission for commercial use of this work, please see paragraphs 4.2 and 5 of our Terms.
Recommended articles

Lipid Metabolic-Related Signature CYP19A1 is a Potential Biomarker for Prognosis and Immune Cell Infiltration in Gastric Cancer

Wang N, Huang X, Long Q
Journal of Inflammation Research 2022, 15:5075-5088
Published Date: 5 September 2022
Identification of an Immune-Related Gene Diagnostic Model and Potential Drugs in Sepsis Using Bioinformatics and Pharmacogenomics Approaches
Chen P, Chen J, Ye J, Yang L
Infection and Drug Resistance 2023, 16:5665-5680
Published Date: 28 August 2023

Criteria in the Diagnosis of Metabolic Syndrome in Children: A Scoping Review


Díaz-Ortega JL, Yupari-Azabache IL, Caballero Vidal JA, Conde-Parada NE, Rojas Gamboa AF
Diabetes, Metabolic Syndrome and Obesity 2023, 16:3489-3500
Published Date: 3 November 2023
Identification of Immune-Related Genes as Biomarkers for Uremia

Lyu D, He G, Zhou K, Xu J, Zeng H, Li T, Tang N
International Journal of General Medicine 2023, 16:5633-5649
Published Date: 29 November 2023
Identification of Key Glycolysis-Related Genes in Osteoarthritis and Their Correlation with Immune Infiltration Using Bioinformatics Analysis and Machine Learning
Zhu Y, Deng L, Xia J, Yang J, Zhao D, Li M
Open Access Rheumatology: Research and Reviews 2025, 17:157-171
Published Date: 16 August 2025