")
Back to Journals » International Journal of General Medicine » Volume 16
Identification of Immune-Related Genes as Biomarkers for Uremia
Authors Lyu D, He G, Zhou K, Xu J, Zeng H, Li T, Tang N
Received 8 September 2023
Accepted for publication 3 November 2023
Published 29 November 2023 Volume 2023:16 Pages 5633—5649
DOI https://doi.org/10.2147/IJGM.S435732
Checked for plagiarism Yes
Review by Single anonymous peer review
Peer reviewer comments 2
Editor who approved publication: Dr Scott Fraser
Dongning Lyu, Guangyu He, Kan Zhou, Jin Xu, Haifei Zeng, Tongyu Li, Ningbo Tang
Department of Nephrology Clinic, Guangxi International Zhuang Medicine Hospital Affiliated to Guangxi University of Chinese Medicine, Nanning, Guangxi, People’s Republic of China
Correspondence: Dongning Lyu, Guangxi International Zhuang Medicine Hospital Affiliated to Guangxi University of Chinese Medicine, No. 8 Qiuyue Road, Liangqing District, Nanning, Guangxi, 530200, People’s Republic of China, Tel +8613377191933, Email [email protected]
Purpose: Uremia, which is characterized by immunodeficiency, is associated with the deterioration of kidney function. Immune-related genes (IRGs) are crucial for uremia progression.
Methods: The co-expression network was constructed to identify key modular genes associated with uremia. IRGs were intersected with differentially expressed genes (DEGs) between uremia and control groups and key modular genes to obtain differentially expressed IRGs (DEIRGs). DEIRGs were subjected to functional enrichment analysis. The protein-protein interaction (PPI) network was constructed. The candidate genes were identified using the cytoHubba tool. The biomarkers were identified using various machine learning algorithms. The diagnostic value of the biomarkers was evaluated using receiver operating characteristic (ROC) analysis. The immune infiltration analysis was implemented. The biological pathways of biomarkers were identified using gene set enrichment analysis and ingenuity pathway analysis. The mRNA expression of biomarkers was validated using blood samples of patients with uremia and healthy subjects with quantitative real-time polymerase chain reaction (qRT-PCR).
Results: In total, four biomarkers (PDCD1, NGF, PDGFRB, and ZAP70) were identified by machine learning methods. ROC analysis demonstrated that the area under the curve values of individual biomarkers were > 0.9, indicating good diagnostic power. The nomogram model of biomarkers exhibited good predictive power. The proportions of six immune cells significantly varied between the uremia and control groups. ZAP70 expression was positively correlated with the proportions of resting natural killer (NK) cells, naïve B cells, and regulatory T cells. Functional enrichment analysis revealed that the biomarkers were mainly associated with translational function and neuroactive ligand-receptor interaction. ZAP70 regulated NK cell signaling. The PDCD1 and NGF expression levels determined using qRT-PCR were consistent with those determined using bioinformatics analysis.
Conclusion: PDCD1, NGF, PDGFRB, and ZAP70 were identified as biomarkers for uremia, providing a theoretical foundation for uremia diagnosis.
Keywords: differential expression analysis, WGCNA, immune infiltration, nomogram, diagnosis
Graphical Abstract:

Introduction
Uremia is a symptom of the final stage of chronic renal failure, which is clinically characterized by aberrant water, electrolyte, acid, and base balance and increased blood levels of metabolites, such as creatinine and urea.1 The uremia stage is often associated with a number of secondary conditions and comorbidities of chronic kidney disease (CKD), including, but not limited to: decreased renal function and accumulation of metabolites; pathological changes in the circulatory system, including anemia, platelet dysfunction, and bleeding; neuromuscular dysfunction and cognitive impairment; vascular endothelial dysfunction and vascular disease progression; endocrine and metabolic disorders, such as insulin resistance, gonadal dysfunction, hyperparathyroidism, and CKD-mineral and bone metabolism disorder; congenital and adaptive immunological diseases characterized by inflammation and immune deficiency.1–3
Patients in uremia stage are associated with poor prognosis of High morbidity, high prevalence of cardiovascular disease, high mortality rates. The main therapeutic strategies for uremia are kidney transplantation or dialysis (including hemodialysis and peritoneal dialysis). However, the expensive treatment is a major economic burden for society and individuals. Thus, uremia is a major challenge to global health. Recently, the number of studies on uremia has markedly increased. However, the pathological mechanisms of uremia have not been elucidated. The elucidation of the molecular mechanism and the identification of targets for early intervention, which are common concerns of interdisciplinary research and challenging limitations, are the major focus of renal disease research.1–3
The dynamic regulatory effects of the uremic environment on the immune system are known as uremic inflammation and include immune activation and immunosuppression.4 The aberrant activation of the innate immune system, especially monocytes, is one of the features of uremic inflammation.5,6 Patients with end-stage renal disease treated with renal replacement therapy exhibit premature immunological aging of T cells, which may be the cause of uremia-related immune dysfunction.7
This study used bioinformatics methods to examine the correlation between immune-related genes (IRGs) and uremia and screen molecular markers that can aid in the diagnosis, elucidation of pathogenesis, and treatment of uremia.
Materials and Methods
Data Source
The data of an independent uremia cohort (GSE37171) were obtained from the Gene Expression Omnibus (GEO) database (https://www.ncbi.nlm.nih.gov/geo/). The GSE37171 dataset comprised data of blood samples from 75 patients with uremia and 40 healthy subjects. The dataset was divided into training (20 healthy and 63 uremic samples) and validation (20 healthy and 12 uremic samples) sets.3 Additionally, the data of 1793 IRGs were retrieved from the ImmPort database (https://immport.niaid.nih.gov) (Supplementary File 1).
Screening of Differentially Expressed Genes (DEGs)
The DEGs between the uremia and control groups in the training set were screened using the limma package (|log fold-change| > 0.5; adj. p < 0.05).8 The screening results were visualized using the volcano plot and heatmap, which were plotted using the R language ggplot2 (version 3.3.6) package and pheatmap package (version 1.0.12), respectively.9
Identification of Differentially Expressed IRGs (DEIRGs)
The clinical traits of the uremia and control groups in the training set were used to perform weighted gene co-expression network analysis (WGCNA) using the R package WGCNA to obtain key modules and key module genes.10 The outlier samples in the training set were filtered out using the Hclust function. Next, the soft threshold of data was determined and the adjacency was calculated. Gene modules were obtained using dynamic tree cutting with a minimum of 30 genes in each gene module, and similar modules were merged. The modules related to uremia were selected as key modules and key module genes for subsequent analysis.
DEIRGs were obtained by intersecting the DEGs, key module genes, and 1793 IRGs using the VennDiagram package.11 Functional enrichment analysis of DEIRGs was performed using the R language clusterProfiler (p < 0.05).12
Protein-Protein Interaction (PPI) Network
Protein interactions between DEIRGs associated with uremia were characterized using the STRING database (http://string-db.org) (score > 0.4). The topological properties of the PPI networks were analyzed using cytoHubba in the Cytoscape plugin.13 The maximal clique centrality (MCC), degree, and stress algorithms were applied to evaluate and select candidate genes.
Identification and Validation of Biomarkers
In the training set, three machine learning models (generalized linear model (GLM), support vector machine-recursive feature elimination (SVM-RFE), and random forest (RF)) were executed using the R package “DALEX” to plot the residual distribution and obtain the best model. The biomarkers were obtained from the best model. The receiving operating characteristic (ROC) curves of the biomarkers were generated using the survROC R package to evaluate the diagnostic value of the biomarkers.14 Next, the validation set was used to further assess the diagnostic power of the biomarkers. The expression of biomarkers in the training set and validation set was displayed.
Construction and Verification of a Nomogram
The nomogram of biomarkers in the training set was constructed using the R language rms package. The predictive power of the nomogram model was evaluated using clinical impact curves (CICs) and decision curve analysis (DCA).15
Evaluation of Infiltrating Immune Cell Landscape
The distribution of immune cells in the training set was examined using the CIBERSORT algorithm.16 The differential distribution of immune cells in the uremia and control samples was compared using the Wilcox test.16 Next, Spearman correlation analysis was performed to explore the correlation between biomarkers and differentially abundant immune cells.17,18
Gene Set Enrichment Analyses (GSEA) and Ingenuity Pathway Analysis (IPA)
Functional enrichment analysis of biomarkers in the training set was performed using the GSEA function of the R package clusterProfiler (p < 0.05; |normalized enrichment score|>1).19 The gene identifiers and corresponding expression values of the DEGs in the training set were uploaded to the IPA software, which was used to analyze the unique pathways of the biomarkers.20
Validation of Expression of Biomarkers
The expression of biomarkers was verified using quantitative real-time polymerase chain reaction (qRT-PCR). We collected blood samples from 5 uremic patients and 5 healthy subjects for validation at the Guangxi International Zhuang Medical Hospital in February 2023. The 5 uremic patients met the following four conditions: (1) Age 18–90 years old, male or female; (2) Meet the diagnostic criteria for chronic kidney disease, with creatinine clearance <10mL/min; (3) Have been on haemodialysis for more than 3 months and are dialysed 3 times a week for 4 hours each time; (4) No serious cognitive impairment, voluntarily participate in this study, and sign the informed consent form and pass the medical ethical review. This study was approved by the ethical committee of Guangxi International Zhuang Medical Hospital (2023–007-01) and also complies with the Declaration of Helsinki. Informed consent was obtained from all subjects. The blood samples were processed to isolate peripheral blood mononuclear cells (PBMCs) using Ficoll solution. Total RNA was isolated from PBMCs using the TRIzol method. The isolated RNA was reverse-transcribed into complementary DNA (cDNA) using SureScript-First-strand-cDNA-synthesis-kit (Servicebio, China). qRT-PCR analysis was performed with Universal Blue SYBR Green qPCR Master Mix. The PCR conditions were as follows: 95 °C for 60s (initial denaturation), followed by 40 cycles of 95 °C for 20s (denaturation) and 55 °C for 20s (annealing). GAPDH was used as the housekeeping gene. The primer sequences are shown in Table 1. The relative expression levels of target genes were quantified using the 2−ΔΔCT method. The expression levels of target genes were normalized to those of GAPDH.
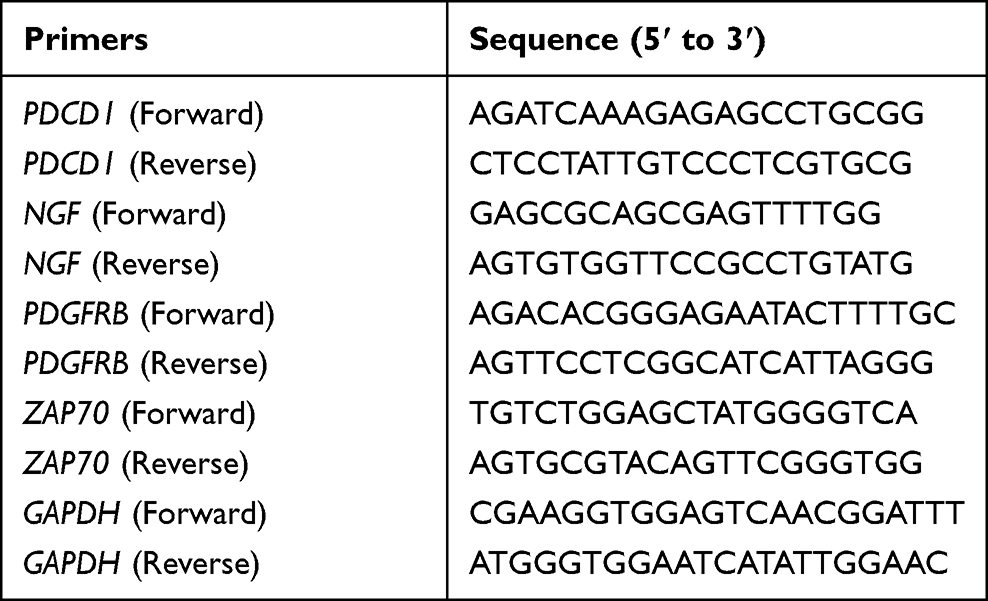 |
Table 1 The Primer Sequences of Biomarkers |
Statistical Analysis
All statistical analyses were performed using the R programming language. Differences were considered significant at p < 0.05 unless specified otherwise.
Results
Identification of DEIRGs Between Uremia and Control Samples
In the training set, 3464 DEGs (2059 downregulated genes and 1405 upregulated genes) were identified between the uremia and control groups (Figure 1A and B). All samples in the training set exhibited good clustering with no outliers (Figure 2A). The soft threshold power of 17 was selected to calculate adjacencies (Figure 2B). The brown module, which was the most relevant model to uremia, was selected as the key module and comprised 5354 key module genes (Figure 2C and D). The intersection of 3464 DEGs with 1793 IRGs and 5354 key module genes revealed 124 DEIRGs (Figure 2E).
 |
Figure 1 Identification of differentially expressed genes (DEGs). (A) Heatmap of DEGs between the uremia and control groups. Red and blue indicate upregulation and downregulation, respectively. (B) Volcano map of DEGs between the uremia and control groups. |
 |
Figure 2 Weighted gene co-expression network analysis (WGCNA). (A) Sample cluster dendrogram of 20 control samples and 63 uremia samples based on their expression profile. (B) Analysis of mean connectivity of each β value from 1 to 20. β = 17 was chosen for subsequent analyses as it has the biggest mean connectivity when the scale-free fit index is up to 0.85. (C) Heatmap of the module-trait correlation. The brown module exhibited the highest correlation with uremia. (D) Scatter plot of correlation between genes and traits in the MEbrown module. (E) Venn diagram representation of the intersection of differentially expressed genes (DEGs), immune-related genes from the ImmPort database, and the brown module. In total, 124 core DEGs were identified. |
DEIRGs Were Enriched in Immune Response Regulation
Gene Ontology (GO) analysis revealed that DEIRGs were enriched in T cell proliferation, leukocyte proliferation, leukocyte-mediated immunity, receptor-ligand activity, and regulation of cell development (Figure 3A). Kyoto Encyclopedia of Genes and Genomes (KEGG) analysis revealed that DEIRGs were enriched in neuroactive ligand-receptor interaction, T cell receptor (TCR) signaling pathway, neutrophil extracellular trap formation, and PI3K-Akt signaling pathway (Figure 3B).
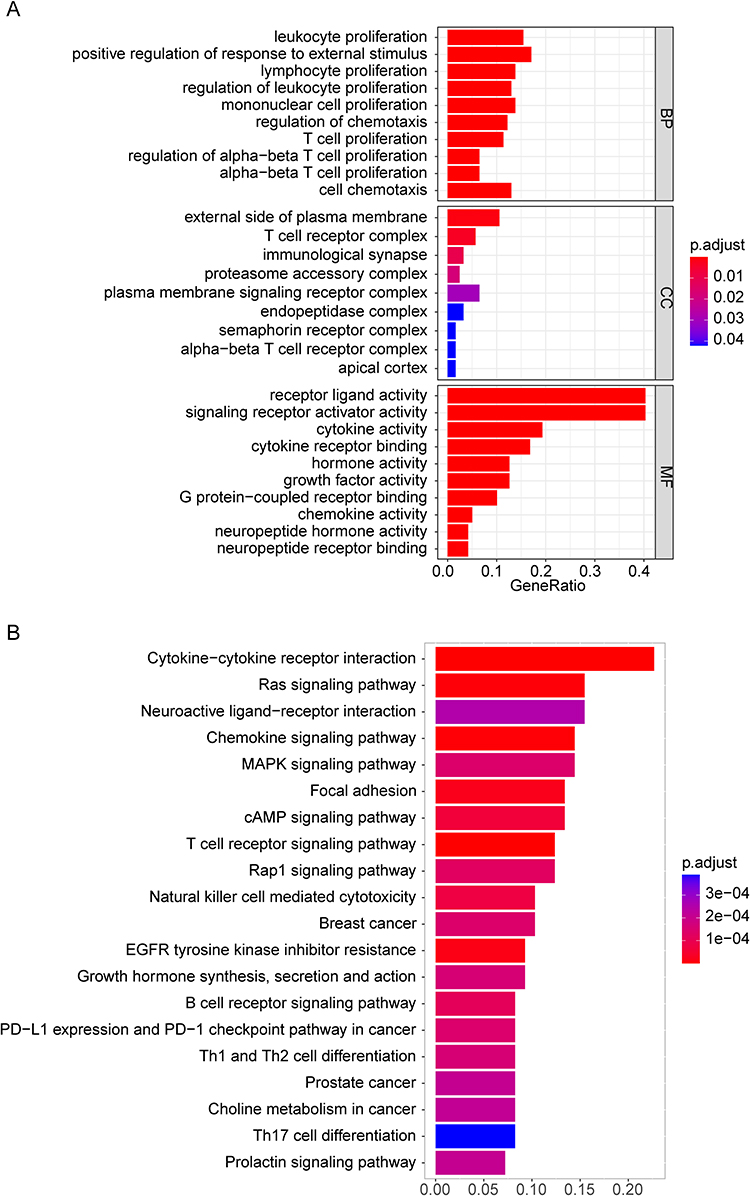 |
Figure 3 Gene Ontology (GO) and Kyoto Encyclopedia of Genes and Genomes (KEGG) enrichment analyses. (A) GO functional enrichment analysis of the differentially expressed immune-related genes (DEIRGs) with the top 10 biological process (BP) and molecular function (MF) terms and the top nine cellular component (CC) terms. The horizontal coordinate shows the ratio of the enriched gene count to the total number of genes input, while the vertical coordinate shows the GO terms. (B) The top 20 significantly enriched KEGG pathways of the DEIRGs. |
PPI Network for DEIRGs
The PPI network of DEIRGs comprised 99 sections and 285 edges. PDCD1 interacted with ZAP70, while NGF interacted with PDGFRB (Figure 4A). The top 20 genes identified using the MCC, degree, and stress algorithms were intersected to obtain 9 candidate genes (Figure 4B).
 |
Figure 4 Protein-protein interaction (PPI) network. (A) PPI network of the 99 differentially expressed immune-related genes (DEIRGs). (B) Venn diagram showing the intersection of the candidate key genes obtained using the degree, maximal clique centrality (MCC), and stress algorithms. |
Identification of Biomarkers of Uremia
The three models were constructed based on 9 candidate genes. Analysis of the residual distribution of samples revealed that RF was the best model (Figure 5A and B). The model genes with importance greater than 40 were selected as biomarkers. Finally, four biomarkers (PDCD1, NGF, PDGFRB, and ZAP70) were obtained (Figure 5C and D). The area under the ROC curve (AUC) values for the biomarkers in the training set were > 0.9 (Figure 5E). The results of ROC curve analysis of the validation set were consistent with those of the training set (AUC > 0.9) (Figure 5F), indicating that the biomarkers exhibited good diagnostic performance. Compared with those in the control group, the ZAP70 expression levels were downregulated and the PDCD1, NGF, and PDGFRB expression levels were upregulated in the uremia group in both training and validation sets (Figure 5G).
 |
Figure 5 Evaluation of the diagnostic value of biomarkers and validation of hub biomarkers. (A) Cumulative residual distribution of samples. (B) Boxplot of sample residuals. (C) The importance of the variables in the random forest (RF) model, generalized linear model (GLM), and support vector machine-recursive feature elimination (SVM-RFE) model. (D) The importance of RF models. (E and F) Receiving operating characteristic (ROC) curves were used to evaluate the ability of the model to distinguish uremia cases from healthy controls. (G) Validation of hub genes in the GSE37171 datasets. The results of validation set analysis were consistent with those of training set analysis. ***p<0.001. |
Nomogram Model of Biomarkers
A nomogram based on four biomarkers (PDCD1, NGF, PDGFRB, and ZAP70) was constructed (Figure 6A). DCA and CIC revealed that the nomogram model based on four biomarkers exhibited better predictive performance than individual biomarkers (Figure 6B and C).
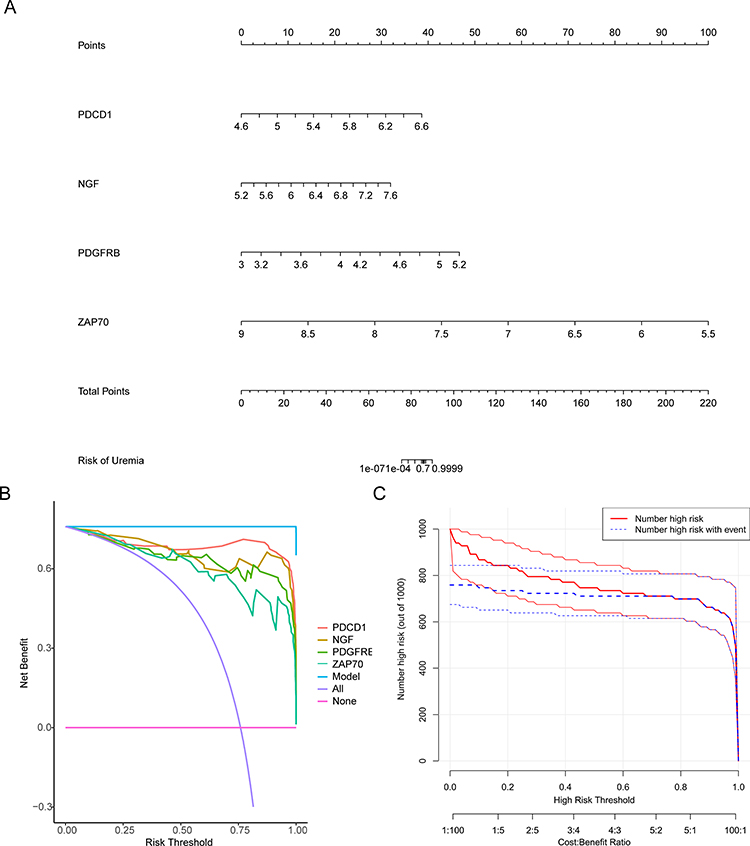 |
Figure 6 Establishment of the nomogram model in the uremia training cohort. (A) Nomogram model of uremia. (B) Decision curve for the nomogram model. (C) Clinical impact curve for the nomogram model. |
Biomarker and Immune Cell Correlation Analysis
The infiltration levels of 22 immune cells were examined in samples in the training set (Figure 7A). The proportions of resting natural killer (NK) cells, M1 macrophages, monocytes, plasma cells, M0 macrophages, and naïve B cells were significantly different between the uremia and control groups (Figure 7B). The expression of PDCD1 was significantly and negatively correlated with the proportion of resting NK cells and naïve B cells and was significantly and positively correlated with the proportion of M0 macrophages. Meanwhile, the expression of NGF was significantly and negatively correlated with the proportion of resting NK cells and naïve B cells and was significantly and positively correlated with the proportion of M1 macrophages. The expression of PDGFRB was significantly and negatively correlated with the proportion of naïve B cells. ZAP70 expression was positively correlated with the proportion of resting NK cells, naïve B cells, and regulatory T cells (Figure 7C).
 |
Figure 7 Analysis of the immune microenvironment. (A) Wind rose graph of immune cell content in control (left) and uremia samples (right). (B) Boxplot of the differential immune cell content between the uremia and control groups. *p<0.05; **p<0.01; ***p<0.001. (C) Correlation between key genes (PDCD1, NGF, PDGFRB, and ZAP70) and immune cells. |
Functional Enrichment Analysis of Biomarkers
GSEA results for each biomarker are shown in Figure 8. GO analysis suggested that the biomarkers were enriched in negative regulation of translation, regulation of translation, and ribonucleoprotein complex biogenesis (Figure 8A–D). KEGG analysis revealed that the biomarkers were enriched in neuroactive ligand-receptor interaction, herpes simplex virus 1 infection, nucleocytoplasmic transport, RNA degradation, and spliceosome (Figure 8E–H).
 |
Figure 8 Gene set enrichment analysis (GSEA). (A–D) Gene ontology (GO) enrichment analysis of PDCD1, NGF, PDGFRB, and ZAP70 gene set. (E–H) Kyoto Encyclopedia of Genes and Genomes (KEGG) analysis of PDCD1, NGF, PDGFRB, and ZAP70 gene set. |
IPA revealed that the biomarkers were involved in 30 pathways. Of these, 19 pathways were inhibited, whereas CD274 cancer immunotherapy pathway was activated (Figure 9A, Supplementary File 2). ZAP70 repressed the NK cell signaling pathway (Figure 9B).
 |
Figure 9 Ingenuity pathway analysis. (A) Classical pathway of differentially expressed genes (DEGs). The abscissa is the path name, while the ordinate is the −log (p-value). The yellow line is the default threshold of p = 0.05. Orange and blue colors indicate the activated and inhibited pathways, respectively. The intensities of Orange and blue indicate the degree of activation and inhibition, respectively. (B) The natural killer (NK) cell signaling pathway was ranked first among the signaling pathways with |z-score| >2. IPA predicted that ZAP70 regulates the NK signaling pathway. |
Biomarker Expression Validation
qRT-PCR analysis was performed to verify the expression of biomarkers in the uremia and control groups. The expression of PDGFRB was not significantly different between the uremia and control groups. Meanwhile, the expression levels of other biomarkers in the uremia group were higher than those in the control group (Figure 10A–D).
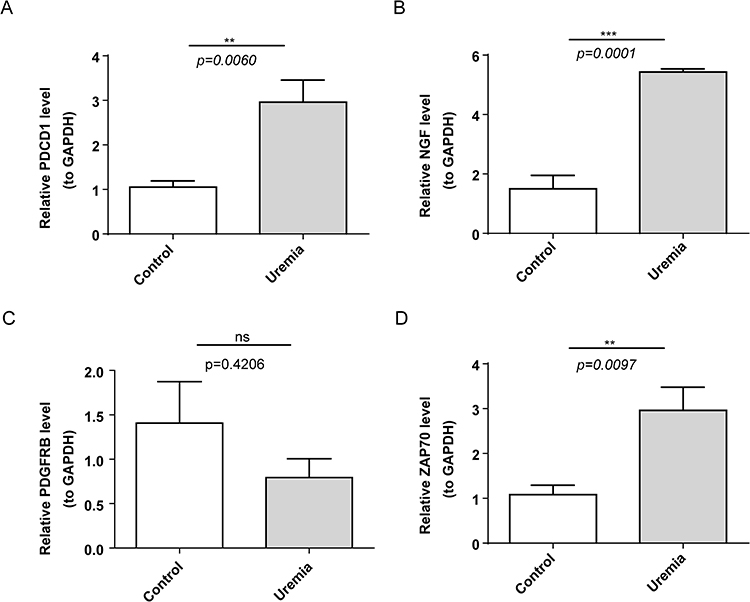 |
Figure 10 Validation of the expression levels of biomarkers. (A–D) Expression levels of PDCD1, NGF, PDGFRB, and ZAP70 in the uremia and control groups. ns, not significant;** p<0.01; ***p<0.001. |
Discussion
Uremia is not an independent disease but a clinical syndrome associated with the deterioration of kidney function, which is a typical manifestation of kidney failure, CKD, and end-stage renal disease.21 Inflammation is a key risk factor for the progression of CKD to uremia.22 Additionally, inflammation is a major etiological factor for other diseases that are independent risk factors for CKD. The aberrant regulation of the innate immune system, especially the downregulation and functional decline of T and B lymphocytes, is reported to be one of the characteristics of uremic inflammation.6,23–27 In patients undergoing hemodialysis, the contact between peripheral blood monocytes and endotoxins in dialysis membranes or dialysate can lead to the activation of monocytes, exacerbating the inflammatory response. In severe cases, the inflammatory response can adversely affect renal function, aggravate the occurrence of complications, such as malnutrition, anemia, atherosclerosis, and amyloidosis, and increase the risk of cardiovascular diseases.4
In this study, DEGs between patients with uremia and healthy subjects were intersected with IRGs to obtain DEIRGs associated with uremia. DEIRGs were subjected to functional enrichment and immune infiltration analyses. Various bioinformatics analysis methods and machine learning methods were used to identify four biomarkers (PDCD1, NGF, PDGFRB, and ZAP70). The predictive and diagnostic values of these four biomarkers and their relevance to the immune cell were evaluated.
GO and KEGG enrichment analysis demonstrated that DEIRGs were mostly enriched in immune-related functions and pathways, such as T cell proliferation. The common immune dysfunctions in patients with uremia include T cell dysfunction and immunosuppression. The two types of adaptive responses are antibody responses elicited by B cells and cell-mediated responses elicited by T cells.28 T cell production, proliferation, and antigen specificity are dysregulated in patients with uremia.1 Several immune cell types, including dendritic cells (DCs), macrophages, and T lymphocytes, are activated in injured renal tissues, suggesting that immune dysregulation may contribute to the development of CKD.29–31 Some studies have reported that T cell proliferation may improve the prognosis of patients with uremia. The clearance of plasma toxins through dialysis can increase the number and activity of T cells and may be one of the therapeutic effects of dialysis on immune dysfunctions in patients with uremia.32,33 Metabolic and endocrine disorders caused by renal dysfunction in patients with uremia, as well as the elevated levels of inflammatory factors, promote an imbalance between protein synthesis and degradation pathways, leading to impaired intracellular signal transduction, nucleic acid synthesis, and translation regulation.1,29,34,35 Thus, uremia affects multiple biological processes. Further studies are needed to elucidate the specific mechanisms and develop novel therapeutic targets for uremia.
Additionally, this study identified four DEIRGs rarely reported in uremia studies. Of these, PDCD1 exhibited the highest correlation coefficient. Previous studies have demonstrated that PDCD1, which is widely expressed in various cell types, including T cells, B cells, DCs, and macrophages, downregulates T cell responses, resulting in immunosuppression events, including T cell apoptosis, T cell failure, T cell anergy, IL-10 production, and regulatory T cell induction.36 Mizuki Kobayashi reported that PDCD1 polymorphisms were associated with severe immune-related adverse events in patients with metastatic renal cell carcinoma who were treated with nivolumab.37 Increased immune activation can lead to immune-mediated tissue damage and autoimmune diseases. Antineutrophil cytoplasmic antibody (ANCA)-associated vasculitis, a systemic autoimmune disease, promotes the progression of rapidly progressive glomerulonephritis. Samy Hakroush reported that in ANCA-associated renal vasculitis, PDCD1 expression was downregulated in the renal tubule interstitium. Tubulointerstitial PDCD1 deficiency is associated with active ANCA-associated renal vasculitis.38 Specific PDCD1 inhibitors promote ANCA-associated renal vasculitis, suggesting a similar mechanistic link between impaired PDCD1 signaling pathways and disease activation.39 Furthermore, PDCD1 and CD274 deficiencies are associated with lupus-like syndrome phenotypes in mice. The expression levels of EGF, PDGF, transferrin, and folate receptors are upregulated in the kidneys of patients with lupus nephritis and lupus nephritis mouse model.40,41 Wang et al performed WGCNA and immune infiltration analysis and revealed that PDCD1 is involved in T cell activation, monocyte differentiation, cell-cell adhesion regulation, and lymphocyte differentiation, which was consistent with the enrichment results of Zhou et al. The authors identified PDCD1 as a diagnostic biomarker for acute renal rejection.42,43 PDCD1 is involved in the pathogenesis of various kidney diseases. Uremia is the outcome of various CKDs. We hypothesize that PDCD1 regulates the pathogenesis of uremia by modulating the activation and apoptosis of T and B cells. Zhang36 and Thibult44 reported that PDCD1 regulates T and B cells, which is consistent with the results of bioinformatics analysis in this study.36
Previous studies have reported that NGF is involved in the pathogenesis of renal fibrosis. Renal fibrosis, which is characterized by glomerulosclerosis and tubulointerstitial fibrosis, is a common final manifestation of several chronic renal diseases.45 Renal disease associated with progressive fibrosis is characterized by elevated renal and serum levels of NGF. Additionally, the downstream signaling pathway of NGF and TGF-b1 mediates most of the key events involved in renal tubular epithelial-interstitial transformation, which has been supported by Vizza et al.46
Renal fibrosis is the outcome of the progression from CKD to end-stage renal disease. PDGFRB is upregulated in mesangial cells, podocytes, vascular smooth muscle cells, renal tubule cells, and interstitial cells in animal kidney disease models and patients with kidney disease.47 Focal segmental glomerulosclerosis (FSGS) is a primary podocyte disease that is a secondary consequence of severe or progressive glomerular injury. Specific treatment options are not available for FSGS, and many patients progress to end-stage renal disease. Although podocyte injury was considered to be the cause of FSGS initiation, parietal epithelial cells (PECs) are reported to be one of the main effector cells in FSGS formation. Based on the involvement of platelet-derived growth factor (PDGF) in the fibrosis process, Jia et al reported that short-term or long-term treatment of anti-PDGFRB neutralizing antibodies improved renal function, reduced the proliferation of FSGS and PEC, and promoted fibrosis activation in FSGS mice. These findings confirm that PDGFRB plays an important role in the formation and progression of FSGS.48
Most patients with uremia exhibit varying degrees of renal fibrosis, which is one of the main pathological and physiological foundations of uremia.1–3 Therefore, NGF and PDGFRB may be involved in the occurrence and development of uremia by influencing the process of renal fibrosis. PDGFRB is associated with cell development, proliferation, and transformation. The downregulation of PDGFRB is correlated with increased cell apoptosis. Therefore, premature immune aging of T cells7 in patients with uremia may be related to PDGFRB although the specific mechanism has not been elucidated.
ZAP70 is reported to be involved in the pathogenesis of clear cell renal cell carcinoma. Naghdibadi et al used WGCNA to cluster DEGs into eight distinct modules. Clear cell renal cell carcinoma-associated DEGs were mainly enriched in the translocation of ZAP70 to immune synapses, endosomal/vacuolar pathways, vascular wall cell surface interactions, and immune-related pathways.49 ZAP70, which is mainly expressed in T cells and NK cells, regulates the TCR signaling pathway. The activation of T cells promotes the CD3 (transmembrane protein)-mediated recruitment of ZAP70 to the phosphorylation domain of the TCR complex, leading to T cell activation and proliferation.50 Therefore, we hypothesized that ZAP70 promotes the development of uremia by regulating T cell activation and proliferation.
In this study, clinical samples were collected for experimental verification. Compared with those in healthy participants, the serum levels of PDCD1, NGF, and ZAP70 were significantly upregulated and the serum levels of PDGFRB were downregulated in patients with uremia. This is consistent with the results of bioinformatics analysis, indicating the reliability of the results of this study.
However, this study has some limitations. Firstly, our study was based on a limited number of samples from public databases, and expanding the sample size is a pressing issue. In addition, the effect of sample type on gene expression levels needs to be further ruled out by collecting multiple types of samples. Although we validated the gene expression levels by qRT-PCR, further validation of the analyses through experiments is still necessary. More importantly, according to our analysis results, immune cell-related genes and differential immune cells play an important role in the development and progression of uremia, but the specific mechanism of action needs to be further investigated. This will also be the focus of our subsequent research. In conclusion, we will continue to pay attention to the role of the four biomarkers in the developmental process of uremia and explore their mechanisms of action.
Conclusion
This study identified four IRGs associated with uremia using bioinformatics analysis and machine learning methods. The expression of DEGs between healthy individuals and patients with uremia was verified using clinical samples. These genes may affect the occurrence and prognosis of uremia by regulating immune function. The findings of this study improved our understanding of the mechanisms underlying the occurrence and development of uremia and may aid in developing novel therapeutic strategies for uremia.
Data Sharing Statement
The datasets used in this study were downloaded from the GEO (https://www.ncbi.nlm.nih.gov/geo/), STRING (http://string-db.org), and ImmPort (https://immport.niaid.nih.gov) databases. All data generated or analyzed during this study are included in this published article. The readers can contact Dongning Lyu (Email [email protected]) for queries.
Ethics Approval and Informed Consent
This study was approved by the ethical committee of Guangxi International Zhuang Medical Hospital (2023-007-01) and also complies with the Declaration of Helsinki. Informed consent was obtained from all study subjects.
Acknowledgments
We thank the curators of the GEO and ImmPort databases for providing access to their platforms and contributors for uploading the datasets. Additionally, we would like to thank the peer reviewers and editors for improving the quality of the manuscript.
Author Contributions
All authors made a significant contribution to the work reported, whether that is in the conception, study design, execution, acquisition of data, analysis and interpretation, or in all these areas; took part in drafting, revising or critically reviewing the article; gave final approval of the version to be published; have agreed on the journal to which the article has been submitted; and agree to be accountable for all aspects of the work.
Funding
This work was supported by the following grants: Guangxi Key Discipline of Traditional Chinese Medicine Integrated Traditional Chinese and Western Medicine Clinical Development Project (No. GZXK-Z-20-55).
Disclosure
The authors report no conflicts of interest in this work.
References
1. Meyer TW, Hostetter TH. Uremia. N Engl J Med. 2007;357(13):1316–1325. doi:10.1056/NEJMra071313
2. Almeras C, Argilés À. Progress in uremic toxin research: the general picture of uremia. Semin Dial. 2009;22(4):329–333. doi:10.1111/j.1525-139X.2009.00575.x
3. Scherer A, Günther OP, Balshaw RF, et al. Alteration of human blood cell transcriptome in uremia. BMC Med Genomics. 2013;6(1):23. doi:10.1186/1755-8794-6-23
4. Ebert T, Pawelzik SC, Witasp A, et al. Inflammation and premature ageing in chronic kidney disease. Toxins. 2020;12:227.
5. Kooman JP, Kotanko P, Schols AMWJ, et al. Chronic kidney disease and premature ageing. Nat Rev Nephrol. 2014;10(12):732–742. doi:10.1038/nrneph.2014.185
6. Sato Y, Yanagita M. Immunology of the ageing kidney. Nat Rev Nephrol. 2019;15(10):625–640. doi:10.1038/s41581-019-0185-9
7. Meijers RW, Litjens NH, de Wit EA, et al. Uremia causes premature ageing of the T cell compartment in end-stage renal disease patients. Immun Ageing. 2012;9(1):19. doi:10.1186/1742-4933-9-19
8. Ritchie ME, Phipson B, Wu D, et al. limma powers differential expression analyses for RNA-sequencing and microarray studies. Nucleic Acids Res. 2015;43(7):e47. doi:10.1093/nar/gkv007
9. Xie L, Huang G, Gao M, et al. Identification of atrial fibrillation-related lncRNA based on bioinformatic analysis. Dis Markers. 2022;2022:8307975. doi:10.1155/2022/8307975
10. Langfelder P, Horvath S. WGCNA: an R package for weighted correlation network analysis. BMC Bioinf. 2008;9(1):559. doi:10.1186/1471-2105-9-559
11. Chen H, Boutros PC. VennDiagram: a package for the generation of highly-customizable Venn and Euler diagrams in R. BMC Bioinf. 2011;12(1):35. doi:10.1186/1471-2105-12-35
12. Yu G, Wang LG, Han Y, et al. ClusterProfiler: an R package for comparing biological themes among gene clusters. Omics. 2012;16:284–287. doi:10.1089/omi.2011.0118
13. Shannon P, Markiel A, Ozier O, et al. Cytoscape: a software environment for integrated models of biomolecular interaction networks. Genome Res. 2003;13(11):2498–2504. doi:10.1101/gr.1239303
14. Lin Z, Xu Q, Miao D, et al. An inflammatory response-related gene signature can impact the immune status and predict the prognosis of Hepatocellular carcinoma. Front Oncol. 2021;11:644416. doi:10.3389/fonc.2021.644416
15. Núñez E, Steyerberg EW, Núñez J. Regression modeling strategies. Rev Esp Cardiol. 2011;64:501–507. doi:10.1016/j.recesp.2011.01.019
16. Yang Y, He W, Wang ZR, et al. Immune cell landscape in gastric cancer. Biomed Res Int. 2021;2021:1930706. doi:10.1155/2021/1930706
17. Xu M, Kong Y, Chen N, et al. Identification of immune-related gene signature and prediction of CeRNA network in active ulcerative colitis. Front Immunol. 2022;13:855645. doi:10.3389/fimmu.2022.855645
18. Liss MA, Chen Y, Rodriguez R, et al. Immunogenic heterogeneity of renal cell carcinoma with venous tumor thrombus. Urology. 2019;124:168–173. doi:10.1016/j.urology.2018.09.018
19. Chen L, Wang Y, Huang J, et al. Identification of immune-related hub genes in Parkinson’s disease. Front Genet. 2022;13:914645. doi:10.3389/fgene.2022.914645
20. Chang YC, Su CY, Chen MH, et al. Secretory RAB GTPase 3C modulates IL6-STAT3 pathway to promote colon cancer metastasis and is associated with poor prognosis. Mol Cancer. 2017;16:135. doi:10.1186/s12943-017-0687-7
21. Zemaitis MR, Foris LA, Katta S, et al. Uremia, in StatPearls. Treasure Island (FL): StatPearls Publishing Copyright © 2023, StatPearls Publishing LLC; 2023.
22. Ruiz-Ortega M, Rayego-Mateos S, Lamas S, et al. Targeting the progression of chronic kidney disease. Nat Rev Nephrol. 2020;16:269–288. doi:10.1038/s41581-019-0248-y
23. Stenvinkel P, Meyer CJ, Block GA, et al. Understanding the role of the cytoprotective transcription factor nuclear factor erythroid 2-related factor 2-lessons from evolution, the animal kingdom and rare progeroid syndromes. Nephrol Dial Transplant. 2020;35(12):2036–2045. doi:10.1093/ndt/gfz120
24. Stenvinkel P, Painer J, Kuro OM, et al. Novel treatment strategies for chronic kidney disease: insights from the animal kingdom. Nat Rev Nephrol. 2018;14:265–284. doi:10.1038/nrneph.2017.169
25. Cuadrado A, Manda G, Hassan A, et al. Transcription factor NRF2 as a therapeutic target for chronic diseases: a systems medicine approach. Pharmacol Rev. 2018;70(2):348–383. doi:10.1124/pr.117.014753
26. Kooman JP, Dekker MJ, Usvyat LA, et al. Inflammation and premature aging in advanced chronic kidney disease. Am J Physiol Renal Physiol. 2017;313(4):F938–F950. doi:10.1152/ajprenal.00256.2017
27. Cobo G, Lindholm B, Stenvinkel P. Chronic inflammation in end-stage renal disease and dialysis. Nephrol Dial Transplant. 2018;33(suppl_3):iii35–iii40. doi:10.1093/ndt/gfy175
28. Zoccali C, Mallamaci F. Innate immunity system in patients with cardiovascular and kidney disease. Circ Res. 2023;132(8):915–932. doi:10.1161/CIRCRESAHA.122.321749
29. Meng XM, Nikolic-Paterson DJ, Lan HY. Inflammatory processes in renal fibrosis. Nat Rev Nephrol. 2014;10:493–503. doi:10.1038/nrneph.2014.114
30. Kitching AR. Dendritic cells in progressive renal disease: some answers, many questions. Nephrol Dial Transplant. 2014;29(12):2185–2193. doi:10.1093/ndt/gfu076
31. Tang PM, Nikolic-Paterson DJ, Lan HY. Macrophages: versatile players in renal inflammation and fibrosis. Nat Rev Nephrol. 2019;15:144–158. doi:10.1038/s41581-019-0110-2
32. Lim WH, Kireta S, Leedham E, et al. Uremia impairs monocyte and monocyte-derived dendritic cell function in hemodialysis patients. Kidney Int. 2007;72(9):1138–1148. doi:10.1038/sj.ki.5002425
33. Lisowska KA, Pindel M, Pietruczuk K, et al. The influence of a single hemodialysis procedure on human T lymphocytes. Sci Rep. 2019;9(1):5041. doi:10.1038/s41598-019-41619-x
34. Li SS, Sheng MJ, Sun ZY, et al. Upstream and downstream regulators of Klotho expression in chronic kidney disease. Metabolism. 2023;142:155530. doi:10.1016/j.metabol.2023.155530
35. Schlosser P, Grams ME, Rhee EP. Proteomics: progress and promise of high-throughput proteomics in chronic kidney disease. Mol Cell Proteomics. 2023;22(6):100550. doi:10.1016/j.mcpro.2023.100550
36. Zhang H, Watanabe R, Berry GJ, et al. Immunoinhibitory checkpoint deficiency in medium and large vessel vasculitis. Proc Natl Acad Sci U S A. 2017;114(6):E970–E979. doi:10.1073/pnas.1616848114
37. Kobayashi M, Numakura K, Hatakeyama S, et al. Severe immune-related adverse events in patients treated with nivolumab for metastatic renal cell carcinoma are associated with PDCD1 polymorphism. Genes. 2022;13:1204.
38. Hakroush S, Tampe B. Association between loss of immune checkpoint programmed cell death protein 1 and active ANCA-associated renal vasculitis. Int J Mol Sci. 2023;24(3):2975. doi:10.3390/ijms24032975
39. Aqeel F, Monroy-Trujillo J, Geetha D. Immune checkpoint inhibitors as potential triggers for ANCA vasculitis. RMD Open. 2022;8(2):e002500. doi:10.1136/rmdopen-2022-002500
40. Xie S, Louis Sam Titus ASC, Mohan C. Elevated expression of receptors for EGF, PDGF, transferrin and folate within murine and human lupus nephritis kidneys. Clin Immunol. 2023;246:109188. doi:10.1016/j.clim.2022.109188
41. Nishimura H, Nose M, Hiai H, et al. Development of lupus-like autoimmune diseases by disruption of the PD-1 gene encoding an ITIM motif-carrying immunoreceptor. Immunity. 1999;11(2):141–151. doi:10.1016/S1074-7613(00)80089-8
42. Wang Y, Lin X, Wang C, et al. Identification of PDCD1 as a potential biomarker in acute rejection after kidney transplantation via comprehensive bioinformatic analysis. Front Immunol. 2022;13:1076546. doi:10.3389/fimmu.2022.1076546
43. Zhou H, Lu H, Sun L, et al. Diagnostic biomarkers and immune infiltration in patients with T cell-mediated rejection after kidney transplantation. Front Immunol. 2022;12:774321. doi:10.3389/fimmu.2021.774321
44. Thibult M-L, Mamessier E, Gertner-Dardenne J, et al. PD-1 is a novel regulator of human B-cell activation. Int Immunol. 2013;25(2):129–137. doi:10.1093/intimm/dxs098
45. Eddy AA, Neilson EG. Chronic kidney disease progression. J Am Soc Nephrol. 2006;17(11):2964–2966. doi:10.1681/ASN.2006070704
46. Vizza D, Perri A, Toteda G, et al. Nerve growth factor exposure promotes tubular epithelial-mesenchymal transition via TGF-β1 signaling activation. Growth Factors. 2015;33:169–180. doi:10.3109/08977194.2015.1054989
47. Triantafyllopoulou A, Franzke CW, Seshan SV, et al. Proliferative lesions and metalloproteinase activity in murine lupus nephritis mediated by type I interferons and macrophages. Proc Natl Acad Sci U S A. 2010;107:301s2–3017. doi:10.1073/pnas.0914902107
48. Jia T, Xu T, Smeets B, et al. The role of platelet-derived growth factor in focal segmental glomerulosclerosis. J Am Soc Nephrol. 2023;34(2):241–257. doi:10.1681/ASN.2022040491
49. Naghdibadi M, Momeni M, Yavari P, et al. Clear cell renal cell carcinoma: a comprehensive in silico study in searching for therapeutic targets. Kidney Blood Press Res. 2023;48(1):135–150. doi:10.1159/000529861
50. Chan AC, Iwashima M, Turck CW, et al. ZAP-70: a 70 kd protein-tyrosine kinase that associates with the TCR zeta chain. Cell. 1992;71(4):649–662. doi:10.1016/0092-8674(92)90598-7
 © 2023 The Author(s). This work is published and licensed by Dove Medical Press Limited. The full terms of this license are available at https://www.dovepress.com/terms.php and incorporate the Creative Commons Attribution - Non Commercial (unported, v3.0) License.
By accessing the work you hereby accept the Terms. Non-commercial uses of the work are permitted without any further permission from Dove Medical Press Limited, provided the work is properly attributed. For permission for commercial use of this work, please see paragraphs 4.2 and 5 of our Terms.
© 2023 The Author(s). This work is published and licensed by Dove Medical Press Limited. The full terms of this license are available at https://www.dovepress.com/terms.php and incorporate the Creative Commons Attribution - Non Commercial (unported, v3.0) License.
By accessing the work you hereby accept the Terms. Non-commercial uses of the work are permitted without any further permission from Dove Medical Press Limited, provided the work is properly attributed. For permission for commercial use of this work, please see paragraphs 4.2 and 5 of our Terms.