")
Back to Journals » Journal of Inflammation Research » Volume 15
Lipid Metabolic-Related Signature CYP19A1 is a Potential Biomarker for Prognosis and Immune Cell Infiltration in Gastric Cancer
Authors Wang N, Huang X, Long Q
Received 11 June 2022
Accepted for publication 26 August 2022
Published 5 September 2022 Volume 2022:15 Pages 5075—5088
DOI https://doi.org/10.2147/JIR.S378212
Checked for plagiarism Yes
Review by Single anonymous peer review
Peer reviewer comments 2
Editor who approved publication: Dr Adam D Bachstetter
Nan Wang,1 Xuanyu Huang,1 Qian Long2
1School of Life Science, Jiaying University, Meizhou, People’s Republic of China; 2Department of General Surgery, The Second Xiangya Hospital, Central South University, Changsha, People’s Republic of China
Correspondence: Nan Wang; Qian Long, Email [email protected]; [email protected]
Background: Altered lipid metabolism is associated with gastric cancer (GC) progression. Comprehensive analysis to identify critical lipid metabolic drivers for predicting overall survival (OS) is not fully elucidated in GC. Our study aim to explore a novel lipid metabolism-related prognostic marker for GC.
Methods: Transcriptional status and clinical features were obtained from the TCGA-STAD database. The differentially expressed lipid metabolic genes and the risk prognostic model were developed by using bioinformatics and Cox regression analyses. ROC and Kaplan–Meier analysis were established to assess the performance of the risk predictive score model. GSE84437 dataset was used for external validation. Immunochemistry (IHC) was used to examine the expression of CYP19A1 in GC patients. Gene Set Enrichment Analysis (GSEA) was conducted to elucidate the underlying enriched mechanisms. TIMER and CIBERSORT analysis were performed to explore the relationship between CYP19A1 and immune microenvironment.
Results: A novel lipid metabolic gene signature (including MTTP, CYP19A1, MYB, SERPINE1), and specifically CYP19A1, might be a promising prognostic factor for GC. Using the validation cohort, ROC curves indicate a good showing of our risk model. Based on the signature yielded a significant difference OS time between the low- and high-risk groups. Cox regression indicates that the signature is an independent prognostic variable. ROC curves present better and reliability predictive accuracy. The IHC data validate that high expression of CYP19A1 was found in GC tissues. GSEA analysis reveals that higher expression of CYP19A1 may significantly up-regulate genes involved in fatty acid metabolism and glycerolipid metabolism. CIBERSORT analysis suggests that CYP19A1 is related to the infiltration of multiple immune cells.
Conclusion: CYP19A1 could be an independent prognostic factor and a novel metabolic-targeted treatment strategy for gastric cancer.
Keywords: gastric cancer, lipid metabolism, prognostic signature, CYP19A1, immune infiltration
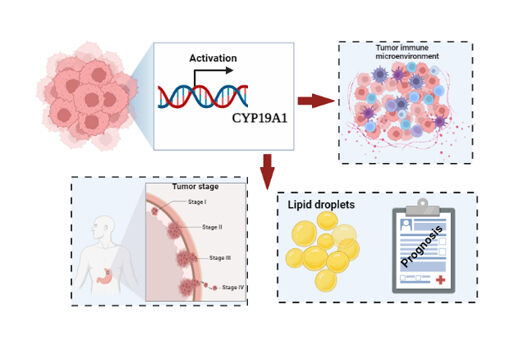
Graphical Abstract:
Introduction
Gastric cancer (GC) is the third leading cause of death globally, which is becoming a major public health crisis. According to the GLOBOCAN report, approximately one million new GC patients were estimated to be clinically diagnosed in 2018 with greater than 782,685 deaths worldwide.1 Although the recent diagnostic methods and surgical strategies have yielded many improvements, the overall 5-year survival rate of patients remains less than 30% in most countries.2 Currently, epidemiological study has shown that the incidence of GC in young people is gradually increasing, and because patients with early GC are symptom-free and no evident signs.3 Therefore, approximately >70% patients present with advanced stage and poor prognosis.4 It is clear that more work is imperative to elucidate the underlying molecular drivers involved in carcinogenesis of GC. Hence, new specific and sensitive biomarkers and targets are needed to improving GC outcomes.
Abnormal lipid metabolism is a metabolic defect process in which cancer cells meet their high energy demands. Mounting evidence shows that increased lipid synthesis or absorption strongly contributes to cancer initiation and progression.5,6 In addition, previous evidence have discussed the intricate relationship between aberrant lipid metabolism and tumorigenesis, including ovarian cancer, breast cancer and pancreatic cancer.7–10 Thus, targeting lipid-metabolic pathways has become a promising anticancer approach for tumor treatment. In recent years, construct a risk model was a practical strategy to evaluate the patients’ prognostic performance. A recent study has explored the prognostic value of genes based on lipid metabolism and provided new insights for predicting GC patients outcomes.11 Lipid-metabolic reprogramming, might occur in tumor cells and tumor microenvironment (TME) and has effect on cell proliferation, invasion and metastasis of cancer cells.6,12 Chen et al revealed that a variety of lipid signatures might act as prognostic markers in epithelial ovarian cancer.13 Targeting the lipid-metabolic pathway axis could effectively prevent metastasis of epithelial ovarian cancer.13 However, the relevant roles of lipid metabolism-related genes and intrinsic landscape involving the TME in GC have seldom been discussed.
Cytochrome P450 family 19 subfamily A member 1 (CYP19A1), a kind of steroidogenic enzyme, is speculated as a prognostic promoter, involved in the androstenedione to oestradiol steroidogenesis cascade. The level of CYP19A1 was significantly increased in the colon epithelial and carcinoma tissues.14 The role of CYP19A1 polymorphisms has been estimated in breast cancer, endometrial cancer, Alzheimer’s, obesity, and cardiovascular disease.15–19 To sum up, previous studies have focused on the polymorphism in CYP19A1 of which SNPs might be involved in the development and outcome of various cancers and diseases. However, some of the results are inconsistent on account of the location of tumors and survival rate of the patients. With this background, an overall view of the prognostic value of CYP19A1 with GC is particularly noteworthy.
In the present study, we comprehensively identified four metabolic gene signatures predicting survival of GC. Univariable and multivariable Cox regression analysis indicated that the lipid metabolism-related genes significantly predicted survival outcomes in the TCGA-STAD patients. The four lipid metabolism-related gene signature was also verified to perform well in predicting the survival in patients with GC in an independent cohort (GSE84437). Then, we measured CYP19A1 protein expression status in GC tissues, and reconfirming its roles in the progression of GC via mediating intracellular lipid metabolism. Collectively, the results of our research provided a new lipid metabolism-related gene and validated its capability for predicting outcomes of gastric cancer.
Materials and Methods
Data Acquisition
The GC mRNA expression and clinical data were obtained from the TCGA data portal (https://portal.gdc.cancer.gov/). There were 407 patients with mRNA expression and clinical data. After excluding the normal tissues and patients with less than 1-month follow-up, 334-patient cohort from the TCGA dataset was used in this study. An independent 433-patient cohort from the GSE84437 dataset was screened as validation cohort. Another validation 132-patient cohort GSE54129 was used for identify the expression of CYP19A1. Lipid metabolism-related genes were obtained from Yang et al20 and their correlation with patients’ survival were subjected to univariable Cox regression for risk predictive score model construction. cBioPortal (https://www.cbioportal.org/) was used to identify CYP19A1 gene mutations in GC patients.21
Construction of Risk Model Based on Lipid Metabolic Genes
Prognosis-related lipid metabolism genes were extracted based on multivariable Cox regression analysis. Risk predictive models were established based on the expression of lipid metabolism-related genes and corresponding coefficients. According to the median risk score, patients were stratified into low-risk and high-risk groups. Kaplan–Meier curves with the Log rank test were applied to estimate the prognostic ability of the risk signature between the two groups. The ROC curves for 1-, 3-, and 5-year survival were calculated to assess the performance of model predictions.
Gene-Enrichment and Functional Annotation Analysis
GSEA (http://www.broadinstitute.org/gsea) v.4.0.2 was carried out to identify gene sets enriched in two different groups.22 The annotated gene set list, c2.cp.kegg.v7.5. symbols.gmt, was used for GSEA analysis. By using a weighting method, the number permutations set was 1000; the Max and Min number of excluded sets were 500 and 15. The remaining parameters were set to default. FDR q value and normalized enrichment score (NES) served to sort the pathway enriched in each phenotype. Gene ontology (GO) function enrichment and Kyoto Encyclopedia of Genes and Genomes (KEGG) pathway enrichment analyses of DEGs were utilized by R package clusterProfiler, org.Hs.eg.db, enrichplot and ggplot2.23
Tumor Immune Estimation Resource (TIMER)
In order to determine the clinicopathological parameters of GC patients with the risk signature, including (gender, age, pathological T stage and N stage) and CYP19A1 expression. We generated the Cox regression analysis using TIMER (https://cistrome.shinyapps.io/timer/) database.24 The outputs of Cox model including hazard ratios and statistical significance. This model is fitted by function coxph from R package “survival”. The CYP19A1 expression profile was analyzed and the levels were presented as log2 TPM values.
Immunohistochemical (IHC) Analysis
A total of 24 patients were enrolled to assess the expression status of CYP19A1 by IHC. The study design was approved by the Institutional Review Board of Jiaying University (approve number 20-01) and all patients provided informed consent. The gastric cancer tissue microarray was performed using formalin-fixed and embedded in paraffin. The tissue microarray blocks were cut into 4 µm before the sections were treated with CYP19A1 (1:50 dilution) primary antibody according to the usual IHC protocol. After being incubated at 4°C for overnight, the sections were washed and subsequently incubated with HRP-polymer-conjugated secondary antibody for 2 h at room temperature. Then, the tissue microarray was stained with 3,3-diaminobenzidine solution and haematoxylin. Images of the staining results were observed the by Leica microscope.
Tumor-Infiltrating Immune Cell Analysis
CIBERSORT computation was performed to estimate the immune response of 22 tumor infiltration immune cells based on the gene expression in TCGA-STAD cohort.25 The relative fractions of 22 immune cells’ infiltration status in each sample of STAD were determined by CIBERSORT R package with standard annotation files. This algorithm used Monte Carlo sampling to calculate P-value for each sample, and Pearson correlation was calculated between the proportions and CYP19A1 expression. P<0.05 was selected for the following analysis.
Statistical Analysis
All statistical analyses were performed with R version 4.4.1.2 or GraphPad Prism software version 8.0. Data were analyzed with standard statistical tests where appropriate. Log rank test was applied to analyze the differences of CYP19A1 on the survival curves of patients with GC. Multiple testing was adjusted by FDR method. P < 0.05 was defined as statistically significant differences.
Results
Identification of Lipid Metabolism-Related Genes in GC Sample
Gastric cancer RNA-seq expression data from 1025 samples were extracted from the TCGA cohort. A total of 77 lipid metabolism-related genes were screened from TCGA-STAD patients. Compared with normal samples, 49 upregulated genes and 28 downregulated genes were screened according to the criteria as FDR < 0.05 and |logFC| > 2 (Figure 1A and B). Scatter plots showed the expression patterns of the differentially expressed genes (Figure 1C). Next, we performed GO term and KEGG pathway enrichment analysis to understand the function of these genes in lipid metabolism. The GO term results indicated that lipid catabolic process, protein−lipid complex, lipid transporter activity were enriched in biological progress (BP), cellular components (CC) and molecular functions (MF), respectively (Figure 1D and E). KEGG analysis revealed that these lipid metabolism-related genes were involved in fat digestion and absorption, glycerolipid metabolism and PPAR signaling pathway, which may be involved in the poor prognosis of GC patients (Figure 1F).
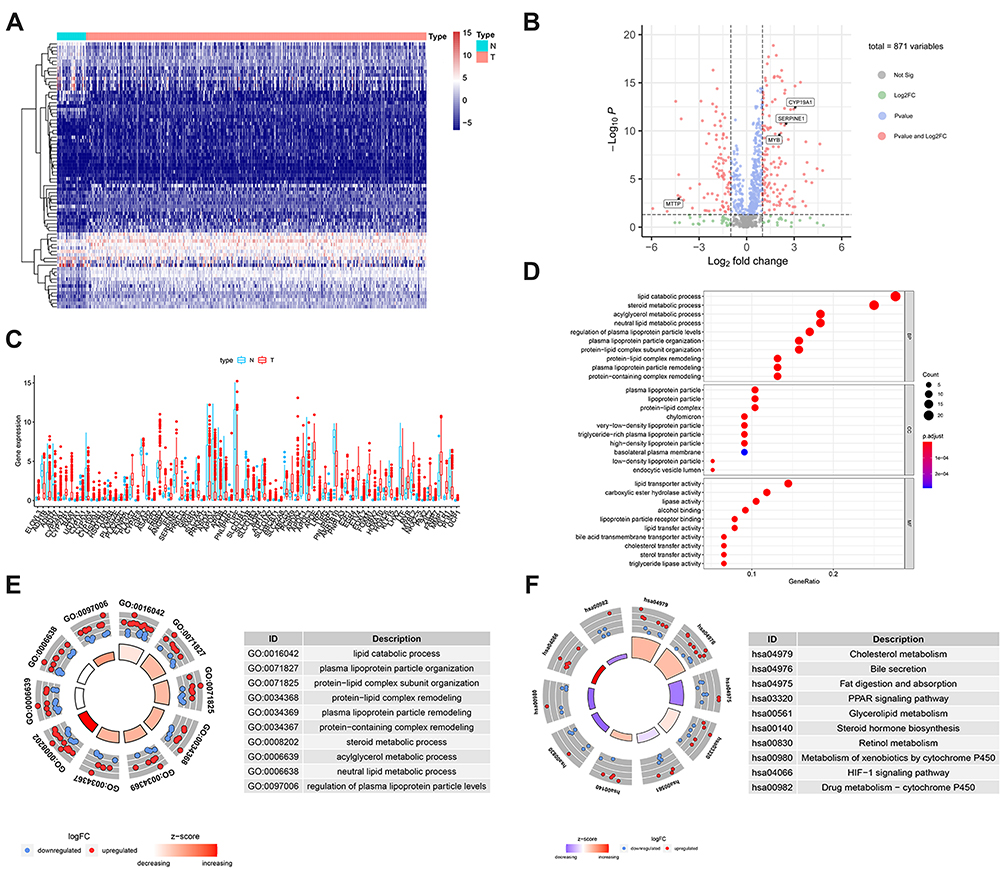 |
Figure 1 Identification of lipid metabolism-related genes from TCGA-STAD. (A) Heatmap of differentially expressed lipid metabolism-related genes between GC tumor (n=375) and normal tissues (n=32). (B) Volcano plot of the differentially expressed lipid metabolism-related genes. (C) Scatter plots of mRNA expression of differentially expressed lipid metabolism-related genes. (D) The top 30 significant terms of GO function enrichment. (E) GO circle plot of biological process (BP) differentially enriched. (F) KEGG circle plot of the logFC of the specified gene. The higher Z-score value indicated, the higher expression of the enriched pathway. |
Identification of Prognosis-Related Lipid Metabolism Genes and Establishment of a Prognostic Model
To further explore the relationship between the 77 candidate lipid metabolism-related genes and GC patients’ overall survival, univariate Cox regression analysis was conducted. A total of 10 prognosis-related genes, which were revealed to have significant correlation with patient prognosis (Figure 2A). Subsequent multivariate Cox regression analysis showed that only 4 lipid metabolism-related genes (MTTP, CYP19A1, MYB, SERPINE1) exhibited significant prognostic value for GC (Figure 2B). Then, our prognostic risk score model was based on these 4 genes using the following formula: prognosis index (PI)= (0.902× CYP19A1) + (0.172×SERPINE1) + (0.194×MTTP) + (−0.150× MYB). In order to calculate the prognostic risk score for each patient, we then divided TCGA-STAD patients into low- and high-risk groups by using the median risk value as a cut-off. The high-risk group was associated with shorter survival time and increased mortality rate (Figure 2C). Consistently, Kaplan–Meier analysis suggested that patients with high-risk scores had a shorter OS than patients with low-risk scores (Figure 2D). ROC curves were used to confirm the predictive performance of the 4-gene signature in GC (Figure 2E). Univariate Cox analysis revealed that tumor stage, age and lipid metabolism-related signature were significantly associated with overall survival of GC patients (Figure 2F). Multivariable Cox regression analysis proved the risk score model was an independent and statistically significant for GC survival (Figure 2G). ROC curves were used to verify the predictive probability of the four-gene risk signature (Figure 2H). These results revealed that our risk model was considered to be robust in predicting the survival of GC patients.
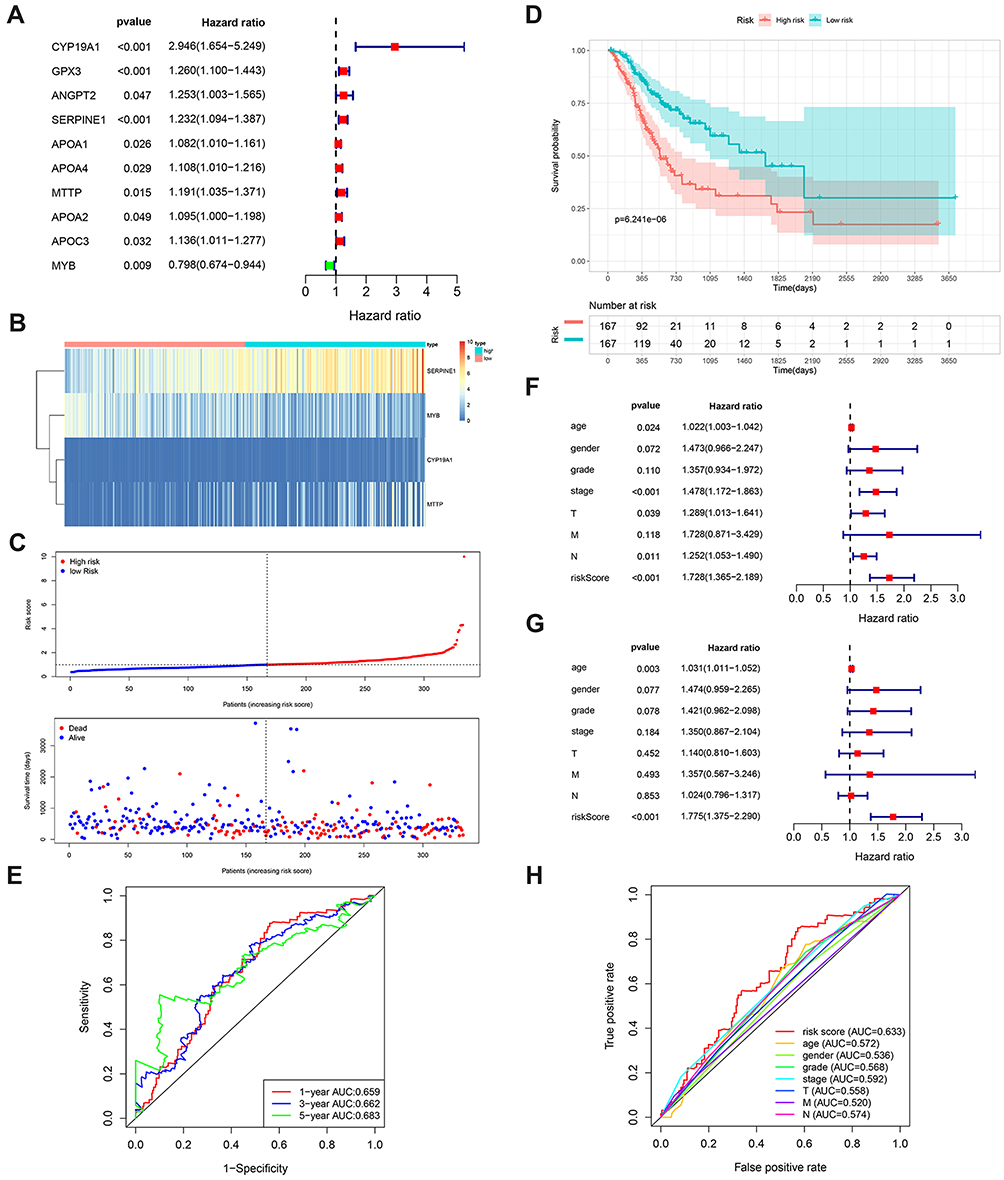 |
Figure 2 Construction of the risk model in the training cohort. (A) The forest plots of univariate Cox analysis results of the 10 lipid metabolism-related genes significantly correlated with overall survival of GC patients. (B) Heatmap illustrating the 4 metabolic genes signature expression pattern. (C) Risk score distribution and survival status of GC patients based on the 4 metabolic genes signature. (D) Survival curves of patients in the low- and high-risk groups based on the 4 lipid metabolism-related genes. (E) Time-dependent ROC analysis for the risk model at 1, 3, 5 years. (F and G) Forest plot of univariate and multivariate Cox regression analysis in the TCGA cohort. (H) ROC analysis of OS for the four-signature and the clinicopathologic parameters. |
Verification of Lipid Metabolism-Related Prognostic Risk Model via Independent Cohort
We tested our prognostic risk score model in the validation cohort (GSE84437). Consistent with the findings in the TCGA-STAD cohort, patients with high-risk scores had significantly shorter OS than that of patients with low-risk scores (Figure 3A). In addition, we explored the heat map of the four lipid metabolic genes, survival status and risk score distribution based on the lipid metabolic gene prognosis signature (Figure 3B and C). In the GSE84437 validation cohort, the ROC also illustrated the outstanding predictive ability of the risk signature (Figure 3D). These results confirmed that the 4-gene signature can also accurately predict GC patient prognosis in other independent cohort.
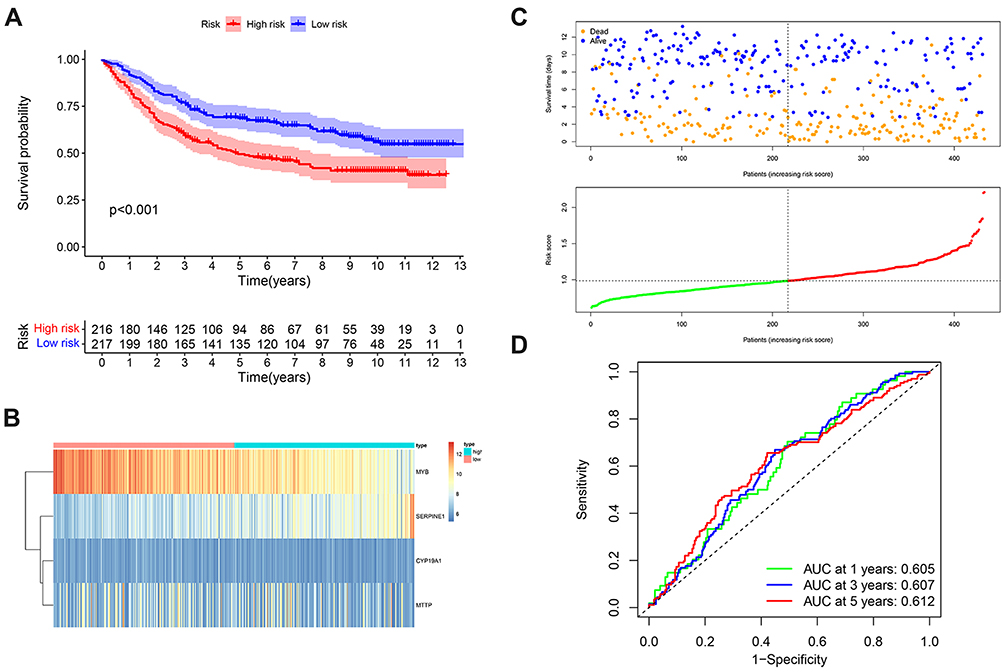 |
Figure 3 Verification of lipid metabolism-related gene signature in an independent cohort. (A) Kaplan–Meier curves of GC patients in the low - and high -risk groups based on the 4 lipid metabolism-related genes in an GSE84437 cohort. (B) Heatmap of the 4 lipid metabolism-related genes expression pattern in GSE84437 cohort. (C) Risk score distribution and survival status of GC patients based on the 4 lipid metabolism-related genes. (D) ROC curves to evaluate 1, 3, and 5-year prediction efficiency of the 4 lipid metabolism-related signature in GSE84437 cohort. |
CYP19A1 is an Independent Prognostic Factor for GC Patients
We used TIMER database to evaluate the expression of CYP19A1 pan-cancer. As displayed in Figure 4A, CYP19A1 was highly expressed in a variety of cancers including STAD. Furthermore, a multivariable Cox proportional hazard model was utilized to explore the associations between clinical factors and CYP19A1 expression to verify the independent predictive value of CYP19A1 signature for GC OS (Table 1). The results showed that CYP19A1, along with tumor stage and gender were correlated with the survival of GC patients. In addition, the TCGA and GSE54129 cohorts were utilized to investigate the expression level of CYP19A1 in gastric cancer, CYP19A1 were highly expressed in GC tissues when compared with normal tissues (Figure 4B and C). The CYP19A1 expression was strongly related with tumor stage (T,N) and gender (Table 2). A tissue microarray contain 24-case clinical samples were collected to further confirm the expression of CYP19A1 in gastric cancer. As shown in Figure 4D and E, IHC results indicated that the expression of CYP19A1 was statistically up-regulated in GC tissues. Furthermore, CYP19A1 was gradually elevated with the tumor pathological stage (Figure 4F). Meanwhile, gene alteration of CYP19A1 was analyzed via cBioportal database, and the results revealed that mutation of CYP19A1 was the most common type of gene alteration, which indicated that the mutations in CYP19A1 might contribute to its elevated expression in gastric cancer cases (Figure 4G). Thus, the results confirmed that CYP19A1 could be used as an independent prognostic factor in clinical practice.
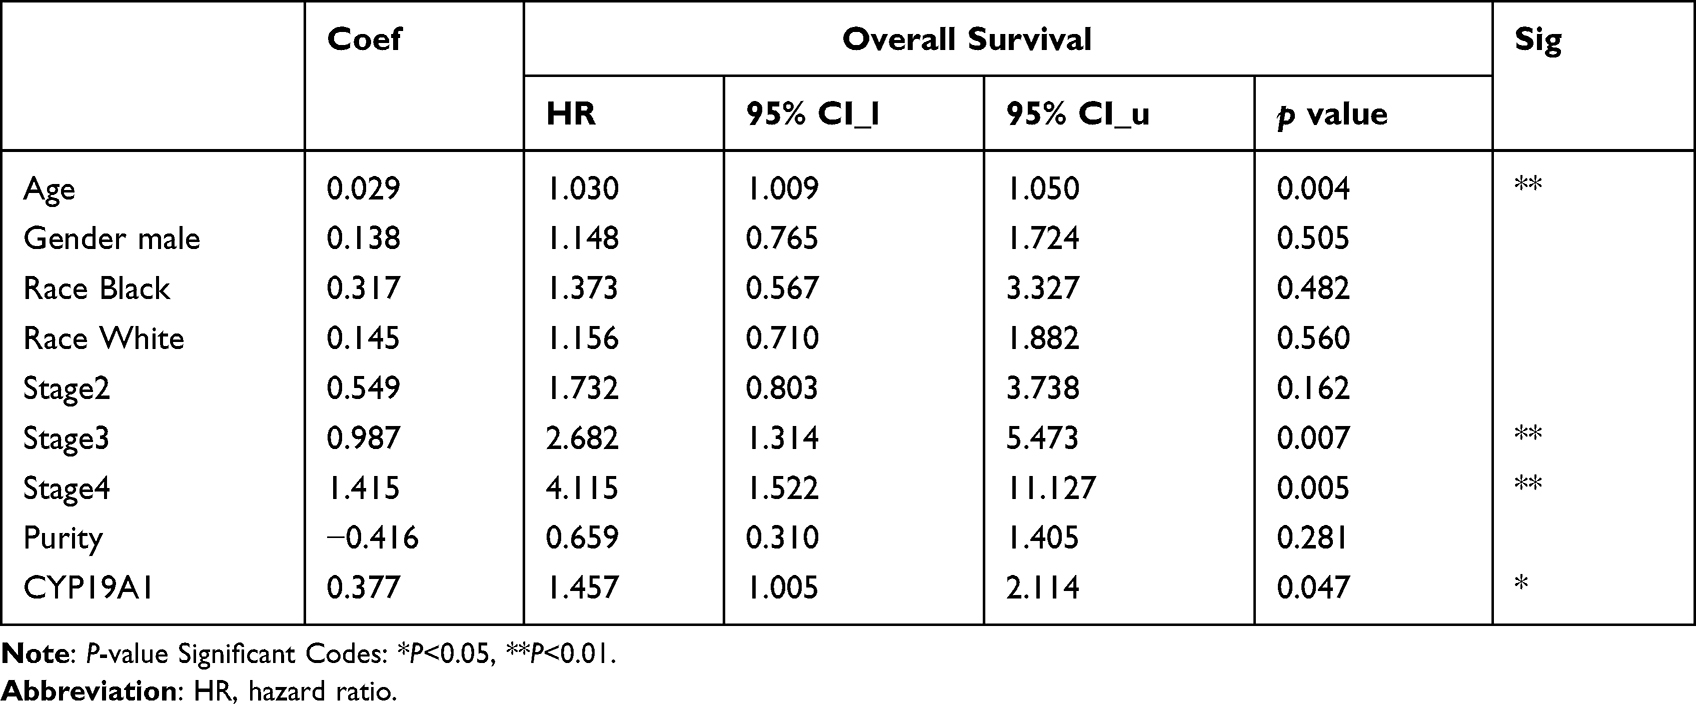 |
Table 1 Cox Proportional Hazard Model |
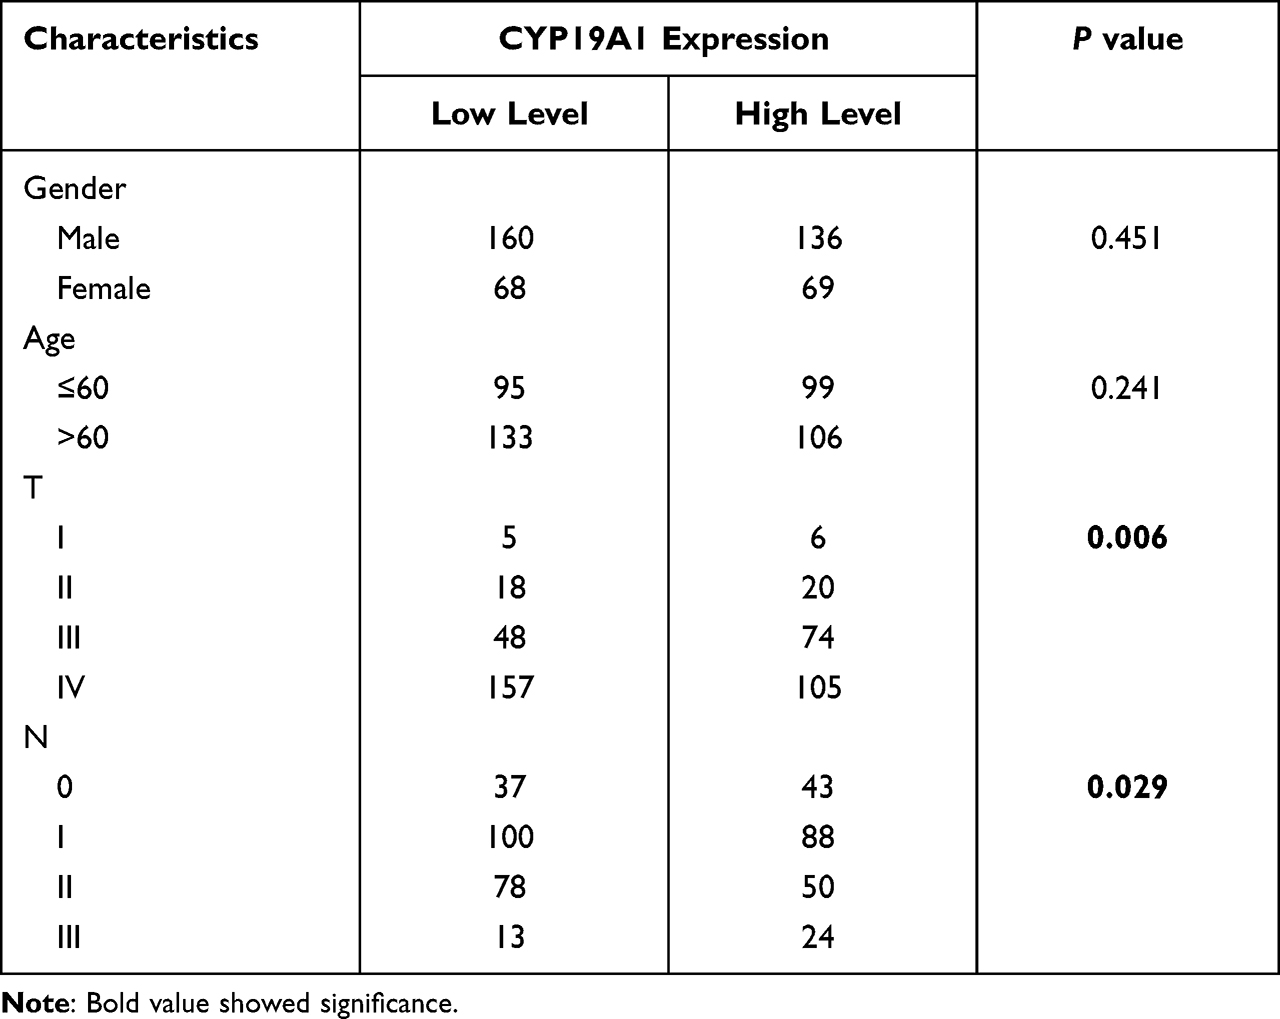 |
Table 2 Correlations Between CYP19A1 Expression and Clinical Characteristics in GEO Cohort (GSE84437) |
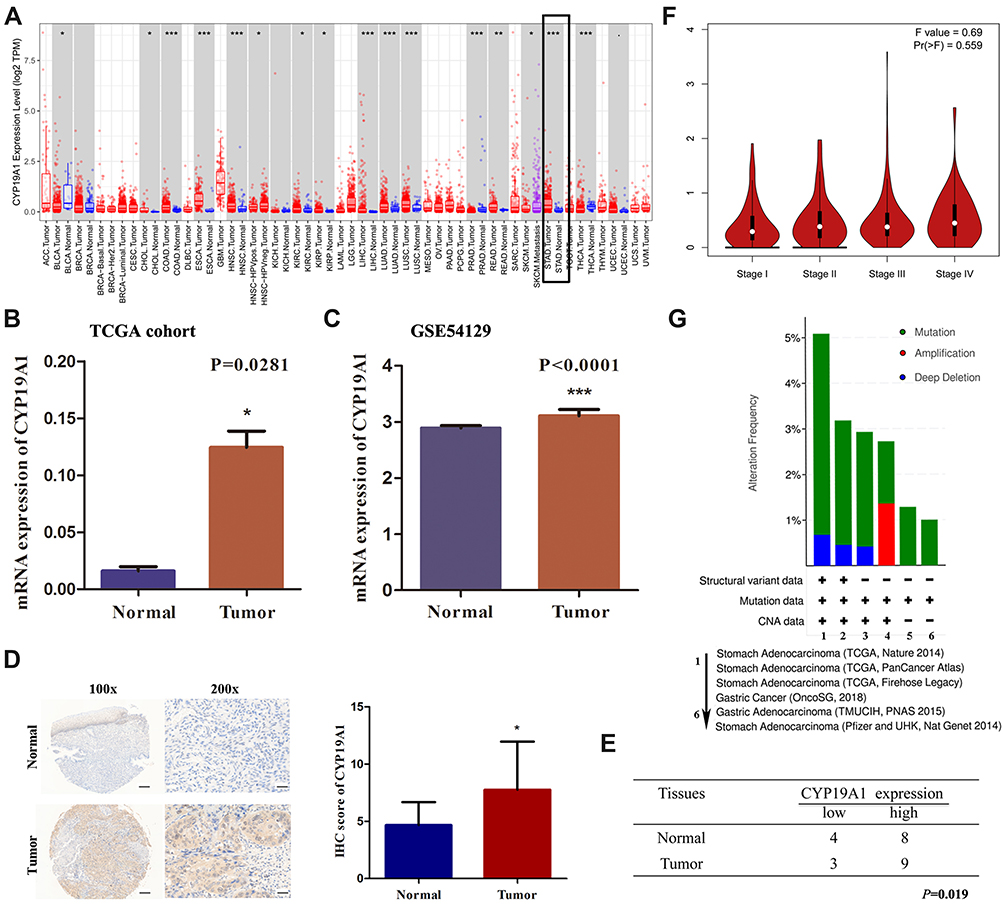 |
Figure 4 Expression level and prognostic value of CYP19A1 in gastric cancer. (A) The expression level of CYP19A1 in STAD cases was higher than that in the adjacent normal tissues. (B) CYP19A1 mRNA expression were higher in gastric cancer tissues compared with normal tissues in TCGA cohort. (C) CYP19A1 mRNA expression were significantly higher in gastric cancer tissues compared with normal tissues in GSE54129 cohort. (D) Representative IHC image show CYP19A1 protein level were higher in GC tumour tissues relative to adjacent normal tissues among 24 patients by immunohistochemistry, scale bar=100 μm. (E) Different distribution of CYP19A1 was statistically analyzed with Chi-square test. (F) The mRNA expression level of CYP19A1 in different tumor stages based on TCGA-STAD. (G) The alteration frequency of CYP19A1 were determined by cBioportal database. *P<0.05, **P<0.01, ***P<0.001. |
CYP19A1 Promotes Progression of Gastric Cancer Cells via Mediating Lipids Metabolism
To further identify pathological process and signaling pathways uniquely activated by CYP19A1, pathway enrichment analysis was constructed by GSEA in another validation cohort (GSE54129). The mean value of CYP19A1 mRNA expression was considered as the cut-off point. GSEA results showed that glycerophospholipid metabolism, glycerolipid metabolism, drug metabolism cytochrome and ether lipid metabolism pathway were enriched in CYP19A1 high–expressed group (Figure 5A). Numerous studies have reported that fatty acid metabolism plays a pivotal role in tumorigenesis of various types of cancer.26–28 The cBioportal database was applied to validate the correlation between lipid metabolism-related genes and CYP19A1 (Figure 5B). These findings confirmed our speculate that CYP19A1 may be involved in the initiation and progression of gastric cancer by mediating lipid metabolism reprogramming.
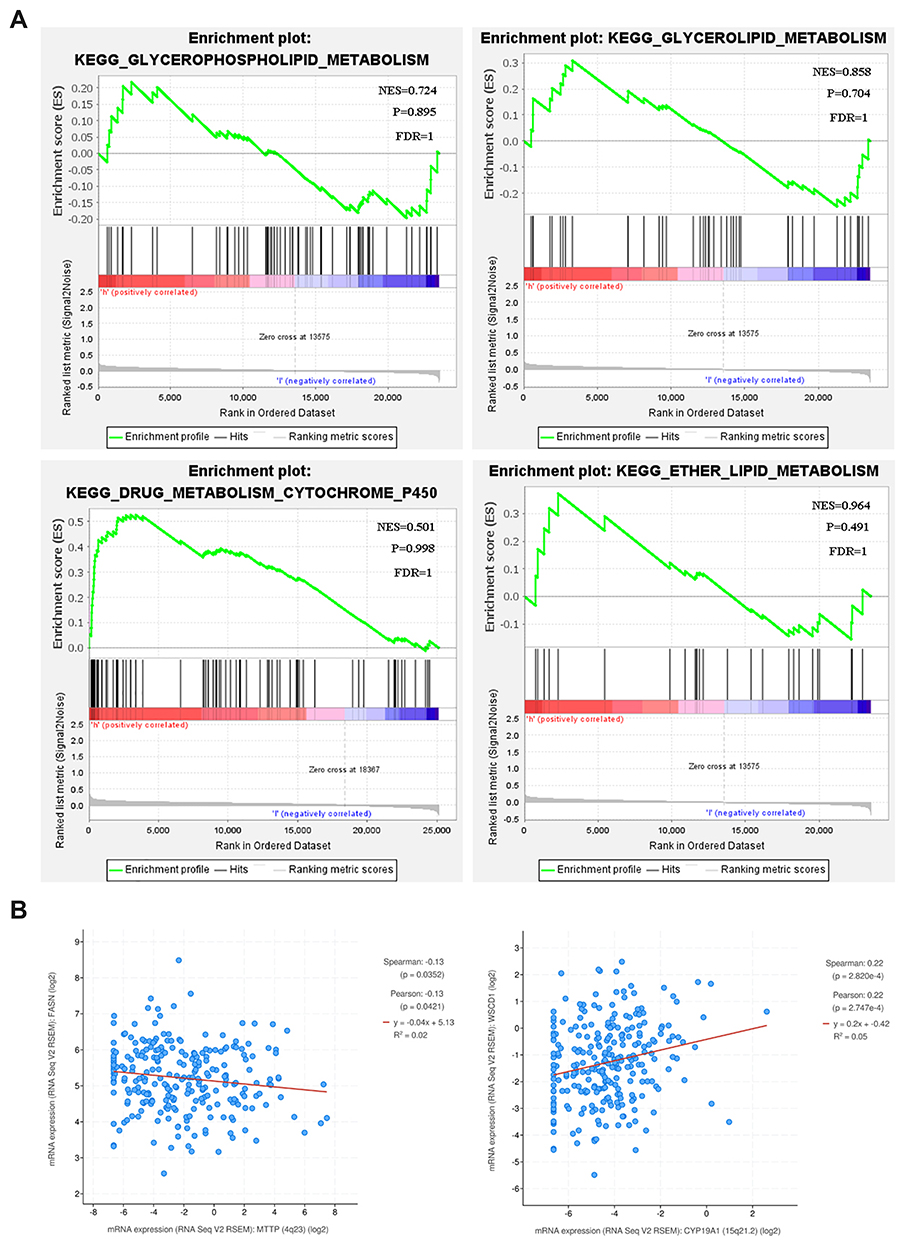 |
Figure 5 Enrichment plots by GSEA. (A) GSEA results showed that higher CYP19A1 expression was associated with activation of glycerophospholipid and glycerolipid-related metabolism pathways. (B) Correlation between CYP19A1 expression level and lipid metabolism-related genes FASN (right) and SCD1(left). |
CYP19A1 Expression is Correlated with Immune Signatures in GC
The above results support a prognostic role of CYP19A1 in GC. The function of CYP19A1 and its impact on infiltrated immune cells were not fully explored. Hence, it would be meaningful to determine whether CYP19A1 expression is associated with immune infiltration level for GC. As shown in Figure 6A, CYP19A1 expression showed significantly correlated with the infiltration levels of CD8+ T cells, activated CD4+ T memory cells, M1 Macrophages, M2 Macrophages and resting Mast cells in GC. Besides, we analyzed the correlations between CYP19A1 and immune marker genes of various immune cells in GC (Table S1). After adjustment for tumor purity in TIMER database, CYP19A1 expression was significantly correlated with most of the immune cell markers of M2 Macrophages and neutrophils, in addition to several markers of TAM and M1 Macrophages. By contrast, CYP19A1 was not significantly correlated with the immune markers of CD8+ T, T cell, B cell and NK cells in GC. These findings could partly explain why CYP19A1 is related to unfavorable prognosis in GC. Hence, these results verified our speculation that CYP19A1 is related to immune cell infiltration in GC. In addition, we found that CYP19A1 CNV has a significant correlation with the infiltration level of each immune subset (Figure 6B). We also tried to assess the differential expression of 22 tumor-infiltrating immune cells between high- and low-CYP19A1 expression groups in GC. The results showed that the activated CD4+ T memory cells, M2 Macrophages and resting Mast cells are quite different between the two groups (Figure 6C), indicating that CYP19A1 might influence the carcinogenesis of cancer through regulating various components of the TME infiltration. Meanwhile, by combining ESTIMATE (https://bioinformatics.mdanderson.org/estimate/index.html) analysis, we explored the distribution of ESTIMATE score, stromal score, and immune score between the high- and low-risk groups. It showed significant differences in ESTIMATE score and stromal score, but not in immune score between the two groups (Figure 6D–F).
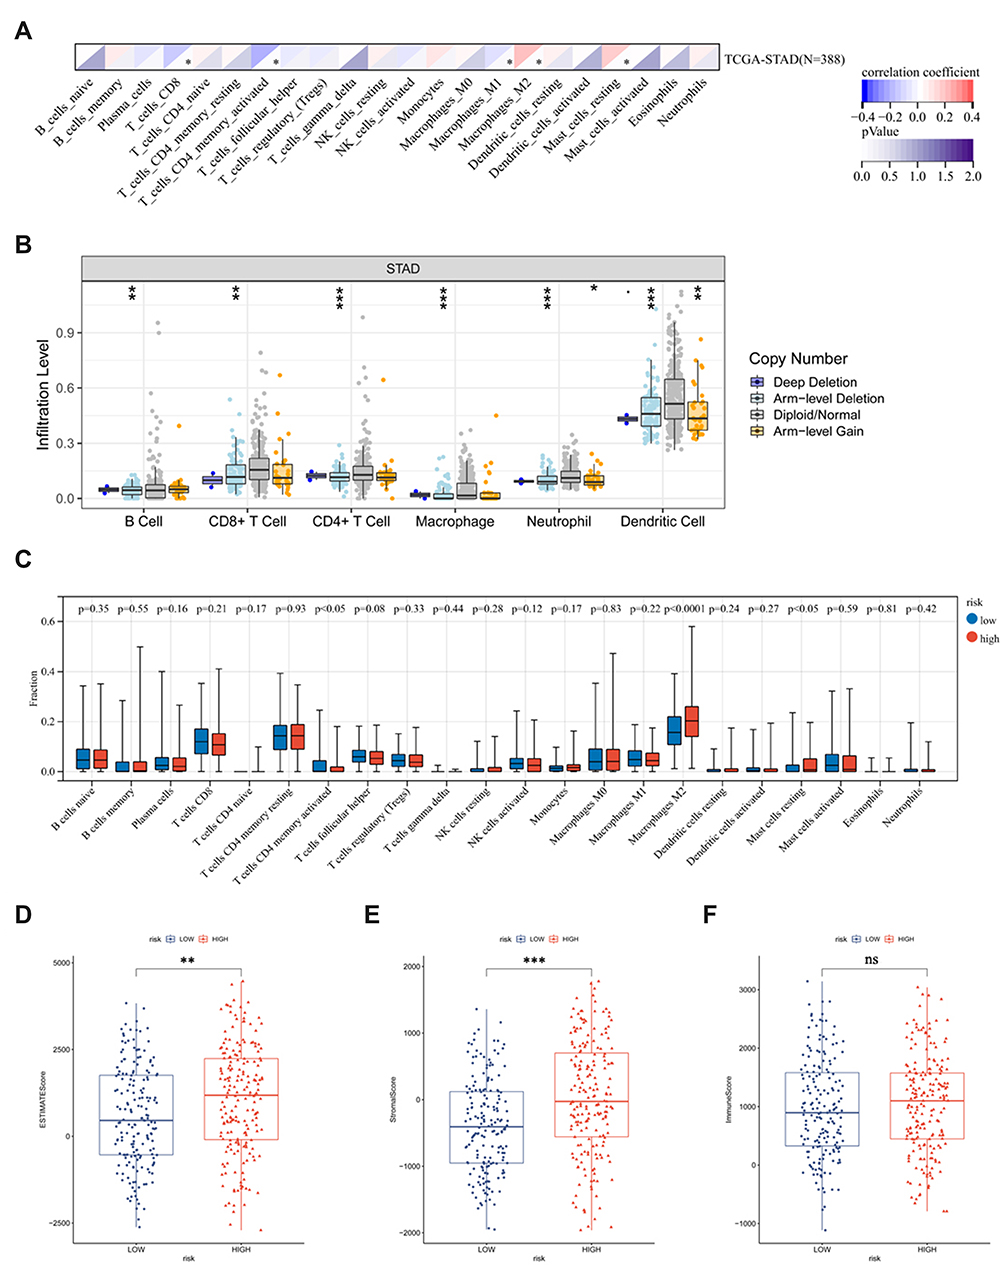 |
Figure 6 Comprehensive analysis of immune characteristics. (A) The CYP19A1 expression significantly correlated with infiltration levels of immune cells in GC. The upper triangle in each tile indicates coefficients calculated by Pearson’s correlation test, and the lower triangle indicates log10 transformed P-value. *P < 0.05. (B) CYP19A1 CNV affects the infiltrating levels of B cells, CD8+T cells, CD4+T cells, Macrophage, neutrophils, and dendritic cells in GC. (C) The change ratio of 22 immune cell subtypes in the high (blue) and low (red) CYP19A1 expression groups in GC samples. P < 0.05 was considered significant. Analysis of CYP19A1 mRNA in different ESTIMATE score (D), stromal score (E) and immune score (F) of GC tissues from TCGA database. *P<0.05, **P<0.01, ***P<0.001. Abbreviation: ns, not significant. |
Discussion
In gastric cancer in particular, it has been reported that high levels of immune cell infiltration are associated with prognosis.1,29 Despite the development of multiple treatment strategies, advanced gastric cancer patients have remained a median survival of 9–10 months.30 Patients commonly improve drug resistance, no response to immunotherapy and suffer from serious side effects, which may lead to treatment failure or interruption. Therefore, it is urgent to explore new effective biomarkers and individual strategies for gastric cancer patients.
Metabolic reprogramming is widely regarded as a hallmark in the development and progression of malignancies.5 The alteration of lipid uptake during tumorigenesis has been shown to be associated with survival and metastasis of carcinoma cells. Some studies have shown that aberrant lipid metabolism influence tumorigenesis, including gastric cancer.31 Metabolic disorder, such as cholesterol syndrome, is a risk factor of GC.11 Chang et al indicated that lipoprotein or receptor-mediated cholesterol import and steroidogenesis play crucial roles in gastric cancer progression.32 The development of RNA sequencing and microarray chips provide a new angle, a number of databases, to estimate gene expression profile and diverse cellular populations in different stages of tumors. The tumor microenvironment exists a variety of immune cells, inflammatory mediators, along with stromal cells and so on.33 The tumor mciroenvironment show strong tissue specificity, which may influences tumor-initiation and development.34 However, the crosstalk between the lipid metabolism and/or immune infiltration in gastric cancer prognosis are still limited. Less reports have given a comprehensive view of the correlation between lipid metabolism-related genes in gastric cancer and additional experimental studies are encouraged. Hence, we tried to explore and screen lipid metabolism-related biomarkers for individual strategies of GC patients. We identified 77 differentially expressed lipid metabolism-related genes based on the TCGA-STAD cohort. GO term and KEGG analysis indicated that DEGs were mainly enriched in fat digestion and absorption, Glycerolipid metabolism and PPAR signaling pathway. This was consistent with the previous research that lipogenesis is important for various tumor cell growth.35,36 The above data implied the molecular mechanism underlying lipid metabolism in GC.
Univariable Cox regression analysis screened that 10 out of the 77 DEGs indicated good clinical outcomes. Of these, four lipid metabolism-relate genes (CYP19A1, MTTP, MYB and SERPINE1) were estimated to construct a prognostic model. The risk score can facilitate the prediction of patients prognosis and guide clinical decision.37 The survival results showed a significant and remarkable difference OS time between the low-risk and high-risk groups. Cox regression analysis validated the independent prognostic value of the risk score and tumor stage in GC. In addition, nomogram analysis was used to predict the survival probability of the risk score and clinicopathological characteristics. ROC curves further indicated the reliability of our model. Similar analysis in an independent validation cohort confirmed the feasibility of our prognostic model.
It was reported that MYB and SERPINE1 are directly or indirectly associate with gastric cancer cell proliferation and metastasis.38,39 MTTP is an ER resident protein and its variant is linked to human diseases.40 However, the functions of CYP19A1 in tumor progression have not been reported in gastric cancer. In this study, CYP19A1, one hub lipid metabolism-related genes, was assessed as an independent prognostic indicator for GC patients. The expression of CYP19A1 was found to be elevated both in the mRNA and protein status in GC patients. CYP19A1 is a key enzyme catalyzing the conversion of androstenedione/testosterone to oestradiol/oestrone and is correlated with lipid metabolism process. Consistently, GSEA analysis revealed that higher expression of CYP19A1 in GC patients may significantly up-regulate genes involved in glycerophospholipid metabolism and glycerolipid metabolism. The role of CYP19A1 polymorphisms has been estimated in some types of cancers and diseases.15–19 Gene mutations are extremely pivotal in tumor initiation and progression.41 We also explored varying degrees of mutation in CYP19A1 in different GC cohort. The data indicated that the mutations in CYP19A1 might contribute to their elevated expression in GC patients. The above results suggested that CYP19A1 was an effective biomarker for the prognosis of patients with gastric cancer. In addition, due to the limitation of human tissue species, the role of CYP19A1 in GC tumorigenesis needs further experimental verification. We will address this limitation in the following research and carry out a series of clinical and experimental studies.
In recent years, clinical and pre-clinical studies have emphasized the role of metabolism in the immune responses in several cancers.20,42 Accumulating studies have confirmed that the immune elements in tumor microenvironment are extremely important in the initiation and development of tumors.34 Although gastric cancer is not generally considered as highly immunogenic carcinoma, there is still abundance of immune tumor infiltrating cells play pivotal roles in tumorigenesis. We used CIBERSORT to explore the proportion of immune cells in GC and found that CYP19A1 is significantly correlated with CD8+ T-cells, activated CD4+ T memory cells, M1 Macrophages, M2 Macrophages, resting Mast cells. TIMER analysis indicated that CYP19A1 has a significant correlation with markers of Monocyte (CD115), M1 macrophage (IRF5, COX2), M2 macrophage (CD163, MS4A4A, VSIG4), neutrophil (CD66b, CD111b), dendritic cell (BDCA-1, BDCA-4), TAM (CCL1, IL10), Th1 (IFNG, TNF), Th2 (IL13, GATA3, STAT5A), Tfh (BCL6), Th17 (STAT3, IL17A), Treg (CCR8, STAT5B, TGFB1) and T cell exhaustion (LAG3, TIM-S, GZMB). These results suggest that CYP19A1 acts a pivotal role in regulating GC tumor immunity. Deeper characterization of the tumor microenvironment of GC needs to be explored. Moreover, it was also found that CYP19A1 CNV was correlated with B cells, CD8+ T-cells, CD4+ T-cells, macrophages, neutrophils and dendritic cells. In addition, we also found that the levels of M2 macrophages and resting Mast cells were increased in the high-risk group, while the levels of activated memory CD4+ T-cells decreased. Of note, the high-risk group reflected an immunosuppressive tumor microenvironment and M2 macrophages suggested tumor-promoting effects in tumor microenvironment.43 Furthermore, fatty acids may polarize monocytes into M2-like macrophages with strong immunosuppressive phenotype.44 Hence, the lipid metabolism-related genes represent alterations in the tumor immune microenvironment of GC.
Conclusion
We use comprehensive analysis to explore lipid metabolism-related genes in gastric cancer and establish a 4-gene signature-based risk model that can accurately predict GC patient survival. Specifically, we identified one lipid metabolism-related gene CYP19A1 was significantly correlated with GC prognosis. Our findings highlight the value of CYP19A1 in gastric cancer initiation, progression and tumor immune infiltration, which was involved in glycerophospholipid metabolism process. Our research provides a strong link between lipid mechanism and GC progression and a novel metabolic-targeted treatment strategy for gastric cancer.
Author Contributions
All authors made a significant contribution to the work reported, whether that is in the conception, study design, execution, acquisition of data, analysis and interpretation, or in all these areas; took part in drafting, revising or critically reviewing the article; gave final approval of the version to be published; have agreed on the journal to which the article has been submitted; and agree to be accountable for all aspects of the work.
Funding
This research was supported by the Project of Department of Education of Guangdong Province (021KTSCX126) and Guangdong Basic and Applied Basic Research Foundation (2021A1515011026).
Disclosure
The authors declare no conflicts of interest in this work.
References
1. Bray F, Ferlay J, Soerjomataram I, Siegel RL, Torre LA, Jemal A. Global cancer statistics 2018: GLOBOCAN estimates of incidence and mortality worldwide for 36 cancers in 185 countries. CA Cancer J Clin. 2018;68:394–424. doi:10.3322/caac.21492
2. Karimi P, Islami F, Anandasabapathy S, Freedman ND, Kamangar F. Gastric cancer: descriptive epidemiology, risk factors, screening and prevention. Cancer Epidemiol Biomarkers Prev. 2014;23:700–713. doi:10.1158/1055-9965.EPI-13-1057
3. Cislo M, Filip AA, Offerhaus GJ, et al. Distinct molecular subtypes of gastric cancer: from Lauren to molecular pathology. Oncotarget. 2018;9:19427–19442. doi:10.18632/oncotarget.24827
4. Digklia A, Wagner AD. Advanced gastric cancer: current treatment landscape and future perspectives. World J Gastroenterol. 2016;22:2403–2414. doi:10.3748/wjg.v22.i8.2403
5. Vander Heiden MG, DeBerardinis RJ. Understanding the intersections between metabolism and cancer biology. Cell. 2017;168:657–669. doi:10.1016/j.cell.2016.12.039
6. Kreuzaler P, Panina Y, Segal J, Yuneva M. Adapt and conquer: metabolic flexibility in cancer growth, invasion and evasion. Mol Metab. 2020;33:83–101. doi:10.1016/j.molmet.2019.08.021
7. Ye Y, Chen Z, Shen Y, Qin Y, Wang H. Development and validation of a four-lipid metabolism gene signature for diagnosis of pancreatic cancer. FEBS Open Biol 2021;11:3153–3170. doi:10.1002/2211-5463.13074
8. Niemi RJ, Braicu EI, Kulbe H, et al. Ovarian tumors of different histologic type and clinical stage induce similar changes in lipid metabolism. Br J Cancer. 2018;119:847–854. doi:10.1038/s41416-018-0270-z
9. Hilvo M, Denkert C, Lehtinen L, et al. Novel theranostic opportunities offered by characterization of altered membrane lipid metabolism in breast cancer progression. Cancer Res. 2011;71:3236–3245. doi:10.1158/0008-5472.CAN-10-3894
10. Su P, Wang Q, Bi E, et al. Enhanced lipid accumulation and metabolism are required for the differentiation and activation of tumor-associated macrophages. Cancer Res. 2020;80:1438–1450. doi:10.1158/0008-5472.CAN-19-2994
11. Wei XL, Luo TQ, Li JN, et al. Development and validation of a prognostic classifier based on lipid metabolism–related genes in gastric cancer. Front Mol Biosci 2021;8:691143. doi:10.3389/fmolb.2021.691143
12. Nickels JT. New links between lipid accumulation and cancer progression. J Biol Chem. 2018;293:6635–6636. doi:10.1074/jbc.H118.002654
13. Chen RR, Yung MMH, Xuan Y, et al. Targeting of lipid metabolism with a metabolic inhibitor cocktail eradicates peritoneal metastases in ovarian cancer cells. Commun Biol. 2019;2:281. doi:10.1038/s42003-019-0508-1
14. Sato R, Suzuki T, Katayose Y, et al. Aromatase in colon carcinoma. Anticancer Res 2012;32:3069–3075.
15. Yang L, Wang XY, Li YT, et al. CYP19 gene polymorphisms and the susceptibility to breast cancer in Xinjiang Uigur women. Genet Mol Res. 2015;14:8473–8482. doi:10.4238/2015.July.28.15
16. Yang HP, Gonzalez Bosquet J, Li Q, et al. Common genetic variation in the sex hormone metabolic pathway and endometrial cancer risk: pathway-based evaluation of candidate genes. Carcinogenesis. 2010;31:827–833. doi:10.1093/carcin/bgp328
17. Chace C, Pang D, Weng C, et al. Variants in CYP17 and CYP19 cytochrome P450 genes are associated with onset of Alzheimer’s disease in women with down syndrome. J Alzheimers Dis. 2012;28:601–612. doi:10.3233/JAD-2011-110860
18. Sowers MR, Randolph JF, Zheng H, et al. Genetic polymorphisms and obesity influence estradiol decline during the menopause. Clin Endocrinol. 2011;74:618–623. doi:10.1111/j.1365-2265.2010.03968.x
19. Kho PF, Wang X, Cuéllar-Partida G, et al. Multi-tissue transcriptome-wide association study identifies eight candidate genes and tissue-specific gene expression underlying endometrial cancer susceptibility. Commun Biol. 2021;4:1211. doi:10.1038/s42003-021-02745-3
20. Hao Y, Li DX, Xu Y, et al. Investigation of lipid metabolism dysregulation and the effects on immune microenvironments in pan-cancer using multiple omics data. BMC Bioinform. 2019;20:195. doi:10.1186/s12859-019-2734-4
21. Gao J, Aksoy BA, Dogrusoz U, et al. Integrative analysis of complex cancer genomics and clinical profiles using the cBioPortal. Sci Signal. 2013;6:l1. doi:10.1126/scisignal.2004088
22. Subramanian A, Tamayo P, Mootha VK, et al. Gene set enrichment analysis: a knowledge-based approach for interpreting genome-wide expression profiles. Proc Natl Acad Sci USA. 2005;102:15545–15550. doi:10.1073/pnas.0506580102
23. Kanehisa M, Furumichi M, Tanabe M, Sato Y, Morishima K. KEGG: new perspectives on genomes, pathways, diseases and drugs. Nucleic Acids Res. 2017;45:D353–D361. doi:10.1093/nar/gkw1092
24. Li T, Fan J, Wang B, et al. TIMER: a web server for comprehensive analysis of tumor-infiltrating immune cells. Cancer Res. 2017;77:e108–e110. doi:10.1158/0008-5472.CAN-17-0307
25. Newman AM, Liu CL, Green MR, et al. Robust enumeration of cell subsets from tissue expression profiles. Nat Methods. 2015;12:453–457. doi:10.1038/nmeth.3337
26. Abbassi-Ghadi N, Antonowicz SS, McKenzie JS, et al. De novo lipogenesis alters the phospholipidome of esophageal adenocarcinoma. Cancer Res. 2020;80:2764–2774. doi:10.1158/0008-5472.CAN-19-4035
27. Delaney JR, Patel CB, Bapat J, et al. Autophagy gene haploinsufficiency drives chromosome instability, increases migration, and promotes early ovarian tumors. PLoS Genet. 2020;16:e1008558. doi:10.1371/journal.pgen.1008558
28. Kim JY, Kim G, Lim SC, Choi HS. LPIN1 promotes epithelial cell transformation and mammary tumourigenesis via enhancing insulin receptor substrate 1 stability. Carcinogenesis. 2016;37:1199–1209. doi:10.1093/carcin/bgw104
29. Lin C, He H, Liu H, et al. Tumour-associated macrophages-derived CXCL8 determines immune evasion through autonomous PD-L1 expression in gastric cancer. Gut. 2019;68:1764–1773. doi:10.1136/gutjnl-2018-316324
30. Ajani JA, Lee J, Sano T, Janjigian YY, Fan D, Song S. Gastric adenocarcinoma. Nat Rev Dis Primers. 2017;3:17036. doi:10.1038/nrdp.2017.36
31. Huang S, Guo Y, Li Z, et al. A systematic review of metabolomic profiling of gastric cancer and esophageal cancer. Cancer Biol Med. 2020;17:181–198. doi:10.20892/j.issn.2095-3941.2019.0348
32. Chang WC, Huang SF, Lee YM, et al. Cholesterol import and steroidogenesis are biosignatures for gastric cancer patient survival. Oncotarget. 2017;8:692–704. doi:10.18632/oncotarget.13524
33. Straussman R, Morikawa T, Shee K, et al. Tumour micro-environment elicits innate resistance to RAF inhibitors through HGF secretion. Nature. 2012;487:500–504. doi:10.1038/nature11183
34. Quail DF, Joyce JA. Microenvironmental regulation of tumor progression and metastasis. Nat Med. 2013;19:1423–1437. doi:10.1038/nm.3394
35. Hosseinzadeh A, Somi MH, Dolatkhah H, Esfahani A, Kafil HS, Ardebili SM. The effect of ω-fatty acids on mRNA expression level of PPARγ in patients with gastric adenocarcinoma. Exp Oncol. 2016;38:191–194. doi:10.31768/2312-8852.2016.38(3):191-194
36. Röhrig F, Schulze A. The multifaceted roles of fatty acid synthesis in cancer. Nat Rev Cancer. 2016;16:732–749. doi:10.1038/nrc.2016.89
37. Liu L, Hu J, Wang Y, et al. Establishment of a novel risk score model by comprehensively analyzing the immunogen database of bladder cancer to indicate clinical significance and predict prognosis. Aging. 2020;12:11967–11989. doi:10.18632/aging.103364
38. Yao F, Zhan Y, Pu Z, et al. LncRNAs target ferroptosis-related genes and impair activation of CD4+ T cell in gastric cancer. Front Cell Dev Biol. 2021;9:797339. doi:10.3389/fcell.2021.797339
39. Teng F, Zhang JX, Chen Y, et al. LncRNA NKX2-1-AS1 promotes tumor progression and angiogenesis via upregulation of SERPINE1 expression and activation of the VEGFR-2 signaling pathway in gastric cancer. Mol Oncol. 2021;15:1234–1255. doi:10.1002/1878-0261.12911
40. Hooper AJ, van Bockxmeer FM, Burnett JR. Monogenic hypocholesterolaemic lipid disorders and apolipoprotein B metabolism. Crit Rev Clin Lab Sci. 2005;42:515–545. doi:10.1080/10408360500295113
41. Horn HF, Vousden KH. Coping with stress: multiple ways to activate p53. Oncogene. 2007;26:1306–1316. doi:10.1038/sj.onc.1210263
42. Bleve A, Durante B, Sica A, Consonni FM. Lipid metabolism and cancer immunotherapy: immunosuppressive myeloid cells at the crossroad. Int J Mol Sci. 2020;21:5845. doi:10.3390/ijms21165845
43. Phan AT, Goldrath AW, Glass CK. Metabolic and epigenetic coordination of T cell and macrophage Immunity. Immunity. 2017;46:714–729. doi:10.1016/j.immuni.2017.04.016
44. Wu H, Han Y, Rodriguez SY, et al. Lipid droplet-dependent fatty acid metabolism controls the immune suppressive phenotype of tumor-associated macrophages. EMBO Mol Med. 2019;11:e10698. doi:10.15252/emmm.201910698
 © 2022 The Author(s). This work is published and licensed by Dove Medical Press Limited. The full terms of this license are available at https://www.dovepress.com/terms.php and incorporate the Creative Commons Attribution - Non Commercial (unported, v3.0) License.
By accessing the work you hereby accept the Terms. Non-commercial uses of the work are permitted without any further permission from Dove Medical Press Limited, provided the work is properly attributed. For permission for commercial use of this work, please see paragraphs 4.2 and 5 of our Terms.
© 2022 The Author(s). This work is published and licensed by Dove Medical Press Limited. The full terms of this license are available at https://www.dovepress.com/terms.php and incorporate the Creative Commons Attribution - Non Commercial (unported, v3.0) License.
By accessing the work you hereby accept the Terms. Non-commercial uses of the work are permitted without any further permission from Dove Medical Press Limited, provided the work is properly attributed. For permission for commercial use of this work, please see paragraphs 4.2 and 5 of our Terms.