Back to Journals » Clinical Interventions in Aging » Volume 21
A Web-Based Machine Learning Calculator for Predicting Preoperative Deep Vein Thrombosis in Elderly Hip Fractures Patients
Authors Zhang S ![]() , Zhou J, Han Y, Tian Z, Yao Q
, Zhou J, Han Y, Tian Z, Yao Q
Received 3 April 2026
Accepted for publication 16 June 2026
Published 25 June 2026 Volume 2026:21 614064
DOI https://doi.org/10.2147/CIA.S614064
Checked for plagiarism Yes
Review by Single anonymous peer review
Peer reviewer comments 2
Editor who approved publication: Dr Maddalena Illario
Shudong Zhang,* Jiaxuan Zhou,* Yuyang Han, Zhuang Tian, Qi Yao
Department of Joint Surgery, Beijing Shijitan Hospital, Capital Medical University, Beijing, 100038, People’s Republic of China
*These authors contributed equally to this work
Correspondence: Zhuang Tian, Email [email protected] Qi Yao, Email [email protected]
Purpose: Hip fractures are often associated with deep vein thrombosis (DVT). This study aimed to develop machine learning models to predict preoperative DVT risk using basic clinical data from elderly patients with hip fractures.
Methods: Clinical data were retrospectively collected from 538 elderly hip fracture patients hospitalized at Beijing Shijitan Hospital. Eighteen clinical parameters were assessed. Patients from October 2021 to September 2024 (n=405) formed the development cohort, randomly divided into training and test sets (7:3). Patients from October 2024 to September 2025 (n=133) constituted the temporal validation set. Following Least Absolute Shrinkage and Selection Operator (LASSO) regression for feature selection, three models—logistic regression, light-gradient boosting machine, and support vector machine (SVM)—were developed. Performance was assessed using the area under the receiver operating characteristic curve (AUC), sensitivity, Brier score, calibration curves, and decision curve analysis (DCA). SHapley additive explanations (SHAP) were used for interpretability.
Results: LASSO selected seven features: fracture type, time from injury to admission, white blood cell count, red blood cell count, C-reactive protein, D-dimer, and prothrombin time. The SVM model demonstrated the best overall performance. In the test set, it achieved an AUC of 0.8525 (95% CI: 0.7624– 0.9426), sensitivity of 0.7200, and Brier score of 0.1231. Performance remained stable in the temporal validation set with an AUC of 0.8360 (95% CI: 0.7470– 0.9260), sensitivity of 0.6562, and Brier score of 0.1328. Calibration curves and DCA indicated reliable probability predictions and clinical net benefit. SHAP identified prothrombin time as the most important predictor. A web-based calculator was developed based on the SVM model.
Conclusion: The developed SVM model shows potential as a dynamic, interpretable risk assessment tool for preoperative DVT in elderly hip fracture patients. It may provide a helpful quantitative reference to assist clinicians with perioperative DVT monitoring and early warning.
Keywords: hip fracture, DVT, machine learning, support vector machine, SHAP, temporal validation
Introduction
Hip fractures are the most severe complication of osteoporosis.1 By 2050, the global number of hip fracture patients is projected to reach 4.5–6.3 million, and postoperative complications are likely to occur, with a mortality rate of 15–30% within one year post-fracture.2 Deep vein thrombosis (DVT) is the third most common cause of cardiovascular deaths worldwide. It not only carries the risk of pulmonary embolism but also leads to post-thrombotic syndrome in approximately one-third of the affected individuals, manifesting as pain, swelling, and ulceration.3 A close relationship exists between hip fractures and DVT, underpinned by Virchow’s triad: fractures can cause vascular endothelial injury; bed rest and immobilization lead to slow, stagnant blood flow; and traumatic stress induces a hypercoagulable state. These three factors elucidate the high incidence of DVT in hip fracture patients.4 The elderly hip fracture population often presents with multiple chronic comorbidities such as diabetes, cardiovascular disease, and cognitive impairment.5 Postinjury physical frailty poses significant challenges for subsequent diagnosis and treatment. Furthermore, the healthcare burden associated with hip fractures in the elderly population in China is expected to increase substantially over the next 30 years.6–8
The incidence of preoperative DVT in elderly patients with hip fractures ranges from 9% to 39% and significantly affects the surgical timing, anticoagulation strategies, postoperative recovery, and functional rehabilitation.9 Currently, the Caprini risk assessment model is frequently used to clinically evaluate DVT risk. However, this population has specific characteristics that are not fully captured by such general tools, including the time from injury to hospital admission, and changes in laboratory parameters induced by stress following a traumatic fracture. A 10-year retrospective study involving 1114 elderly patients with hip fracture conducted by Guo et al found that the Caprini score had limited predictive efficacy (AUC = 0.614).10 Ge et al applied machine learning to a cohort of 637 elderly hip fracture patients with hypertension, revealing that age, time from injury to hospital admission, and atrial fibrillation were significant predictors.11 These studies predominantly utilized random internal validation through data splitting and lacked temporal or external validation, limiting their clinical applicability. The diagnosis and exclusion of lower-extremity DVT primarily rely on vascular ultrasonography. Ultrasound results merely reflect the instantaneous state of the vessel and cannot assess the dynamic risk of DVT. Thus, they are insufficient to guide anticoagulation decisions. Conducting DVT research that specifically focuses on elderly patients with hip fractures is essential. Machine learning plays a significant role in developing clinical risk prediction models and has established standardized operational procedures.12,13
Therefore, we developed machine-learning models to predict the risk of lower-extremity DVT in elderly patients with hip fractures. This study incorporated common clinical indicators, such as fracture type, time from injury to hospital admission, and medical history, without incurring additional medical expenses for patients. Given the evidence suggesting that DVT is a process driven by inflammation and involves coagulation factors,14 we included inflammatory markers such as C-reactive protein (CRP) and white blood cell count alongside coagulation parameters to explore the relationship between inflammation and DVT from a clinical perspective. The data were partitioned to establish a temporal validation set, allowing the assessment of the generalizability of the model over time. Furthermore, SHapley additive explanation (SHAP) analysis was employed for visual interpretation to address the limitation of poor interpretability often associated with “black box” machine learning models.15 This study aimed to develop a preoperative DVT assessment tool for elderly patients with hip fractures that balances clinical interpretability and predictive accuracy, thereby providing a scientific basis for personalized anticoagulation strategies and dynamic perioperative DVT risk monitoring.
Materials and Methods
Patients and Data Collection
This study retrospectively enrolled elderly patients with hip fractures who were hospitalized at Beijing Shijitan Hospital, Capital Medical University, between October 2021 and September 2025. After screening based on predefined inclusion and exclusion criteria, 538 patients met the eligibility criteria for this study. The cohort comprised 160 males and 378 females, 135 of whom were diagnosed with lower-extremity DVT. This retrospective study was approved by the Ethics Committee of Beijing Shijitan Hospital, Capital Medical University (No. IIT2025-124-001).
The inclusion criteria were as follows: (1) patients diagnosed with femoral neck fracture or intertrochanteric fracture, and (2) age > 60 years. The exclusion criteria were as follows: (1) history of pre-existing lower-extremity DVT, (2) end-stage malignant tumors, (3) multiple fractures, (4) inability to cooperate with lower-extremity vascular ultrasound examination, (5) time from injury to hospital admission exceeding 7 days, and (6) requirement for long-term bed rest and inability to perform activities of daily living independently prior to injury.
Diagnostic criteria for preoperative lower-extremity DVT: The diagnosis of preoperative lower-extremity DVT was established based on vascular ultrasound examination performed within 24 h of hospitalization for hip fracture and prior to hip surgery. Patients diagnosed with lower extremity DVT, including both proximal and distal DVT, were included in the DVT group.
Data Collection
The following variables were collected for each patient:
Demographic and Clinical Characteristics: Fracture type and hip fractures in this study included femoral neck and intertrochanteric fractures, confirmed by Computed Tomography (CT) examination. Sex, age, diabetes mellitus, hypertension, and time from injury to hospital admission.
Laboratory Parameters included white blood cell count (WBC), neutrophil count (NE), platelet count (PLT), red blood cell count (RBC), hemoglobin (HGB), total cholesterol (TC), C-reactive protein (CRP), D-dimer, prothrombin time (PT-S), activated partial thromboplastin time (APTT), myoglobin (Mb), and creatine kinase-MB (CK-MB).
Data Preprocessing
Outlier Handling: Outliers were initially identified through box plot analysis. In accordance with clinical contextual considerations, identified outliers were removed and subsequently converted into missing values to maintain data integrity.
Missing Value Imputation: Missing data originating from two sources. First, for patients with stable vital signs upon admission, myoglobin and CK-MB tests were not performed to avoid unnecessary examinations, resulting in a small proportion of missing values. Second, missing values were generated following the removal of outliers, as described above. A random seed was established to ensure reproducibility of the results. Missing value imputation was performed using the MissForest random forest imputation method, which utilizes non-missing values as the training set to predict missing values. After ten iterations, the predicted values for the missing entries were obtained. Imputation demonstrated minimal impact on subsequent data analysis, and the imputed dataset was employed for all downstream analyses. A complete-case analysis was avoided to prevent potential selection bias, as the missing values predominantly corresponded to clinically stable patients for whom specific tests were routinely omitted. Considering the low rate of missingness, the MissForest algorithm was utilized, as it is methodologically recognized for preserving underlying data distributions and mitigating imputation-related bias.
Feature Variable Selection
Data were standardized using the Z-score method to ensure comparability across different features, while preserving the underlying data distribution characteristics, thereby enhancing model accuracy and accelerating model convergence. Categorical variables were factorized. Feature variable selection was performed using the Least Absolute Shrinkage and Selection Operator (Lasso) regression with L1 regularization to mitigate the model overfitting risk. The optimal penalty parameter λ was determined through 10-fold cross-validation, and the selected features were utilized for subsequent machine learning model development (Figure 1).
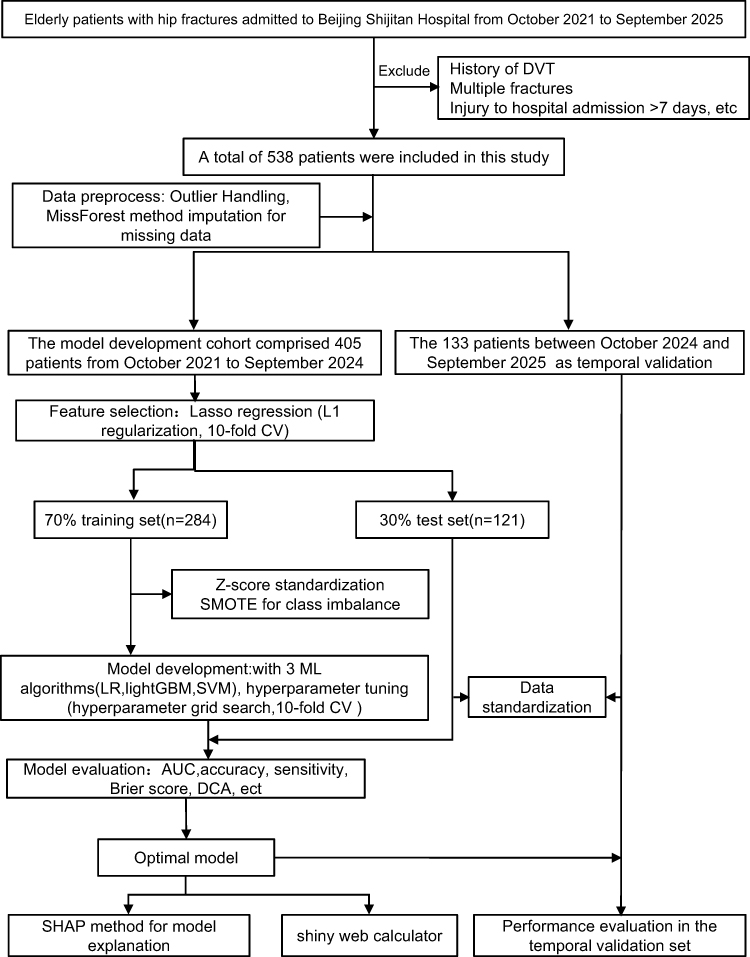 |
Figure 1 Flow chart. Abbreviations: CV, cross-validation; DVT, Deep vein thrombosis; ML, machine learning; LR, Logistic regression; LightGBM, light gradient boosting machine; SVM, support vector machine; DCA, Decision curve analysis; AUC, area under the receiver operating characteristic curve; SHAP, SHapley additive explanations; SMOTE, Synthetic Minority Over-sampling Technique. |
Model Development, Evaluation, Validation, and SHAP-Based Interpretability
A total of 405 patients, admitted between October 2021 and September 2024, were included in the model development cohort. To ensure reproducibility, a random seed was established and the data were partitioned into a training set (n=284) and a test set (n=121) using stratified sampling with a 7:3 ratio, facilitating model construction and internal validation. The patients admitted between October 2024 and September 2025 (n=133) were designated as the temporal validation set. Variable selection via Lasso regression was performed exclusively within the development cohort.
Given the relatively low proportion of patients with DVT, a synthetic minority oversampling technique (SMOTE) was applied to address class imbalance. This approach enhances the sample diversity and mitigates the overfitting risk. Notably, class imbalance handling was applied solely to the training set, whereas the test and temporal validation sets remained unchanged to preserve real-world prevalence distributions.
Three predictive models: logistic regression, light gradient boosting machine (LightGBM), and support vector machine (SVM) were constructed using the variables selected by LASSO regression. The performances and stabilities of the models were systematically compared. Hyperparameter tuning was conducted through 10-fold cross-validation coupled with a hyperparameter grid search to define optimal parameter ranges, thereby enhancing the model stability and preventing overfitting. Detailed information regarding the grid search ranges and the final optimal parameters for each model is provided in Supplementary Tables 1 and 2.
Model performance was assessed using multiple metrics derived from confusion matrices, including the area under the receiver operating characteristic curve (AUC), accuracy, sensitivity, specificity, precision, F1 score, and Brier score, for both the training and test sets. Calibration and decision curve analyses were performed to evaluate the probability predictions and clinical utility, respectively, enabling the identification of the optimal model.
The selected optimal machine learning model was subsequently applied to the temporal validation set to assess its performance and temporal generalizability. Finally, the SHAP analysis was employed to elucidate the model predictions and characterize the feature contributions, enhancing the interpretability of the optimal predictive model.
Shiny Web Calculator
To facilitate clinical utility and accessibility, we developed an interactive web-based calculator using the Shiny framework, based on the SVM prediction model. This tool allows clinicians to input patient-specific clinical information and subsequently generate an individualized predicted risk of DVT along with corresponding evidence-based treatment recommendations to assist clinical decision-making.
Statistical Analysis
All statistical analyses were performed using R software (version 4.4.3). Continuous variables with normal distribution are expressed as mean ± standard deviation, and comparisons between groups were conducted using an independent sample t-test. Non-normally distributed continuous variables were presented as medians with interquartile ranges, and differences were assessed using the Mann–Whitney U-test. Categorical variables are reported as frequencies with percentages, and group comparisons were performed using the chi-square test.
Missing values resulting from small-sample omissions were addressed through multiple imputations using the MissForest random forest algorithm. Feature selection was subsequently performed using LASSO regression to identify variables for inclusion in machine learning model development. Three distinct modeling approaches were employed for the prediction: logistic regression, SVM, and light gradient boosting machine (LightGBM).
Model performance was comprehensively evaluated using multiple metrics, including AUC, accuracy, sensitivity, specificity, precision, F1 score, and Brier score. To enhance clinical interpretability, a SHAP analysis was conducted to elucidate the contribution of features to model predictions. Statistical significance was defined as a two-tailed P-value of < 0.05.
Results
Patient Characteristics
The baseline characteristics of patients in the model development cohort are shown in Table 1. Among the 405 patients, statistically significant differences were observed between the DVT and non-DVT groups for fracture type, sex, age, time from injury to hospital admission, white blood cell count, neutrophil count, red blood cell count, hemoglobin, total cholesterol, CRP, D-Dimer, prothrombin time, and CK-MB (P < 0.05). No significant differences were detected between the training and test sets for these variables (P > 0.05), confirming the randomness and balance of the data partitioning.
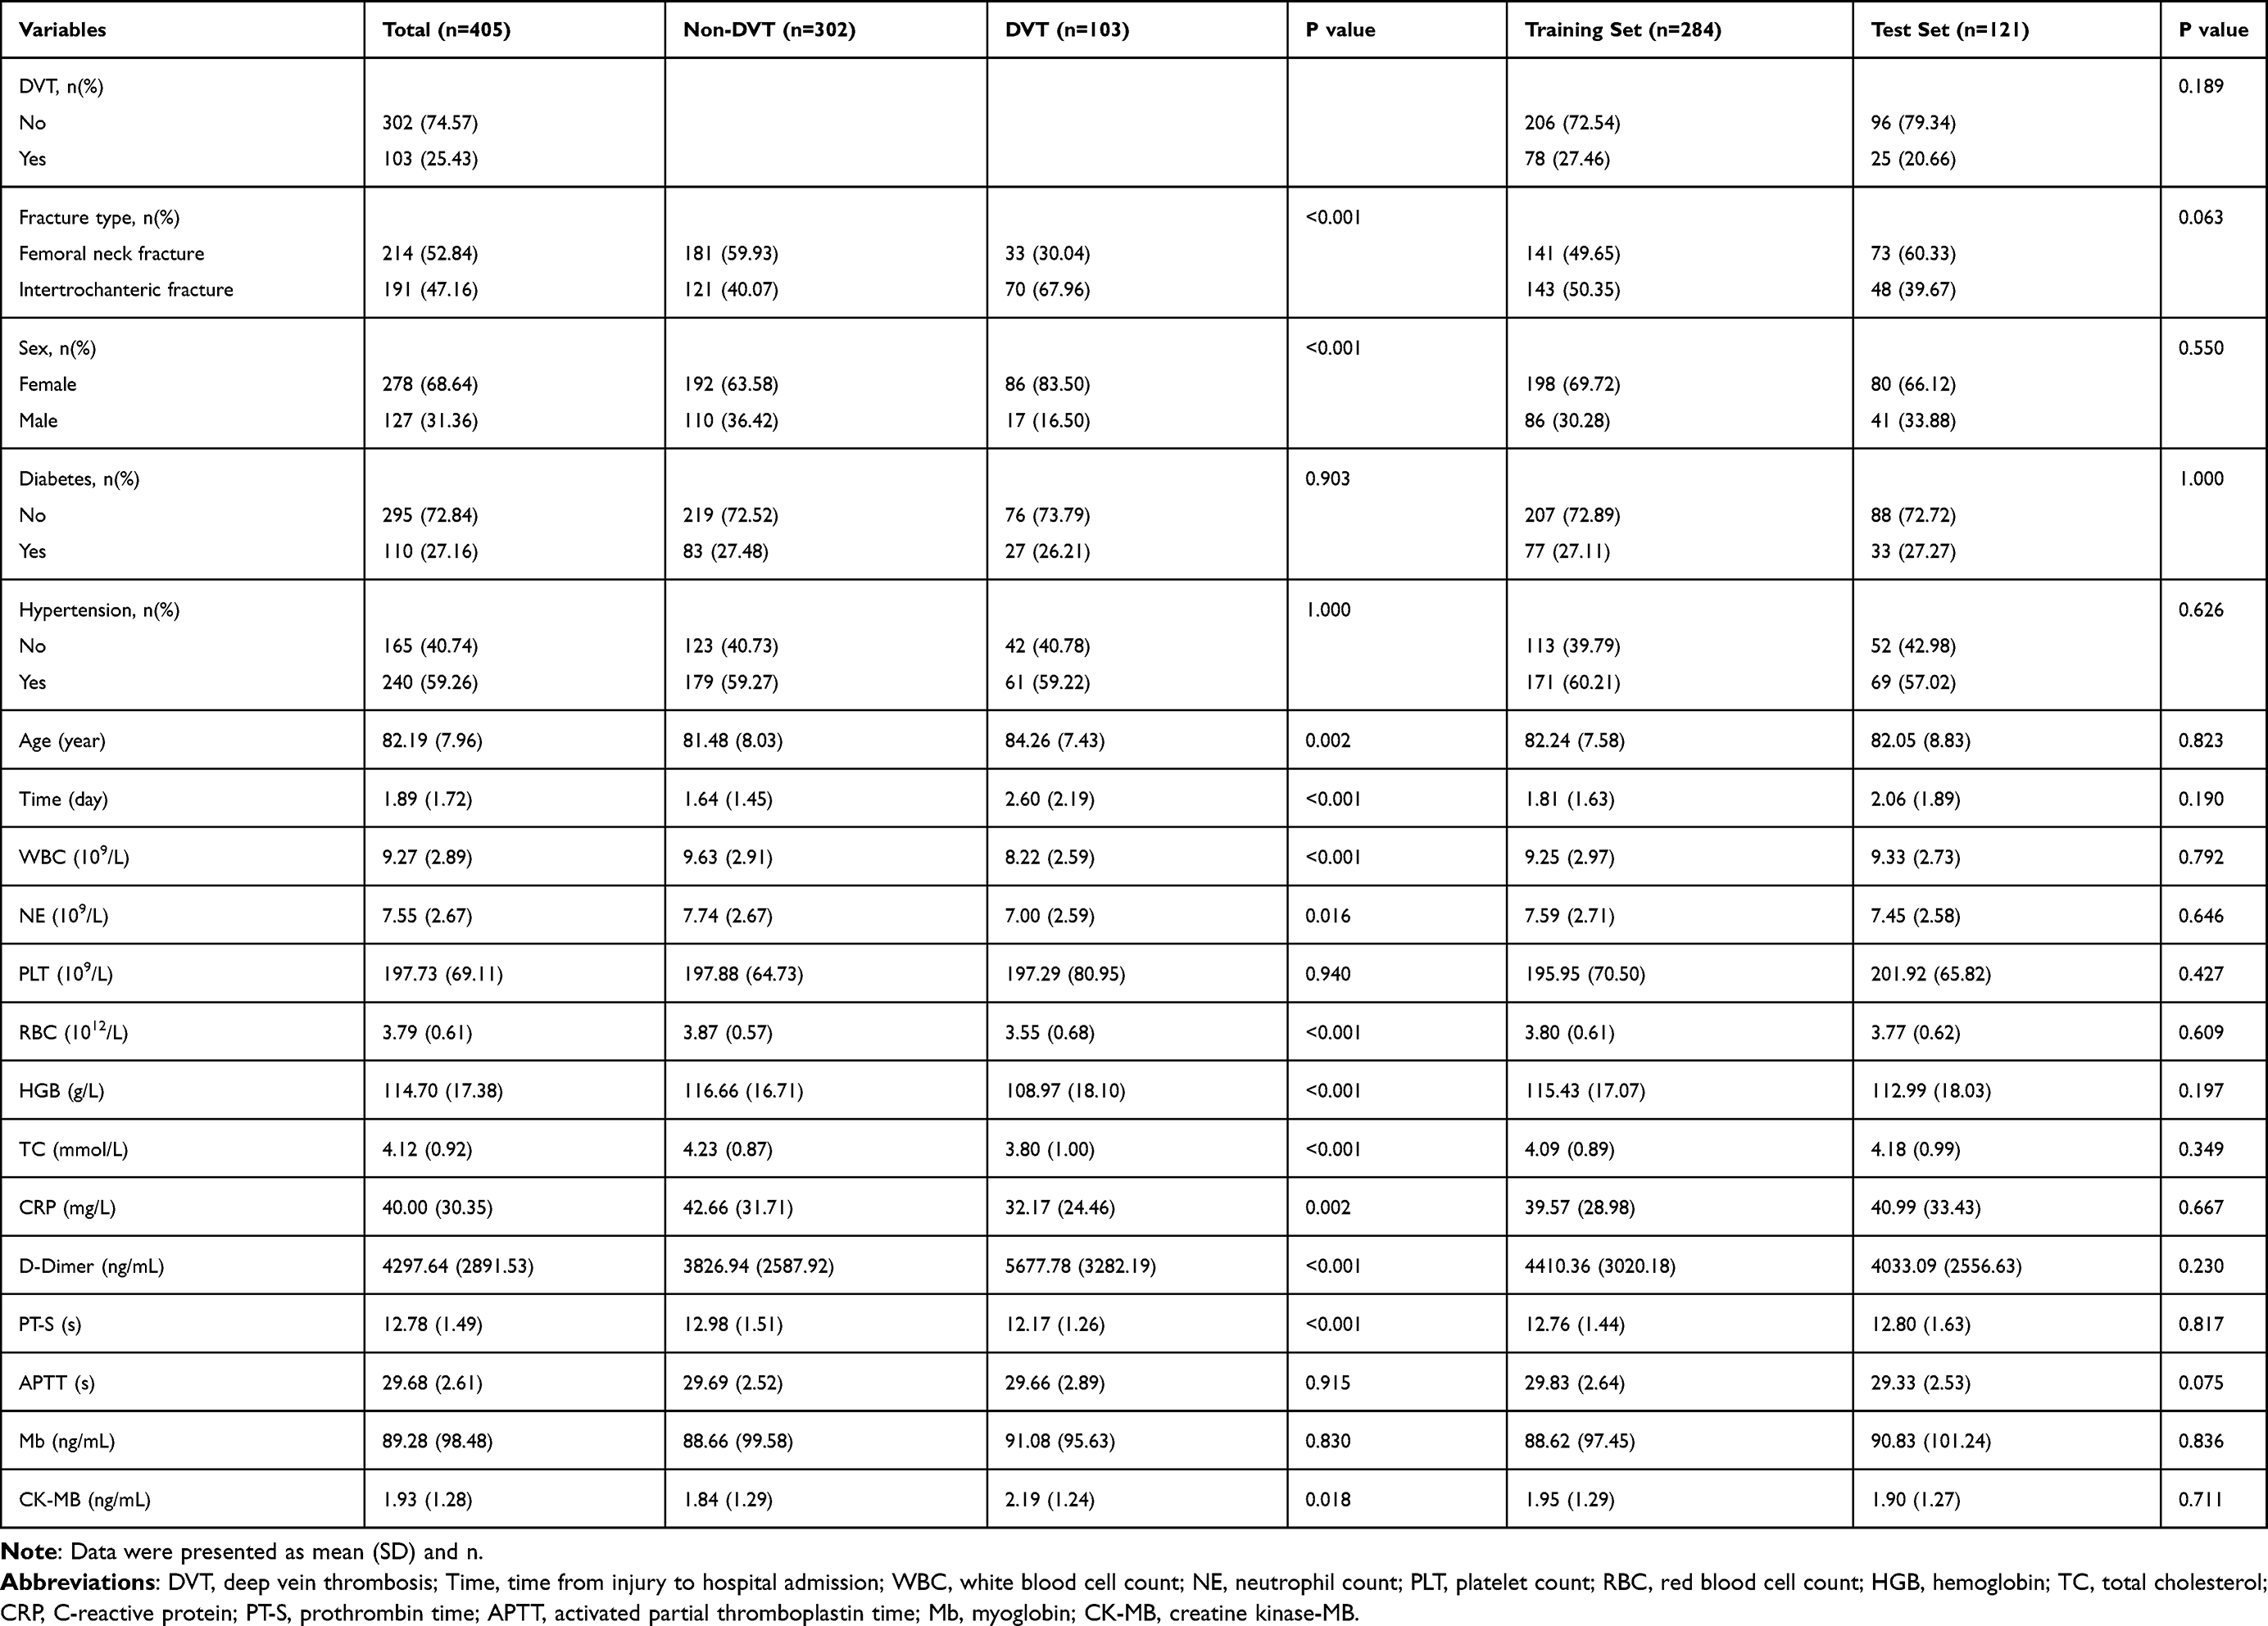 |
Table 1 Univariate Analysis of the Model Development Cohort |
The patient characteristics in the training and temporal validation sets are detailed in Table 2. Further analysis revealed statistically significant differences between the training and temporal validation sets for fracture type, age, time from injury to hospital admission, CRP level, D-dimer level, prothrombin time, and Mb level (P < 0.05).
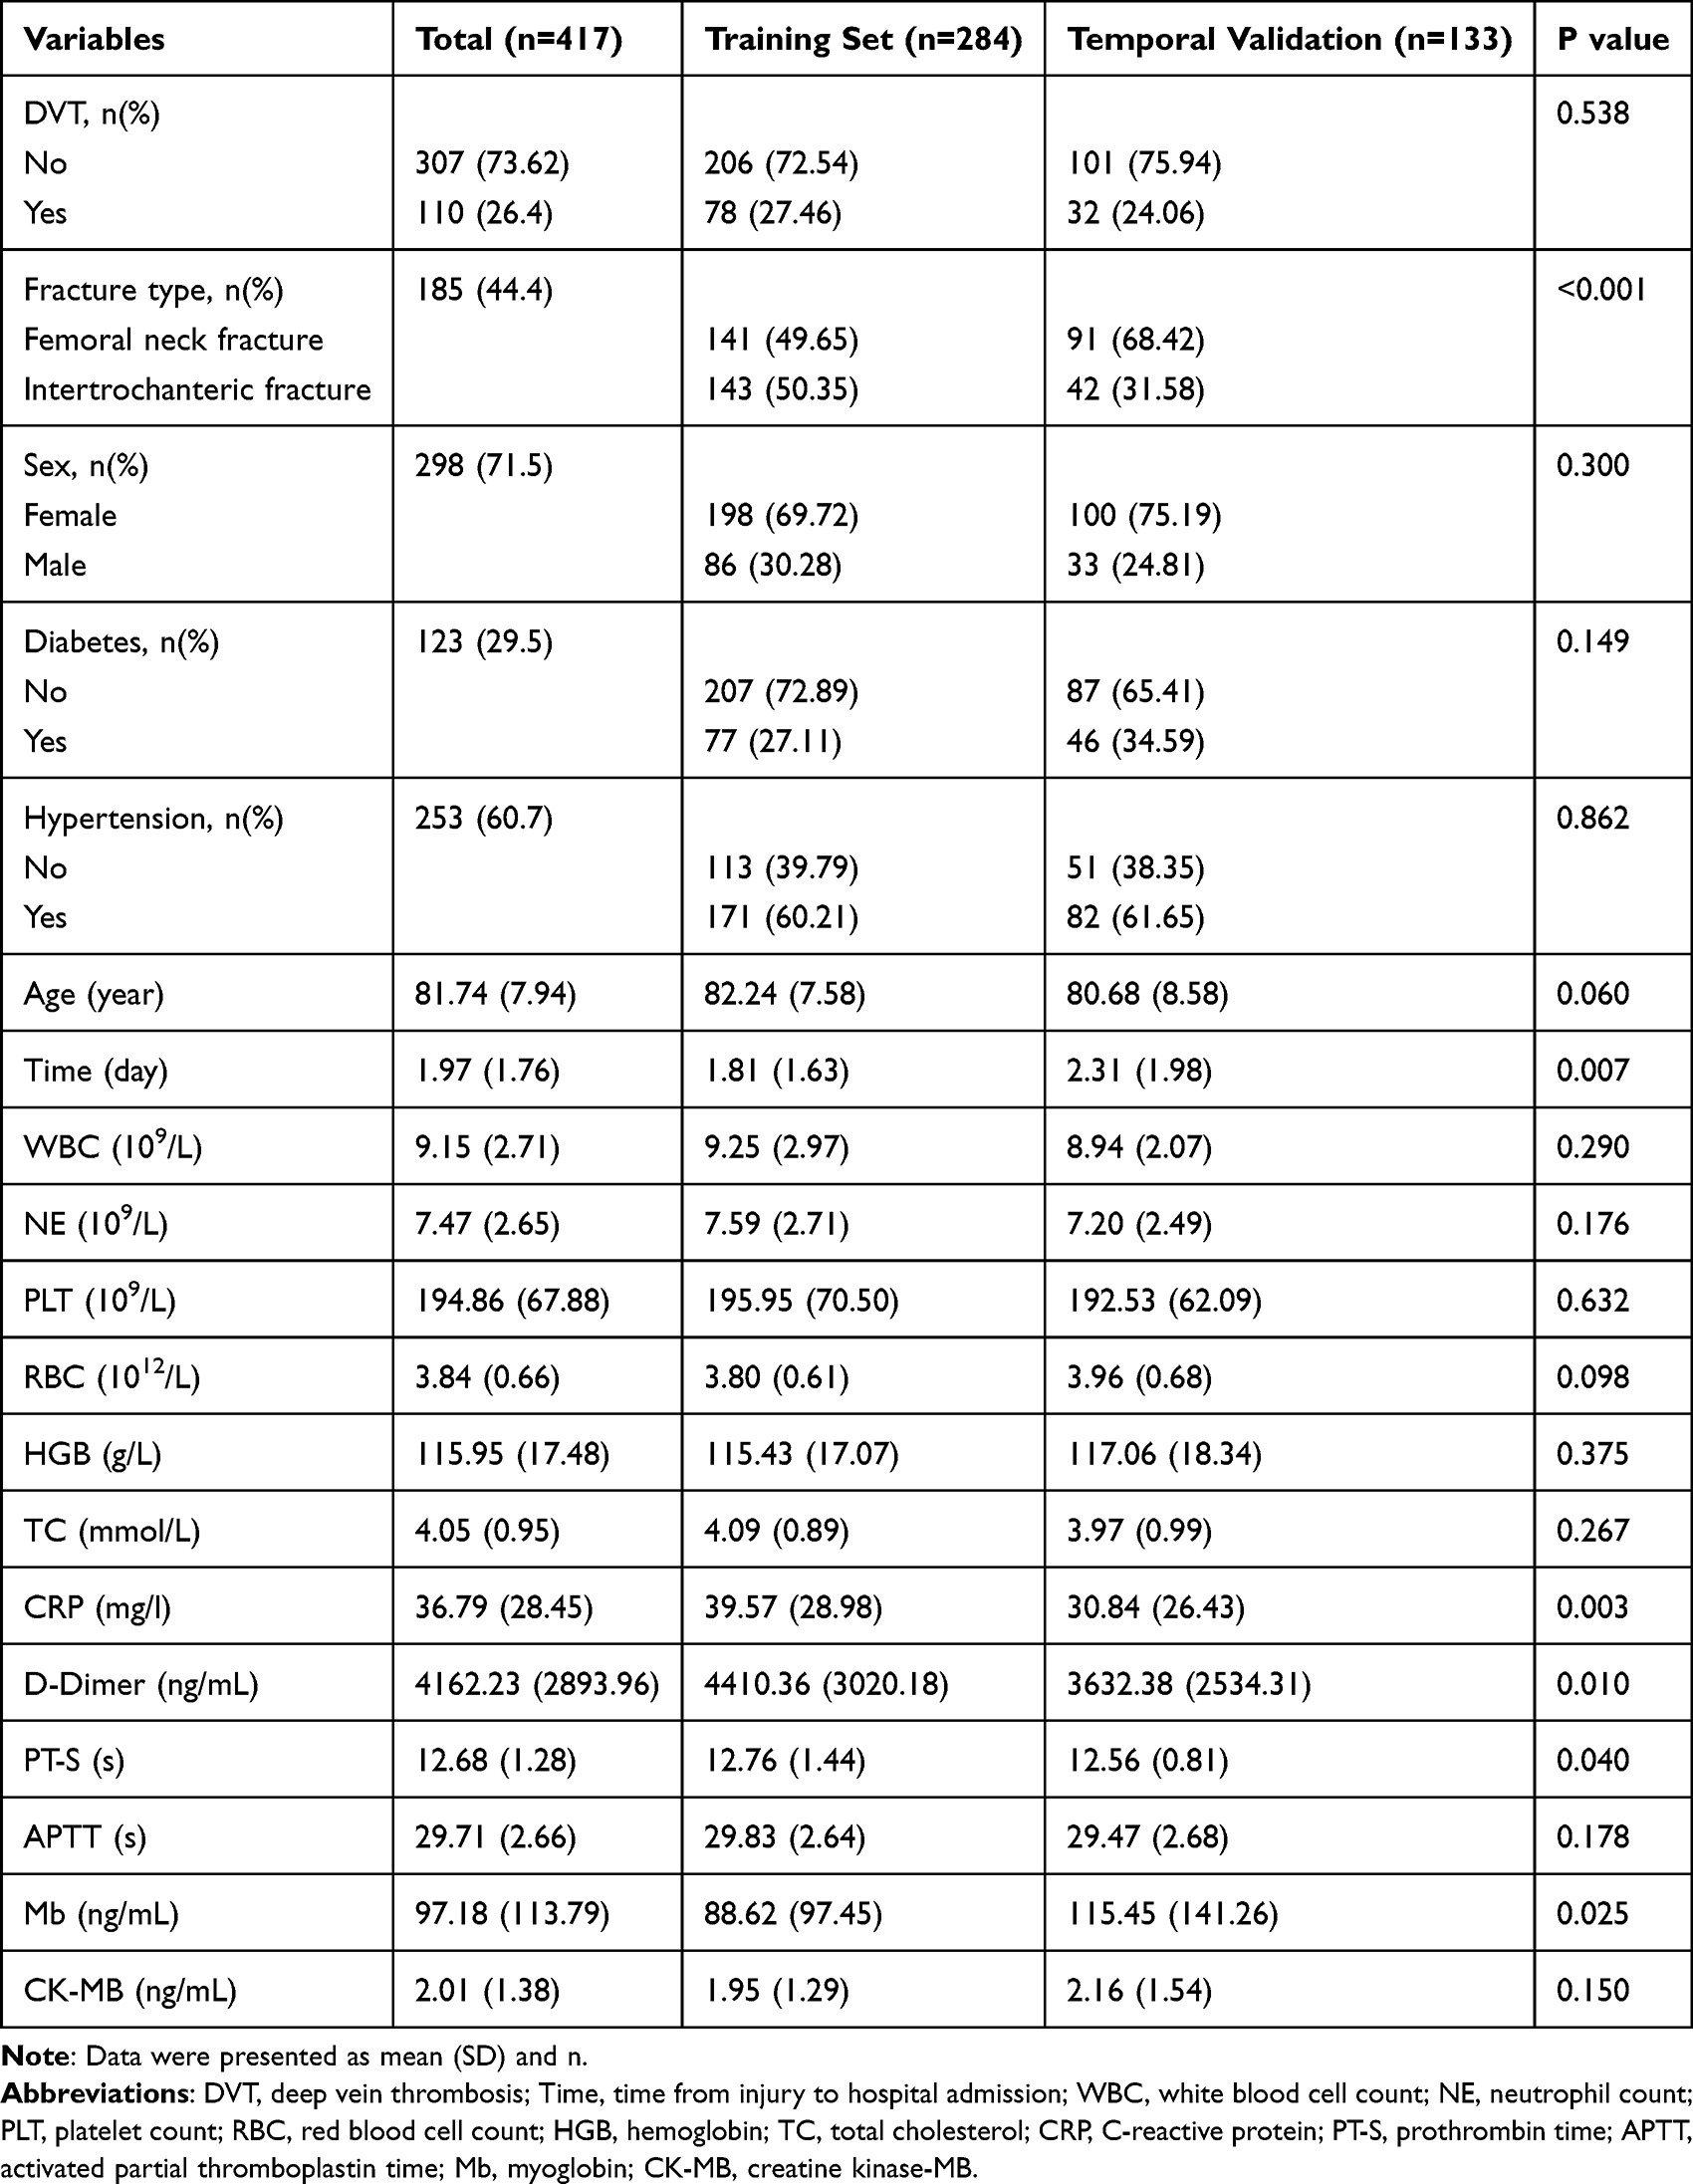 |
Table 2 Univariate Analysis of Training Set and Temporal Validation Set |
Machine Learning Model Performance and Evaluation
LASSO regression identified seven predictive variables for model development: fracture type, time from injury to hospital admission, white blood cell count, red blood cell count, CRP level, D-dimer level, and prothrombin time. Using these variables, three machine learning models (logistic regression, LightGBM, and SVM) were constructed.
In the training set, all three models demonstrated satisfactory discriminative ability (Figure 2A and Table 3). LightGBM exhibited the best performance (AUC=0.9653, accuracy= 0.9061, specificity=0.9563, F1 score=0.8513) (Figure 2B), followed by SVM (AUC=0.9406, accuracy=0.8803, specificity=0.9515, F1 score=0.8042). Logistic regression showed comparatively modest performance (AUC=0.8708, accuracy=0.7961, specificity= 0.8786, F1 score=0.6736).
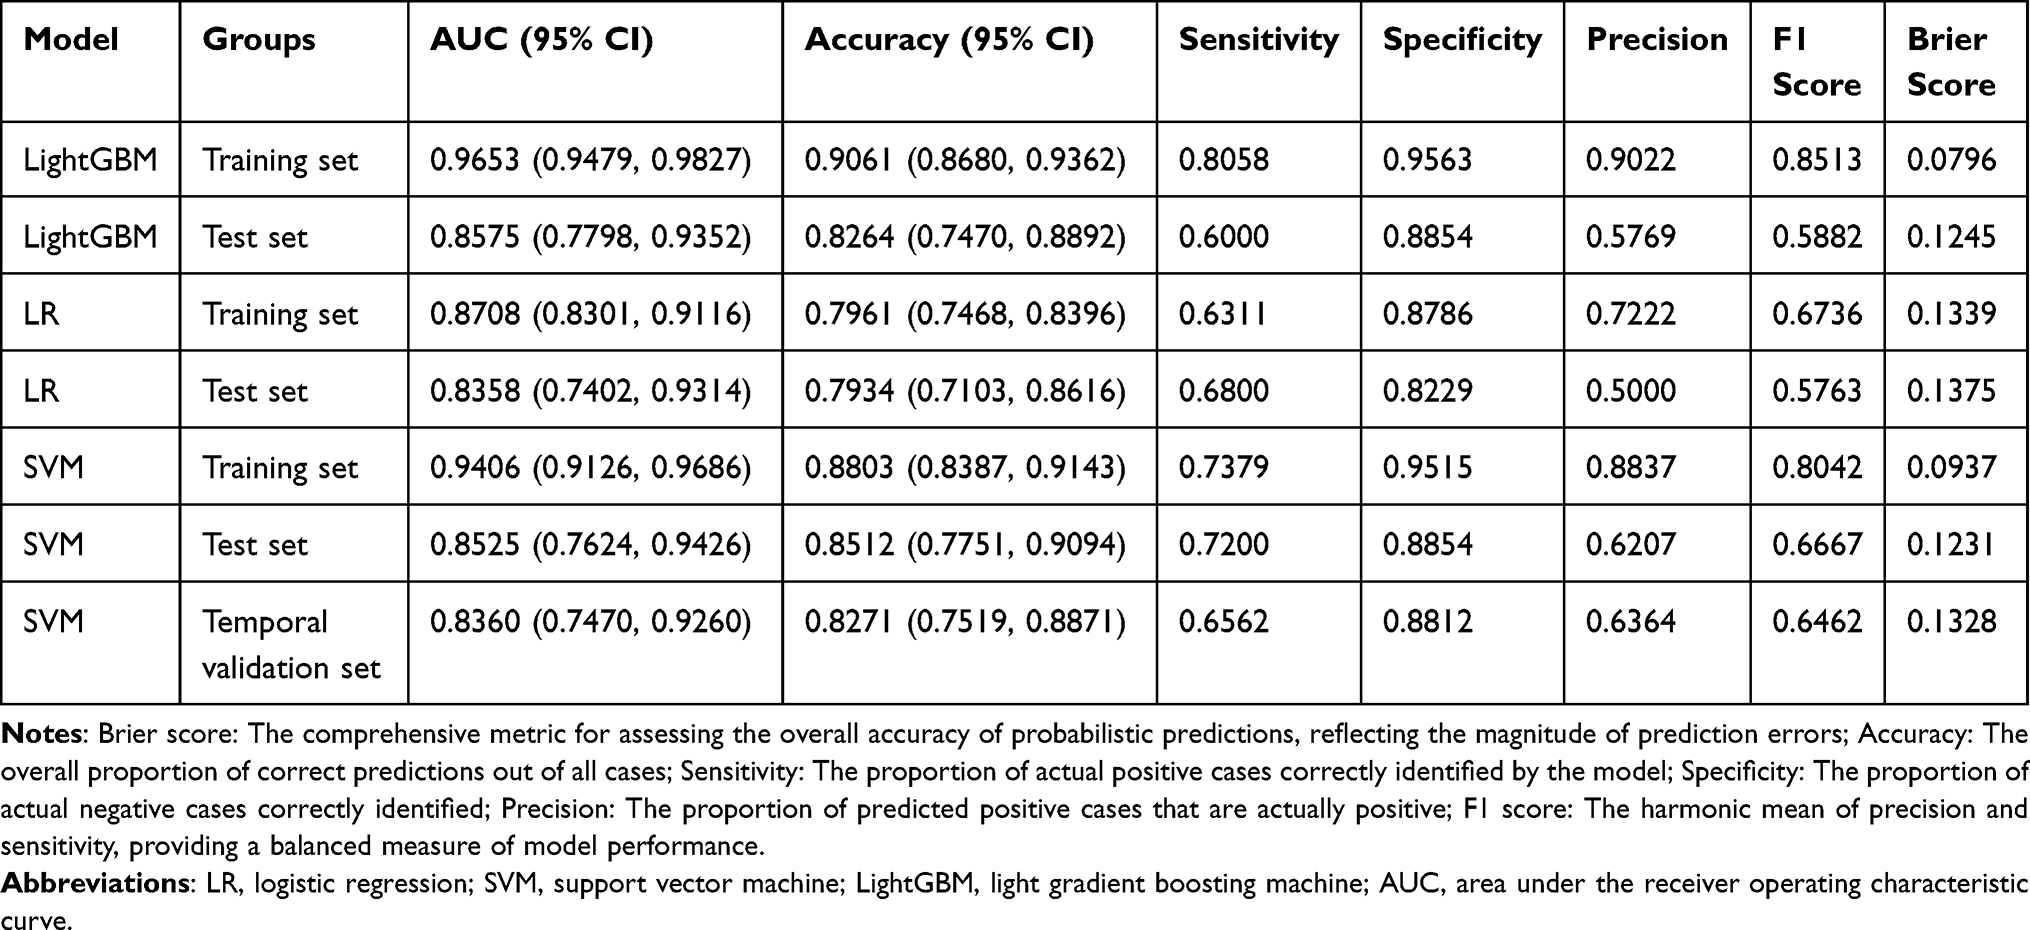 |
Table 3 Performance Metrics of Machine Learning Models |
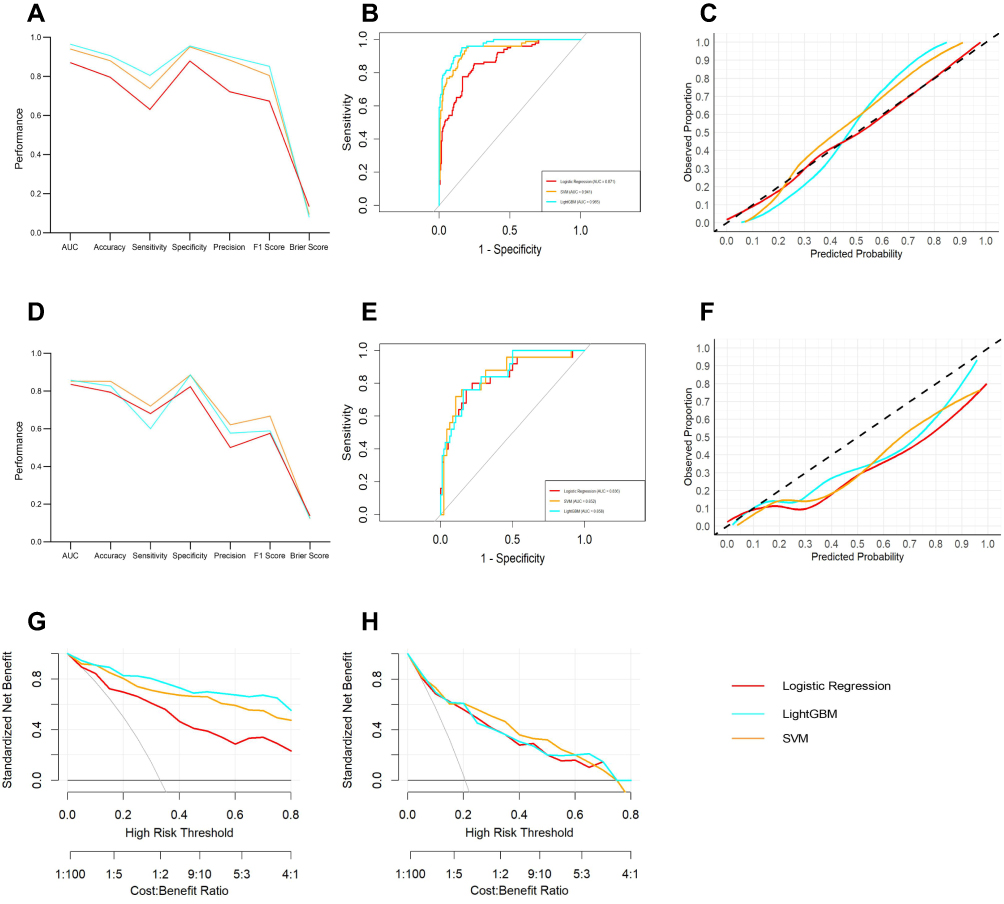 |
Figure 2 Performance comparison of three machine learning models in the training and test sets. (A) Comparative performance metrics including AUC (area under the receiver operating characteristic curve), accuracy, and Brier score for the three models in the training set. (B) Receiver operating characteristic (ROC) curves for the training set. The colored lines represent different models: red for Logistic Regression, Orange for Support Vector Machine (SVM), and cyan for Light Gradient Boosting Machine (LightGBM). The diagonal grey line indicates random chance. (C) Calibration curves evaluating concordance between predicted probabilities and observed outcomes in the training set. The diagonal dashed black line represents a perfect calibration model. (D) Comparative performance metrics including AUC, accuracy, and Brier score for the three models in the test set. (E) Receiver operating characteristic (ROC) curves for the test set. (F) Calibration curves evaluating concordance between predicted probabilities and observed outcomes in the test set. (G) Decision curve analysis (DCA) demonstrating clinical utility and net clinical benefit of the models in the training set. The horizontal black line at the bottom represents “treat-none”, the thin diagonal grey line represents “treat-all”. (H) Decision curve analysis (DCA) demonstrating clinical utility and net clinical benefit of the models in the test set. |
However, model performance varied considerably in the test set, revealing differences in generalizability (Figure 2D and Table 3). Despite its superior training set performance, LightGBM demonstrated substantial performance degradation in the test set, with AUC decreasing to 0.8575 (ΔAUC = 0.1078) (Figure 2E), specificity to 0.8854, and F1 score decreasing from 0.8513 to 0.5882. The sensitivity decreased from 0.8058 to 0.6000, and the precision decreased from 0.9022 to 0.5769, indicating marked overfitting and limited generalizability. Logistic regression maintained a relatively stable performance in the test set (AUC=0.8358, accuracy=0.7934), although the precision decreased from 0.7222 to 0.5000, with the F1 score declining to 0.5763. The SVM demonstrated robust performance in the test set, achieving an AUC of 0.8525 (ΔAUC = 0.0881), an accuracy of 0.8512, and an F1 score of 0.6667. Despite some performance attenuation relative to the training set, the SVM maintained overall stability and exhibited the highest sensitivity (0.7200) among all models in the test set, indicating its superior capability in identifying positive cases.
Evaluation of Model Calibration and Predictive Accuracy
Brier scores and calibration curves were used to evaluate the probabilistic prediction accuracies of the three models. The Brier score serves as a comprehensive metric for assessing the overall accuracy of probabilistic predictions, reflecting the magnitude of prediction errors, with lower scores indicating a superior predictive performance. Calibration curves provide a visual representation of the concordance between predicted probabilities and observed outcomes, where a closer alignment with the diagonal line signifies better model calibration.
In the training set, the calibration curves for all three models closely approximated a diagonal line (Figure 2C). Brier scores quantified these observations: logistic regression demonstrated a Brier score of 0.1339, SVM achieved 0.0937, and LightGBM attained 0.0796. Notably, while logistic regression exhibited calibration curves closest to the diagonal, followed by SVM, the Brier scores favored LightGBM, with SVM ranking intermediately.
In the test set, the calibration curves diverged substantially between models (Figure 2F). LightGBM demonstrated the closest alignment with the diagonal, followed by SVM, whereas logistic regression deviated most markedly from the ideal calibration. The corresponding Brier scores for the logistic regression, 0.1231 for SVM, and LightGBM were 0.1375, 0.1231, and 0.1245, respectively. Despite modest attenuation in AUC, SVM maintained favorable Brier scores in the test set, indicating robust probabilistic prediction.
Decision Curve Analysis
Decision curve analysis (DCA) was performed to evaluate clinical utility by quantifying the net clinical benefit derived from model-guided decision-making across various threshold probabilities. In the training set, all three models demonstrated superior net benefit compared to both “treat-all” and “treat-none” strategies across clinically relevant threshold ranges, indicating substantial clinical utility (Figure 2G).
However, clinical utility varied considerably in the test set (Figure 2H). The SVM exhibited the superior and most stable net clinical benefit across a broad range of threshold probabilities (approximately 0.2 to 0.6), outperforming both logistic regression and LightGBM. This suggests that the SVM provides optimal benefit-risk ratios for real-world clinical applications. LightGBM demonstrated the most pronounced decline in clinical utility. Despite exceptional training set performance, substantial overfitting severely constrained its potential for clinical deployment. Logistic regression consistently maintained a modest clinical utility throughout the study.
Model Selection
Based on a comprehensive evaluation encompassing AUC, accuracy, F1 score, Brier score, calibration curves, and decision curve analysis, SVM emerged as the optimal model, demonstrating balanced performance, robust calibration, and sustained clinical utility across both the training and test sets.
Temporal Validation of the Optimal Model
Temporal validation serves as a critical reference for assessing the generalizability of the model. The performance of the SVM model was further evaluated using an independent temporal validation cohort comprising of patients admitted between October 2024 and September 2025. The SVM model achieved an AUC of 0.8360 (95% CI: 0.7470–0.9260) in the temporal validation set, closely approximating the performance of the internal test set (AUC 0.8525; 95% CI: 0.7624–0.9426), with only modest attenuation observed (Figure 3B). The overall accuracy was 0.8271 (95% CI: 0.7519–0.8871), comparable to that observed in the internal test set (0.8512; 95% CI: 0.7751–0.9094) (Figure 3A and Table 3).
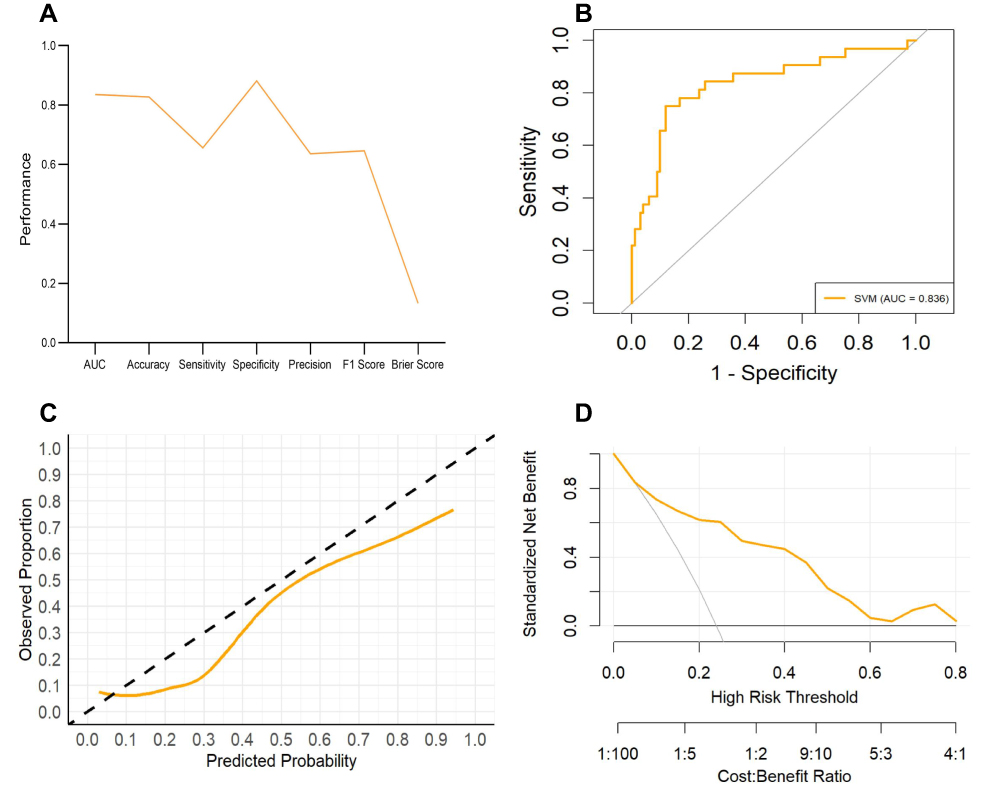 |
Figure 3 Performance evaluation of the SVM model in the temporal validation set. (A) Performance metrics demonstrating satisfactory generalizability of the SVM model in the temporal validation cohort. (B) Receiver operating characteristic (ROC) curve. (C) Calibration curve showing close alignment with the diagonal line. (D) Decision curve analysis revealing substantial net benefit across threshold probabilities of 0.1–0.6, confirming clinical utility. |
In the temporal validation cohort, the SVM model demonstrated a sensitivity of 0.6562, specificity of 0.8812, and an F1 score of 0.6462. Despite evidence of clinical characteristic drift between the development and temporal validation populations, the SVM model maintained satisfactory discriminative performance. Calibration analysis revealed that the calibration curve of the SVM model generally remained aligned with the diagonal line across the risk spectrum, indicating well-calibrated probability estimates throughout the observed risk range (Figure 3C). This finding, corroborated by a Brier score of 0.1328, confirmed that the SVM model preserved satisfactory accuracy in probabilistic predictions when applied to a temporal validation cohort. Decision curve analysis demonstrated that the SVM model provided superior net benefit compared to both “treat-all” and “treat-none” strategies across a broad range of clinically relevant threshold probabilities (0.1–0.6) in the temporal validation set (Figure 3D). Relative to the test set performance, the net benefit curves exhibited modest attenuation at higher threshold probabilities (>0.6) while remaining stable within the most clinically relevant threshold range (0.2–0.5), suggesting that the model can reliably inform routine clinical decision-making.
Collectively, these findings demonstrate that the SVM model exhibits robust generalizability in terms of temporal validation, thus providing essential evidence supporting its potential for clinical translation.
Interpretability of the Optimal Model and SHAP-Based Feature Analysis
Feature importance ranking based on absolute SHAP values revealed that prothrombin time was the most influential variable in model prediction, followed by time from injury to hospital admission and CRP as the second and third most important contributors, respectively. D-dimer level, fracture type, white blood cell count, and red blood cell count were ranked subsequently in descending order of importance (Figure 4A).
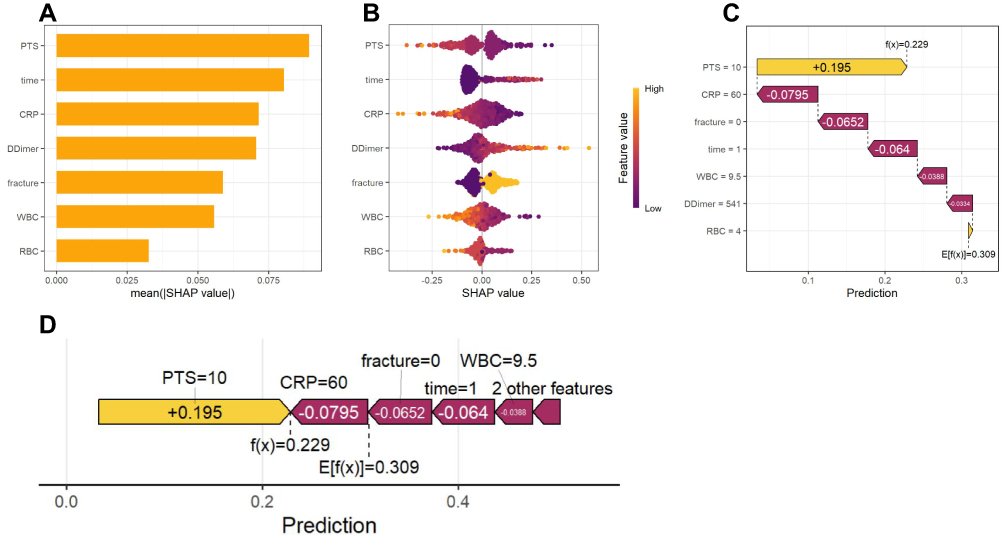 |
Figure 4 SHAP-based interpretability analysis of the SVM model. (A) Global feature importance ranking based on mean absolute SHAP values. (B) Beeswarm plot illustrating the direction and magnitude of each feature’s impact on DVT prediction. Each point represents an individual patient sample; yellow indicates high feature values, blue indicates low feature values. The horizontal axis represents SHAP values, with positive values indicating increased DVT risk and negative values indicating decreased DVT risk. (C) Individual prediction force plot demonstrating decomposition of prediction for a single patient; yellow arrows indicate factors promoting DVT, red arrows indicate factors inhibiting DVT. (D) Individual feature contribution plot displaying the magnitude and direction of each feature’s contribution to the individual prediction. Abbreviations: PT-S, prothrombin time; time, time from injury to hospital admission; CRP, C-reactive protein; fracture, fracture type; WBC, white blood cell count; RBC, red blood cell count. |
The SHAP summary plot (bee swarm plot) illustrates the direction and magnitude of the impact of each feature on the DVT prediction. In this visualization, each point represents an individual patient sample, with yellow indicating high feature values and blue indicating low feature values. The horizontal axis represents SHAP values, where positive values indicate an increased DVT risk and negative values indicate a decreased DVT risk.
Notably, low prothrombin time values (blue) were predominantly clustered in the positive SHAP region, whereas high prothrombin time values (yellow) were concentrated in the negative SHAP region. This pattern indicates that prolonged prothrombin time suggests a hypocoagulable state, while shortened prothrombin time indicates a hypercoagulable state, consistent with the clinical coagulation physiology. High values of the time from injury to hospital admission (yellow) were primarily distributed in the positive region, indicating that delayed admission increased the risk of DVT. High CRP values were predominantly localized in the negative SHAP region, suggesting that acute inflammatory activity following hip fracture may paradoxically reduce DVT risk, an observation warranting further clinical investigation.
Elevated D-dimer levels are associated with an increased DVT risk, aligning with its established role as a marker of thrombus formation and fibrinolysis. Intertrochanteric fractures (yellow, indicating a high feature value) demonstrated a greater DVT risk than femoral neck fractures. White and red blood cell counts exhibited relatively limited and dispersed contributions to DVT prediction, suggesting that their role in clinical prediction may be modest (Figure 4B).
Individual prediction force plots illustrate the decomposition of predictions for single patients, with yellow arrows promoting DVT and red arrows inhibiting DVT (Figure 4C). Individual feature contribution plots displayed the specific contribution magnitude and direction of each feature in the prediction (Figure 4D). Together, these visualizations demonstrate the value of the SHAP methodology in enabling individualized prediction interpretation. In the exemplified case, the baseline expected value E[f(x)] = 0.309, whereas the patient’s final predicted value f(x) = 0.229 fell below the baseline.
Development of the Web Calculator
Finally, the SVM prediction model is deployed as an interactive Shiny web-based calculator. Clinicians can input seven patient characteristics to obtain individualized DVT risk estimates and corresponding clinical recommendations for reference purposes. The web-based calculator is presented in Figure 5 and can be accessed via the following link: https://sdz-2026.shinyapps.io/thrombosis-risk-calculator.
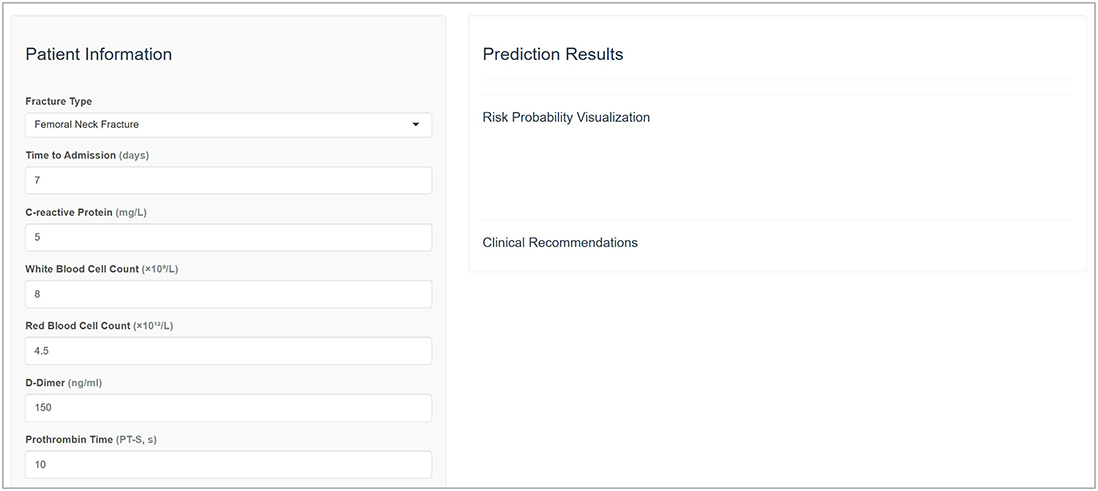 |
Figure 5 Web-based DVT risk calculator developed based on the SVM prediction model. By entering seven patient characteristics: fracture type, time from injury to hospital admission, white blood cell count, red blood cell count, C-reactive protein, D-Dimer, and prothrombin time, the calculator provides the predicted DVT risk and corresponding management recommendations. |
Discussion
Artificial intelligence (AI) is rapidly advancing within the medical domain, offering substantial potential to assist in clinical decision-making and improve diagnostic accuracy. AI-driven tools, through continuous monitoring and multiscale predictive analytics, hold promise for enabling proactive and personalized healthcare delivery.16 The increasing integration of artificial intelligence and machine learning into clinical medicine contributes meaningfully to advancing medical knowledge, improving patient outcomes, optimizing diagnostic and therapeutic strategies, and reducing healthcare expenditures.17,18
The present study systematically compared the performance of three machine learning models in predicting preoperative DVT risk in elderly patients with hip fractures, and evaluated the generalizability of the optimal model through temporal validation. The SVM demonstrated superior overall performance relative to the LightGBM and logistic regression. Compared with LightGBM, SVM exhibited less pronounced overfitting (AUC decline of 0.0881 vs 0.1078) and a higher test set sensitivity (0.7200 vs 0.6000). Relative to logistic regression, the SVM achieved marginally better discriminative ability in the test set (AUC 0.8525 vs 0.8358), with substantially higher sensitivity (0.7200 vs 0.6800).
Calibration curves and Brier scores confirmed that SVM provided reliable probability estimates with satisfactory predictive accuracy. Decision curve analysis demonstrated a stable net clinical benefit across the clinically relevant threshold ranges. SHAP analysis elucidated the decision-making logic of the model, identifying prothrombin time as the most important predictor with effect directions consistent with established coagulation mechanisms, thereby enhancing the credibility of the model. The SVM’s capacity to capture nonlinear relationships through kernel functions enables it to identify complex clinical patterns while maintaining robust generalizability, rendering it particularly suitable for multifactorial clinical scenarios, such as elderly hip fracture assessment.19 Temporal validation is a rigorous standard to assess the generalizability of a model. The performance of the SVM model in the temporal validation cohort (AUC=0.8360, Brier score=0.1328) closely approximated that observed in the internal test set, confirming its stability despite the data drift encountered in real-world clinical practice. Relative to the test set performance, the calibration curves demonstrated a modest downward deviation in the moderate-to-high-risk range, suggesting a slight tendency toward risk underestimation. Decision curve analysis confirmed a sustained net benefit within the clinically relevant threshold intervals, supporting the model’s potential for clinical translation. This multidimensional evaluation contributes to the reliability of the conclusions. To evaluate the potential influence of imputation, we performed a sensitivity analysis by excluding myoglobin and CK-MB and repeating the model development process. Neither variable was selected by LASSO, and their exclusion did not materially affect model performance, suggesting that imputation had minimal influence on the final model.
Virchow’s triad, comprising venous stasis, vascular endothelial injury, and hypercoagulability, constitutes the fundamental pathophysiological basis for DVT. Under conditions of restricted venous flow, inflammasome activation and subsequent interleukin-1β secretion position DVT at the critical intersection of inflammatory dysregulation and coagulation disturbance.20 Following thrombus development, plasminogen activation initiates the fibrinolytic cascade, degrading fibrin clots into soluble fibrin degradation products, with D-dimer demonstrating a particularly high sensitivity for detecting these events.21 D-dimer level constitutes an integral component of contemporary DVT diagnostic algorithms and is widely employed for both the prediction and exclusion of venous thromboembolism.22 Our findings corroborate these observations, identifying D-dimer, CRP, and prothrombin time as significant contributors to the preoperative DVT risk in elderly patients with hip fractures. Higher CRP values showed a negative contribution to model-predicted DVT risk in this cohort. However, this model-derived finding should be interpreted cautiously and should not be considered evidence of a protective effect, as systemic inflammation is generally regarded as prothrombotic; residual confounding, timing of CRP measurement, and trauma-related inflammatory responses may partly explain this unexpected pattern.
The present study identified the time from injury to hospital admission as a critical predictor, with prolonged intervals correlating with increased DVT risk. Delayed surgical intervention and extended preoperative waiting periods represent substantial challenges for the management of elderly patients with hip fractures in China. Current evidence indicates that optimizing preoperative preparation within 24–48 hours significantly reduces preoperative complication rates and mortality. Surgical delay exceeding 48 hours in this population is associated with markedly elevated 30-day and 1-year all-cause mortality, reaching 32% and 41%, respectively. Furthermore, such delays increase the incidence of postoperative complications (including DVT, pneumonia, and urinary tract infections) approximately twofold.23 These findings underscore the need for prompt medical attention following injury and minimization of preoperative delays to optimize patient outcomes and reduce postoperative morbidities.
Erythrocyte indices and fracture type also substantially contributed to DVT prediction in this population. Blood cells influence both hemorrhagic and thrombotic propensities through quantitative and qualitative alterations mediated by diverse underlying mechanisms.24 The present study further demonstrated that intertrochanteric fractures are associated with a significantly higher DVT risk than femoral neck fractures, a finding that was statistically significant. This disparity likely reflects anatomical and pathophysiological differences; femoral neck fractures represent intracapsular injuries, whereas intertrochanteric fractures are extracapsular and are typically associated with more substantial blood loss and extensive soft tissue damage. These observations warrant further dedicated investigation. Emerging evidence has explored the association between sleep patterns and thrombotic risks. In a prospective cohort study of 314,077 participants, Li et al demonstrated that short sleep duration and poor sleep quality are associated with an elevated risk of venous thromboembolism.25
Color Doppler ultrasonography remains the gold standard for DVT diagnosis; however, it captures only instantaneous thrombus status at the time of examination. The present model addresses these limitations by incorporating fracture-specific variables, including fracture type and time from injury to hospital admission, to achieve more precise risk stratification. Furthermore, by leveraging routinely available laboratory parameters, such as CRP and prothrombin time, the model enables dynamic DVT risk assessment and early warning without incurring additional healthcare expenditure. When integrated with established diagnostic modalities such as ultrasonography, this approach serves as a valuable complement to existing diagnostic and risk assessment strategies.
Elderly hip fractures are associated with substantial morbidity and mortality. Therefore, effective prevention, diagnosis, and treatment are essential to alleviate patient suffering and improve clinical outcomes. Xu et al conducted a multicenter, randomized controlled trial to investigate management models for elderly hip fracture patients.26 Their findings demonstrated that multidisciplinary management (integrating orthopedics, geriatrics and relevant specialties) facilitates complementary expertise, accelerates the continuum from admission through surgery to rehabilitation, and reduces mortality risk in this vulnerable population. Perioperative neurocognitive disorder is a common complication following elderly hip fracture surgery. Wei et al constructed a dynamic nomogram using a multicenter cohort, which proves valuable for early risk stratification and guiding targeted perioperative interventions.27 Novel preventive strategies are emerging, such as the clinical trial investigating repetitive transcranial magnetic stimulation to prevent postoperative delirium in elderly patients undergoing lower limb arthroplasty.28 Because elderly hip fracture patients are prone to multiple complications, combining accurate risk prediction with such comprehensive interventions is ultimately required to facilitate successful recovery.
Limitations
The present study had several limitations that warrant consideration. First, owing to its retrospective and single-center design, this study is inherently susceptible to selection and information biases. Furthermore, the proposed model currently lacks external validation, which limits its generalizability to diverse clinical settings. Given these constraints, the model should be utilized as an auxiliary reference tool for risk assessment, rather than a primary diagnostic basis for clinical decision-making. Second, the sample size was limited, particularly in DVT-positive cases. Although class imbalance techniques were applied, mild overfitting of the SVM model could not be entirely eliminated. Third, variable selection did not encompass certain potentially relevant parameters, including thromboelastography, fibrinogen, bone metabolism markers, bone mineral density, procalcitonin, or erythrocyte sedimentation rate. However, routine collection of these parameters would increase healthcare expenditures and may not be feasible in all clinical settings.
Furthermore, while the temporal differences between cohorts reflect real-world data drift, the model’s stable performance across these timeframes suggests its adaptability to local shifts in clinical practice. Nonetheless, given the single-center design, broader generalizability remains to be confirmed through future multicenter external validation. Due to the inherent limitations of retrospective data collection, a direct head-to-head comparison with the Caprini risk assessment model could not be performed in the current study. In future prospective studies, comparative or integrative analyses with the Caprini model will be conducted to explore the potential clinical value of combined approaches. Furthermore, mechanistic investigations into inflammation-coagulation interactions should be pursued to elucidate the complex role of early inflammatory responses in DVT pathogenesis and progression following hip fractures.
Conclusion
In summary, we developed an SVM model for predicting preoperative DVT in elderly patients with hip fractures, using routinely available admission data. SHAP analysis enhanced the model transparency and identified prothrombin time as the predominant contributing factor. However, due to the single-center design and the lack of external validation, this model should currently serve only as an auxiliary reference tool. Subsequent multicenter prospective validation holds promise in providing dynamic decision support for DVT prevention and management in this vulnerable population.
Data Sharing Statement
The datasets supporting the conclusions of this study are made available by the corresponding author (Zhuang Tian) upon reasonable request.
Ethics Approval and Consent to Participate
It was a retrospective study and the use of anonymized data. The requirement for patient informed consent was waived by the Ethics Committee of Beijing Shijitan Hospital, Capital Medical University (No. IIT2025-124-001). Patient data confidentiality was strictly maintained throughout the study, and no personally identifiable information was disclosed. Furthermore, this study was conducted in full compliance with the ethical principles outlined in the Declaration of Helsinki.
Author Contributions
All authors made a significant contribution to the work reported, whether that is in the conception, study design, execution, acquisition of data, analysis and interpretation, or in all these areas; took part in drafting, revising or critically reviewing the article; gave final approval of the version to be published; have agreed on the journal to which the article has been submitted; and agree to be accountable for all aspects of the work.
Funding
This study was supported by the National Key Research and Development Program of China (2024YFC2418804) and the Laboratory for Clinical Medicine at the Capital Medical University (2025-SYJCLC01).
Disclosure
The authors report no conflicts of interest in this work.
References
1. Morin SN, Leslie WD, Schousboe JT. Osteoporosis: a review. JAMA. 2025;334(10):894–17. doi:10.1001/jama.2025.6003
2. Li X, Wu H, Zhang Z, et al. Association between frailty index and hip fracture among Chinese middle- and old-aged adults in different glycemic status: a prospective study from the China health and retirement longitudinal study (CHARLS). Int J Surg. 2026. doi:10.1097/JS9.0000000000004639
3. Guo Z, Du X, Xing C, et al. Myeloid-specific STING-YBX1 interaction alleviates coagulation in deep vein thrombosis. Circ Res. 2025;137(6):e157–e174. doi:10.1161/CIRCRESAHA.125.326540
4. Pai RZ, Fang Q, Tian G, Zhu B, Ge X. Expression and role of interleukin-1b and associated biomarkers in deep vein thrombosis. Exp Ther Med. 2021;22(6):1366. doi:10.3892/etm.2021.10800
5. Jost Z, Kujach S. Understanding cognitive decline in aging: mechanisms and mitigation strategies - a narrative review. Clin Interv Aging. 2025;20:459–469. doi:10.2147/CIA.S510670
6. Harris AHS, Trickey AW, Eddington HS, et al. A tool to estimate risk of 30-day mortality and complications after hip fracture surgery: accurate enough for some but not all purposes? A study from the ACS-NSQIP database. Clin Orthop Relat Res. 2022;480(12):2335–2346. doi:10.1097/CORR.0000000000002294
7. Fu M, Liu Y, Hou Z, Wang Z. Interpretable prediction of acute ischemic stroke after hip fracture in patients 65 years and older based on machine learning and SHAP. Arch Gerontol Geriatr. 2025;129:105641. doi:10.1016/j.archger.2024.105641
8. Tian C, Shi L, Wang J, et al. Global, regional, and national burdens of hip fractures in elderly individuals from 1990 to 2021 and predictions up to 2050: a systematic analysis of the global burden of disease study 2021. Arch Gerontol Geriatr. 2025;133:105832. doi:10.1016/j.archger.2025.105832
9. Wei X, Yin Z, Zhang S, Zhang M, Zhu D. Development and validation of a machine learning model for predicting preoperative deep vein thrombosis in elderly hip fracture patients. Front Med Lausanne. 2026;13:1696325. doi:10.3389/fmed.2026.1696325
10. Guo YF, Zhang D, Guo A, et al. Optimizing preoperative venous thromboembolism risk assessment in elderly hip fracture patients: a refined Caprini model integrating D-dimer and injury-to-admission time. Clin Appl Thromb Hemost. 2025;31:10760296251396133. doi:10.1177/10760296251396133
11. Ge X, Zhang L, Wang Y, Wang Y, Zhang F. Comparing machine learning models for predicting preoperative DVT incidence in elderly hypertensive patients with Hip fractures: a retrospective analysis. Sci Rep. 2025;15(1):13206. doi:10.1038/s41598-025-97880-w
12. Collins GS, Moons KGM, Dhiman P, et al. TRIPOD+AI statement: updated guidance for reporting clinical prediction models that use regression or machine learning methods. BMJ. 2024;385:e078378. doi:10.1136/bmj.q902
13. Efthimiou O, Seo M, Chalkou K, Debray T, Egger M, Salanti G. Developing clinical prediction models: a step-by-step guide. BMJ. 2024;386:e078276. doi:10.1136/bmj-2023-078276
14. Budnik I, Kumskova M, Chauhan AK. Metabolic pathways in deep vein thrombosis: a new frontier for therapeutic intervention. Blood. 2025;146(1):29–40. doi:10.1182/blood.2024027636
15. Ponce-Bobadilla AV, Schmitt V, Maier CS, Mensing S, Stodtmann S. Practical guide to SHAP analysis: explaining supervised machine learning model predictions in drug development. Clin Transl Sci. 2024;17(11):e70056. doi:10.1111/cts.70056
16. Fahrner LJ, Chen E, Topol E, Rajpurkar P. The generative era of medical AI. Cell. 2025;188(14):3648–3660. doi:10.1016/j.cell.2025.05.018
17. Patel MR, Balu S, Pencina MJ. Translating AI for the Clinician. JAMA. 2024;332(20):1701–1702. doi:10.1001/jama.2024.21772
18. Haug CJ, Drazen JM. Artificial intelligence and machine learning in clinical medicine, 2023. N Engl J Med. 2023;388(13):1201–1208. doi:10.1056/NEJMra2302038
19. Yang X, Meng P, Jiang Z, Zhou L. Deep siamese residual support vector machine with applications to disease prediction. Comput Biol Med. 2025;196(Pt A):110693. doi:10.1016/j.compbiomed.2025.110693
20. Yao M, Ma J, Wu D, et al. Neutrophil extracellular traps mediate deep vein thrombosis: from mechanism to therapy. Front Immunol. 2023;14:1198952. doi:10.3389/fimmu.2023.1198952
21. Yao W, Zhang K, Lv Q, Deng Z, Ding W. D-dimer-albumin ratio (DAR) as a new biomarker for predicting preoperative deep vein thrombosis after geriatric Hip fracture patients. J Orthop Surg Res. 2023;18(1):645. doi:10.1186/s13018-023-04139-z
22. Guo H, Xu K, Deng F, Chen Q, Liang J, Zhang K. Risk prediction models for preoperative deep vein thrombosis in older patients with hip fracture: a systematic review and meta-analysis. Clin Appl Thromb Hemost. 2024;30:10760296241285565. doi:10.1177/10760296241285565
23. Li X, Gong X, He L, Wu X. Current surgical status of hip fracture among elderly in China. Injury. 2024;55(2):111083. doi:10.1016/j.injury.2023.111083
24. Weisel JW, Litvinov RI. Red blood cells: the forgotten player in hemostasis and thrombosis. J Thromb Haemost. 2019;17(2):271–282. doi:10.1111/jth.14360
25. Li Y, Sun F, Ji C, et al. Association of sleep traits with venous thromboembolism: prospective cohort and Mendelian randomization studies. Am J Hematol. 2025;100(4):616–625. doi:10.1002/ajh.27620
26. Xu L, Yang M, Zhang X, et al. The cost-effectiveness of a co-managed care model for elderly hip fracture patients in China: a modelling study. Lancet Reg Health West Pac. 2024;49:101149. doi:10.1016/j.lanwpc.2024.101149
27. Wei S, Xiang X, Zhou S, et al. Development and multicenter validation of a dynamic nomogram for early postoperative neurocognitive disorder in older adults with hip fracture. BMC Geriatr. 2026;26(1):428. doi:10.1186/s12877-026-07125-2
28. Zhao ZJ, Yang Y, Wei SR, Zhang ZQ, Yao M, Ni HD. Repetitive transcranial magnetic stimulation to prevent postoperative delirium in elderly arthroplasty patients: study protocol for asingle-centre, prospective, randomized controlled trial. BMC Geriatr. 2026. doi:10.1186/s12877-026-07579-4
 © 2026 The Author(s). This work is published and licensed by Dove Medical Press Limited. The
full terms of this license are available at https://www.dovepress.com/terms
and incorporate the Creative Commons Attribution
- Non Commercial (unported, 4.0) License.
By accessing the work you hereby accept the Terms. Non-commercial uses of the work are permitted
without any further permission from Dove Medical Press Limited, provided the work is properly
attributed. For permission for commercial use of this work, please see paragraphs 4.2 and 5 of our Terms.
© 2026 The Author(s). This work is published and licensed by Dove Medical Press Limited. The
full terms of this license are available at https://www.dovepress.com/terms
and incorporate the Creative Commons Attribution
- Non Commercial (unported, 4.0) License.
By accessing the work you hereby accept the Terms. Non-commercial uses of the work are permitted
without any further permission from Dove Medical Press Limited, provided the work is properly
attributed. For permission for commercial use of this work, please see paragraphs 4.2 and 5 of our Terms.
Recommended articles
Machine Learning-Based Prediction of Subsequent Vascular Events After 6 Months in Chinese Patients with Minor Ischemic Stroke
Zhang R, Wang J
International Journal of General Medicine 2022, 15:3797-3808
Published Date: 7 April 2022
Application of Interpretable Machine Learning Models Based on Ultrasonic Radiomics for Predicting the Risk of Fibrosis Progression in Diabetic Patients with Nonalcoholic Fatty Liver Disease
Meng F, Wu Q, Zhang W, Hou S
Diabetes, Metabolic Syndrome and Obesity 2023, 16:3901-3913
Published Date: 2 December 2023
An Explainable Machine Learning Model to Predict Acute Kidney Injury After Cardiac Surgery: A Retrospective Cohort Study
Gao Y, Wang C, Dong W, Li B, Wang J, Li J, Tian Y, Liu J, Wang Y
Clinical Epidemiology 2023, 15:1145-1157
Published Date: 4 December 2023
Analysis of Health-Related Quality of Life in Elderly Patients with Stroke Complicated by Hypertension in China Using the EQ-5D-3L Scale
Wang S, Shen C, Yang S
Journal of Multidisciplinary Healthcare 2024, 17:1981-1997
Published Date: 30 April 2024
Integrating Machine Learning and the SHapley Additive exPlanations (SHAP) Framework to Predict Lymph Node Metastasis in Gastric Cancer Patients Based on Inflammation Indices and Peripheral Lymphocyte Subpopulations
Zhu Z, Wang C, Shi L, Li M, Li J, Liang S, Yin Z, Xue Y
Journal of Inflammation Research 2024, 17:9551-9566
Published Date: 23 November 2024