Back to Journals » International Journal of General Medicine » Volume 15
Machine Learning-Based Prediction of Subsequent Vascular Events After 6 Months in Chinese Patients with Minor Ischemic Stroke
Received 12 January 2022
Accepted for publication 23 March 2022
Published 7 April 2022 Volume 2022:15 Pages 3797—3808
DOI https://doi.org/10.2147/IJGM.S356373
Checked for plagiarism Yes
Review by Single anonymous peer review
Peer reviewer comments 2
Editor who approved publication: Dr Scott Fraser
Rong Zhang,1 Jingfeng Wang2
1Department of Neurology, Traditional Chinese Medicine Hospital of Kunshan, Suzhou, 215300, People’s Republic of China; 2Department of Neurology, The Second People’s Hospital of Kunshan, Suzhou, 215300, People’s Republic of China
Correspondence: Jingfeng Wang, Department of Neurology, The Second People’s Hospital of Kunshan, Suzhou, 215300, People’s Republic of China, Tel +86-15962508528, Fax +86-512-57557843, Email [email protected]
Background: To develop and validate a machine learning model for predicting subsequent vascular events (SVE) 6 months after mild ischemic stroke (MIS) in Chinese patients.
Methods: A retrospective analysis was performed on 495 newly diagnosed MIS patients by collecting their basic information, past medical history, initial NIHSS score, symptoms, obstruction sites of MIS, and MRI results. According to the ratio of 7:3, the dataset was divided into a training set (n=346) and a testing set (n=149) through stratified random sampling. In the training set, the recursive feature elimination (RFE) was used to select the optimal combination of features, and two machine learning algorithms, including the logistic regression (LR) and support vector machines (SVM), were used to build the prediction model, which was further validated by using 5-fold cross-validation. The receiver operating characteristic (ROC) curve was used on the testing set to evaluate the model’s performance, and the area under the curve (AUC), sensitivity, specificity, and accuracy were calculated. The calibration curve and decision curve of the two models were further compared.
Results: SVE occurred in 56 cases (11.3%) of 495 patients with MIS during the 6-month follow-up. Finally, the best 15 predictive features were selected, and the top three predictive features were diabetes, posterior cerebral artery lesion, and fasting blood glucose in order. In the testing set, the AUC of the LR model was 0.929 (95% CI: 0.875– 0.964), and its accuracy, sensitivity, and specificity were 0.832, 0.765, and 0.841, respectively. The AUC of the SVM model was 0.992 (95% CI: 0.962– 1.000), and its accuracy, sensitivity, and specificity were 0.966, 0.824, and 0.985, respectively. The SVM model’s discrimination, calibration, and clinical validity are better than those of the LR model.
Conclusion: The predictive models developed using machine learning methods can predict the risk of SVE after 6 months following MIS in Chinese patients.
Keywords: logistic regression, machine learning, mild ischemic stroke, subsequent vascular events, support vector machine
Introduction
Among stroke patients in China, patients with minor ischemic stroke (MIS) account for as much as 30%,1 and these patients generally receive less attention and active treatment due to their mild symptoms. Studies have shown that patients with MIS have a high risk of subsequent vascular events such as recurrent stroke. Stroke recurrence rate within the first 90 days after stroke is 10.4%, and 12.8% to 18.9% at one year.2,3 Active treatment and secondary prevention can effectively reduce the risk of stroke recurrence and subsequent vascular events.4,5 Therefore, it is important to identify patients at risk of poor prognosis after MIS in the early stages of clinical management. Since the degree of MIS is relatively mild, and the symptoms are not obvious, the commonly used models for predicting ischemic stroke may not be sufficient to predict the prognosis of patients with MIS.6 Thus, developing a separate predictive model for MIS patients is necessary.
Machine learning (ML) is a kind of artificial intelligence that can provide accurate and fast prediction results and has been widely used in the medical field.7 ML uses computer algorithms to build models from labeled data and make data-driven predictions. It can handle the complex nonlinear relationship between variables and results. These advantages improve the accuracy of the prediction model. So far, ML technology has been used in the studies of multiple cerebrovascular diseases.8–10 George et al propose an externally validated machine-learning-derived model which includes readily available parameters and can be used for the estimation of cardiovascular risk in ischemic stroke patients.11 Xie et al. Integrating common stroke biomarkers and predicting patient recovery outcomes at 90 days using a machine learning approach and finding that a decision tree-based gradient boosting machine (GBM) can predict recovery outcomes for stroke patients on admission.12 Carlos et al used machine learning techniques to identify the main variables of a machine-learned random forest (RF) and generated a predictive model to predict mortality and morbidity 3 months after admission. Results show that machine learning algorithm RF can be effectively used for long-term outcome prediction of mortality and morbidity in stroke patients.13 ML includes a variety of algorithms, mainly including supervised learning and unsupervised learning, among which supervised learning algorithms are usually used for predictive analysis, including diagnosis and prediction results.14 Common supervised learning algorithms include logistic regression (LR), linear regression, support vector machine (SVM), decision tree, ensemble method, k-nearest neighbor, and naive bayes classifier, of which LR and linear regression are the most commonly used two predictive models.15 Previous studies on stroke have shown that SVM can be used as the best model for prediction.16 Can SVM and LR predict minor strokes? Which model is more advantageous?
In this study, we used two representative machine learning algorithms, LR and SVM, to establish and validate the prediction model of subsequent vascular events after 6 months following MIS in Chinese patients, and select the best prediction model.
Materials and Methods
Material
In this retrospective cohort study, we initially screened 750 patients who visited the Neurology Clinic of the Second People’s Hospital of Kunshan from January 2017 to December 2020. The study was conducted following the principles of the Declaration of Helsinki and was approved by the institutional ethics committee of the Second People’s Hospital of Kunshan for retrospective analysis. The data are all anonymous, and the requirement for informed consent was waived. The entry criteria are as follows: (1) The initial visit showed mild brain symptoms, with or without slight positive signs of stroke, and the NIHSS score ≤ 3 points; (2) The initial visit and the brain has been examined by magnetic resonance imaging (MRI). MRI showed small infarction, or the use of diffusion-weighted imaging (DWI) or fluid-attenuated inversion recovery (FLAIR) to find lacunar lesions or enhanced brain signals, and was located in the subcortical white matter, basal ganglia, or brainstem; (3) Imaging examination to exclude patients with intracranial hemorrhage or symptoms of non-vascular etiology; (4) Stroke onset time was less than 72 hours; (5) The patient was above 18 years old; (6) Patients with complete height, weight, waist circumference, blood pressure, blood lipids, fasting blood glucose data, and complete past medical history data; (7) All patients received aspirin treatment (100 mg daily) after consultation. (8) Patients can accept follow-up evaluation at 6 months. The exclusion criteria were as follows: (1) Clear history of ischemic stroke; (2) A history of cerebral hemorrhage or other active hemorrhagic diseases, a history of brain tumors, brain trauma, or other brain injuries; (3) Dementia or mental illness; (4) Lack of MRI examination; (5) NIHSS score>3 at the first visit. The research flow is shown in Figure 1.
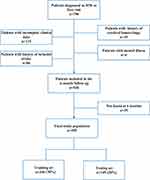 |
Figure 1 Flowchart of patient selection. |
Data Collection
The following data were collected: basic data of patients (age, height, weight, waist circumference, SBP, DBP, FBG level, blood lipid level), past medical history (hypertension, diabetes, dyslipidemia, metabolic syndrome), years of hypertension, initial NIHSS score, symptoms [headache, dizziness, mild cognitive impairment (MCI)], obstruction sites of MIS [anterior circulation artery (ACA), posterior cerebral artery (PCA)], MRI results (number of lesions, the maximum diameters of lesions, size of infarcts). The height, weight, and waist circumference of patients were measured by standard methods. Fasting blood glucose and blood lipids were measured in the laboratory. The NIHSS score was evaluated by a neurologist. All patients underwent brain MRI within 24 hours of their first visit. MRI is performed using 1.5T equipment (Siemens). All MRIs were diagnosed by the same neuroradiologist and the same neurologist, who was not informed of the study. The examiner used FLAIR or DWI to assess whether there are high-intensity lesions specifically. The maximum diameter of each patient’s lesion and the number, location, and lesion area are recorded in detail.
The patients were followed up 6 months later to assess the occurrence of SVE. A neurologist collected the information over the phone. For patients who died during follow-up, the data was obtained from their relatives or hospital records.
Diagnostic Criteria
Hypertension: patients diagnosed with hypertension with clear medical records, or the blood pressure measured in two quiet states was greater than or equal to 140/90mmHg.
Diabetes: patients with a history of diabetes confirmed by medical records or had symptoms of diabetes with fasting blood glucose ≥7.0mmol/l or random blood glucose ≥11.1mmol/l.
Dyslipidemia: total plasma cholesterol level>5.2mmol/l, or low-density lipoprotein cholesterol>3.4mmol/l, or triglyceride level>1.7mmol/l, or high-density lipoprotein cholesterol (HDL-C) <1.03mmol/l for male, Or HDL-C<1.3mmol/l for female.
Metabolic syndrome: The subjects can be diagnosed if they meet three of the following five items: (1) male waist circumference ≥90cm, female waist circumference ≥80cm; (2) triglyceride >1.7mmol/l; (3) male HDL-C <1.03mmol/l or female HDL-C<1.3mmol/l; (4) systolic blood pressure ≥130 mmHg, diastolic blood pressure ≥80 mmHg; (5) fasting blood glucose ≥5.6 mmol/l.
SVE: Transient ischemic attack (TIA), transient non-focal cerebrovascular symptoms, worsening cerebrovascular symptoms or recurrence of infarction, and modified Rankin scale score ≥2 during follow-up.
Laboratory Examination
Triacylglycerol (TG, reference range: <1.70mmol/L), low-density lipoprotein (LDL, reference range: <3.36mmol/L), high-density lipoprotein (HDL, reference range: male, 0.78–1.81mmol/L; female, 0.78–2.20mmol/L), fasting blood glucose (FBG, reference range: 3.9–6.0mmol/L). Biochemical blood lipids were measured using BECKMAN COULTER AU5800 (Brea, CA, USA).
Statistical Analysis
The R software (version 3.4.3; http://www.R-project.org/; software package: glmnet, pROC, rms, dca.R) was used to analyze the data. Continuous variables are expressed as mean ± standard deviation (SD) when they follow a normal distribution and are expressed as P50 (P25, P75) when non-normally distributed. Categorical variables are expressed in frequency (%). Unpaired Student-t test or Mann–Whitney nonparametric test was used for continuous variables in comparison between groups, and Pearson chi-square test or Fisher’s exact test was used for categorical variables.
Our feature selection and classification analysis were performed using the internally developed Python framework in the open-source Python library Scikit-Learn. The data set was divided into training set and testing set with a ratio of 7:3 by using stratified random sampling. The recursive feature elimination (RFECV) method was used on the standardized training set data, and cross-validation was used to retain the features with the best performance (accuracy). The different feature combinations were cross-validated based on RFE, and the learner remains unchanged. By calculating the sum of its decision coefficients, the importance of different features to the score was finally obtained, and then the best feature combination was retained.
The machine learning models, including LR and SVM classifiers, were trained using the filtered predictive features. Five-fold stratified cross-validation from scikit-learn was used to determine the model parameters in the training set. Stratified K-Fold is a variant of k-fold cross-validation, ensuring that each set contains approximately the same percentage of samples of each target class as the entire training set.
The predictive model’s receiver operating characteristic (ROC) curve was drawn, and the area under the curve (AUC) and its 95% CI were obtained. The confusion matrix was provided, and the sensitivity, specificity, accuracy, positive predictive value (PPV), and negative predictive value (NPV) were calculated to measure the model’s performance. The AUC of the models was compared in pairs using the method proposed by DeLong et al. A calibration curve was drawn to compare the prediction accuracy of the models, and decision curve analysis (DCA) was used to quantify and compare the clinical effectiveness of different models. By subtracting the proportion of false positives from the proportion of true positives, and then weighing the relative harm of false positives and false negatives, we could get the quantification for net benefit. The formula is as follows:
Where n is the total number of patients in the study, and Pt is the given threshold probability. All statistical tests were two-sided, and P<0.05 was considered statistically different.
Results
Description of the Study Population
Four hundred ninety-five patients were finally enrolled, including 258 males and 237 females, with an average age of 58.2 ± 10.3 years (range 37–85 years). SVE occurred in 56 cases (11.3%) during the 6-month follow-up. The comparison of baseline data between the two groups was shown in Table 1. The age, fasting blood glucose, diabetes, hyperlipidemia, metabolic syndrome, years of hypertension, NIHSS score, mRS score, anterior circulation artery lesions, posterior cerebral artery lesions, maximum diameter of the lesions, MRI infarct area, abdominal obesity, and the elevated TG between two groups were significantly different (all P<0.001).
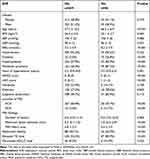 |
Table 1 Baseline Characteristics of SVE in Patients with Mild Cerebral Infarction After 6 Months |
Screening of the Best Model Predictors
Seventeen possible features were selected with P=0.1 as the cutoff value, including age, BMI, systolic blood pressure, fasting blood glucose, diabetes, hyperlipidemia, metabolic syndrome, years of hypertension, NIHSS score, mRS score, number of MR lesions, maximum lesion diameter mm, MRI infarct area, anterior circulation artery, posterior cerebral artery, abdominal obesity, and elevated TG. According to the ratio of 7:3, the dataset was divided into a training set (307 negative cases and 39 positive cases) and a testing set (132 negative cases and 17 positive cases) using stratified random sampling. There was no significant difference for 17 features between the training and testing sets (all P>0.05, Table S1).
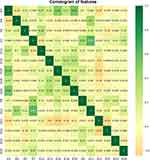
RFECV was further used in the training set to filter the feature combinations from the standardized data. The learning curve of specific parameters and feature numbers were shown in Figure S1. The best 15 predictive features were finally selected: age (X3), BMI (X4), systolic blood pressure (X5), fasting blood glucose (X7), diabetes (X9), metabolic syndrome (X11), years of hypertension (X12), NIHSS score (X13), mRS score (X14), maximum lesion diameter (X19), MRI infarct area (X20), anterior circulation artery (X21), posterior cerebral artery (X22), abdominal obesity (X23), elevated TG (X24). The weight map of 15 predictive features was drawn (Figure 2), and the top three predictive features were diabetes (X9), posterior cerebral artery (X22), and fasting blood glucose (X7) in order. The Spearman correlation matrix heat map of the selected 15 features was drawn (Figure 3), and it was found that there were no redundant features (|r|>0.85).
Construction of Predictive Model
LR Modeling
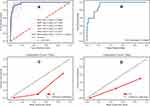
In order to improve the robustness of the model, a 5-fold cross-validation was performed on the training set, and the average AUC was 0.975 ± 0.024, and its accuracy, sensitivity, specificity, PPV, and NPV were 0.908 ± 0.033, 0.925 ± 0.168, 0.905 ± 0.029, 0.558 ± 0.101, and 0.990 ± 0.023, respectively (Figure 4A). In testing set, AUC was 0.929 (95% CI: 0.875–0.964) (Figure 4B), its accuracy, sensitivity, specificity, PPV, NPV were 0.832, 0.765, 0.841, 0.382, and 0.965, respectively. The confusion matrix of the LR model was shown in Table 2. The calibration curve of the LR model in training set and testing set (Figure 4C and D) was drawn, and it was found that this model overestimated the incidence of SVE in both data sets.
 |
Table 2 Confusion Matrix of LR Model and SVM Model |
SVM Modeling
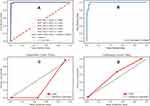
In order to improve the robustness of the model, 5-fold cross-validation was performed for the training set, the average AUC was 0.999 ± 0.002, and its accuracy, sensitivity, specificity, PPV and NPV were 0.991 ± 0.013, 0.975 ± 0.056, 0.994 ± 0.009, 0.953 ± 0.065, 0.997 ± 0.007, respectively (Figure 5A). The AUC in testing set model was 0.992 (95% CI: 0.962–1.000) (Figure 5B), and its accuracy, sensitivity, specificity, PPV, and NPV were 0.966, 0.824, 0.985, 0.875, 0.977, respectively. The confusion matrix of the SVM model was shown in Table 2. The calibration curve of the SVM model in training set and testing set was drawn (Figure 5C and D). As was shown, there was good consistency between the predicted probability and the actual probability in testing set.
Comparison of ROC Curves and DCA Between LR Model and SVM Model in Testing Set
The ROC curves of the LR model and the SVM model were compared in testing set (Figure 6A), and the DeLong test showed that the AUC of the SVM model was significantly higher than that of the LR model (0.992 vs 0.929, Z=2.858, P=0.004). In most cases, the SVM model’s net benefit was better than that of the LR model based on DCA (Figure 6B).
 |
Figure 6 (A) ROC curves of LR model and SVM model in testing set. (B) DCA curves of LR model and SVM model in testing set. |
Discussion
In this study, two machine learning algorithms, LR and SVM, were used to develop and validate the prediction model of SVE 6-month later after MIS in Chinese patients. Both models showed high AUC values (both>0.9). However, the SVM model was better than the LR model regarding discrimination, calibration, and clinical validity. Our results showed that the SVM model had a good predictive capability, which will be clinically helpful in identifying the risk of SVE 6 months later after MIS.
Among the 15 best predictive features, finally selected diabetes, posterior cerebral artery disease, and fasting blood glucose were the three strongest predictors. Diabetes is a well-known vascular risk factor. It is known that chronic hyperglycemia can lead to vascular endothelial dysfunction, early arterial stiffness increase, systemic inflammation, and thickening of the capillary basement membrane. These different mechanisms can affect the structure and function of blood vessels and regulate immunity, thereby increasing the risk of cardiovascular disease.17,18 Blood glucose control is extremely important for secondary stroke prevention. Studies have found that every 1% increase in hemoglobin A1c can increase the chance of death after stroke by approximately 33%.19 Compared to the chronic damage caused by diabetes to blood vessels, the damage to blood vessels caused by acute hyperglycemia cannot be underestimated. Many studies have shown that poor fasting blood glucose control is an important predictor of increased risk of adverse outcomes in acute ischemic stroke,20–22 which was consistent with this study that high fasting blood glucose after stroke was associated with poor prognosis. At present, the mechanism of the association between hyperglycemia and poor clinical prognosis of stroke patients is still unclear. Some researchers considered that the presence of hyperglycemia during cerebral ischemia would promote the production of lactic acid and aggravate tissue acidosis.23,24 Some scholars believe that acute hyperglycemia-mediated impairment of the brain autoregulation may be the key compensatory mechanism leading to the progression of ischemic penumbral tissue to infarcted tissue,25,26 and its specific mechanism needs to be further studied.
Current clinical scoring assessments used to predict recurrence after cerebral ischemia have limited efficacy.27 Among them, the Stroke Prognostic Indicators (SPI-II) and the Essen Stroke Risk Score (ESRS) were used to predict the long-term (up to 2 years) recurrence risk after ischemic stroke.28,29 SPI-II can be used in patients with transient ischemic attack (TIA) and minor stroke. However, studies have shown that the performance of the SPI-II score mainly depends on its ability to predict mortality rather than recurrence, and there is no better predictor for the high recurrence rate of minor ischemic stroke.30,31 The emergence of ML has changed this situation, although, ML technology has been used in the study of multiple cerebrovascular diseases, there are few studies on the prediction model of SVE risk in MIS patients. Compared to the machine learning prediction model developed by Du32 and others, we found that in addition to age, BMI, blood sugar, metabolic syndrome, infarct size and number, and other common risk factors, the location of the lesion played an important role in the occurrence of SVE, and posterior cerebral artery lesions showed a higher incidence of SVE compared to anterior circulation lesions. Since only 5% to 10% of patients with TIA or minor stroke have ischemic sites located in the area of PCA,33 and the number is small, so its clinical features and causes have not been studied as extensively as other vascular areas. Through verification, we found that posterior cerebral artery lesion was an important predictor of SVE risk in MIS patients. Compared with the study of Du et al,32 our study included more patients in the group. In addition to the LR algorithm, we also developed the SVM algorithm to build a predictive model. Our results showed that both algorithms had high prediction efficiency, but the prediction accuracy and clinical effectiveness of SVM were better.
This study has the following limitations. The first is the inherent limitations of a retrospective study. During the follow-up period, we cannot monitor the medication and dietary status of the patients. These unknown confounding may have a certain impact on the experimental results. Secondly, our model is a single-center study with a limited sample size and no external validation, the results need to be further validated externally by multi-center, large-scale studies. The application of machine learning in the medical field is expanding, since machine learning often requires a huge number of datasets, the types of which may not be readily available, in the future we may need a collaborative approach across multiple institutions to build robust datasets and develop more models to improve future ML-based stroke projects.
Conclusions
In summary, we used two machine learning algorithms, LR and SVM, to build and validate a prediction model that predicts the SVE incidence 6 months after MIS in Chinese patients. SVM showed high accuracy and applicability, and it can be used to predict the SVE risk after 6 months following MIS in Chinese patients.
Data Sharing Statement
All data generated or analyzed during this study are available from the corresponding author upon reasonable request.
Ethics Approval and Informed Consent
The study was conducted following the principles of the Declaration of Helsinki and was approved by the institutional ethics committee of the Second People’s Hospital of Kunshan for retrospective analysis.
Author Contributions
All authors made a significant contribution to the work reported, whether that is in the conception, study design, execution, acquisition of data, analysis and interpretation, or in all these areas; took part in drafting, revising or critically reviewing the article; gave final approval of the version to be published; have agreed on the journal to which the article has been submitted; and agree to be accountable for all aspects of the work.
Disclosure
The authors report no conflicts of interest in this work.
References
1. Guan T, Ma J, Li M, et al. Rapid transitions in the epidemiology of stroke and its risk factors in China from 2002 to 2013. Neurology. 2017;89(1):53–61. doi:10.1212/WNL.0000000000004056
2. Kono Y, Kawajiri H, Kamisaka K, et al. Predictive impact of daily physical activity on new vascular events in patients with mild ischemic stroke. Int J Stroke. 2015;10(2):219–223. doi:10.1111/ijs.12392
3. Kono Y, Yamada S, Kamisaka K, et al. Recurrence risk after noncardioembolic mild ischemic stroke in a Japanese population. Cerebrovasc Dis. 2011;31(4):365–372. doi:10.1159/000323233
4. Mavaddat N, Savva GM, Lasserson DS, Giles MF, Brayne C, Mant J. Transient neurological symptoms in the older population: report of a prospective cohort study–the Medical Research Council Cognitive Function and Ageing Study (CFAS). BMJ Open. 2013;3(7). doi:10.1136/bmjopen-2013-003195
5. Tse D, Hill MD, Coutts SB. Early Secondary Prevention in Transient Ischemic Attack (TIA) and Minor Stroke. Curr Neurol Neurosci Rep. 2019;19(6):34. doi:10.1007/s11910-019-0950-y
6. Park HK, Kim BJ, Han MK, et al. One-year outcomes after minor stroke or high-risk transient ischemic attack: Korean multicenter stroke registry analysis. Stroke. 2017;48(11):2991–2998. doi:10.1161/STROKEAHA.117.018045
7. Kamal H, Lopez V, Sheth SA. Machine learning in acute ischemic stroke neuroimaging. Front Neurol. 2018;9:945. doi:10.3389/fneur.2018.00945
8. Hung C-Y, Wei-Chen C, Lai P-T, Lin C-H, Lee CC. Comparing deep neural network and other machine learning algorithms for stroke prediction in a large-scale population-based electronic medical claims database. Annu Int Conf IEEE Eng Med Biol Soc. 2017;2017:3110–3113. doi:10.1109/EMBC.2017.8037515
9. Park D, Jeong E, Kim H, et al. Machine learning-based three-month outcome prediction in acute ischemic stroke: a single cerebrovascular-specialty hospital study in South Korea. Diagnostics. 2021;11(10):1909.
10. Lin WY, Chen CH, Tseng YJ, et al. Predicting post-stroke activities of daily living through a machine learning-based approach on initiating rehabilitation. Int J Med Inform. 2018;111:159–164. doi:10.1016/j.ijmedinf.2018.01.002
11. Ntaios G, Sagris D, Kallipolitis A, et al. Machine-learning-derived model for the stratification of cardiovascular risk in patients with ischemic stroke. J Stroke Cerebrovasc Dis. 2021;30(10):106018. doi:10.1016/j.jstrokecerebrovasdis.2021.106018
12. Xie Y, Jiang B, Gong E, et al. JOURNAL CLUB: use of gradient boosting machine learning to predict patient outcome in acute ischemic stroke on the basis of imaging, demographic, and clinical information. AJR Am J Roentgenol. 2019;212(1):44–51. doi:10.2214/AJR.18.20260
13. Fernandez-Lozano C, Hervella P, Mato-Abad V, et al. Random forest-based prediction of stroke outcome. Sci Rep. 2021;11(1):10071. doi:10.1038/s41598-021-89434-7
14. Olsen CR, Mentz RJ, Anstrom KJ, Page D, Patel PA. Clinical applications of machine learning in the diagnosis, classification, and prediction of heart failure. Am Heart J. 2020;229:1–17. doi:10.1016/j.ahj.2020.07.009
15. Fabris F, Magalhaes JP, Freitas AA. A review of supervised machine learning applied to ageing research. Biogerontology. 2017;18(2):171–188. doi:10.1007/s10522-017-9683-y
16. Sirsat MS, Ferme E, Camara J. Machine learning for brain stroke: a review. J Stroke Cerebrovasc Dis. 2020;29(10):105162. doi:10.1016/j.jstrokecerebrovasdis.2020.105162
17. Chen R, Ovbiagele B, Feng W. Diabetes and stroke: epidemiology, pathophysiology, pharmaceuticals and outcomes. Am J Med Sci. 2016;351(4):380–386. doi:10.1016/j.amjms.2016.01.011
18. Yahagi K, Kolodgie FD, Lutter C, et al. Pathology of human coronary and carotid artery atherosclerosis and vascular calcification in diabetes mellitus. Arterioscler Thromb Vasc Biol. 2017;37(2):191–204. doi:10.1161/ATVBAHA.116.306256
19. Stevens RJ, Coleman RL, Adler AI, Stratton IM, Matthews DR, Holman RR. Risk factors for myocardial infarction case fatality and stroke case fatality in type 2 diabetes: UKPDS 66. Diabetes Care. 2004;27(1):201–207. doi:10.2337/diacare.27.1.201
20. Yao M, Ni J, Zhou L, et al. Elevated fasting blood glucose is predictive of poor outcome in non-diabetic stroke patients: a sub-group analysis of SMART. PLoS One. 2016;11(8):e0160674. doi:10.1371/journal.pone.0160674
21. Mi D, Wang P, Yang B, Pu Y, Yang Z, Liu L. Correlation of hyperglycemia with mortality after acute ischemic stroke. Ther Adv Neurol Disord. 2018;11:1756285617731686. doi:10.1177/1756285617731686
22. Ahmed N, Davalos A, Eriksson N, et al. Association of admission blood glucose and outcome in patients treated with intravenous thrombolysis: results from the safe implementation of treatments in Stroke International Stroke Thrombolysis Register (SITS-ISTR). Arch Neurol. 2010;67(9):1123–1130. doi:10.1001/archneurol.2010.210
23. Suh SW, Shin BS, Ma H, et al. Glucose and NADPH oxidase drive neuronal superoxide formation in stroke. Ann Neurol. 2008;64(6):654–663. doi:10.1002/ana.21511
24. Martini SR, Kent TA. Hyperglycemia in acute ischemic stroke: a vascular perspective. J Cereb Blood Flow Metab. 2007;27(3):435–451. doi:10.1038/sj.jcbfm.9600355
25. Shimoyama T, Kimura K, Uemura J, Saji N, Shibazaki K. Elevated glucose level adversely affects infarct volume growth and neurological deterioration in non-diabetic stroke patients, but not diabetic stroke patients. Eur J Neurol. 2014;21(3):402–410. doi:10.1111/ene.12280
26. Parsons MW, Barber PA, Desmond PM, et al. Acute hyperglycemia adversely affects stroke outcome: a magnetic resonance imaging and spectroscopy study. Ann Neurol. 2002;52(1):20–28. doi:10.1002/ana.10241
27. Chaudhary D, Abedi V, Li J, Schirmer CM, Griessenauer CJ, Zand R. Clinical risk score for predicting recurrence following a cerebral ischemic event. Front Neurol. 2019;10:1106. doi:10.3389/fneur.2019.01106
28. Kernan WN, Viscoli CM, Brass LM, et al. The stroke prognosis instrument II (SPI-II): a clinical prediction instrument for patients with transient ischemia and nondisabling ischemic stroke. Stroke. 2000;31(2):456–462. doi:10.1161/01.STR.31.2.456
29. Weimar C, Diener HC, Alberts MJ, et al. The Essen stroke risk score predicts recurrent cardiovascular events: a validation within the REduction of Atherothrombosis for Continued Health (REACH) registry. Stroke. 2009;40(2):350–354. doi:10.1161/STROKEAHA.108.521419
30. Weimar C, Benemann J, Michalski D, et al. Prediction of recurrent stroke and vascular death in patients with transient ischemic attack or nondisabling stroke: a prospective comparison of validated prognostic scores. Stroke. 2010;41(3):487–493. doi:10.1161/STROKEAHA.109.562157
31. Navi BB, Kamel H, Sidney S, Klingman JG, Nguyen-Huynh MN, Johnston SC. Validation of the Stroke Prognostic Instrument-II in a large, modern, community-based cohort of ischemic stroke survivors. Stroke. 2011;42(12):3392–3396. doi:10.1161/STROKEAHA.111.620336
32. Du Y, Gu P, Cui Y, Wang Y, Ran J. Developing a nomogram to predict the probability of subsequent vascular events at 6-Month in Chinese patients with minor ischemic stroke. Ther Clin Risk Manag. 2021;17:543–552. doi:10.2147/TCRM.S306601
33. Kleihues P, Hizawa K. [The infarct of the posterior cerebral artery: pathogenesis and topographical relationship to the visual cortex]. Arch Psychiatr Nervenkr. 1966;208(3):263–284. Czech. doi:10.1007/BF00341689
 © 2022 The Author(s). This work is published and licensed by Dove Medical Press Limited. The full terms of this license are available at https://www.dovepress.com/terms.php and incorporate the Creative Commons Attribution - Non Commercial (unported, v3.0) License.
By accessing the work you hereby accept the Terms. Non-commercial uses of the work are permitted without any further permission from Dove Medical Press Limited, provided the work is properly attributed. For permission for commercial use of this work, please see paragraphs 4.2 and 5 of our Terms.


