Back to Journals » Diabetes, Metabolic Syndrome and Obesity » Volume 16
Application of Interpretable Machine Learning Models Based on Ultrasonic Radiomics for Predicting the Risk of Fibrosis Progression in Diabetic Patients with Nonalcoholic Fatty Liver Disease
Authors Meng F, Wu Q, Zhang W, Hou S
Received 7 October 2023
Accepted for publication 22 November 2023
Published 2 December 2023 Volume 2023:16 Pages 3901—3913
DOI https://doi.org/10.2147/DMSO.S439127
Checked for plagiarism Yes
Review by Single anonymous peer review
Peer reviewer comments 2
Editor who approved publication: Dr Konstantinos Tziomalos
Fei Meng, Qin Wu, Wei Zhang, Shirong Hou
Department of Ultrasound, Xuan Cheng City Central Hospital, Xuancheng, Anhui, People’s Republic of China
Correspondence: Fei Meng, Xuan Cheng City Central Hospital, No. 117, Tonggong Road, Xuanzhou Distinct, Xuancheng, Anhui, 242000, People’s Republic of China, Tel +86-18956308225, Email [email protected]
Introduction: Patients with nonalcoholic fatty liver disease (NAFLD) and type 2 diabetes mellitus (T2DM) face a significant risk of hepatic fibrosis. Liver stiffness measurement (LSM) is commonly used to exclude advanced fibrosis, but its effectiveness in predicting fibrosis progression, especially in initially fibrosis-free patients, remains under-investigated. Although radiomics and machine learning (ML) models show promise in interpreting intricate data and predicting clinical outcomes, their application in assessing the fibrosis progression risk has not been fully explored. This study aimed to address this gap by developing and validating ML-based models to identify patients at risk of fibrosis progression using clinical data and multimodal radiomics features, thereby enhancing NAFLD and T2DM management.
Methods: The study involved a retrospective analysis of 618 diabetic patients with NAFLD. These patients were divided into training and external validation cohorts. Based on LSM values, patients were classified into “Low-risk” and “Fibrosis-risk” groups. Radiomics features from multimodal ultrasound imaging were extracted, standardized, and utilized to develop various ML models. The models were internally validated based on these radiomics or clinical data, and the optimal model’s feature importance was analyzed using the Shapley Additive Explanations (SHAP) approach, followed by external validation.
Results: Of the 618 patients, 18.1% demonstrated an LSM≥ 6.5kPa, indicating a higher risk of hepatic fibrosis. The study identified 25 significant fibrosis-related radiomics features, with the support vector machine (SVM) model demonstrating superior performance in both internal and external validations. The SHAP analysis identified five key determinants of fibrosis risk, which included three radiomics features from shear wave elastography (SWE) and two from grayscale imaging.
Conclusion: This study demonstrates the utility of an SVM model based on radiomics features derived from SWE and grayscale imaging for predicting fibrosis progression in diabetic patients with NAFLD, thereby enabling timely and effective therapeutic interventions.
Keywords: nonalcoholic fatty liver disease, type 2 diabetes mellitus, hepatic fibrosis, machine learning, radiomics, support vector machine
Introduction
Nonalcoholic fatty liver disease (NAFLD) encompasses conditions from simple hepatic steatosis to nonalcoholic steatohepatitis (NASH), the latter posing a risk for progressive fibrosis.1 Prior investigations highlight that in NAFLD patients, the stage of fibrosis, rather than NASH, is a formidable determinant of mortality and progression to end-stage liver disease, especially prominent in those with advanced fibrosis.2,3 Alarmingly, fibrosis progression is acutely amplified in type 2 diabetes mellitus (T2DM) patients with concurrent NAFLD. Roughly 55% of the global T2DM population has NAFLD, with about 17% encountering advanced fibrosis at their first visit.4 This dual condition dramatically increases the risk of fibrosis progression, even in the absence of initial fibrosis.5,6 The intersection between NAFLD and T2DM is particularly concerning due to the exacerbated risk factors and accelerated disease progression associated with this comorbidity. T2DM contributes to this risk through multiple pathways, including insulin resistance, hyperglycemia, and dyslipidemia. These factors collectively exacerbate liver damage by promoting fatty acid accumulation, enhancing oxidative stress and inflammation, while also altering lipid metabolism.7 This confluence of effects sets the stage for hepatic steatosis, thereby advancing NAFLD towards fibrosis. In fact, a longitudinal study has found that, among such NAFLD patients, 27% showed fibrosis progression within a 3-year period as evidenced by paired liver biopsies.8 Considering the substantial occurrence and dangerous progression of fibrosis in diabetic patients with NAFLD, the precise recognition of individuals at risk for fibrosis progression is essential in their medical management.
While liver biopsy remains the gold standard for fibrosis evaluation, its invasiveness limits its applicability in routine disease progression monitoring.9 The focus has shifted towards non-invasive strategies. Imaging techniques, in particular, have emerged as preferred alternatives, surpassing traditional scoring systems in fibrosis assessment due to their superior accuracy.10 Among them, transient elastography (TE) has demonstrated high accuracy and is now endorsed as an initial assessment in NAFLD patients.11,12 Liver stiffness measurement (LSM), a parameter derived from TE, has been validated to reliably exclude advanced fibrosis with a high negative predictive value.13,14 However, the utility of these techniques remains underexplored for evaluating fibrosis progression risk in diabetic patients with NAFLD initially devoid of fibrosis. It is clear that early detection and intervention could potentially minimize disease progression and associated burdens in these high-risk patients.15,16 Thus, the development of a non-invasive approach to quantitatively evaluate progressive fibrosis risk in diabetic patients with NAFLD is crucial.
To address this challenge, widely adopted and cost-effective liver ultrasonic examinations may be effectively augmented with radiomics for non-invasive monitoring of fibrosis progression. The technique of radiomics, originally introduced by Lambin et al17 in 2012, enables the extraction of a vast number of subtle features from medical images, thereby establishing reliable associations with clinical outcomes. Recent advancements in this field have demonstrated its effectiveness in non-invasively evaluating hepatic fibrosis.18,19 However, the intricate and often nonlinear nature of the relationships between the numerous, nuanced features identified by radiomics and their clinical outcomes presents a significant analytical challenge. This complexity limits the effectiveness of linear predictive models, such as logistic regression (Logit), in achieving the highest level of predictive precision. In this context, the application of machine learning (ML) - an artificial intelligence branch renowned for its unparalleled capability in deciphering complex patterns in extensive and intricate data sets - becomes indispensable for constructing an effective predictive model.20 Common ML classifiers, such as random forest (RF) and extreme gradient boosting (XGBoost), have demonstrated versatility in applications ranging from the detection of NASH to the prediction of fibrosis progression.21 However, research is limited on ML models based on ultrasonic radiomics for the prediction of fibrosis progression risk, particularly in T2DM patients with NAFLD.
With this background, our study aims to develop and validate an interpretable ML model that leverages radiomics features extracted from multimodal ultrasound images, with the goal of predicting the risk of fibrosis progression in T2DM and NAFLD patients initially without hepatic fibrosis. We anticipate that this method may enable the timely adjustment of therapeutic interventions, potentially avoiding further liver damage.
Materials and Methods
The execution of this study was in accordance with the principles of the Declaration of Helsinki and received approval from the Institutional Review Board of Xuan Cheng City Central Hospital (NO. 2023027). Due to the retrospective design of this research, the requirement for informed consent was waived by our ethics committee. To protect patient privacy, all data used were thoroughly anonymized.
Patient Selection
We retrospectively evaluated the medical records of 650 T2DM patients (ranging in age from 18 to 75 years old with no previous history of liver disease) who presented with NAFLD, treated at our institution between January 2020 and May 2023. Diagnosis of T2DM was confirmed based on the American diabetes association guidelines.22 The presence of NAFLD was established by ultrasound evidence of hepatic steatosis, along with the absence of viral hepatitis, autoimmune hepatitis or other specific causes of liver disease, and no causes of secondary hepatic fat accumulation, such as significant alcohol consumption (over 30g/day for men and over 20g/day for women) or use of steatogenic medication.23,24 Patients with inaccurate clinical data or low-quality ultrasound images were excluded from the study.
After rigorous screening, a total of 618 T2DM patients with NAFLD were successfully incorporated into this study cohort. In order to ensure the reliability of the predictive model, the cohort was randomly divided into training and external verification cohorts at a 7:3 ratio. LSM was performed as a routine procedure for all patients at the time of initial diagnosis of hepatic fibrosis. Patients who had an LSM value less than 6.5 kPa, a threshold suggested by Siddiqui et al14 to exclude advanced fibrosis (negative predictive value of 0.91), were categorized into the “Low-risk” group, while the rest were placed in the “Fibrosis-risk” group.
Data Collection
Medical records of each patient were thoroughly reviewed, with anthropometric measurements and results of laboratory investigations being systematically collected. Essential demographic details and medical history were also extracted. A wide range of laboratory parameters were included in the analysis, incorporating hepatic function markers, indices of glucose metabolism, lipid profile components, and measures indicative of insulin resistance. Hepatic function was assessed based on transaminase levels, while the status of glucose metabolism was determined using measures of fasting glucose and glycosylated hemoglobin. Lipid profiles were evaluated through cholesterol and triglyceride levels, and insulin resistance was appraised using the homeostasis model assessment of insulin resistance (HOMA-IR).
Acquisition of Multimodal Ultrasound Images
The ultrasonographic examination was conducted utilizing the Philips EPIQ 7 ultrasound system (Philips Medical Systems, Bothell, WA), with patients arranged in the lateral decubitus position. To ensure optimal imaging conditions, patients were instructed to maintain a fasting period of at least three hours before the examination. The assessment initiated with a routine B-mode ultrasound scan. Following the standard scan, the mode was shifted to shear wave elastography (SWE) to obtain elastographic data. SWE operates by generating focused acoustic pulses that induce shear waves, with their propagation speed analyzed to determine tissue stiffness. Patient breath-holding was required during SWE to reduce measurement variability from respiratory motion. Once the image was stabilized, the region of interest (ROI) was strategically located at the right hepatic lobe, circumventing any vascular structures to avoid their interference. The SWE imaging output was encoded in a color scale on the elastogram, transitioning from deep blue to red, signifying a range from lower to higher tissue stiffness, respectively. These duplex images, integrating grayscale ultrasound and SWE findings, were archived in digital imaging and communications in medicine (DICOM) format for further radiomics analysis.
Radiomics Feature Extraction
Figure 1 outlines the general workflow of our study, which primarily consists of image segmentation, radiomics analysis, and ML model establishment and validation. Duplex ultrasonic liver images were processed using the 3D Slicer software (v5.0.2), where distinct ROIs were identified to guide the segmentation process. Specifically, within the right-sided SWE image, one ROI was assigned to align with the sector-shaped SWE sampling frame. Simultaneously, a second ROI was defined at the corresponding location in the hepatic parenchyma on the grayscale image. This dual-ROI approach facilitated the simultaneous segmentation of grayscale and SWE images of the liver parenchyma within the same duplex image.
 |
Figure 1 Workflow Diagram for ML Model Development with Liver Radiomics from Duplex Ultrasound. The process begins with image segmentation and radiomics analysis, leading to the establishment and validation of the ML model. In wavelet transformation, “L” represents low-frequency coefficients, while “H” signifies high-frequency coefficients. |
After careful segmentation, a detailed extraction of radiomics features was carried out using the 3D Slicer radiomics extension. This process converted medical imaging data into a highly structured, multi-dimensional dataset that is crucial for the quantification and characterization of liver fibrosis.25 For uniformity and to ensure the reliability of the extraction process across different scans, all images underwent resampling to a uniform resolution of 1×1 mm via nearest-neighbor interpolation. From each identified ROI, we extracted a detailed suite of 849 features. This dataset included 12 shape-based, 18 first-order statistical, and 75 textural features from the processed image. Textural features were further divided into five categories based on their matrix of origin: gray-level co-occurrence, gray-level dependence, gray-level run length, gray-level size zone, and neighboring gray tone difference matrices, with a respective allocation of 24, 14, 16, 16, and 5 features each. To add another layer of analytical depth, 744 advanced features obtained through the application of wavelet transformations to the foundational first-order and texture features, amplifying the analytical dimension of our study. To ensure consistency between observers, radiomics features for each patient were extracted by two experienced sonographers. All extracted features were compiled in an Excel spreadsheet for further feature selection procedures.
Data Preprocessing
Prior to the development of a prediction model, an essential stage of data preprocessing was undertaken to ensure the unbiasedness of the process. This involved the standardization of all data, comprising both extracted radiomics features and collected clinical information. The approach to standardization differed based on the type of the variable. Continuous variables underwent Z-score normalization, aligning them to a scale with a mean of zero and standard deviation of one. On the other hand, categorical variables were binarized, assigned either a “0” or “1” value. Clinical outcomes for the predictive model were determined based on the LSM values. Employing a binary classification, patients with an LSM value less than 6.5 kPa were assigned a “0”, while all other cases were assigned a “1”.
Selection of Radiomics Features
The consistency in the extraction of features by different observers was evaluated by computing the interclass correlation coefficients (ICCs), with a threshold of 0.80 set as the acceptable level of agreement. An initial screening process was carried out utilizing the Student’s t-test, wherein features manifesting false discovery rate (FDR)-corrected P values less than 0.05 were considered as significant. Following this initial selection, a least absolute shrinkage and selection operator (LASSO) logistic regression model was utilized to further optimize the selection of features.
Derivation and Internal Validation of ML Models
To predict the risk of fibrosis progression, four well-established ML classifiers were employed, including Logit, RF, support vector machine (SVM), and XGBoost. Distinct prediction models were developed on the basis of clinical data, radiomics features, and their combined use. During the model training phase, a triply-repeated five-fold cross-validation scheme was applied to each data group. This methodology facilitated the optimal use of the training set by dividing it into inner training and test data, sequentially cycling each subset for testing while retaining the rest for training. For the RF classifier, a configuration of 500 trees was chosen, with the number of features for node splitting set at the square root of the total feature count. For the SVM, a radial basis function (RBF) kernel was selected for its proficiency in managing non-linear data. Hyperparameters underwent meticulous tuning with the SVM cost parameter optimized via grid search across the range [0.1, 1, 10], and the gamma parameter for the RBF kernel determined similarly within the range [0.001, 0.01, 0.1]. Parameters for XGBoost, including the learning rate at 0.02, maximum tree depth at 4, and an ensemble of 600 trees, were established after a grid search to balance model complexity and prediction accuracy.
Following model derivation, each model underwent a rigorous internal validation process, evaluating discrimination, calibration, and clinical applicability. The determination of the optimal predictive was guided by superior discriminatory capabilities, alongside satisfactory calibration and clinical utility.
Interpretability and External Validation of ML Models
Following the identification of the optimal predictive models, we sought to elucidate the specific contribution of each variable towards the prediction. The SHAP (shapley additive explanation) methodology was integrated to facilitate an in-depth comprehension of feature importance, thereby highlighting the most influential variables. Each feature was ranked in descending order of influence based on their respective SHAP values, thereby highlighting the most critical predictors in our patient cohort.26 Further, to validate the robustness of our models, external validation was performed. This rigorous evaluation confirmed their discriminative abilities, calibration, and clinical applicability, providing a comprehensive understanding of the predictive capability of these models.
Statistical Analysis
A combination of statistical methods was employed based on the type of data. For categorical variables, analysis was carried out using the chi-square test. The distribution of continuous variables was initially evaluated using the Shapiro–Wilk test, directing the application of either the Mann–Whitney U-test or the independent-sample t-test. In evaluating model performance, we employed receiver operating characteristic (ROC) curve analysis with the area under the curve (AUC), alongside Precision, Recall, and F1 Score metrics, to comprehensively assess the model’s discrimination ability. AUC comparisons were conducted using Delong’s test. Further, the goodness of fit for each model was evaluated using calibration curve analysis and the Brier Score, which assesses the accuracy of probability predictions. To provide insights into the clinical utility of the models, decision curve analysis (DCA) was implemented to estimate the net benefits at various threshold probabilities. All statistical analyses were conducted using IBM SPSS Statistics (v 22.0, SPSS Inc.) and Python (v 3.7.1).
Result
Patient Characteristics
Figure 2 details the process of patient selection, as well as the derivation and validation of our model. Of the 618 T2DM patients with NAFLD (342 males, average age 50.70 ± 8.76 years), the LSM values displayed a median of 5.5 kPa and an interquartile range (IQR) from 4.4 to 6.1 kPa. In this cohort, 112 cases (18.1%) demonstrated an LSM ≥ 6.5kPa, indicating a heightened risk of hepatic fibrosis. The patients were divided into a training cohort (432 individuals) and an external verification cohort (186 individuals), with hepatic fibrosis being identified in 86 (19.9%) and 26 (14.0%) of the respective cohorts, a difference which was not statistically significant (χ2=3.080, P=0.079). Further validation is provided by Table S1, which confirms a balanced distribution between the two cohorts with no significant disparities in all clinical characteristics, including LSM (all P>0.05).
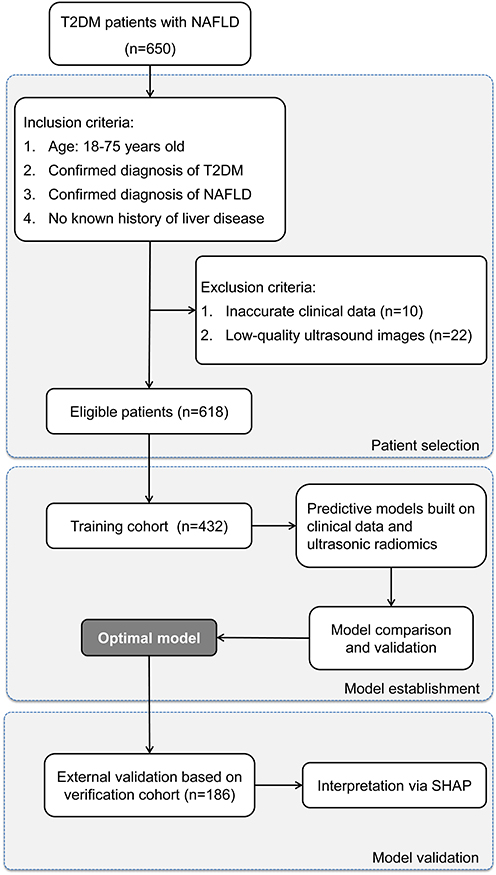 |
Figure 2 Flowchart of Patient Selection and Cohort Distribution for Developing and Validating Predictive Models in T2DM Patients with NAFLD. |
Comparative clinical characteristics of low-risk and fibrosis-risk groups in the training cohort.
Table 1 provides a comparison of clinical features among the low-risk and fibrosis-risk patients in the training cohort, classified based on their LSM values. It revealed that patients at higher fibrosis risk demonstrated elevated BMI, FBG, HbA1c, ALT, and HOMA-IR, alongside decreased PLT counts (all P values < 0.05). These key clinical parameters underwent Z-score normalization, being adjusted to a mean of zero and a standard deviation of one. These standardized parameters were then documented and employed for the subsequent construction of clinical ML prediction models.
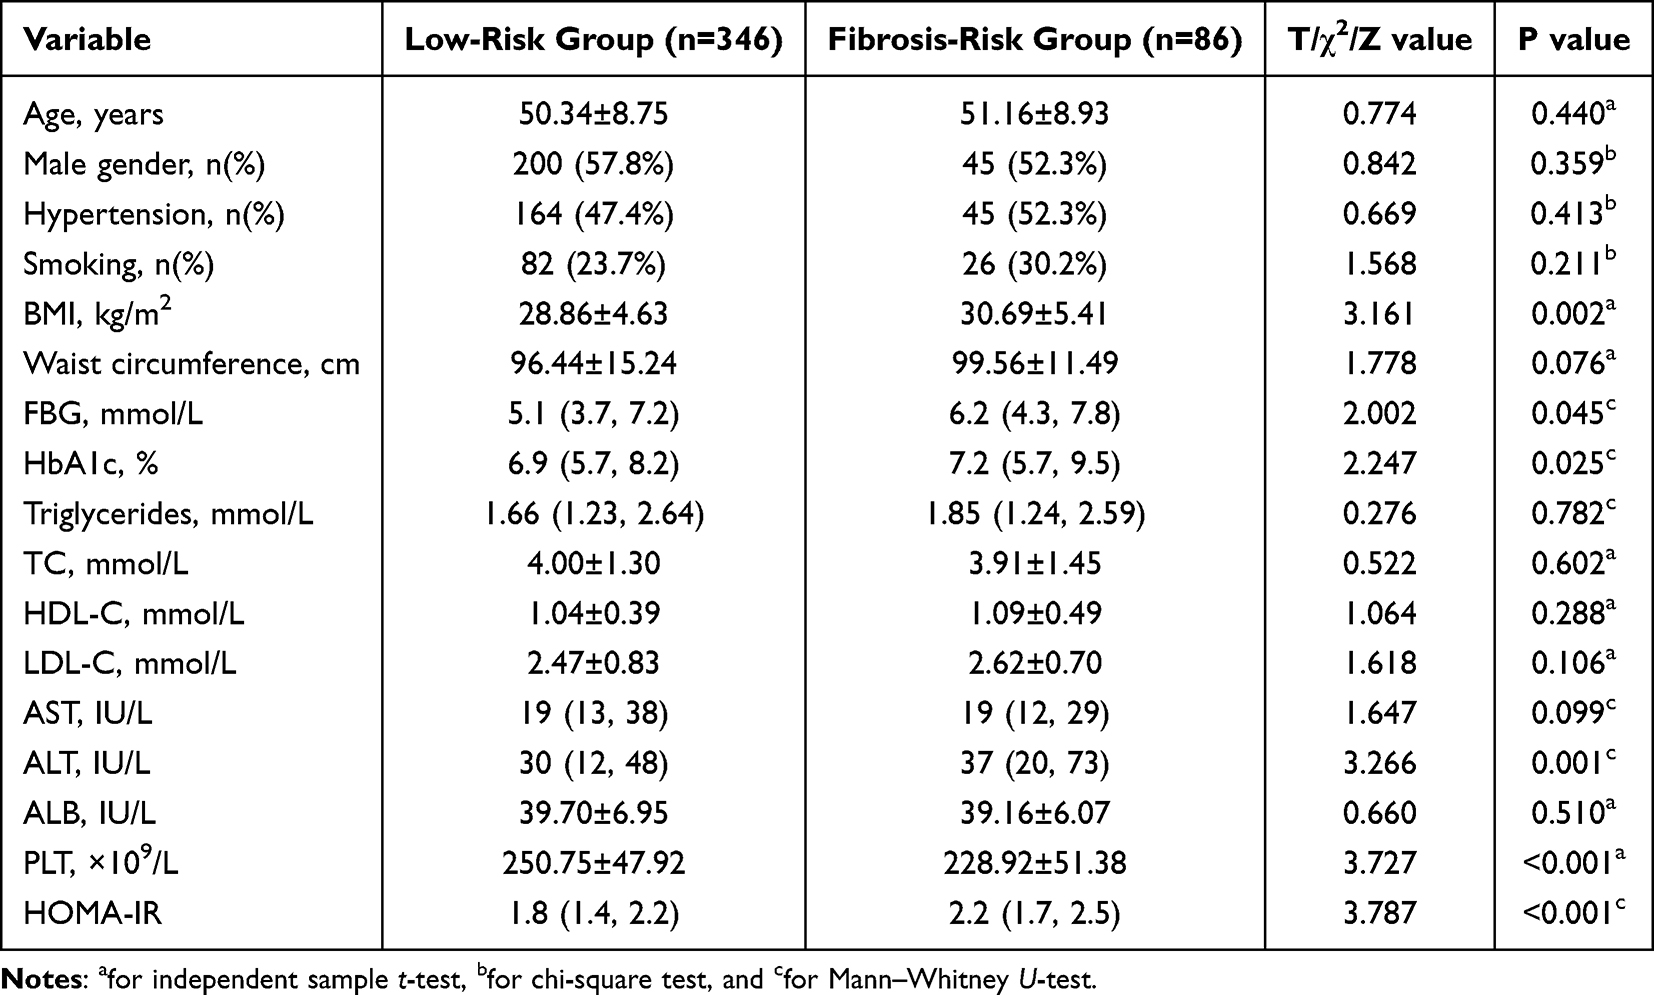 |
Table 1 Comparative Clinical Characteristics of Low-Risk and Fibrosis-Risk Patients |
Radiomics Analysis
The dual-ROI segmentation of duplex ultrasound from each patient in the training cohort yielded a total of 1698 radiomics features, with each segmentation contributing 849 features. Following the same normalization protocol, 1222 features (72.0%) with intra-observer ICC of 0.8 or higher were conserved in the first stage of feature selection, thereby ensuring stability for further analysis. During the next step, Student’s t-test revealed 102 features with a potential association with hepatic fibrosis. The conclusive phase employed LASSO regression, which led to the selection of 25 fibrosis-associated features of significance; 12 from SWE segmentation and 13 from grayscale segmentation. A visualization of the LASSO feature selection process can be observed in Figures S1 and S2.
Model Comparison for Fibrosis Progression Risk Prediction
In our comprehensive analysis of predictive models for fibrosis progression risk among T2DM patients with NAFLD, we assessed four ML classifiers: Logit, SVM, RF, and XGBoost. These classifiers were applied across three datasets: clinical data, radiomics features, and a combined set. The performance of these models is systematically compared in Table 2, and the ROC, calibration, and DCA curves are depicted in Figure 3. Our findings indicated that models based on radiomics features (AUC: 0.892–0.933) outperformed those utilizing clinical data alone (AUC: 0.655–0.704) in discrimination ability, as evidenced by Delong’s test (P < 0.05). While the combined datasets yielded slightly higher AUC values (up to 0.949), Delong’s test confirmed that these improvements were not statistically significant (P > 0.05). However, integrating clinical data with radiomics features resulted in a notable reduction in calibration, suggesting that pure radiomics-based models were more suitable for assessing fibrosis progression risk in patients with T2DM and NAFLD.
 |
Table 2 Performance of ML Classifiers for Predicting Fibrosis Progression Risk Using Clinical Data, Radiomics Features, and Combined Datasets in T2DM Patients with NAFLD |
 |
Figure 3 Comparative Analysis of ML Classifiers across Different Data Types. (A–C) reveal the performance (ROC, calibration, and DCA curves) of ML classifiers (Logit, SVM, RF, and XGBoost) applied to clinical data, with ROC-AUCs of 0.70, 0.66, 0.65, and 0.69, respectively. (D–F) show these classifiers’ performance based on radiomics features, yielding AUCs of 0.93, 0.92, 0.89, and 0.90. (G–I) display their performance when applied to combined clinical and radiomics data, with AUCs reaching up to 0.94, 0.95, 0.87, and 0.91. While the combined data models demonstrate the highest AUC values, a noticeable decrement in calibration is observed, highlighting the superior suitability of radiomics-based models for evaluating fibrosis progression risk in T2DM patients with NAFLD. Among these, SVM demonstrates superior discrimination and calibration, and comparable DCA curve performance, designating it as the most effective classifier. |
Within the pool of radiomics-based models, Logit and SVM yielded the highest AUC scores of 0.933 and 0.923, respectively. Nevertheless, SVM demonstrated superior calibration, with Logit models tending to overestimate probabilities around the 60% probability range. Both models demonstrated comparable results on DCA curves, reinforcing the choice of SVM as the preferred classifier for predicting fibrosis progression risk due to its balanced performance across all measured metrics including Precision, Recall, F1 Score, and Brier Score.
Assessing ML model with the external verification cohort.
The predictive performance of the SVM model was further assessed utilizing the external verification cohort. Radiomics features from this cohort were processed by the established SVM model, facilitating automatic computation of hepatic fibrosis risk for each patient. These calculated risks were then analyzed with actual hepatic fibrosis outcomes via the ROC, calibration, and DCA curves (Figure 4). Despite a minor decrease in performance relative to the training cohort, the SVM model maintained noteworthy discriminative capabilities, with an AUC of 0.87 on the ROC curve (Figure 4A). The calibration curve indicated a high degree of concordance between predicted probabilities and observed event frequencies, specifically for predictions exceeding 50% (Figure 4B). A tendency for the model to overestimate risks when the predicted probabilities were below 50% was observed, yet this did not substantially compromise its overall clinical application. Further confirmation of the model’s robustness was provided by the DCA, demonstrating considerable net benefits across all prediction probabilities (Figure 4C). This result emphasized the considerable potential of the SVM model as a predictive tool for fibrosis progression risk, suggesting its viability as a practical clinical application.
 |
Figure 4 Evaluating Predictive Performance of Optimal ML Model with External Verification Cohort. (A) exhibits the ROC curve with an AUC of 0.87, indicating the significant discriminative capacity of the model. (B) reveals the calibration curve, demonstrating a robust agreement between predicted probabilities and actual observed events, particularly for predictions beyond a 50% threshold. (C) illustrates the DCA, emphasizing the net clinical benefit provided by the model across the entire spectrum of prediction probabilities. |
Interpretation of the Model
The SHAP analysis was employed to interpret the SVM model by quantifying the contribution of individual features within the model. This method enabled the ranking of feature significance by calculating the absolute mean SHAP values. Notably, three radiomics features from SWE and two radiomics features from the corresponding grayscale image emerged as the top five key determinants (Figure 5A). To visually represent the cumulative effect of each feature, a summary plot incorporating the SHAP values was constructed (Figure 5B). This graphic representation provided a comprehensive understanding of how each feature contributed to individual patient predictions. Remarkably, it was revealed higher values of these top five features correlated with an elevated risk of fibrosis progression in T2DM patients with NAFLD.
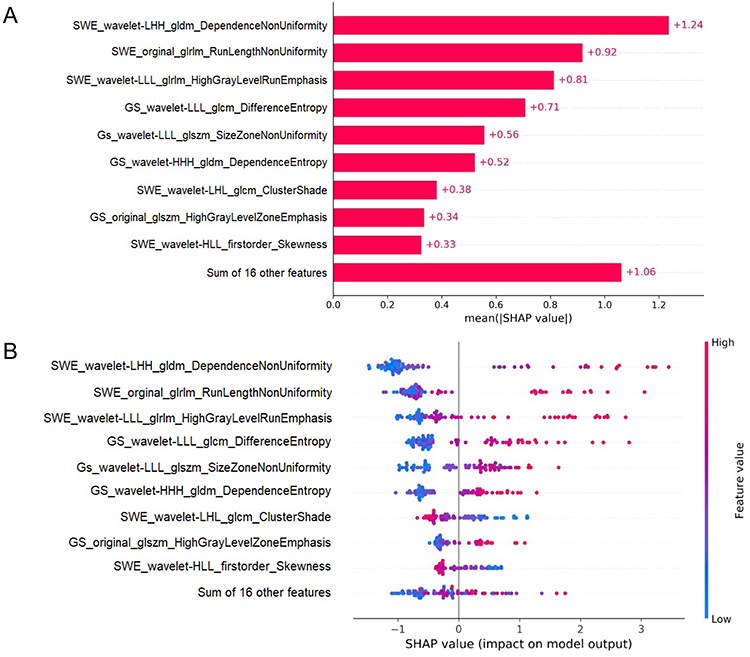 |
Figure 5 SHAP Analysis of the SVM Model for Hepatic Fibrosis Prediction. (A) illustrates the ranking of feature significance as determined by absolute mean SHAP values, with three radiomics features from SWE and two from GS identified as the top five critical determinants. (B) presents a summary plot incorporating SHAP values, providing a comprehensive visualization of the cumulative influence of each feature. This graphical depiction indicates a correlation between higher values of the top five features and an increased risk of hepatic fibrosis. |
Discussion
Despite the existence of several non-invasive methods for detecting advanced fibrosis, accurately stratifying NAFLD patients, especially those with T2DM, for future fibrosis progression remains challenging. These patients are particularly prone to hepatic fibrosis, necessitating reliable methods for detecting both advanced fibrosis and potential progression. In this study, we attempted to address this need by developing and comparing predictive models using four different ML classifiers. These models were based on either clinical data or multimodal ultrasound radiomics features. Our comprehensive evaluation, which included assessments of discriminative ability, calibration, and clinical utility, identified the SVM model using ultrasound radiomics as the most effective for predicting fibrosis risk. Notably, the integration of SHAP analysis into the SVM model significantly improved its interpretability, highlighting the pivotal radiomics features influencing fibrosis progression risk. This study represents a pioneering effort in combining multimodal ultrasound radiomics features with ML models to predict hepatic fibrosis progression risk. By continuously refining this novel ML model, we can significantly enhance the accuracy of individualized assessments for fibrosis progression risk. This improvement has the potential to boost patient adherence to long-term lifestyle changes and enable more timely and effective adjustments in treatment strategies.
Simple steatosis in T2DM patients does not always maintain a static course. A recent meta-analysis based on paired-biopsy studies indicated that approximately 30% of NAFLD patients progress at least one stage of fibrosis within a period of 3–10 years, with concurrent diabetes further accelerating this progression.27 Eddowes et al13 proposed that a rise in LSM by 2 kPa signifies a stage of fibrosis progression. Further, a study on fibrosis progression noted that 4% of T2DM patients with NAFLD and an initial LSM below 10 kPa, experienced fibrosis progression, evidenced by an LSM increase of ≥2 kPa, within 3 years.28 As the disease duration extends, the percentage of patients manifesting fibrosis progression increases. According to Xia et al29, nearly 15% of patients with comorbid diabetes and NAFLD demonstrated a progression of one fibrosis stage over 3 years. This reinforces the urgency and importance for early identification of fibrosis risk among patients with T2DM and NAFLD.
In this study, we favored ML models due to their capacity to handle complex non-linear relationships between variables and outcomes, surpassing traditional linear predictive models.30 Four ML models were applied to clinical or radiomics data, all displaying satisfactory calibration and clinical utility, yet they exhibited considerable variability in discrimination. Specifically, radiomics-based ML models emerged as the most suitable for predicting hepatic fibrosis risk because it demonstrated enhanced discrimination compared to clinical-feature-based models, which might be due to the broader spectrum of radiomics features (1698 features) implicated in hepatic fibrosis, compared to only 17 clinical features. This significant feature discrepancy might contribute to variations in predictive efficacy. We did not select the combined models incorporating both clinical and radiomics data as the most effective, even though these hybrid models exhibited slightly improved discrimination compared to solely radiomics-based ML models. This is due to the fact that the incorporation of clinical data into the radiomics-based models resulted in a significant decrease in calibration.
Among the chosen ML models, SVM was ultimately demonstrated to be the most effective radiomics-based model, exhibiting robust accuracy, even under the external validation. To address the inherent interpretability challenges associated with complex ML models, we employed the SHAP methodology. This approach clarifies decision-making processes at a cohort level, and is complemented by intuitive visualization tools, enabling a deeper understanding of individual variable contributions to model predictability, thereby promoting confidence between clinicians and AI algorithms.31,32 It showed that five key predictors of hepatic fibrosis risk were revealed: three SWE radiomics features and two grayscale radiomics features. The central role of SWE radiomics features is expected given their design reflecting liver stiffness changes. Interestingly, two grayscale radiomics features emerged as critical predictors, suggesting their unexplored potential in hepatic fibrosis evaluation. In conjunction with SHAP, SVM offered a clear depiction of variable influence on predicted outcomes, establishing it as a valuable tool in routine hepatic fibrosis screenings. The successful incorporation of ML into these screenings might highlight its potential to revolutionize NAFLD management and improve patient outcomes.
While our study offered encouraging results, some limitations must be acknowledged. Firstly, our single-center, retrospective design with a relatively limited patient cohort could constrain the generalizability of findings. Additionally, potential variations in SWE settings across institutions may impact the performance of our radiomics ML models. Secondly, although LSM is globally accepted as a non-invasive diagnostic criterion for hepatic fibrosis, the absence of liver biopsy confirmation in our study could lead to a degree of diagnostic uncertainty. Finally, the cross-sectional nature of our study, though capable of identifying patients at fibrosis risk, does not provide prognostic data on the time course of fibrosis progression. Additionally, our ML model, while showing strong performance, was not externally validated by other centers. Despite these limitations, our study validated the potential of radiomics-based ML models in predicting hepatic fibrosis risk in NAFLD and T2DM patients. Future research should involve multi-center, prospective studies with larger sample sizes, integrating inter-rater reliability tests to enhance the reliability and applicability of the model. Such studies could provide deeper insights into the progression of hepatic fibrosis and refine the predictive capabilities of ML models, ultimately aiding in the development of more effective diagnostic and therapeutic strategies for this patient population.
In conclusion, the conducted evaluation revealed that the SVM, utilizing radiomics from SWE and grayscale liver images, emerged as the superior ML model for predicting fibrosis progression risk in patients with T2DM and NAFLD. As an innovative approach in combining multimodal ultrasound radiomics with ML, our developed SVM model, with ongoing refinements, holds the promise of quantifying fibrosis progression risk more accurately. Such a development is anticipated to improve patient compliance with long-term lifestyle modifications and aid in optimizing treatment plans more effectively.
Abbreviations
ALB, Albumin; ALT, Alanine Aminotransferase ratio; AST, Aspartate Aminotransferase; AUC, Area Under the Curve; BMI, Body Mass Index; DCA, Decision Curve Analysis; FBG, Fasting Blood Glucose; GLCM, Gray-Level Co-Occurrence Matrix; GLDM, Gray-Level Dependence Matrix; GLRLM, Gray-Level Run Length Matrix; GLSZM, Gray-Level Size Zone Matrix; GS, Grayscale; HbA1c, Hemoglobin A1c; HDL-C, High Density Lipoprotein Cholesterol; HOMA-IR, Homeostasis Model Assessment of Insulin Resistance; LDL-C, Low Density Lipoprotein Cholesterol; Logit, Logistic Regression; LSM, Liver Stiffness Measurement; ML, Machine Learning; NAFLD, Nonalcoholic Fatty Liver Disease; NGTDM, Neighbouring Grey Tone Difference Matrix; PLT, Platelet Counts; RF, Random Forests; ROC, Receiver Operating Characteristic; ROI, Region of Interest; SHAP, Shapley Additive Explanation; SVM, Support Vector Machine; SWE, Shear Wave Elastography; T2DM, Type 2 Diabetes Mellitus; TC, Total Cholesterol; XGBoost, Extreme Gradient Boosting.
Data Sharing Statement
All data generated or analyzed during this study are included in this article. Further enquiries can be directed to the corresponding author.
Ethical Approval
This study was approved by medical ethics committee of Xuan Cheng City Central Hospital (No. 2023027).
Informed Consent
Informed consent was waved owing to the retrospective nature of this research.
Author Contributions
All authors made a significant contribution to the work reported, whether that is in the conception, study design, execution, acquisition of data, analysis and interpretation, or in all these areas; took part in drafting, revising or critically reviewing the article; gave final approval of the version to be published; have agreed on the journal to which the article has been submitted; and agree to be accountable for all aspects of the work.
Funding
There is no funding to report.
Disclosure
The authors have no conflicts of interest to declare.
References
1. Ekstedt M, Hagström H, Nasr P, et al. Fibrosis stage is the strongest predictor for disease-specific mortality in NAFLD after up to 33 years of follow-up. Hepatology. 2015;61(5):1547–1554. doi:10.1002/hep.27368
2. Taylor RS, Taylor RJ, Bayliss S, et al. Association between fibrosis stage and outcomes of patients with nonalcoholic fatty liver disease: a systematic review and meta-analysis. Gastroenterology. 2020;158(6):1611–1625.e1612. doi:10.1053/j.gastro.2020.01.043
3. Hagström H, Nasr P, Ekstedt M, et al. Fibrosis stage but not NASH predicts mortality and time to development of severe liver disease in biopsy-proven NAFLD. J Hepatol. 2017;67(6):1265–1273. doi:10.1016/j.jhep.2017.07.027
4. Younossi ZM, Golabi P, de Avila L, et al. The global epidemiology of NAFLD and NASH in patients with type 2 diabetes: a systematic review and meta-analysis. J Hepatol. 2019;71(4):793–801. doi:10.1016/j.jhep.2019.06.021
5. Puchakayala BK, Verma S, Kanwar P, Hart J, Sanivarapu RR, Mohanty SR. Histopathological differences utilizing the nonalcoholic fatty liver disease activity score criteria in diabetic (type 2 diabetes mellitus) and non-diabetic patients with nonalcoholic fatty liver disease. World J Hepatol. 2015;7(25):2610–2618. doi:10.4254/wjh.v7.i25.2610
6. Bian H, Zhu X, Xia M, et al. Impact of type 2 diabetes on nonalcoholic steatohepatitis and advanced fibrosis in patients with nonalcoholic fatty liver disease. Endocr Pract. 2020;26(4):444–453. doi:10.4158/EP-2019-0342
7. Targher G, Corey KE, Byrne CD, Roden M. The complex link between NAFLD and type 2 diabetes mellitus — mechanisms and treatments. Nat Rev Gastroenterol Hepatol. 2021;18(9):599–612. doi:10.1038/s41575-021-00448-y
8. Wong VW, Wong GL, Choi PC, et al. Disease progression of non-alcoholic fatty liver disease: a prospective study with paired liver biopsies at 3 years. Gut. 2010;59(7):969–974. doi:10.1136/gut.2009.205088
9. Bedossa P, Patel K. Biopsy and noninvasive methods to assess progression of nonalcoholic fatty liver disease. Gastroenterology. 2016;150(8):1811–1822.e1814. doi:10.1053/j.gastro.2016.03.008
10. Campos-Murguía A, Ruiz-Margáin A, González-Regueiro JA, Macías-Rodríguez RU. Clinical assessment and management of liver fibrosis in non-alcoholic fatty liver disease. World J Gastroenterol. 2020;26(39):5919–5943. doi:10.3748/wjg.v26.i39.5919
11. Kaswala DH, Lai M, Afdhal NH. Fibrosis Assessment in Nonalcoholic Fatty Liver Disease (NAFLD) in 2016. Dig Dis Sci. 2016;61(5):1356–1364. doi:10.1007/s10620-016-4079-4
12. Barr RG, Wilson SR, Rubens D, Garcia-Tsao G, Ferraioli G. Update to the society of radiologists in ultrasound liver elastography consensus statement. Radiology. 2020;296(2):263–274. doi:10.1148/radiol.2020192437
13. Eddowes PJ, Sasso M, Allison M, et al. Accuracy of fibroscan controlled attenuation parameter and liver stiffness measurement in assessing steatosis and fibrosis in patients with nonalcoholic fatty liver disease. Gastroenterology. 2019;156(6):1717–1730. doi:10.1053/j.gastro.2019.01.042.
14. Siddiqui MS, Vuppalanchi R, Van Natta ML, et al. Vibration-controlled transient elastography to assess fibrosis and steatosis in patients with nonalcoholic fatty liver disease. Clin Gastroenterol Hepatol. 2019;17(1):156–163.e152. doi:10.1016/j.cgh.2018.04.043
15. Zhou Y-J, Ye F-Z, Li -Y-Y, et al. Individualized risk prediction of significant fibrosis in non-alcoholic fatty liver disease using a novel nomogram. United European Gastroenterol J. 2019;7(8):1124–1134. doi:10.1177/2050640619868352
16. Vilar-Gomez E, Yasells-Garcia A, Martinez-Perez Y, et al. Development and validation of a noninvasive prediction model for nonalcoholic steatohepatitis resolution after lifestyle intervention. Hepatology. 2016;63(6):1875–1887. doi:10.1002/hep.28484
17. Lambin P, Rios-Velazquez E, Leijenaar R, et al. Radiomics: extracting more information from medical images using advanced feature analysis. Eur J Cancer. 2012;48(4):441–446. doi:10.1016/j.ejca.2011.11.036
18. D’Souza JC, Sultan LR, Hunt SJ, et al. B-mode ultrasound for the assessment of hepatic fibrosis: a quantitative multiparametric analysis for a radiomics approach. Sci Rep. 2019;9(1):8708. doi:10.1038/s41598-019-45043-z
19. Sim KC, Kim MJ, Cho Y, et al. Diagnostic feasibility of magnetic resonance elastography radiomics analysis for the assessment of hepatic fibrosis in patients with nonalcoholic fatty liver disease. J Comput Assist Tomogr. 2022;46(4):505–513. doi:10.1097/rct.0000000000001308
20. Jiang T, Gradus JL, Rosellini AJ. Supervised machine learning: a brief primer. Behav Ther. 2020;51(5):675–687. doi:10.1016/j.beth.2020.05.002
21. Wong GL-H, Yuen P-C, Ma AJ, Chan AW-H, Leung HH-W, Wong VW-S. Artificial intelligence in prediction of non-alcoholic fatty liver disease and fibrosis. J Gastroenterol Hepatol. 2021;36(3):543–550. doi:10.1111/jgh.15385.
22. Association AD. 2. Classification and diagnosis of diabetes: standards of medical care in diabetes—2020. Diabetes Care. 2019;43(1):S14–S31. doi: 10.2337/dc20-S002
23. European Association for the Study of the Liver EAftSoD, European Association for the Study of Obesity. EASL-EASD-EASO clinical practice guidelines for the management of non-alcoholic fatty liver disease. Obesity Facts. 2016;9(2):65–90. doi: 10.1159/000443344
24. Chalasani N, Younossi Z, Lavine JE, et al. The diagnosis and management of non-alcoholic fatty liver disease: practice guideline by the American association for the study of liver diseases, American college of gastroenterology, and the American gastroenterological association. Am J Gastroenterol. 2012;107(6):811–826. doi:10.1038/ajg.2012.128
25. Tian J, Dong D, Liu Z, et al.. Radiomics in Medical Imaging—Detection, Extraction and Segmentation. In: Suzuki K, Chen Y, editors. Artificial Intelligence in Decision Support Systems for Diagnosis in Medical Imaging. Cham: Springer International Publishing; 2018:267–333.
26. Nohara Y, Matsumoto K, Soejima H, Nakashima N. Explanation of Machine Learning Models Using Improved Shapley Additive Explanation.
27. Singh S, Allen AM, Wang Z, Prokop LJ, Murad MH, Loomba R. Fibrosis progression in nonalcoholic fatty liver vs nonalcoholic steatohepatitis: a systematic review and meta-analysis of paired-biopsy studies. Clin Gastroenterol Hepatol. 2015;13(4):643–654. doi:10.1016/j.cgh.2014.04.014..
28. Lee HW, Wong GLH, Kwok R, et al. Serial transient elastography examinations to monitor patients with type 2 diabetes: a prospective cohort study. Hepatology. 2020;72(4):1230–1241. doi:10.1002/hep.31142
29. Xia J, Jin G, Hua Q, Cui S, Li J. Nomogram for quantitatively estimating the risk of fibrosis progression in type 2 diabetic patients with nonalcoholic fatty liver disease: a pilot study. Front Endocrinol. 2022;13:917304. doi:10.3389/fendo.2022.917304
30. Uddin S, Khan A, Hossain ME, Moni MA. Comparing different supervised machine learning algorithms for disease prediction. BMC Med Inform Decis Mak. 2019;19(1):281. doi:10.1186/s12911-019-1004-8
31. Nohara Y, Matsumoto K, Soejima H, Nakashima N. Explanation of machine learning models using shapley additive explanation and application for real data in hospital. Comput Methods Programs Biomed. 2022;214:106584. doi:10.1016/j.cmpb.2021.106584
32. Xue B, Li D, Lu C, et al. Use of machine learning to develop and evaluate models using preoperative and intraoperative data to identify risks of postoperative complications. JAMA Netw Open. 2021;4(3):e212240. doi:10.1001/jamanetworkopen.2021.2240
 © 2023 The Author(s). This work is published and licensed by Dove Medical Press Limited. The
full terms of this license are available at https://www.dovepress.com/terms
and incorporate the Creative Commons Attribution
- Non Commercial (unported, 3.0) License.
By accessing the work you hereby accept the Terms. Non-commercial uses of the work are permitted
without any further permission from Dove Medical Press Limited, provided the work is properly
attributed. For permission for commercial use of this work, please see paragraphs 4.2 and 5 of our Terms.
© 2023 The Author(s). This work is published and licensed by Dove Medical Press Limited. The
full terms of this license are available at https://www.dovepress.com/terms
and incorporate the Creative Commons Attribution
- Non Commercial (unported, 3.0) License.
By accessing the work you hereby accept the Terms. Non-commercial uses of the work are permitted
without any further permission from Dove Medical Press Limited, provided the work is properly
attributed. For permission for commercial use of this work, please see paragraphs 4.2 and 5 of our Terms.
Recommended articles
Machine Learning-Based Prediction of Subsequent Vascular Events After 6 Months in Chinese Patients with Minor Ischemic Stroke
Zhang R, Wang J
International Journal of General Medicine 2022, 15:3797-3808
Published Date: 7 April 2022
Risk Factors for Nonalcoholic Fatty Liver Disease in Postmenopausal Women with Type 2 Diabetes Mellitus and the Correlation with Bone Mineral Density at Different Locations
Du YJ, Liu NN, Zhong X, Pan TR
Diabetes, Metabolic Syndrome and Obesity 2022, 15:1925-1934
Published Date: 21 June 2022
A Cross-Sectional Study of the Correlation Between the Atherogenic Index of Plasma and Nonalcoholic Fatty Liver Disease in Patients with Type 2 Diabetes
Lin J, Li H, Wan Q
Diabetes, Metabolic Syndrome and Obesity 2022, 15:2227-2234
Published Date: 30 July 2022
Serum Cortistatin Level in Type 2 Diabetes Mellitus and Its Relationship with Nonalcoholic Fatty Liver Disease
Sun T, Wang C, Huo L, Wang Y, Liu K, Wei C, Zhao H, Chen S, Ren L
International Journal of General Medicine 2023, 16:631-639
Published Date: 21 February 2023
Development of Machine Learning Models for Predicting Osteoporosis in Patients with Type 2 Diabetes Mellitus—A Preliminary Study
Wu X, Zhai F, Chang A, Wei J, Guo Y, Zhang J
Diabetes, Metabolic Syndrome and Obesity 2023, 16:1987-2003
Published Date: 30 June 2023