
Back to Journals » Journal of Inflammation Research » Volume 18
The Value of Combined Detection of Systemic Inflammation Response Index and Prognostic Nutritional Index in Predicting Short-Term Prognosis of Myasthenia Gravis
Authors Chen T  , Chen H , Wen Y, Huang Y, Lin Z, Liang Q, Huang W
Received 24 June 2025
Accepted for publication 9 September 2025
Published 26 September 2025 Volume 2025:18 Pages 13319—13333
DOI https://doi.org/10.2147/JIR.S546111
Checked for plagiarism Yes
Review by Single anonymous peer review
Peer reviewer comments 2
Editor who approved publication: Dr Adam Bachstetter
Ting Chen, Hui Chen, Yishuang Wen, Yanzhen Huang, Ziqun Lin, Qing Liang, Wen Huang
Department of Neurology, the First Affiliated Hospital of Guangxi Medical University, Nanning, Guangxi, People’s Republic of China
Correspondence: Wen Huang, Department of Neurology, the First Affiliated Hospital of Guangxi Medical University, No. 6 Shuangyong Road, Nanning, Guangxi, 530021, People’s Republic of China, Tel +86-771-5356504, Email [email protected]
Purpose: Although systemic inflammation response index (SIRI) and prognostic nutritional index (PNI) are associated with prognosis in various diseases, their role in myasthenia gravis (MG) remains unclear. This study aims to evaluate the predictive value of SIRI combined with PNI for MG prognosis.
Methods: 260 MG patients were enrolled in this retrospective study and were categorized into clinical improvement and non-improvement groups based on changes in MG-ADL and QMG scores after 6 months’ treatment. Lymphocyte-to-monocyte ratio (LMR), platelet-to-lymphocyte ratio (PLR), neutrophil-to-lymphocyte ratio (NLR), SIRI and PNI were calculated from admission blood indices. Clinical differences between groups were compared. Logistic regression was used to identify independent predictors of clinical non-improvement. The ROC curve was utilized to assess the prognostic predictive value of SIRI, PNI, and their combination. Interaction effects and stratified analyses were used to explore the relationship between SIRI, PNI and MG prognosis across distinct subgroups.
Results: Patients without clinical improvement exhibited significantly elevated SIRI, NLR, and PLR, whereas LMR and PNI were reduced (p < 0.001). Multivariate logistic regression demonstrated that both SIRI and PNI significantly predicted clinical non-improvement (OR = 9.108, 95% CI: 3.412– 24.317, p < 0.001; OR = 0.695, 95% CI: 0.601– 0.804, p < 0.001). The area under the curve (AUC) of SIRI combined with PNI for predicting clinical non-improvement in MG was 0.928 (95% CI:0.896– 0.961, sensitivity: 0.873, specificity: 0.851), which is higher than SIRI (AUC: 0.841, 95% CI: 0.783– 0.899, sensitivity: 0.772, specificity: 0.845) and PNI (AUC: 0.822, 95% CI: 0.770– 0.875, sensitivity: 0.759, specificity: 0.740) alone. A statistically significant interaction was identified between SIRI and thymoma (p = 0.009).
Conclusion: SIRI and PNI are independently associated with MG prognosis, particularly in thymoma cases, where SIRI shows a stronger correlation. Furthermore, the combination of SIRI and PNI can serve as a valuable predictor of clinical non-improvement in MG.
Keywords: myasthenia gravis, systemic inflammation response index, prognostic nutritional index, prognosis
Introduction
Myasthenia gravis (MG) develops as an autoimmune condition caused by autoantibodies such as anti-acetylcholine receptor (AChR), muscle-specific kinase (MuSK), low-density lipoprotein receptor-related protein 4 (LRP4), titin and ryanodine receptor (RyR). Its core pathology lies in the dysfunction of neuromuscular junction (NMJ) signal transmission.1,2 Clinically, the disease is marked by skeletal muscle fatigability and fluctuating muscle weakness. In recent years, the introduction of targeted biologics, novel immunosuppressants, and other therapies has significantly improved patients’ quality of life. However, some individuals still experience adverse outcomes, including disease recurrence, myasthenic crisis, or treatment resistance. Current prognostic assessments in MG primarily rely on clinical classifications, antibody titer, and thymic pathology.3,4 Nevertheless, these indicators predominantly face limitations such as high costs and insufficient dynamic monitoring, which restrict their clinical utility. Therefore, it is crucial to search for practical and reproducible prognostic biomarkers.
The dysregulation of immune-inflammatory processes and metabolic homeostasis has been identified as a critical contributor to disease advancement in the pathophysiology of MG.5 Prognostic nutritional index (PNI) and systemic inflammatory markers, derived from blood routine and biochemical tests, have recently gained public interest due to their low cost and easy accessibility.6
Commonly utilized systemic inflammatory indicators, such as the systemic inflammation response index (SIRI), lymphocyte-to-monocyte ratio (LMR), platelet-to-lymphocyte ratio (PLR), and neutrophil-to-lymphocyte ratio (NLR), have been applied to assess the severity and prognosis of many diseases.6 Research showed that the NLR in patients with MG were markedly elevated compared to healthy individuals and was closely linked to the severity of MG.7–9 In addition, NLR could to some extent reflect the severity of the disease and short-term efficacy in children with MG.10 SIRI, as a novel inflammation index based on NLR, can comprehensively reflect the dynamic balance of pro-inflammatory and anti-inflammatory immune states in the body by integrating neutrophil, lymphocyte, and monocyte counts. Earlier studies confirmed that SIRI was related to the severity of MG independently.11 PNI, as a indicator for assessing both nutritional balance and immunological function, was mainly employed to predict the prognosis of multiple cancers.12,13 Interestingly, recent studies have found that it was related to the activity of systemic lupus erythematosus (SLE), as well as rheumatoid arthritis (RA),14,15 but there was no literature to clarify the role of PNI in MG. The relationship between SIRI, PNI and prognosis of MG remains unclear.
Therefore, this study conducted a retrospective cohort analysis to explore the association between SIRI, PNI and poor prognosis in patients with MG, and evaluated their predictive efficacy, in order to provide clinical doctors with a simple risk warning tool and theoretical basis for optimizing MG management strategies.
Materials and Methods
Patients
We initially included 347 patients diagnosed with MG in the Neurology Department of the First Affiliated Hospital of Guangxi Medical University from January 2020 to October 2024. All patients were diagnosed according to the Chinese Guidelines for Diagnosis and Treatment of MG (2020), which met the following criteria: (1) classic clinical symptoms of MG (variable muscular weakness), (2) at least one of the following three points: positive neostigmine test, Electrophysiological manifestations of attenuated compound muscle action potential amplitude in response to low-frequency repetitive electrical stimulation of the nerve or positive serum antibodies such as AChR-Ab, (3) exclusion of other diseases. Participants were excluded based on the following criteria: (1) complicated with severe cardiovascular, hepatic, or renal disorders, (2) complicated with severe infections such as pneumonia or urinary tract infections, (3) complicated with other autoimmune diseases defined by the Global Autoimmune Institute (GAI), (4) complicated with malignant tumors other than thymoma, (5) patients with missing data. Ultimately, 260 MG patients were included after applying the above criteria (Figure 1).
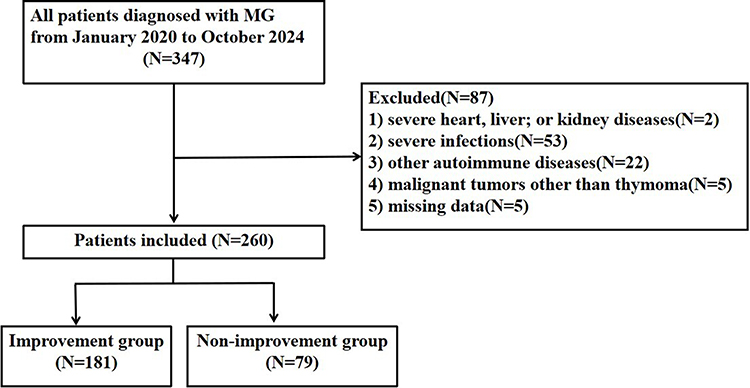 |
Figure 1 Flowchart of depicting subject enrollment for this study. Abbreviations: MG, myasthenia gravis. |
Data Collection
We collected the clinical data from hospital information system, including demographic characteristics (sex, age, disease duration), clinical symptoms, comorbidities (hypertension, diabetes, thymoma, history of thymoma surgery), disease severity, history of MG medication, MG activities of daily living (MG-ADL) and the Quantitative MG (QMG) score at baseline and after 6 months treatment, blood test data (blood routine, biochemical tests, antibody types), and subsequent treatment methods (cholinesterase inhibitors, corticosteroids, intravenous immunoglobulin, immunosuppressants, plasma exchange, targeted biologics). Follow-up data were obtained through annual outpatient interviews after 6 months of treatment.
Fasting venous blood samples for blood routine and biochemical tests were obtained on the morning following admission. Leukocyte counts, neutrophil counts, platelet counts, lymphocyte counts, monocyte counts and albumin level were recorded, and SIRI, PLR, NLR, LMR, PNI were calculated.
Definition
Based on the Myasthenia Gravis Foundation of America (MGFA) clinical classification, disease severity upon admission was categorized as mild (MGFA grades I and II) or moderate to severe (MGFA grades III, IV, and V).
The short-term outcome was assessed based on changes in the MG-ADL score and QMGS after 6 months of treatment. In this study, clinical improvement was defined as a decrease of ≥2 points in the MG-ADL score and a decrease of ≥3 points in the QMGS; otherwise, the outcome was classified as clinical non-improvement.16,17
SIRI was calculated by (monocytes × neutrophils) / lymphocytes, PLR was defined as platelet count divided by lymphocyte count, NLR represented the proportion of neutrophils to lymphocytes, LMR was derived from the ratio of lymphocyte count to monocyte count, and PNI was determined by applying the formula: PNI = albumin (g/L) + 5 × lymphocyte count.
Statistical Analysis
To evaluate the distributional characteristics of continuous variables, the Shapiro–Wilk test was employed. Continuous variables following a normal distribution were reported as mean with standard deviation (SD), whereas those with non-normal distributions were summarized as median (Q25, Q75). Continuous variables with a normal distribution were analyzed using independent groups t-test for group comparisons, while non-normally data were evaluated through Mann–Whitney U-test. Categorical variables were expressed as frequency counts and percentages (n[%]), and their distribution patterns between groups were assessed via Pearson’s chi-square test. To assess factors associated with poor prognosis, a logistic regression model was constructed with poor outcome as the response variable. Covariates included sex, age, hypertension, diabetes, thymus abnormalities, thymectomy history, disease duration, MGFA classification, involved muscle groups (ocular, pharyngeal, limb, respiratory), history of MG medication, serum antibodies, leukocytes, neutrophils, lymphocytes, platelets, monocytes, albumin, SIRI, NLR, PLR, LMR, PNI, and subsequent treatment methods (cholinesterase inhibitors, immunosuppressants, corticosteroids, plasma exchange, targeted biologic, intravenous immunoglobulin). Univariate logistic regression models first evaluated the independent associations of SIRI, PNI, and other covariates with poor recovery. Subsequently, multivariate logistic regression analyses specifically examined the independent effects of SIRI and PNI on poor outcomes. To verify result robustness, adjusted models incorporating multiple confounders were implemented to assess the stability of relationships between SIRI and PNI and poor recovery. ROC curve analysis was employed to assess the prognostic utility of SIRI, PNI, and their combined model in MG patients. Optimal cut-off point for SIRI and PNI were identified by the maximum Youden index when we plotted the ROC curves. The predictive performance of each index was assessed through quantification of multiple metrics such as area under the curve (AUC), true positive rate, and true negative rate. Finally, we classified the variables into different categories and conducted analyses for subgroups and interactions. Statistical analyses were conducted using SPSS 27.0 and GraphPad Prism 10.4.2 with significance defined as p < 0.05.
Results
Demographic and Clinical Characteristics of Enrolled Patients
This retrospective analysis enrolled 260 MG patients categorized into clinical improvement (n = 181) and non-improvement (n = 79) groups. The cohort demonstrated comparable baseline characteristics with median ages of 48.0 (IQR 36.5, 58.0) and 51.0 (IQR 37.0, 65.0) years in respective groups, along with similar gender distributions (72 males [39.8%] vs 29 males [36.7%]). Compared with the clinical improvement group, patients in the non-improvement group exhibited significantly longer disease duration (p < 0.001), higher rate of merging hypertension (p = 0.011) and diabetes (p < 0.001). Limb muscle involvement and respiratory muscle involvement were significant (p = 0.022, p = 0.008, respectively) associated with clinical improvement compared to cases without such manifestations. Moreover, a statistically significant positive correlation was identified between higher MGFA classification distributions and poor clinical outcomes (p = 0.009), with Figure 2 illustrating the stratified distribution patterns across study groups through a stacked bar chart representation. Hematological and biochemical analyses revealed that patients without clinical improvement exhibited significantly elevated leukocyte counts, platelet counts, neutrophil counts, SIRI, NLR, and PLR compared to those with clinical improvement (p < 0.05). Conversely, this group demonstrated markedly reduced lymphocyte counts, serum albumin levels, LMR, and PNI (p < 0.001), as shown in Figure 3. However, no statistically significant variations were noted between the cohorts regarding sex, age, thymoma, prior thymoma surgery, previous MG medication use, serum antibody profiles, or monocyte counts. Furthermore, subsequent treatment methods demonstrated comparable profiles across both groups, with the exception of intravenous immunoglobulin administration (Table 1).
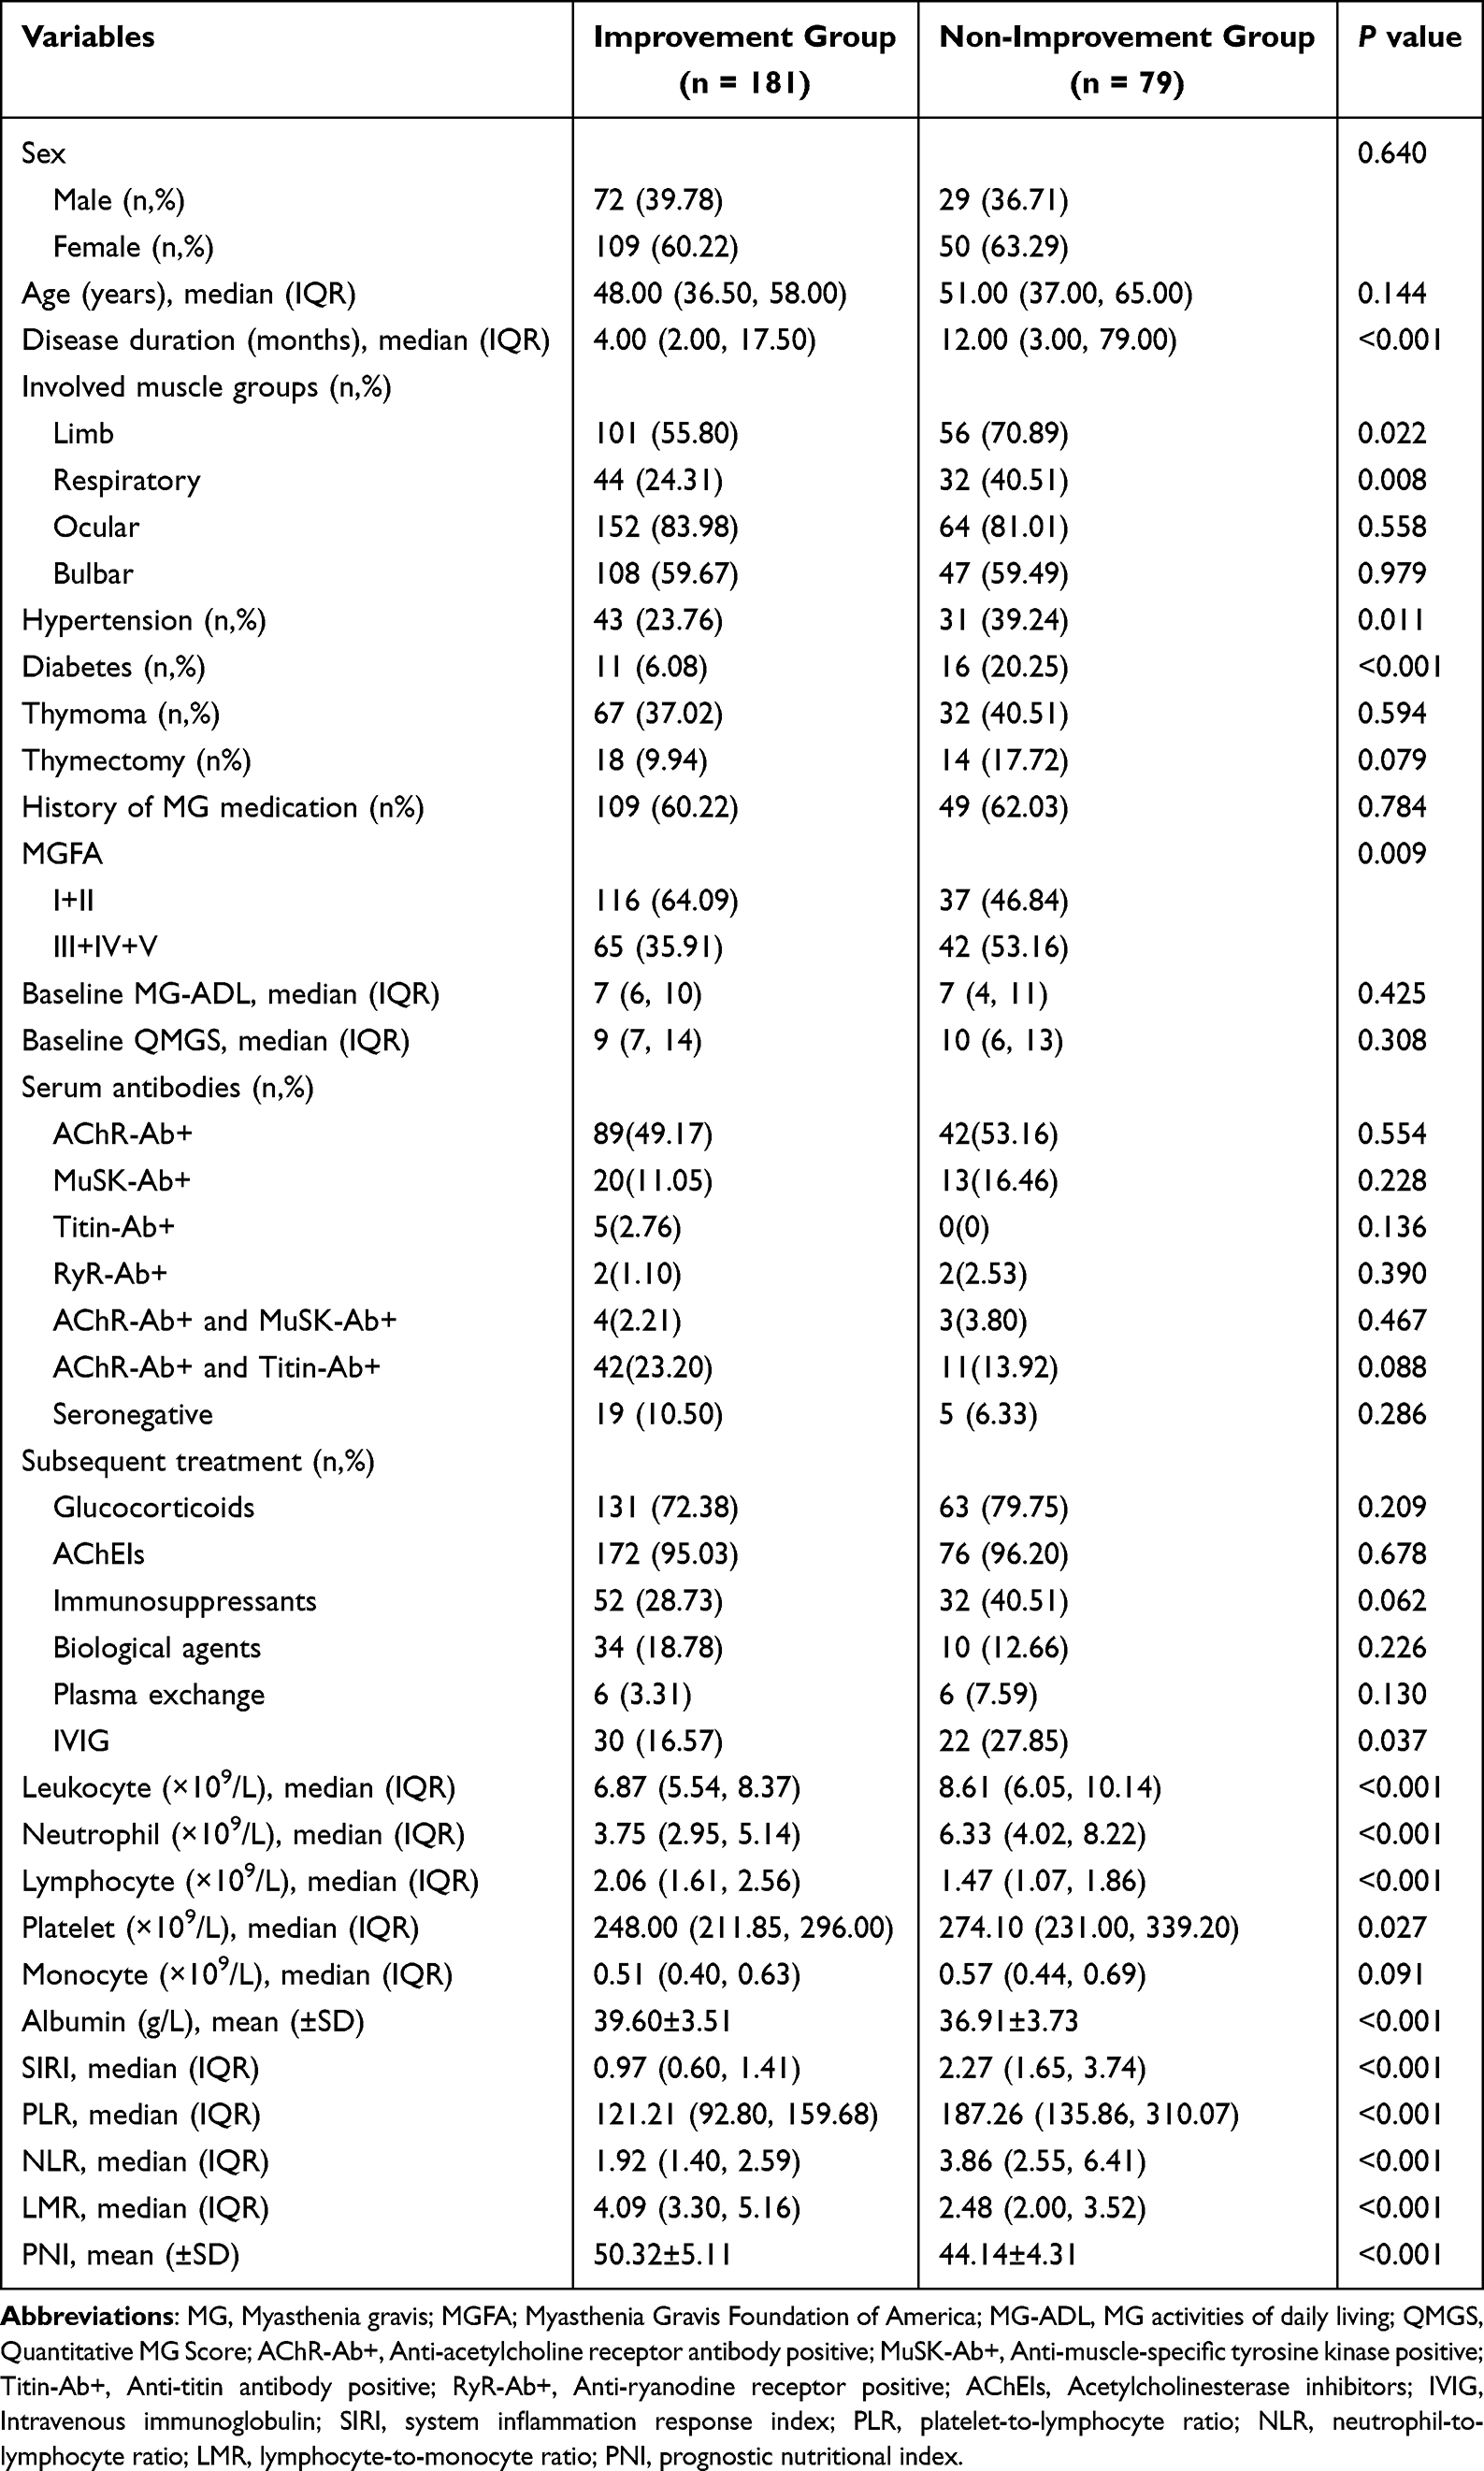 |
Table 1 Baseline Characteristics of the Clinical Improvement and Non-Improvement Groups |
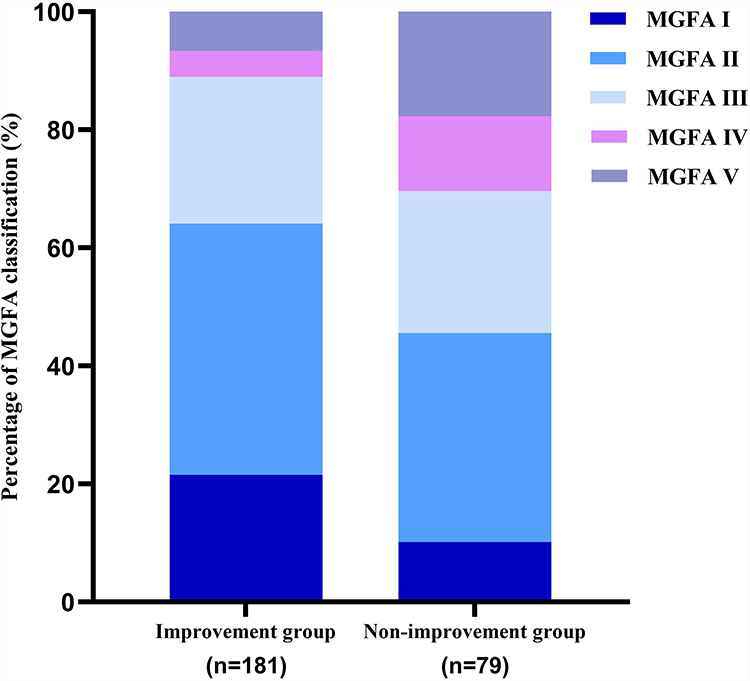 |
Figure 2 Stacked bar chart of MGFA distribution in patients with clinical improvement and non-improvement. Abbreviations: MGFA, Myasthenia Gravis Foundation of America. |
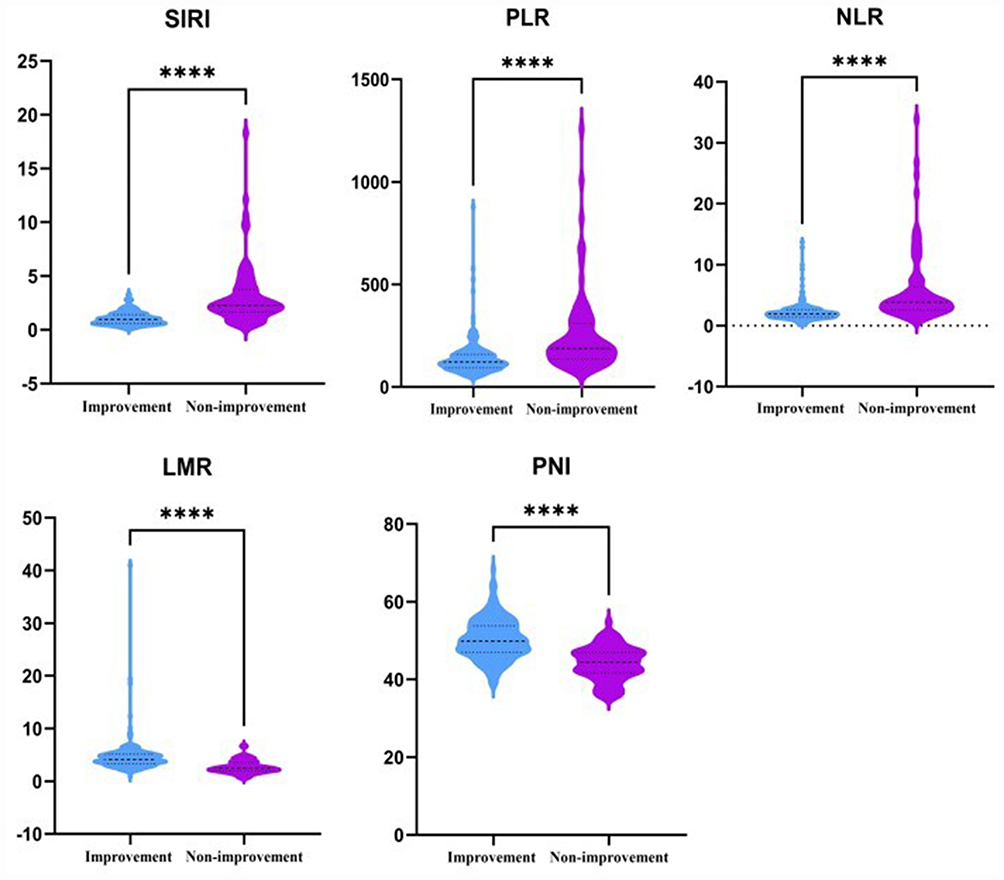 |
Figure 3 The violin plot of the distribution of SIRI, PLR, NLR, LMR and PNI among different prognosis groups. Abbreviations: SIRI, system inflammation response index; PLR, platelet-to-lymphocyte ratio; NLR, neutrophil-to-lymphocyte ratio; LMR, lymphocyte-to-monocyte ratio; PNI, prognostic nutritional index. Note: ****p < 0.001. |
Association of SIRI and PNI with Short-Term Prognosis of MG
To explore the potential determinants affecting the prognosis of MG, we conducted a univariate analysis, which revealed that SIRI (OR = 4.818, 95% CI: 3.098–7.495, p < 0.001), PLR (OR = 1.008, 95% CI: 1.005–1.011, p < 0.001), NLR (OR = 1.578, 95% CI: 1.329–1.874, p < 0.001), LMR (OR = 0.354, 95% CI: 0.262–0.476, p < 0.001), PNI (OR = 0.748, 95% CI: 0.690–0.811, p < 0.001) were significantly associated with clinical non-improvement. Furthermore, the disease duration, limb muscle involvement, respiratory muscle involvement, hypertension, diabetes, MGFA classification, leukocyte counts, neutrophil counts, lymphocyte counts, platelet counts, monocyte counts, and albumin level significantly impacted the poor clinical outcome of MG. However, other variables such as thymoma, history of thymoma surgery, history of MG medication, and the present of serum antibody did not demonstrate significant associations with clinical non-improvement (p > 0.05), as detailed in Table 2.
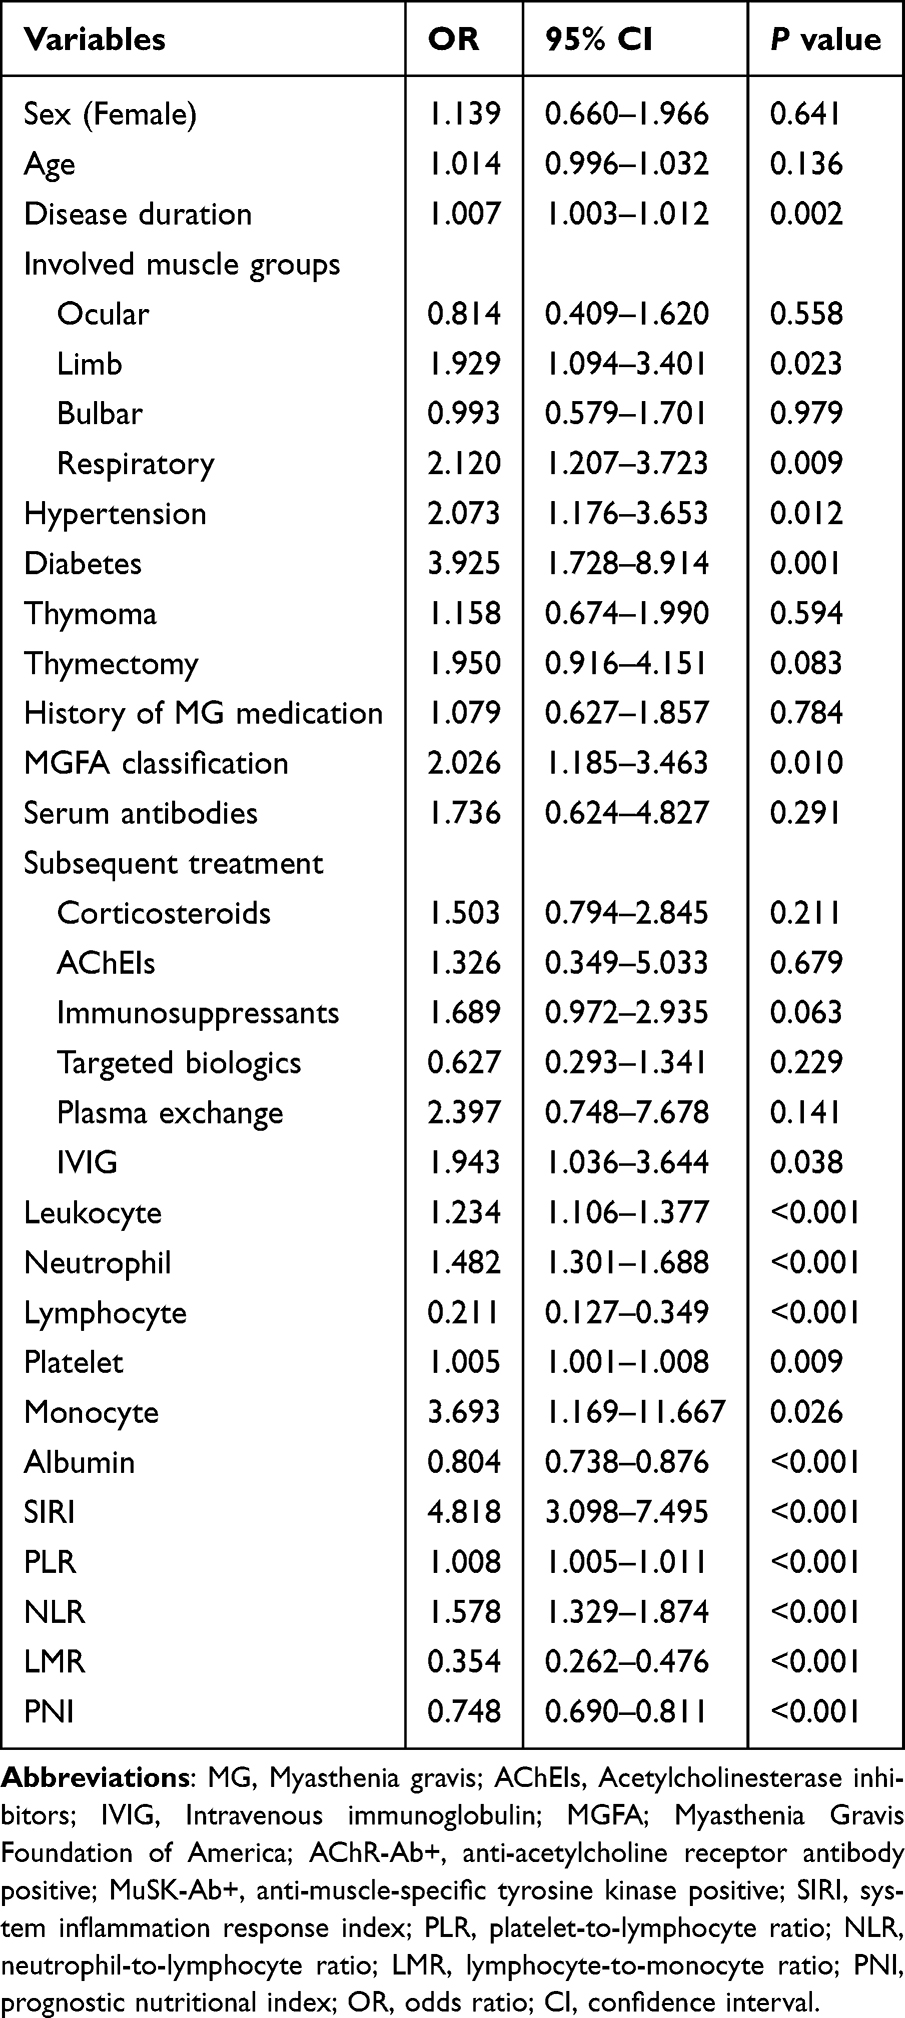 |
Table 2 Univariable Logistic Regression of Factors Associated with Clinical Non-Improvement in MG |
To further explore the correlation between SIRI, PNI, and clinical improvement, we used multiple logistic regression model, which include the statistically significant factors in univariate logistic regression and clinically relevant variables commonly used in practice. The basic model included SIRI, NLR, PLR, LMR, and PNI, and the results demonstrated the impact of SIRI (OR = 7.994, 95% CI: 3.469–18.421, p < 0.001) and PNI (OR = 0.695, 95% CI: 0.612–0.790, p < 0.001) on the poor recovery of MG statistically significant. Model 2 was adjusted based on sex, age, disease duration, MGFA classification, and the presence of serum antibodies. After adjustment, SIRI (OR = 8.496, 95% CI: 3.573–20.203, p < 0.001) and PNI (OR = 0.708, 95% CI: 0.621–0.807, p < 0.001) were still significantly correlated with clinical non-improvement. Model 3 further adjusted for diabetes, hypertension, history of MG medication and subsequent treatment regimens. Based on the model 3, SIRI (OR = 9.108, 95% CI: 3.412–24.317, p < 0.001) and PNI (OR = 0.695, 95% CI: 0.601–0.804, p < 0.001) were found to be independent predictors for predicting clinical non-improvement in MG (Table 3). Therefore, SIRI and PNI were independently correlated with MG prognosis.
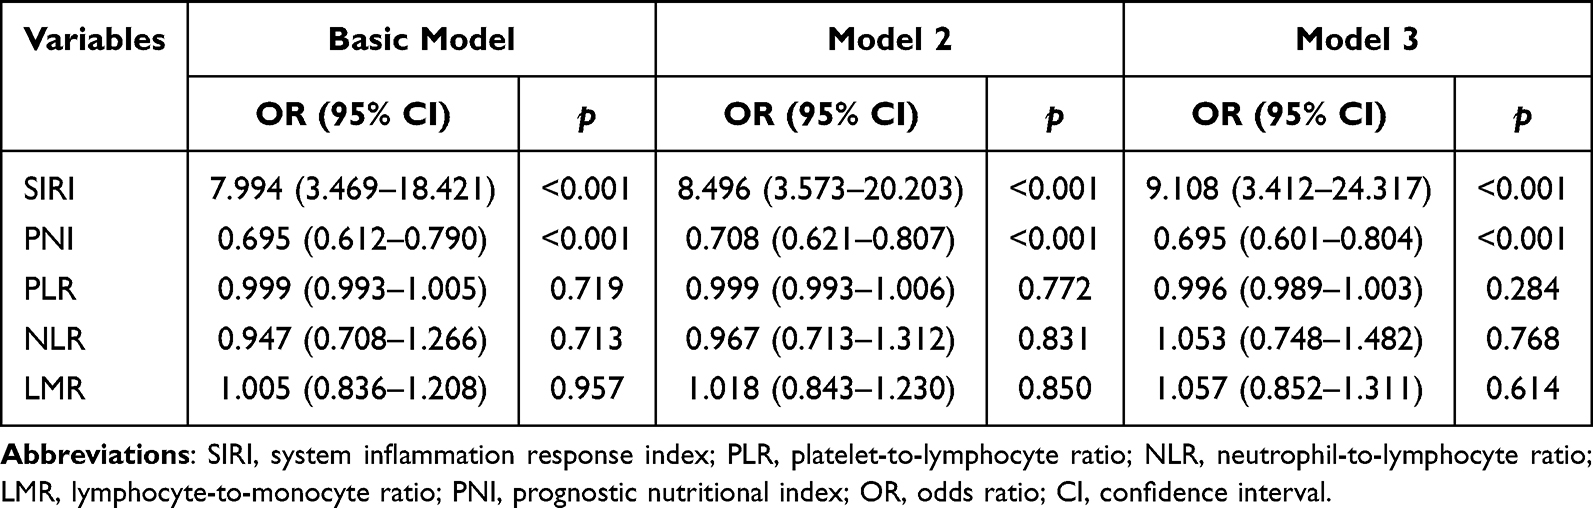 |
Table 3 Adjusted Logistic Regression Models for the Association of SIRI and PNI with Clinical Non-Improvement in MG |
Predictive Value of SIRI, PNI and Their Combined Model for Clinical Non-Improvement in MG
According to the ROC curve analysis, the SIRI demonstrated an AUC of 0.841 (95% CI: 0.783–0.899, p < 0.001) for predicting clinical non-improvement in MG, with an optimal cut-off value of 1.62, yielding a sensitivity of 0.772 and specificity of 0.845. Similarly, the PNI showed an AUC of 0.822 (95% CI: 0.770–0.875, p < 0.001) for prognostic prediction, achieving a sensitivity of 0.759 and specificity of 0.740 at its optimal cut-off value of 47.1. Notably, the combined detection of SIRI and PNI significantly improved predictive performance, attaining an AUC of 0.928 (95% CI: 0.896–0.961, p < 0.001) with a sensitivity of 0.873 and a specificity of 0.851 (Table 4, Figure 4), indicating its superior predictive value in identifying adverse outcomes in MG.
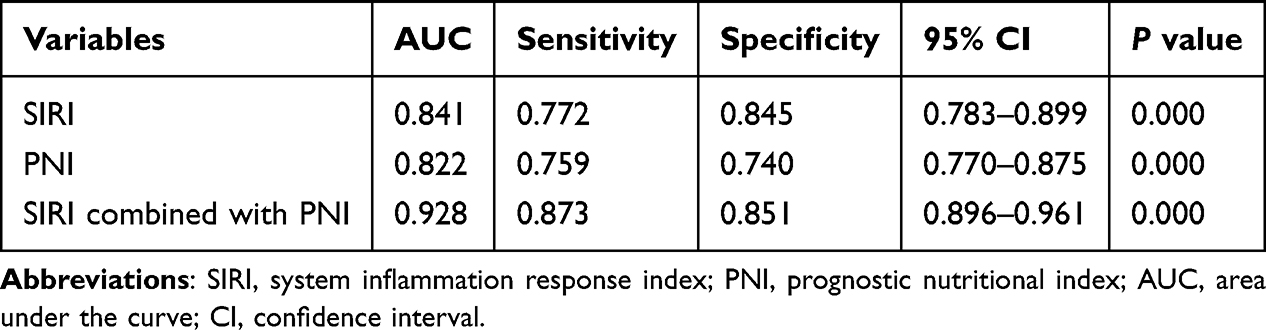 |
Table 4 The Predictive Value of SIRI, PNI and Their Combination for Clinical Non-Improvement in MG |
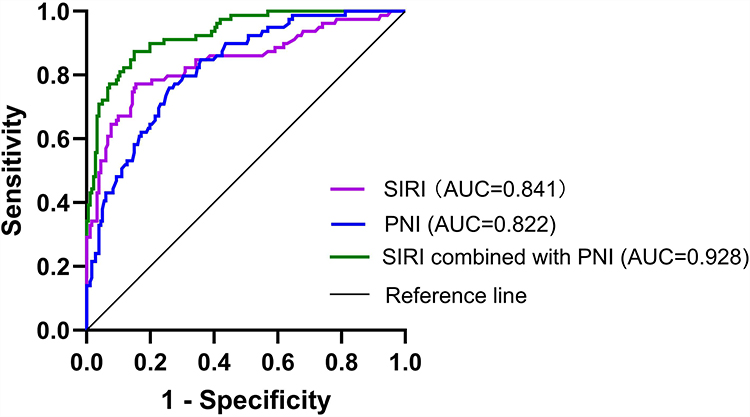 |
Figure 4 ROC curve of SIRI, PNI, and their their combination for predicting clinical non-improvement in MG. Abbreviations: ROC, receiver-operator characteristic curve; AUC, area under curve; SIRI, system inflammation response index; PNI, prognostic nutritional index. |
Subgroup Analysis and Interaction Effects of Prognosis of MG
To investigate the influence of common clinical variables on associations between SIRI, PNI, and MG prognosis, we conducted subgroup and interaction analyses. Results demonstrated no statistically significant interactions of SIRI and PNI with age, sex, antibody spectrum, hypertension, diabetes, bulbar weakness, medication history, subsequent treatment regimens or MGFA classification (all p > 0.05). Notably, a significant interaction emerged between SIRI and thymoma (p = 0.009), whereas no such interaction was observed for PNI, as detailed in Tables 5 and 6. These findings indicate consistent prognostic relationships across most clinical subgroups, reinforcing the robustness of our conclusions.
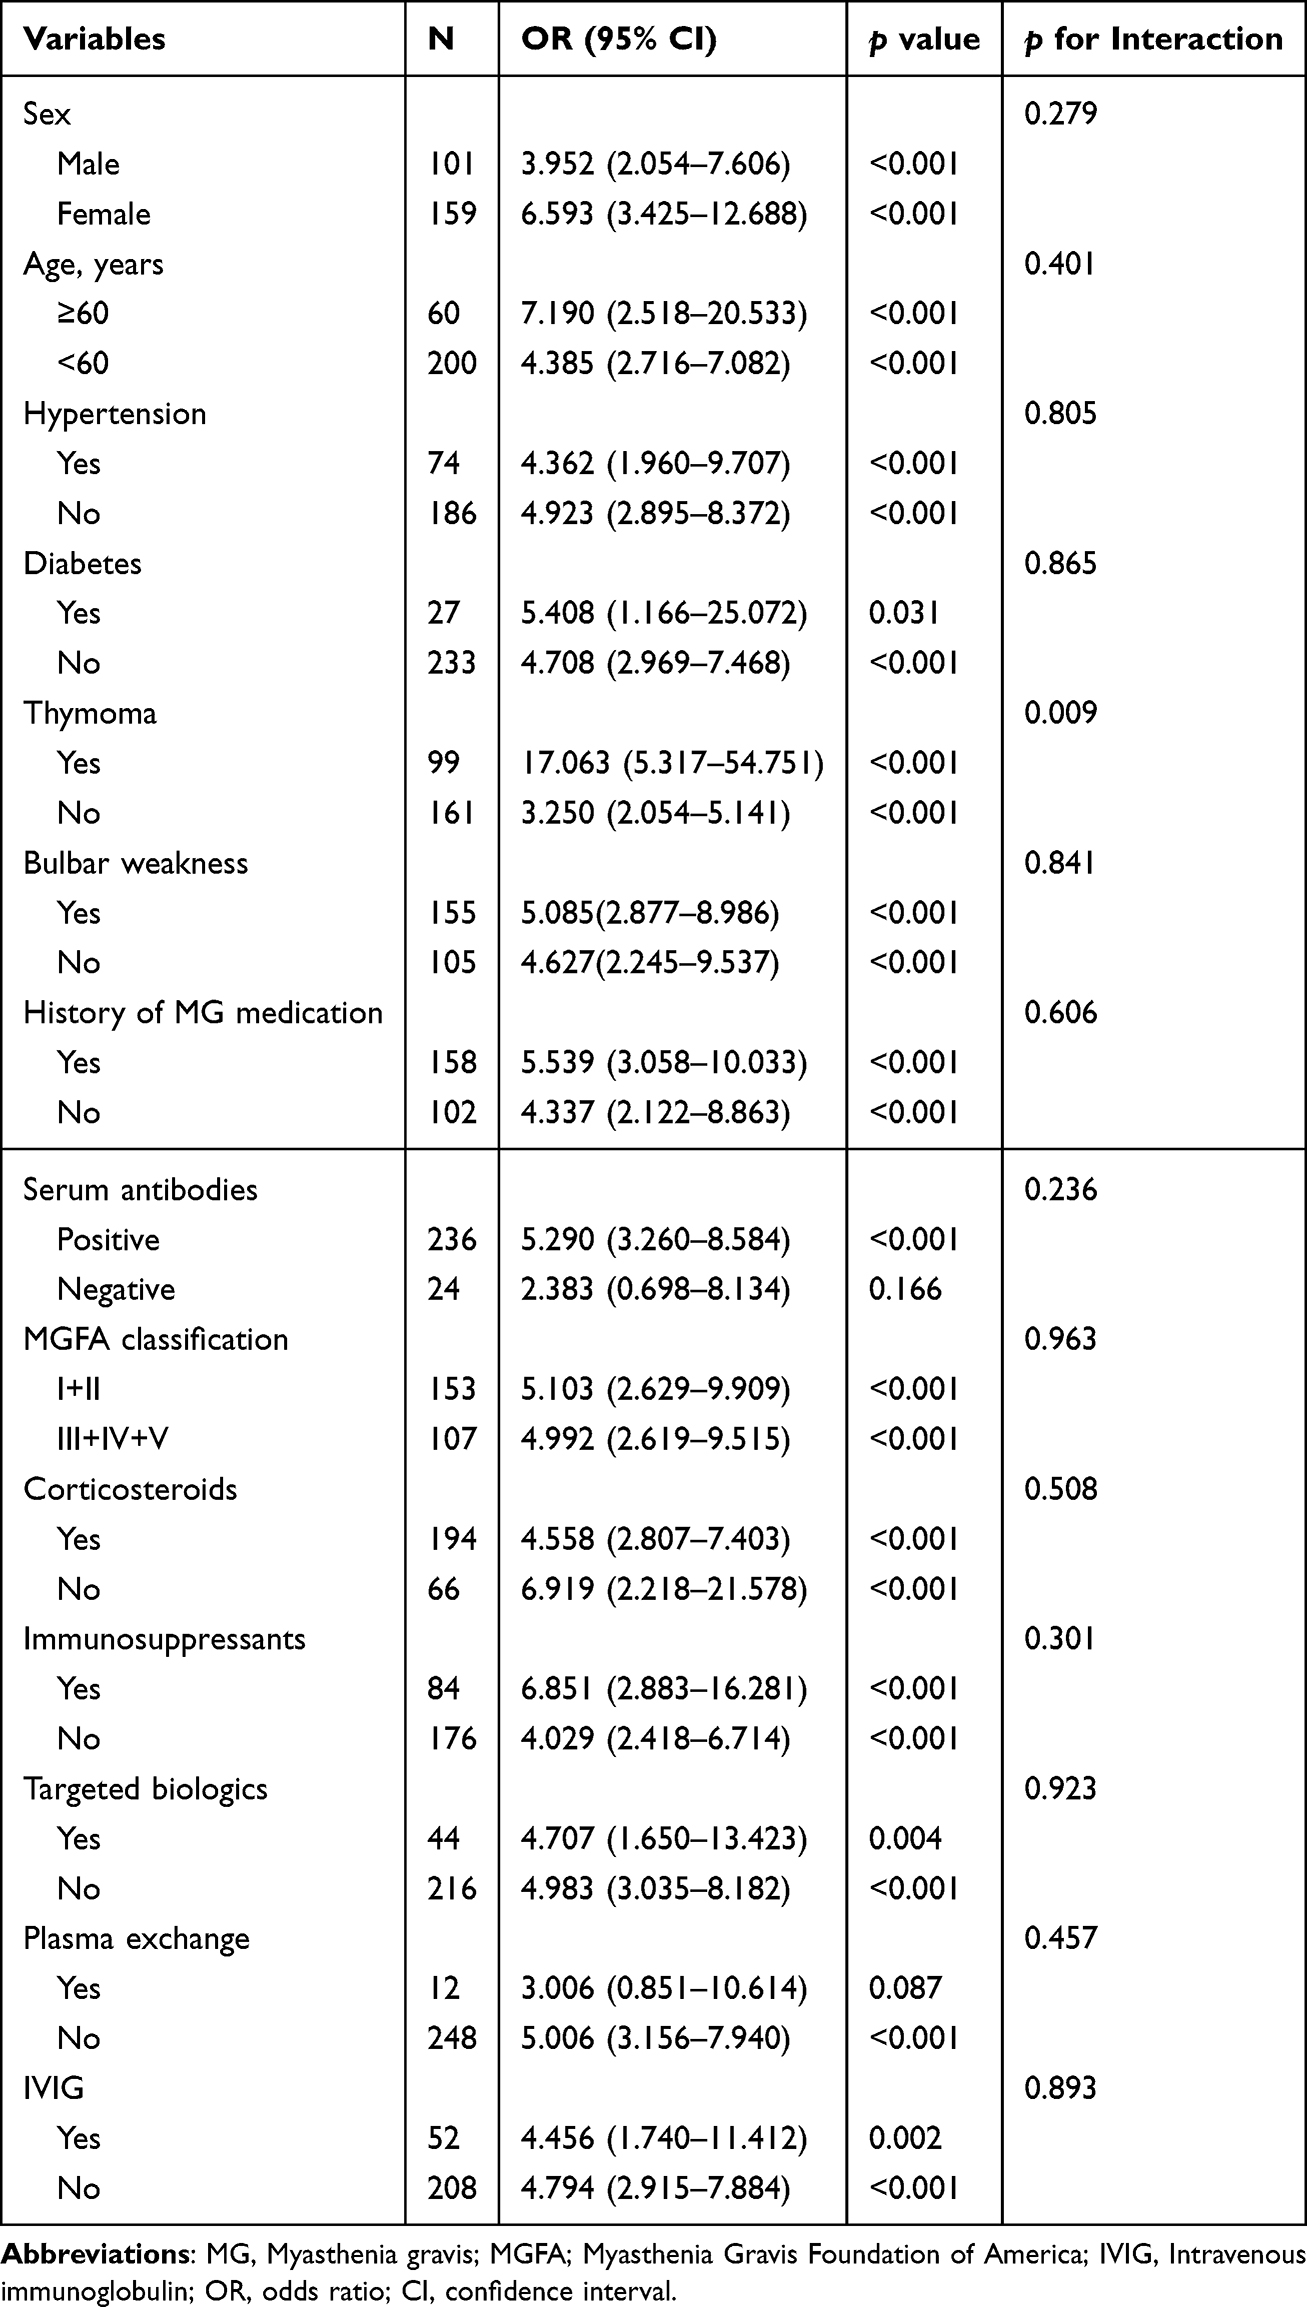 |
Table 5 Impact of Clinical Variables on the Relationship Between SIRI and Clinical Non-Improvement in MG |
 |
Table 6 Impact of Clinical Variables on the Relationship Between PNI and Clinical Non-Improvement in MG |
Subgroup analysis revealed that patients with thymoma (OR = 17.063, 95% CI: 5.317–54.751, p < 0.001) faced an elevated risk of clinical non-improvement with increasing SIRI levels compared to those without thymoma (OR = 3,250, 95% CI: 2.054–5.141, p < 0.001)(Table 5).
Discussion
MG is an autoimmune disease involving multiple factors, and poor prognosis can seriously affect the quality of life of patients. Therefore, exploring predictive factors for poor prognosis of MG can provide timely intervention measures and help improve patient prognosis. Previous studies have mainly focused on investigating the relationship between NLR and SIRI and the severity of disease in MG patients, without exploring the role of SIRI and PNI in predicting the prognosis of MG. As far as we are aware, this study represents the first investigation to combine SIRI and PNI for prognostic assessment in MG. We found that in MG patients without clinical improvement, SIRI increased and PNI decreased. ROC curve analysis showed that SIRI and PNI had good predictive value for clinical non-improvement in MG, and the combination of the two further improved the accuracy of identifying adverse outcomes.
Multiple studies have shown that inflammation is involved in the immunopathological process of MG.5,18 Neutrophils are the source of self antigens in many autoimmune diseases19 and play a crucial role in the pathogenesis of various diseases.20,21 On the one hand, they directly damage the NMJ by releasing reactive oxygen species (ROS) and matrix metalloproteinases (MMPs),22,23 on the other hand, they expose their own antigens by forming neutrophil extracellular traps (NETs), thereby activating B cells to produce pathogenic autoantibodies.24 A study demonstrated that plasma levels of MMP-9 are elevated in MG patients, whereas levels of MMP-2 and tissue inhibitor of metalloproteinase-1 (TIMP-1) are lowered. Notably, the plasma concentration of MMP-2 was found to be positively correlated with disease severity.25 These findings suggest that MMPs and TIMPs may contribute to MG pathogenesis and might be associated with the risk of clinical deterioration, further highlighting the involvement of inflammation in the development of MG. Research has shown that there are infiltrating monocytes at the NMJ of MG,26 which exhibit a higher inflammatory activation state during MG crisis.27 Monocytes can secrete various cytokines, exacerbating inflammatory damage at the NMJ. They can also act as antigen-presenting cells, activating T cell-mediated immune responses and affecting the transmission of nerve impulses. Emerging evidence found notable alterations in lymphocyte subpopulations among MG patients,28 coupled with the detection of elevated free light chain (FLC) levels,29 which is a key biomarker reflecting B-cell activation. These immunological findings collectively underscore the pivotal involvement of lymphocyte dysregulation in MG pathogenesis.
Our study found an increase in leukocytes, neutrophils, monocytes, platelets, NLR, and PLR in the MG group without clinical improvement, while a decrease was observed in LMR; which is consistent with previous research results.6,10 SIRI, a recently developed inflammatory biomarker derived from neutrophils, monocytes, and lymphocytes in peripheral blood, has been utilized as a prognostic indicator for multiple disease conditions. Research showed that SIRI was significantly increased in pregnant women with SLE who had a poor prognosis,30 Additionally, SIRI demonstrated a nonlinear positive association with both all-cause and cardiovascular mortality in patients with RA.31 Furthermore, it could serve as a reliable indicator for predicting disease activity in MS and NMOSD.32 The findings of the current investigation were similar to previous researches. Multiple logistic regression analysis showed that SIRI was an important independent predictor of clinical non-improvement in MG (p < 0.05).
Serum albumin serves as a crucial biomarker for assessing nutritional status, immune function, and postoperative risk. Inflammatory conditions can diminish albumin levels through dual mechanisms: suppressing hepatic production while accelerating its breakdown. Research found that elevated globulin33 and decreased albumin levels34 in patients with MG upon admission were risk factors for poor prognosis. Besides, elevated serum albumin concentrations demonstrated a positive correlation with immunotherapy efficacy in NMOSD patients.35 PNI is a comprehensive indicator calculated based on serum albumin concentration and circulating lymphocyte levels in peripheral blood, serving as a clinical assessment tool for monitoring both nutritional conditions and immunological function in patients. Previous studies have shown that during active disease phases, patients with SLE and RA exhibit lower PNI levels compared to inactive phases.36,37 Furthermore, in middle-aged and elderly populations, PNI demonstrates an inverse association with all-cause mortality among RA patients.38 However, there is currently no research on the correlation between PNI and MG. Our study found that decreased PNI significantly elevates the risk of clinical non-improvement in patients with MG (p < 0.05). The speculated reason is that MG patients with lower PNI usually indicate malnutrition and immune dysfunction, which may exacerbate the imbalance of autoimmune response, increase the risk of infection, and affect the effectiveness of treatments such as immunosuppressants, leading to poorer clinical outcomes.
SIRI reflects the activation status of systemic inflammation, while PNI evaluates nutritional metabolism and immune repair ability, which cover key stages of disease progression from inflammation damage and tissue repair respectively. Due to inflammation accelerating protein breakdown and malnutrition exacerbating immune dysfunction, we consider that the prognosis of MG may be driven by a dual pathway of “inflammation nutrient imbalance”. Therefore, based on the foundational assumption that both biomarkers serve as independent predictors for MG, we developed a novel composite prognostic index incorporating SIRI and PNI to assess adverse clinical outcomes in MG patients. The subsequent ROC analysis revealed novel insights into the predictive capacity based on AUC values. Our study demonstrated that SIRI, PNI, and their combined application showed progressively improved predictive efficacy for clinical non-improvement in MG, with corresponding AUC values of 0.841, 0.822, and 0.928. The results indicate that both SIRI and PNI have clinical value in predicting the prognosis of MG, and the predictive power of the combined indicators is even higher.
Research has shown that patients with MG exhibit a higher prevalence of comorbidities compared to the general population. Common comorbidities include hypertension, diabetes mellitus, neurological disease, thymoma, and autoimmune diseases.39 Our study demonstrated that the non-improved group had significantly higher rates of comorbid hypertension and diabetes than the improved group, suggesting that the presence of comorbidities frequently influences the prognosis of MG. Therefore, screening for hypertension, diabetes, and other comorbidities should be conducted regularly and routinely to detect these conditions early, in order to take specific treatment and prevention measures to improve the prognosis of MG patients. Patients with thymoma exhibited a significantly lower percentage of Breg cells compared to healthy controls.40,41 Previous research has demonstrated a strong correlation between thymoma and both increased severity and unfavorable long-term outcomes of MG.42 The results of this study showed that an increase in the SIRI was significantly associated with clinical non-improvement in MG, and the presence of thymoma significantly strengthened this association. The SIRI-related risk (OR = 17.063) in the combined thymoma group was much higher than that in the non-thymoma group (OR = 3.250), and the interaction test was significant (p = 0.009), indicating that thymoma had an effect-modifying function on the prognosis prediction of SIRI. We infer that the reason for the above results is that patients with thymoma often have more severe immune microenvironment disorders, and pro-inflammatory cytokines in the thymoma microenvironment may activate the autoimmune response, thereby amplifying the systemic inflammation reflected by SIRI and damaging the NMJ.
This study excluded patients with infectious diseases and autoimmune disorders, given that conditions such as pneumonia and hyperthyroidism are known to influence blood routine parameters. Corticosteroids and immunosuppressants are commonly used drugs for treating MG.43 Previous study has shown that immunosuppressants can significantly increase neutrophil counts while reducing lymphocyte numbers.44 Another study found that treatment with clinically appropriate doses of prednisone led to an increase in lymphocyte counts in patients with SLE.45 Therefore, we conducted subgroup analyses stratified by prior use of corticosteroids or immunosuppressants. The findings of this research demonstrated that elevated SIRI levels consistently correlated with poorer clinical outcomes in MG patients, irrespective of prior corticosteroid or immunosuppressant therapy (OR values were 5.008, 4.515, 18.062, 4.359, all p < 0.05). Although previous use of immunosuppressants or corticosteroids showed differential OR in the analysis, their interaction with SIRI did not demonstrate statistical significance (p > 0.05). This suggests that while numerical differences between groups were observed, the existing evidence does not sufficiently establish that prior corticosteroid or immunosuppressant therapy significantly modifies the association between SIRI and clinical prognosis. Similarly, the correlation between PNI and clinical non-improvement was not affected by the history of corticosteroids or immunosuppressant use. In addition, sex, age, hypertension, diabetes, antibodies, MGFA classification, and follow-up treatment methods had no significant interaction with SIRI and PNI (all p > 0.05), which further confirmed the stability of the negative correlation intensity between SIRI, PNI and MG prognosis.
Nevertheless, this study has certain limitations requiring acknowledgment.Firstly, as a single-center investigation, the findings may lack of broad representativeness. Secondly, the retrospective design may introduce selection and information biases. Thirdly, the laboratory parameters were collected at a single time point, which could not reflect the dynamic changes of inflammatory indicators. Therefore, prospective studies in multiple centers and dynamic monitoring of blood routine and serum albumin are needed to better evaluate the association of SIRI and PNI and the prognosis of MG.
Conclusion
Our research findings confirm that SIRI and PNI are independently associated with the short-term prognosis of MG, especially in patients with thymoma, where SIRI is more strongly correlated with MG. Both SIRI and PNI perform well in assessing unfavorable outcomes of MG, and their combination has a higher predictive power. The integration of SIRI and PNI parameters may offer a clinically useful approach for evaluating patient prognosis.
Data Sharing Statement
All data are available from the corresponding author upon reasonable request.
Ethics Approval and Informed Consent
Approval for the study was granted by the Ethics Committee of the First Affiliated Hospital of Guangxi Medical University (2025-E0463). All study procedures complied with the ethical standards of the Declaration of Helsink. Written informed consent was obtained from all enrolled participants before they participated in the study.
Acknowledgments
The authors sincerely express their gratitude to all participants and their families.
Funding
This study was supported by the Natural Science Foundation of Guangxi Province (CN) (2017GXNSFAA198042).
Disclosure
The authors report no conflicts of interest in this work.
References
1. Gilhus NE, Verschuuren JJ. Myasthenia gravis: subgroup classification and therapeutic strategies. Lancet Neurol. 2015;14(10):1023–1036. doi:10.1016/s1474-4422(15)00145-3
2. Gilhus NE, Tzartos S, Evoli A, Palace J, Burns TM, Verschuuren J. Myasthenia gravis. Nat Rev Dis Primers. 2019;5(1):30. doi:10.1038/s41572-019-0079-y
3. Vincent A. Using AChR antibody titres to predict treatment responses in myasthenia gravis. J Neurol Neurosurg Psychiatry. 2021;92(9):915. doi:10.1136/jnnp-2021-326480
4. Kuo CY, Su EC, Yeh HL, Yeh JH, Chiu HC, Chung CC. Predictive modeling and interpretative analysis of risks of instability in patients with myasthenia gravis requiring intensive care unit admission. Heliyon. 2024;10(24):e41084. doi:10.1016/j.heliyon.2024.e41084
5. Huda R. Inflammation and autoimmune myasthenia gravis. Front Immunol. 2023;14:1110499. doi:10.3389/fimmu.2023.1110499
6. Huang X, Xu M, Wang Y, et al. The systemic inflammation markers as possible indices for predicting respiratory failure and outcome in patients with myasthenia gravis. Ann Clin Transl Neurol. 2023;10(1):98–110. doi:10.1002/acn3.51706
7. Duan Z, Jia A, Cui W, Feng J. Correlation between neutrophil-to-lymphocyte ratio and severity of myasthenia gravis in adults: a retrospective study. J Clin Neurosci. 2022;106:117–121. doi:10.1016/j.jocn.2022.10.017
8. Weng Y, Zhu J, Li S, et al. Dynamic changes of peripheral inflammatory markers link with disease severity and predict short-term poor outcome of myasthenia gravis. J Neurochem. 2024;168(9):2751–2761. doi:10.1111/jnc.16138
9. Yang DH, Qian MZ, Wei MM, et al. The correlation of neutrophil-to-lymphocyte ratio with the presence and activity of myasthenia gravis. Oncotarget. 2017;8(44):76099–76107. doi:10.18632/oncotarget.18546
10. Jiang Z, Ning Z, Yang L, et al. The correlation of neutrophil-to-lymphocyte ratio with the presence and short-time curative effect of myasthenia gravis in children: a retrospectively study. Int J Neurosci. 2021;131(9):894–901. doi:10.1080/00207454.2020.1759592
11. Huang S, Wang Y, Zhu J, et al. Systemic inflammatory response index, a potential inflammatory biomarker in disease severity of Myasthenia gravis: a pilot retrospective study. J Inflamm Res. 2024;17:2563–2574. doi:10.2147/jir.S449324
12. Vaz J, Piver R, Brzezinska B, et al. Nutrition’s checkpoint inhibition: the impact of nutrition on immunotherapy outcomes. Gynecol Oncol. 2024;189:129–136. doi:10.1016/j.ygyno.2024.07.685
13. Tsukagoshi M, Araki K, Igarashi T, et al. Lower geriatric nutritional risk index and prognostic nutritional index predict postoperative prognosis in patients with hepatocellular carcinoma. Nutrients. 2024;16(7). doi:10.3390/nu16070940
14. Correa-Rodríguez M, Pocovi-Gerardino G, Callejas-Rubio JL, et al. The prognostic nutritional index and nutritional risk index are associated with disease activity in patients with systemic lupus erythematosus. Nutrients. 2019;11(3). doi:10.3390/nu11030638
15. Kılıç Ö, Tecer D, Canbaş M, Kaya MN, Çınar M, Yılmaz S. Immune nutrition indices are associated with disease activity in rheumatoid arthritis: a cross-sectional study. Biomarker Med. 2024;18(24):1093–1102. doi:10.1080/17520363.2024.2430942
16. Muppidi S, Wolfe GI, Conaway M, Burns TM. MG-ADL: still a relevant outcome measure. Muscle Nerve. 2011;44(5):727–731. doi:10.1002/mus.22140
17. Thomsen JLS, Andersen H. Outcome measures in clinical trials of patients with myasthenia gravis. Front Neurol. 2020;11:596382. doi:10.3389/fneur.2020.596382
18. Uzawa A, Kuwabara S, Suzuki S, et al. Roles of cytokines and T cells in the pathogenesis of myasthenia gravis. Clin Exp Immunol. 2021;203(3):366–374. doi:10.1111/cei.13546
19. Németh T, Mócsai A, Lowell CA. Neutrophils in animal models of autoimmune disease. Semin Immunol. 2016;28(2):174–186. doi:10.1016/j.smim.2016.04.001
20. Mantovani A, Cassatella MA, Costantini C, Jaillon S. Neutrophils in the activation and regulation of innate and adaptive immunity. Nat Rev Immunol. 2011;11(8):519–531. doi:10.1038/nri3024
21. Fu X, Liu H, Huang G, Dai SS. The emerging role of neutrophils in autoimmune-associated disorders: effector, predictor, and therapeutic targets. MedComm. 2021;2(3):402–413. doi:10.1002/mco2.69
22. Barbu E, Mihaila AC, Gan AM, et al. The elevated inflammatory status of neutrophils is related to in-hospital complications in patients with acute coronary syndrome and has important prognosis value for diabetic patients. Int J Mol Sci. 2024;25(10). doi:10.3390/ijms25105107
23. Helgeland G, Petzold A, Luckman SP, Gilhus NE, Plant GT, Romi FR. Matrix metalloproteinases in myasthenia gravis. Eur Neurol. 2011;65(1):53–58. doi:10.1159/000322737
24. Castanheira FVS, Kubes P. Neutrophils and NETs in modulating acute and chronic inflammation. Blood. 2019;133(20):2178–2185. doi:10.1182/blood-2018-11-844530
25. Di Stefano V, Tubiolo C, Gagliardo A, et al. Metalloproteinases and tissue inhibitors in generalized myasthenia gravis. A preliminary study. Brain Sci. 2022;12(11). doi:10.3390/brainsci12111439
26. Lefeuvre CM, Payet CA, Fayet OM, et al. Risk factors associated with myasthenia gravis in thymoma patients: the potential role of thymic germinal centers. J Autoimmun. 2020;106:102337. doi:10.1016/j.jaut.2019.102337
27. Zhong H, Huan X, Zhao R, et al. Peripheral immune landscape for hypercytokinemia in myasthenic crisis utilizing single-cell transcriptomics. J Transl Med. 2023;21(1):564. doi:10.1186/s12967-023-04421-y
28. Zhang Q, Bi Z, Yang M, Gui M, Bu B. Differences in immunophenotypes between myasthenia gravis patients with and without thyroid antibodies. Muscle Nerve. 2022;65(5):553–559. doi:10.1002/mus.27517
29. Gambino CM, Agnello L, Lo Sasso B, et al. The role of serum free light chain as biomarker of Myasthenia Gravis. Clin Chim Acta. 2022;528:29–33. doi:10.1016/j.cca.2022.01.004
30. Sahin R, Tanacan A, Serbetci H, et al. The role of first-trimester NLR (neutrophil to lymphocyte ratio), systemic immune-inflammation index (SII), and, systemic immune-response index (SIRI) in the prediction of composite adverse outcomes in pregnant women with systemic lupus erythematosus. J Reprod Immunol. 2023;158:103978. doi:10.1016/j.jri.2023.103978
31. Wang W, Yao W, Tang W, Li Y, Lv Q, Ding W. Systemic inflammation response index is associated with increased all-cause and cardiovascular mortality in US adults with rheumatoid arthritis. Prev Med. 2024;185:108055. doi:10.1016/j.ypmed.2024.108055
32. Li X, Jiang W, Li G, et al. Inflammatory and nutritional markers as indicators for diagnosing and assessing disease activity in MS and NMOSD. J Inflamm Res. 2024;17:10065–10078. doi:10.2147/jir.S489502
33. Jiang Z, Hu W, Ning Z, et al. Serum globulin in children with myasthenia gravis: predicting relapse and prognosis. Neurol Res. 2024;46(7):669–678. doi:10.1080/01616412.2024.2340883
34. Yoshimoto Y, Ishida S, Hosokawa T, Arawaka S. Assessment of clinical factors affecting outcome of myasthenia gravis. Muscle Nerve. 2021;64(1):90–94. doi:10.1002/mus.27247
35. Xiang W, Wu Y, Li H, et al. Serum albumin level can predict immunotherapy response of neuromyelitis optica spectrum disorders in the acute phase. J Inflamm Res. 2024;17:909–917. doi:10.2147/jir.S442532
36. Ahn SS, Yoo J, Jung SM, Song JJ, Park YB, Lee SW. Comparison of the clinical implications among five different nutritional indices in patients with lupus nephritis. Nutrients. 2019;11(7). doi:10.3390/nu11071456
37. Öz N, Gezer HH, Cilli Hayıroğlu S, Duruöz MT. Evaluation of the prognostic nutritional index (PNI) as a tool for assessing disease activity in rheumatoid arthritis patients. Clin Rheumatol. 2024;43(5):1461–1467. doi:10.1007/s10067-024-06927-2
38. Wang J, Zhu R, Fang H, Xing X, Ge L, Cai G. Association of prognostic nutritional index with the presence and all-cause mortality of rheumatoid arthritis: the national health and nutrition examination survey 2003-2018. BMC Public Health. 2024;24(1):3281. doi:10.1186/s12889-024-20795-0
39. Di Stefano V, Iacono S, Militello M, et al. Comorbidity in myasthenia gravis: multicentric, hospital-based, and controlled study of 178 Italian patients. Neurol Sci. 2024;45(7):3481–3494. doi:10.1007/s10072-024-07368-0
40. Tannemaat MR, Huijbers MG, Verschuuren J. Myasthenia gravis-pathophysiology, diagnosis, and treatment. Handb Clin Neurol. 2024;200:283–305. doi:10.1016/b978-0-12-823912-4.00026-8
41. Yu S, Yan J, Fang Y, Ye Y, Bu B. Effect of thymectomy on the frequencies of peripheral regulatory B and T lymphocytes in patients with Myasthenia gravis-a pilot study. Int J Neurosci. 2024;134(11):1210–1219. doi:10.1080/00207454.2023.2254922
42. Álvarez-velasco R, Gutiérrez-Gutiérrez G, Trujillo JC, et al. Clinical characteristics and outcomes of thymoma-associated myasthenia gravis. Eur J Neurol. 2021;28(6):2083–2091. doi:10.1111/ene.14820
43. Gilhus NE, Andersen H, Andersen LK, et al. Generalized myasthenia gravis with acetylcholine receptor antibodies: a guidance for treatment. Eur J Neurol. 2024;31(5):e16229. doi:10.1111/ene.16229
44. Liu L, Han B, Zhang Y, et al. First-line treatment of severe aplastic anemia: immunosuppressive therapy plus eltrombopag versus haploidentical hematopoietic stem cell transplantation, a multicenter prospective study. Bone Marrow Transplant. 2024;59(10):1449–1457. doi:10.1038/s41409-024-02377-1
45. Chen D, Sun F, Miao M, et al. Dose effect of corticosteroids on peripheral lymphocyte profiles in patients with systemic lupus erythematosus. Clin Rheumatol. 2025;44(2):669–679. doi:10.1007/s10067-024-07254-2
 © 2025 The Author(s). This work is published and licensed by Dove Medical Press Limited. The
full terms of this license are available at https://www.dovepress.com/terms
and incorporate the Creative Commons Attribution
- Non Commercial (unported, 4.0) License.
By accessing the work you hereby accept the Terms. Non-commercial uses of the work are permitted
without any further permission from Dove Medical Press Limited, provided the work is properly
attributed. For permission for commercial use of this work, please see paragraphs 4.2 and 5 of our Terms.
© 2025 The Author(s). This work is published and licensed by Dove Medical Press Limited. The
full terms of this license are available at https://www.dovepress.com/terms
and incorporate the Creative Commons Attribution
- Non Commercial (unported, 4.0) License.
By accessing the work you hereby accept the Terms. Non-commercial uses of the work are permitted
without any further permission from Dove Medical Press Limited, provided the work is properly
attributed. For permission for commercial use of this work, please see paragraphs 4.2 and 5 of our Terms.
Recommended articles

Prognostic Nutritional Index (PNI) as a Predictor in Patients with Metabolic Syndrome and Heart Failure
Zhang X, Zhang J, Liu F, Li W, Zhang T, Fang B, Zhang Z, Xie Q, Yang Y, Li X
Diabetes, Metabolic Syndrome and Obesity 2023, 16:2503-2514
Published Date: 18 August 2023
Correlation of Prognostic Nutritional Index and Systemic Immune-Inflammation Index with the Recurrence and Prognosis in Oral Squamous Cell Carcinoma with the Stage of III/IV
Ye M, Zhang L
International Journal of General Medicine 2024, 17:2289-2297
Published Date: 20 May 2024
Association of Systemic Inflammation Response Index with Short-Term All-Cause Mortality in Decompensated Liver Cirrhosis Patients
Cheng J, Ju H, Wang G, He C, Wang W
Journal of Inflammation Research 2024, 17:8985-8995
Published Date: 18 November 2024
The Effect of Systemic Immune-Inflammatory Index (SII) and Prognostic Nutritional Index (PNI) in Early Gastric Cancer
Jing Y, Ren M, Li X, Sun X, Xiao Y, Xue J, Liu Z
Journal of Inflammation Research 2024, 17:10273-10287
Published Date: 4 December 2024
The Prognostic Value of Combined Systemic Immune-Inflammatory Index (SII) and Prognostic Nutritional Index (PNI) in Solid Tumor
Zhang Y, Tang M, Gu QH, Zhou LN, Chen MB
Cancer Management and Research 2025, 17:1351-1359
Published Date: 8 July 2025