Back to Journals » Blood and Lymphatic Cancer: Targets and Therapy » Volume 16
Study on the Role of Neutrophil Extracellular Traps-Based Risk Model and Discriminative Gene LTF in the Prognosis of Acute Myeloid Leukemia and the Regulation of Immune Microenvironment
Authors Li Y, Zhang J, Liu T, Zhang D, Wang N, Liu X, Feng P, Zhang J, Ji C, Ye J
Received 23 August 2025
Accepted for publication 30 December 2025
Published 13 January 2026 Volume 2026:16 562651
DOI https://doi.org/10.2147/BLCTT.S562651
Checked for plagiarism Yes
Review by Single anonymous peer review
Peer reviewer comments 2
Editor who approved publication: Dr Wilson Gonsalves
Yongjian Li,1,* Jingru Zhang,1– 3,* Tingting Liu,1 Di Zhang,1 Nana Wang,1 Xiaomin Liu,1 Panpan Feng,4 Juan Zhang,1 Chunyan Ji,1– 3 Jingjing Ye1– 3
1Department of Hematology, Qilu Hospital of Shandong University, Jinan, Shandong, People’s Republic of China; 2Shandong Key Laboratory of Hematological Diseases and Immune Microenvironment, Qilu Hospital of Shandong University, Jinan, Shandong, People’s Republic of China; 3Shandong Provincial Clinical Research Center for Hematological Diseases, Qilu Hospital of Shandong University, Jinan, Shandong, People’s Republic of China; 4Department of Hematology, Shandong Provincial Hospital Affiliated to Shandong First Medical University, Jinan, Shandong, People’s Republic of China
*These authors contributed equally to this work
Correspondence: Jingjing Ye, Email [email protected] Chunyan Ji, Email [email protected]
Introduction: Dysregulation of neutrophil extracellular traps (NETs) formation is implicated in cancer progression, coagulation, and metastasis; however, the association with acute myeloid leukemia (AML) prognosis and the immune microenvironment remains poorly understood due to the inherent heterogeneity of NETs. This study aimed to elucidate the role of NETs-related genes in AML pathogenesis, risk stratification, and immune modulation.
Methods: We employed comprehensive bioinformatics approaches to analyze NETs-related gene expression profiles from cBioPortal, UCSC Xena, and Gene Expression Omnibus (GEO) databases. A prognostic model was constructed using 16 NETs-related gene signatures, with rigorous validation performed in both internal and external cohorts. Multivariate Cox regression analyses assessed the model’s independence as a prognostic indicator for overall survival (OS), and a clinical nomogram was developed for practical application. Additionally, immune cell infiltration and microenvironment characteristics were evaluated through enrichment analyses to correlate NETs activity with immunological features.
Results: The NETs-based prognostic model demonstrated robust predictive value for OS in AML patients across validation cohorts and was identified as an independent prognostic factor via multivariate Cox regression. This model enhanced existing risk stratification systems, with high NETs scores significantly associated with neutrophil enrichment and an immunosuppressive tumor microenvironment. Lactotransferrin (LTF) emerged as a pivotal NETs-related gene: its overexpression correlated strongly with adverse prognosis, poor chemotherapy response, and extensive remodeling of the immune landscape, including heightened neutrophil infiltration and immunosuppressive signatures.
Discussion: Our comprehensive analysis of NETs in AML suggests that NETs have a role in the tumor microenvironment and prognosis. LTF is a promising candidate biomarker of therapy response and prognostic prediction, which may contribute to individualized clinical decision-making. Further functional validation and prospective clinical studies are warranted to translate our observations into targeted interventions and refine risk-adapted treatment protocols.
Keywords: acute myeloid leukemia, neutrophil extracellular traps, prognosis, immune microenvironment, lactotransferrin
Introduction
Acute myeloid leukemia (AML) is a genetically heterogeneous group of hematopoietic malignancies with poor outcomes.1 Despite the initial responsiveness to chemotherapy, the majority of AML patients eventually relapse, succumbing to progressive disease.2 Recent advances in the epigenomic and genomic characterization of AML have facilitated the development and approval of innovative targeted agents.3,4 Immunotherapy is also a promising avenue for achieving prolonged disease control.5 However, improving prognosis remains a significant challenge owing to acquired resistance to targeted agents and a low response to immunotherapy.6 Therefore, there is an urgent need to explore new therapeutic targets and prognostic biomarkers to guide treatment decisions and predict the survival of patients with AML.
Neutrophil extracellular traps (NETs) are a reticulated structure of DNA, histones, and antimicrobial peptides produced by active neutrophils that trap pathogens including bacteria, fungi, and viruses.7,8 In addition to their active role in innate immunity, NETs have been implicated as mediators of pathology in sterile inflammation, such as autoimmunity and cancer. NETs were initially identified as contributors to cancer-associated thrombosis,9 and further emerging studies have highlighted the critical roles of NETs in cancer progression, coagulation, and metastasis.10 Specifically, elevated levels of NETs were observed in metastases from colorectal and breast cancers.11,12 Moreover, NETs form a coat around tumor cells to protect them from immune cytotoxicity in subcutaneous tumors and pancreatic cancer.13,14 Accumulating evidence in solid tumors has demonstrated that aberrant NETs release is associated with poor survival and low sensitivity of multiple treatments such as chemotherapy, targeted therapy and immunotherapy.15 Nevertheless, the prognostic role of NETs in AML remains unknown, and their predictive value is highly demanded to be further explored in specific therapeutic regimens.
In this study, we established a NETs-based prognostic model in the Cancer Cell 2022 cohort to identify the effects of NETs on the clinical outcome and immune infiltration of AML. Among the 16 genes incorporated into the risk signatures, LTF was identified as the pivotal NETs-related gene associated with an adverse prognosis for AML. LTF, which serves as a late-stage differentiation marker in neutrophils, macrophages, and distinct dendritic cells (DCs) subtypes, was further scrutinized for its correlations with the microenvironment phenotype and treatment response. Our findings underscore the significant role of NETs-based risk model in facilitating prognostic assessment and refining risk stratification for AML, as well as provided a new perspective on the remodeling of the immunosuppressive microenvironment in AML. We believe that LTF could serve as a promising candidate biomarker for immunotherapy response and a novel therapeutic target if prospectively validated.
Materials and Methods
Patient Samples and Data Sets
The transcriptome profiling data from bone marrow samples of 345 AML patients were downloaded from the Acute Myeloid Leukemia (Oregon Health & Science University, OHSU, Cancer Cell 2022) dataset16 in cBioPortal17 (http://www.cbioportal.org/) as the training set, which were further randomly divided into two subgroups in a 7:3 ratio by the R package “caret”. The bone marrow transcriptome profiling data cohorts of the Acute Myeloid Leukemia (the Cancer Genome Atlas, TCGA, NEJM 2013) dataset18 and the Acute Myeloid Leukemia (TCGA, Firehose Legacy) dataset from cBioPortal, the HTSeq-FPKM of TCGA-LAML cohort from the UCSC Xena database, the GSE37642 cohort based on the GPL570 platform from the GEO database, and the Beat AML trial,19 were used as validation cohorts. Study participants with incomplete clinical information were excluded.
Construction of the NETs-Related Prognostic Risk Signature in AML
A 16-gene NETs-related prognostic signature was derived via univariate Cox regression and least absolute shrinkage and selection operator (LASSO); risk scores were calculated per patient and dichotomized by median (0.2484). Model performance was assessed using Kaplan-Meier survival, time-dependent receiver operating characteristic (ROC), and Principal component analysis (PCA). The detailed information on construction of the NETs-related prognostic risk signature in AML is available in Supplementary materials and methods, available at Blood and Lymphatic Cancer: Targets and Therapy Online.
Construction of the Nomogram for AML Patients
To construct a nomogram that can predict the 1-, 3-, and 5-years survival of 345 AML patients in the training cohort, we combined the risk score with the clinicopathological characteristics of age and 2017 European Leukemia Net (ELN) risk stratification sorted by the univariate and multivariate Cox regression analyses. We used a calibration curve to test whether the predictive survival rate was consistent with the actual survival rate.
Recalculation of the LI24 and LSC17 Score
LI24 and LSC17 risk scores were recalculated using published coefficients and applied for comparative prognostic evaluation. The detailed information on recalculation of the LI24 and LSC17 score is available in Supplementary materials and methods, available at Blood and Lymphatic Cancer: Targets and Therapy Online.
Estimation of Immune Cell Fractions
Immune cell infiltration was quantified using four complementary algorithms, including single-sample gene set enrichment analysis (ssGSEA),20,21 CIBERSORT,22 xCell23 and ESTIMATE24 to assess composition and functional context. The detailed information on estimation of immune cell fractions is available in Supplementary materials and methods, available at Blood and Lymphatic Cancer: Targets and Therapy Online.
Generation of Differentially Expressed Genes (DEGs) Between High- and Low-LTF Groups
The 345 AML samples in the training cohort were labeled with high- or low-LTF depending on the comparison to the median of the expression level. Package “limma” was used to perform differentiation analysis of the gene expression, and DEGs were generated by the comparison between the high-LTF samples vs the low-LTF samples. DEGs with fold change > 1 and false discovery rate (FDR) < 0.05 were considered significant.
Functional Enrichment Analyses of the LTF Expression Levels
According to the median of the LTF expression values, AML patients in the training cohort were divided into high- and low-LTF subgroups. GO (Gene Ontology) and KEGG (Kyoto Encyclopedia of Genes and Genomes) enrichment analyses using 549 up-regulated DEGs and 209 down-regulated DEGs were performed with R language with the aid of packages “clusterProfiler”, “enrichplot”, and “ggplot2”. Only terms with both p- and q-value < 0.05 were considered significantly enriched. Gene set enrichment analysis (GSEA) was used to analyze which pathway genes were mainly enriched and carried out with GSEA 4.3.2 (http://www.broad.mit.edu/gsea/). p < 0.05 and FDR < 0.05 were considered the thresholds for statistical significance.
GeneMANIA
A protein-protein interaction (PPI) network was constructed using GeneMANIA (http://www.genemania.org/),25 a useful web resource that can explore the potential functions of selected genes and establish a PPI network. Association data including physical interaction, co-expression, predicted, co-localization, genetic interactions, pathways and shared protein domains similarity can be investigated by using GeneMANIA.
Statistical Analysis
The Wilcoxon rank-sum test was used to determine the difference between two groups, and the Kruskal–Wallis test was used for multiple groups. Survival analyses were performed using the Kaplan-Meier method with Log rank tests. Univariate Cox regression analyses were first conducted to evaluate the association between clinical variables including age, FLT3-ITD (Fms-like tyrosine kinase 3 internal tandem duplication) and NPM1 (nucleophosmin 1) mutation status, FAB (French-American-British) classification, cytogenetic karyotype, 2017 ELN risk stratification, disease stage, and the NETs-based risk score, and OS. Variables with p < 0.05 in univariate analysis were considered statistically significant and retained for multivariate analysis. To account for potential confounders, multivariate Cox regression was performed by incorporating significant univariate predictors (age, 2017 ELN risk stratification, and risk score) while adjusting for established clinical prognostic factors. The time-dependent ROC curves were generated to assess the predictive accuracy of the risk signature at 1-, 3-, and 5-year timepoints using the R package survivalROC. The optimal cutoff for risk stratification was determined by maximally selected rank statistics. R version 4.3.1 and SPSS 27.0 were used for statistical analyses. p < 0.05 was considered statistically significant.
Results
Source of NETs-Related Genes
A total of 137 NETs-related genes26 were initially retrieved from the published studies (Supplementary Table S1). After figuring out the duplicated genes from the training cohort, a set of 130 unique genes was identified. GO functional enrichment analysis showed that these genes were predominately enriched in response to molecule of bacterial origin, leukocyte migration, secretory granule lumen, cytoplasmic vesicle lumen and cytokine receptor binding (Supplementary Figure S1A). KEGG functional enrichment analysis demonstrated the primary enrichment of these genes in NETs formation (Supplementary Figure S1B). Indeed, functional enrichment analysis revealed a robust correlation between the selected set of genes and the biological processes involved in NETs formation, suggesting the significance of further exploration in the context of AML.
Establishment of NETs-Related Prognostic Model in AML
To explore the effects of NETs-related genes on the prognosis of AML patients, we conducted a univariate Cox regression analysis in the Cancer Cell 2022 training cohort and then screened out 27 NETs-related genes, which exhibited a significant association with OS (Figure 1A). The LASSO regression analysis further reduced dimensionality and identified 16 NETs-related genes for the development of our predictive model (Figure 1B and C). The risk score for each patient was calculated using the optimal coefficient for each gene as depicted in Supplementary Table S2, which included eight genes detrimental to OS (CLEC4E, CXCL1, ENO1, LPAR3, LTF, MMP9, S100A8, SRC), as well as eight genes advantageous for OS (AZU1, CD44, IL1B, IRF1, NFE2L2, ORAI1, P2RX1, SUCNR1). According to the median risk scores of 0.2484 in the training dataset, AML patients were divided into high-risk and low-risk groups.
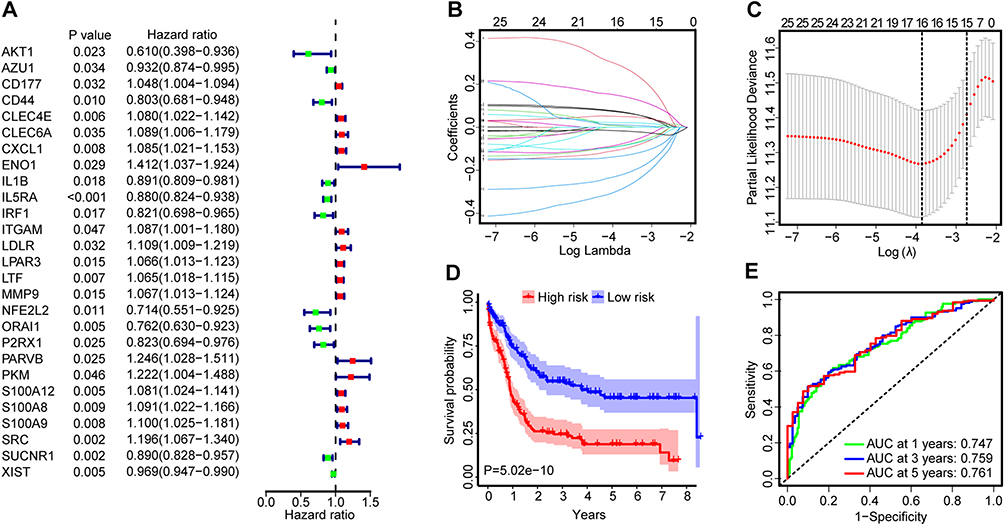 |
Figure 1 (A) Forest plots of 27 NETs-related genes associated with AML prognosis identified using univariate Cox regression analysis in the training cohort. The hazard ratios (HRs) were plotted with lower and upper 95% confidence intervals (CI) in the forest plots. (B) Determination of the log(λ) corresponding to the minimum tenfold cross-validation error point. (C) The non-0 coefficient corresponding to the same log(λ) value. (D) Survival analysis between the high- and low-risk groups of the training cohort performed using the Log rank test. Patients were stratified into the two groups using the median as a cutoff. (E) Time-dependent ROC curve analysis of the risk score. |
Survival analysis demonstrated that patients in high-risk group experienced notably shorter OS compared to those in low-risk group (Figure 1D). This trend was further evidenced as the risk score increased, correlating with a decrease in survival time and an increase in the number of fatalities (Supplementary Figure S2A and B). Moreover, the risk score of deceased AML patients was significantly higher than that of living patients (Supplementary Figure S2C). Subsequently, a time-dependent ROC curve was drawn to evaluate the predictive performance of the risk signature. As shown in Figure 1E, the area under the curve (AUC) values were 0.747, 0.759, and 0.761 at 1, 3, and 5 years, indicating a good performance in predictive accuracy of NETs-based risk model. PCA analysis further illustrated that the risk model had the most effective discriminatory ability between these two distinct risk groups (Supplementary Figure S2D).
Validation of NETs-Based Prognostic Model in AML
To verify the applicability of NETs-based risk signatures for OS based on the entire Cancer Cell 2022 cohort, we randomly divided the whole AML patients into two internal cohorts at a ratio of 7:3 (First internal cohort, n = 244; Second internal cohort, n=101). Consistent with the findings in the entire training cohort, OS of high-risk group was significantly shorter than that of low-risk group in the first internal cohort, with the AUC values of 0.758, 0.756, and 0.754 at 1, 3, and 5 years (Figure 2A). A similar trend was displayed in the second internal cohort that patients with a high-risk score had poorer clinical outcomes (Figure 2B). Furthermore, the analysis of the external validation datasets from the TCGA-LAML cohort (n=132, Figure 2C), the NEJM 2013 cohort (n=173, Figure 2D), the Firehose Legacy cohort (n=168, Figure 2E), the GSE37642-GPL570 cohort (n=136, Figure 2F) and the Beat AML cohort (n=191, Figure 2G) corroborated these results, implying an adverse prognostic impact of the NETs-based model. In summary, through rigorous validation in both internal and external cohorts, our constructed risk-score model demonstrated a reliable and stable prognostic predictive value.
 |
Figure 2 Survival analysis between the high- and low-risk score groups and time-dependent ROC curve analysis of the risk score in the first internal validation set (A), the second internal validation set (B), the TCGA-LAML validation set (C), the NEJM 2013 validation set (D), the Firehose Legacy validation set (E), the GSE37642-GPL570 validation set (F) and the Beat AML validation set (G) performed using the Log rank test. Patients were stratified into the two groups using the median risk score of 0.2484 in the training cohort as a cutoff. (H) The nomogram to predict the 1-, 3- and 5-year OS of AML patients. |
We further carried out a multivariate Cox regression analysis to assess whether the NETs-based risk signatures impacted OS independent of recognized prognostic indicators for AML. In multivariate models for the Cancer Cell 2022 cohort, including the variables with p value less than 0.05 under univariate analysis (Supplementary Figure S2E), the risk score remained an independent prognostic indicator for OS (p < 0.001) along with age (p < 0.001), 2017 ELN risk stratification (p = 0.022) (Supplementary Figure S2F). This was also true for the independent prognostic influence of NETs-based risk score on OS across another three distinct cohorts (TCGA-LAML, NEJM 2013, and Beat AML, Table 1). When adjusting for age, white blood cell (WBC), and cytogenetic risk group, high-risk score patients exhibited a significantly shorter OS in both the TCGA-LAML cohort (p < 0.001) and the NEJM 2013 cohort (p = 0.002). Additionally, in the Beat AML cohort, a high-risk score was a robust independent predictor of poor OS (p < 0.001) even after accounting for age, neutrophil counts in peripheral blood, and the presence of FLT3-ITD mutations.
 |
Table 1 Multivariate Analyses of the Risk Score for OS in Three Independent Cohorts |
To better predict AML patients’ prognosis and facilitate clinical decision-making, a nomogram was built based on multivariate model and the three independent prognostic factors (risk score, age, 2017 ELN risk stratification) were incorporated (Figure 2H). In the Cancer Cell 2022 dataset, each parameter was assigned a separate score, and then the cumulative scores were transformed into a scale ranging from 0 to 180. This allowed for a quantitative estimation of the survival probabilities for AML patients at 1, 3, and 5 years. As illustrated in Supplementary Figure S2G, the calibration curves showed that our models closely resembled ideal models in estimating 1-, 3-, and 5-year OS, demonstrating excellent predictive performance. Collectively, we validated the remarkable predictive capability of our prognostic signatures and highlighted its substantial potential for clinical applicability from multiple perspectives.
Additional Value of NETs-Based Model in Refining Risk Stratification and Treatment Response in AML
Given the prominent prognostic relevance of the NETs-based model, it led us to speculate that it may augment the prognostic capabilities of established prognostication systems. Although cytogenetics remains as the current mainstay for risk assessment in AML patients, survival outcomes and treatment responses differed substantially in cytogenetically normal subsets of AML (CN-AML). Thereafter, we examined the prognostic value of NETs-based risk signatures in this heterogeneous population from the Cancer Cell 2022 cohort. Indeed, survival analysis affirmed the adverse prognostic impact of the risk signatures within the CN-AML subset (Figure 3A). ROC curve analysis showed that the risk signatures remained excellent predictive power for OS (AUC: 0.694, 0.692, and 0.724 at 1, 3, and 5 years, Figure 3B).
 |
Figure 3 Survival analysis (A) between the high- and low-risk score groups and time-dependent ROC curve analysis (B) of the risk score in the CN-AML patients in the training cohort. The p-values were computed using Log rank tests. OS of patients from the training cohort as stratified by the LI24 (C) and the LSC17 (D) signature. Patients with a high- and low-score were further dichotomized according to the median. (E) Risk score in samples from patients achieving a CR and patients showing refractory disease in the training cohort. The p-value from Wilcoxon test is shown. (F) CR rate to induction chemotherapy between patients with low- and high-risk score in the training cohort. |
Two gene expression-based prognostic models, LI24 and LSC17, have previously demonstrated their superior performance in prognostic assessment and ability to improve risk stratification for AML patients.27,28 In light of this, we tested the predictive power of NETs-based risk signatures in the context of these two models. Models were established in three independent cohorts and patients were stratified into high- and low-risk groups accordingly. When applied to each risk group stratified by LI24 and LSC17 in the Cancer Cell 2022 cohort, NETs-based risk score was still able to discriminate between shorter and longer OS both within the high-risk and low-risk groups (Figure 3C and D). Similar results were observed in most cases for both LI24 and LSC17 models in the NEJM 2013 cohort (Supplementary Figure S3A and B), the TCGA-LAML cohort (Supplementary Figure S3C and D) and the Beat AML cohort (Supplementary Figure S3E and F). Overall, these data suggest the NETs-based risk model as a good candidate for refining existing classification schemes.
Effective biomarkers are valuable not only for facilitating risk assessment but also for guiding therapeutic decisions. We subsequently evaluated the treatment guidance potential of our model within the Cancer Cell 2022 and Beat AML cohorts, given that extensive treatment response data were exclusively available for these two cohorts. In the Cancer Cell 2022 cohort, risk score in complete remission (CR) population was significantly lower than refractory population (p = 0.0281, Figure 3E). Moreover, patients with higher risk scores exhibited a reduced response rate to induction chemotherapy, showing a CR rate of 56.69% versus 69.72% for patients with lower risk scores (p = 0.027, Figure 3F). The consistent results were observed both in the Beat AML cohorts that CR patients had a trend for lower risk scores compared to refractory patients (Supplementary Figure S3G) and patients with higher risk scores tended to demonstrate a decreased CR rate (Supplementary Figure S3H).
NETs-Based Risk Signatures Associated with Immunity in AML
As mentioned above in Supplementary Figure S1, our functional enrichment analysis allowed to reasonably infer that NETs-related genes incorporated into the prognostic model were closely associated with the process of NETs formation. Hence, we focused our analysis on neutrophil enrichment within the Cancer Cell 2022 cohort. As shown in Figure 4A, neutrophils were significantly enriched in AML patients with a high-risk score (0–0.9711, median: 0.5615) compared to those with a low-risk score (0.0343–0.9492, median: 0.4442), as determined by ssGSEA analysis (p = 0.0002). Similar results were observed when the immune fractions were calculated by CIBERSORT (0–0.3812, median: 0.0002 in high-risk group, vs 0–0.2775, median: 0 in low-risk group; p = 0.0075, Figure 4B) and xCell (0–0.3601, median: 0.0333 in high-risk group, vs 0–0.3552, median: 0.0128 in low-risk group; p = 0.0002, Figure 4C). In addition, the preferential enrichment of neutrophils in high-risk score group was also found in another two AML datasets (TCGA-LAML and NEJM 2013) using CIBERSORT and xCell (Supplementary Figure S4A and B).
 |
Figure 4 The abundance of Neutrophil in low- and high-risk score group from the training cohort, as estimated by ssGSEA (A), CIBERSORT (B) and xCell (C). The abundance of CD8+ T cells in low- and high-risk score group from the training cohort, as estimated by ssGSEA (D), CIBERSORT (E) and xCell (F). The abundance of Tregs (G), MDSCs (H) and NK cells (I) in low- and high-risk score group from the training cohort, as estimated by ssGSEA. (J) The abundance of macrophage M2 in low- and high-risk score group from the training cohort, as estimated by xCell. Boxplots show the median of the data distribution. The p-values calculated from Wilcoxon test are shown. (K) The expression levels of common immune checkpoints in high- and low-risk score group. * p < 0.05; ** p < 0.01; *** p < 0.001. |
Furthermore, we compared the fractions of another subtype of tumor-infiltrating leukocytes (TILs) between high-risk score and low-risk score groups in the Cancer Cell 2022 cohort. ssGSEA analysis revealed that AML patients with a high-risk score were sparsely infiltrated by activated CD8+ T cells (Figure 4D), which often exhibit tumor-promoting activities. This was also true for the reduced enrichment of CD8+ T cells in the high-risk group according to both CIBERSORT and xCell analyses (Figure 4E and F). Within both the TCGA-LAML cohort and the NEJM 2013 cohort, the frequency of CD8+ T cells was consistently lower in the high-risk group in most instances (Supplementary Figure S4C and D). We also observed that the fractions of immunosuppressive components like regulatory T cells (Tregs), myeloid-derived suppressor cells (MDSCs), activated natural killer cells (NK cells), and M2 macrophages were elevated in the high-risk group within three independent cohorts (Cancer Cell 2022, TCGA-LAML and NEJM 2013; Figure 4G–J & Supplementary Figure S4E and F). Additionally, we found strong positive correlations between the risk score and immune checkpoint molecules such as CD40, CD276, LILRB1, C10orf54, CD86, TNFRSF8, TNFSF14, SIGLEC7, TNFSF15, SIRPA. Conversely, the risk score was negatively associated with CD44, CD274, CD244, HAVCR2, ICOS, KIR3DL1, CD28, TIGIT, TNFRSF4, TNFRSF18, PDCD1, and TNFRSF25 (Figure 4K). These findings provide insight into an immunosuppressive microenvironment in the high-risk AML population, which warrants further exploration.
Correlation of NETs-Related Genes with Prognosis and Neutrophils Infiltration in AML
Next, we investigated the function of those NETs-related genes incorporated into our prognostic model. Survival analysis revealed that five genes (CD44, IRF1, ORAI1, LPAR3 and LTF) played a role in the prognosis of AML within the Cancer Cell 2022 cohort (Figure 5A and Supplementary Figure S5A). Among these five genes, only the expression of LTF in the deceased AML patients was significantly higher than that of living patients; while CD44, IRF1, ORAI1 showed significantly decreased expression in the deceased samples (Supplementary Figure S5B). To further compare the predictive performance of the above candidate genes, ROC curve analysis was performed. LTF represented the strongest predictive power for OS, yielding the highest AUC in predicting the 3-year and 5-year survival rate (Figure 5B).
 |
Figure 5 (A) Survival analysis among high- and low-CD44, IRF1, ORAI1, LPAR3 and LTF expression categories in the 345 AML patients from the training cohort performed using the Log rank test. Patients with a high- and low-gene expression were dichotomized according to the median. (B) Time-dependent ROC curve analysis and AUC values at 1-, 3- and 5-years survival in the high- and low-CD44, IRF1, ORAI1, LPAR3 and LTF expression categories of the training cohort. (C) The LTF expression levels in low- and high-infiltration of neutrophil groups from the training cohort, the GSE37642-GPL570 cohort and the Beat AML cohort, as estimated by CIBERSORT and xCell. Patients with a high- and low-infiltration of neutrophil were dichotomized according to the median. |
The subsequent question was whether LTF could reflect the abundance of neutrophils in AML. Therefore, AML patients in three cohorts (Cancer Cell 2022, GSE37642-GPL570 and Beat AML) were dichotomized at the median of neutrophils infiltrating levels, mRNA expressions of the candidate genes were then compared between patients with high and those with low neutrophils enrichment. As shown in Figure 5C and Supplementary Figure S6, only LTF was able to accurately reflect variation in neutrophils in all AML cohorts, as compared to the other four genes. These results together suggest that LTF is the critical NETs-related signature linked to an adverse prognosis of AML and could be indicative of neutrophils infiltration.
Relationship Between LTF Expression and Response to Chemotherapy and Clinical Characteristics
The above results had illuminated the potential prognostic relevance of NETs-related LTF in AML, we proceeded to check whether LTF could provide valuable guidance in predicting the response to chemotherapy in AML. In the Cancer Cell 2022 cohort, the CR rate of LTF high group was only 58.27%, which tended to be much lower than 68.31% of LTF low group (p = 0.088). As shown in Figure 6A, LTF expression levels in CR specimens were significantly lower than that in refractory specimens (p = 0.0195). Consistently, LTF expression levels of living patients was significantly lower than that of deceased AML patients (p = 0.0191, Figure 6B). A similar trend was demonstrated in the Beat AML cohort that the predicted responders exhibited significantly lower levels of LTF and it was also true for living patients (Figure 6C and D).
 |
Figure 6 LTF expression level in samples from patients achieving a CR and patients showing refractory disease in the training cohort (A) and the Beat AML cohort (C); LTF expression level in samples from living and deceased patients in the training cohort (B) and in the Beat AML cohort (D). The p-value from Wilcoxon test is shown. Kaplan-Meier curves of OS for patients with high- (E) or low- (F) LTF expression as stratified by treatment options (alloSCT vs no-alloSCT) in the entire NEJM 2013 cohort. Kaplan-Meier curves of OS for patients with high- (G) or low- (H) LTF expression as stratified by treatment options (alloSCT vs no-alloSCT) in the 2017 ELN intermediate risk stratification group of the NEJM 2013 cohort. (I) The distribution of LTF expression level classified by FAB norm in the training cohort. (J) LTF expression level in samples from patients with normal or abnormal karyotype in the training cohort. (K) The distribution of LTF expression level classified by 2017 ELN risk stratification in the training cohort. |
Allogeneic stem cell transplantation (alloSCT) is an intensive treatment strategy typically performed on high-risk AML patients due to treatment-related modalities. To investigate the impact of alloSCT based on LTF status, we conducted a subgroup analysis on the NEJM 2013 cohort with transplantation data. Among patients with high LTF expression, the transplant group demonstrated a remarkable improvement in OS (median OS 30.2 months) compared to the no-transplant group (median OS 8 months, p < 0.0001; Figure 6E). For patients with low LTF expression, the outcome was not significantly affected by transplantation (p = 0.4372; Figure 6F). To date, an ongoing debate persists regarding the necessity of alloSCT for intermediate-risk AML patients. Our results indicated that among intermediate-risk patients with high LTF levels, OS was significantly improved for the transplant group (median OS 36.1 months) compared with the no-transplant group (median OS 9 months, p =0.0002; Figure 6G). However, this benefit no longer remained in those with low LTF levels (Figure 6H). Overall, these analyses suggest that LTF high expressers might benefit from alloSCT both in the full cohort and in the intermediate-risk AML subset. Thus, LTF could be a promisingly effective prognosticator for alloSCT.
We also explored the association of LTF expression with morphologic, cytogenetic, and molecular abnormalities in the Cancer Cell 2022 cohort. Significant distinctions were noted between FAB subtypes and LTF expression status (Figure 6I): high LTF expression more often presented with M2, which was significantly different from that in M0, M1, M3 and M5 (p < 0.0001); whereas LTF expression was relatively lower in M3, with a significant difference observed exclusively in comparison to M2 and M6 (M3 vs M6: p = 0.0206). Moreover, patients with abnormal karyotype were more likely to exhibit increased LTF expression (p = 0.0098, Figure 6J). We further analyzed LTF expression in different risk groups based on 2017 ELN risk classification (Figure 6K), and found that LTF levels were remarkably elevated in the adverse risk group compared to both the intermediate and favorable risk group (intermediate: p = 0.0413; favorable: p = 0.0035). Concerning gene mutational status as shown in Table 2, high LTF expression was positively associated with the presence of TP53 (p = 0.002), but inversely correlated with FLT3 and NPM1 mutations (p < 0.001).
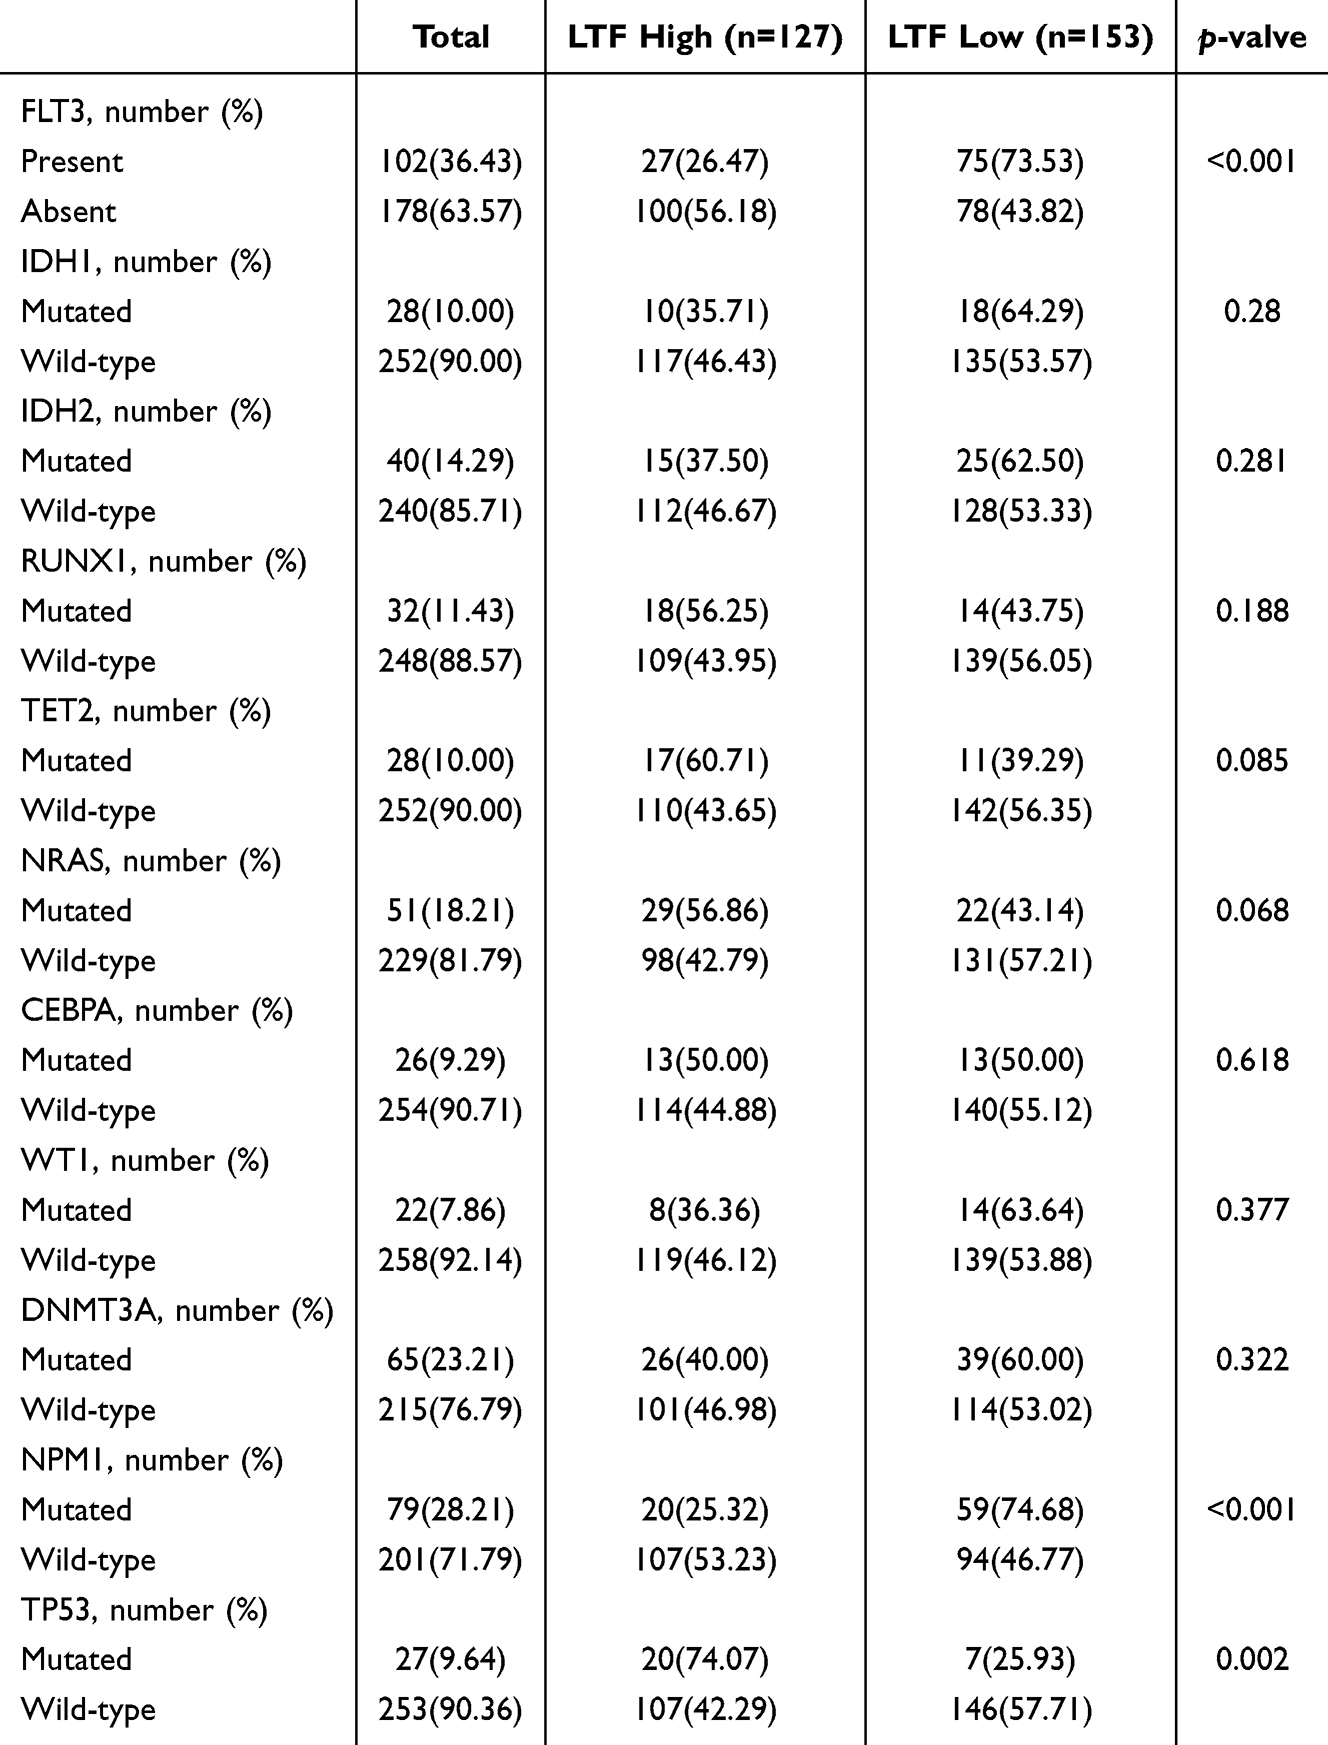 |
Table 2 The Relation of LTF Expression and Common Mutation in AML of the Training Cohort |
The Biological Significance of LTF Expression in AML
To gain insight into the potential biological features associated with LTF in AML, we conducted a comparison of gene expression profiles between patients with high and low LTF levels, as determined by the median expression value in the Cancer Cell 2022 cohort. A total of 758 genes were differentially expressed with a cutoff p-value of 0.05 and |Fold change| > 1.0, including 549 up-regulated DEGs and 209 down-regulated DEGs (Figure 7A). Among the genes positively correlated with LTF were peptidoglycan recognition protein 1 (PGLYRP1), a component of the innate immune system, indicating further immune regulatory properties of LTF. Also highly correlated were well-characterized immune checkpoint genes in AML, such as TNFRSF9, TMIGD2, CD48, CD40LG, CD200R1.
 |
Figure 7 (A) The volcano plots of DEGs showing that TNFSF4 was down-regulated, while TNFRSF9, TMIGD2, CD48, CD40LG, CD200R1 and PGLYRP1 were up-regulated. GO (B) and KEGG (C) enrichment analyses of the up-regulated and down-regulated DEGs. BP, biological process; CC, cellular components; MF, molecular function. (D) PPI network analysis of LTF by the GeneMANIA database to perform protein-protein interaction of LTF. The colors of the line illustrate different type of the relationships. The distinct colors inside the gene dots indicate the biological function of the genes. |
Subsequently, we performed GO analysis using these DEGs and the top 5 significant terms of biological process (BP), cellular components (CC) and molecular function (MF) enrichment analysis were shown (Figure 7B). Most GO terms of upregulated DEGs were related to leukocyte migration, leukocyte chemotaxis, secretory granule lumen, cytoplasmic vesicle lumen, vesicle lumen, and carbohydrate binding, demonstrating that LTF is involved in the formation and release of NETs. Importantly, high expression of LTF was closely correlated with gene signatures that featured immune processes, including positive regulation of cytokine production, immune receptor activity, reactive oxygen species metabolic process and antioxidant activity. Consistent with the previous ssGSEA and GO analysis, KEGG analysis revealed that upregulated DEGs were significantly enriched in NETs formation-related pathways as well as cytokine-cytokine receptor interaction, phagosome and viral protein interaction with cytokine and cytokine receptor (Figure 7C), implying a close relationship between LTF and remodeling of the immune microenvironment.
To further elucidate the role of LTF in tumorigenesis, we utilized GeneMANIA analysis to construct an integrated PPI network, which helped us identify proteins that interact with LTF (Figure 7D). This network revealed strong associations between LTF and various proteins and the majority of these genes (CEBPE, APCS, LYZ, CEBPA, MUC7, SIRT7, CD14, LCN2, MPO) were involved in immune regulation. Genes implicated in the pathogenesis of AML such as CEBPE, CEBPA and MPO were also detected. Furthermore, our analysis revealed enrichment in biological processes related to secretory granule lumen, transition metal ion transport, iron ion homeostasis, and cellular transition metal ion homeostasis. Taken together, these interactions might contribute to the immunomodulatory effects of LTF in AML.
LTF-Shaped Immunosuppressive Context of AML
By employing diverse techniques for estimating immune cell fractions, we further explored the influence of LTF on the immune landscape in AML. GSEA of the Cancer Cell 2022 cohort showed that genes upregulated in the LTF high group were predominantly enriched in the immune process, such as the cytokine and chemokine signaling pathway, T cell receptor signaling pathway, and NK cells mediated cytotoxicity (Figure 8A). Using the ESTIMATE algorithm, we found that patients with elevated LTF expression levels exhibited increased immune, stromal, and overall ESTIMATE scores (Figure 8B). The higher LTF expression levels, the more immunescore fractions calculated by xCell (Figure 8C). Moreover, we quantified the enrichment scores of ssGSEA analysis for various immune cell subgroups. The data revealed significant differences in all types of TILs between the LTF high and low groups, except for activated B cells and central memory CD4+ T cells (Figure 8D). Consistent results were observed in two additional datasets (Supplementary Figure S7). Collectively, these data suggest that LTF plays a significant role in shaping the highly disturbed immune microenvironment of AML.
 |
Figure 8 (A) GSEA of patients with high- and low-LTF expression, using KEGG gene sets obtained from the Molecular Signatures Database (MSigDB). (B) The differences of TME scores between high- and low-LTF expression groups in stromal score, immune score and ESTIMATE score. (C) The abundance of immune score in low- and high-LTF expression group from the training cohort, as estimated by xCell. (D) ssGSEA algorithm was used to calculate the infiltration levels of 28 immune cells in high- and low-LTF expression groups from the training cohort. (E) The abundance of neutrophil, Tregs, MDSCs, NK cells, memory B cell and the ratio of CD8+ T cell to Tregs in low- and high-LTF expression group from the training cohort, as estimated by ssGSEA. Patients with high- or low-LTF expression were further dichotomized according to median. (F) Correlation between LTF expression and immune cell infiltration. The p-value of the correlation is indicated in box. (G)The expression levels of common immune checkpoints in high- and low-LTF expression group. ** p < 0.01; *** p < 0.001. |
Furthermore, we observed a significant enrichment of neutrophils, Tregs, MDSCs, activated NK cells and memory B cells as well as a concomitant reduction in the ratio of CD8+ T cells to Tregs in high LTF group from the Cancer Cell 2022 cohort, as compared to low LTF group (Figure 8E). Additionally, the association between LTF expression levels and the enrichment scores of these immune cell subtypes was consistently verified in two other independent cohorts in the majority of cases (Supplementary Figure S8). Further correlation analysis indicated close relationship between LTF expression and immune cell infiltration, among which neutrophil, T helper 17 (Th17) cells, mast cells, activated DCs and activated CD4+ T cells exhibited the most robust association with LTF levels (Figure 8F). We also observed strong positive correlations between LTF levels and immune checkpoint molecules, such as TNFRSF9, NRP1, CD40, CD40LG, LILRB1, C10orf54, CD86, CD48, CD160, CD274, TNFSF14, ADORA2A, IDO1, CD27, TNFRSF14, CTLA4, ICOS, CD200R1, TMIGD2, SIGLEC7, CD28, TIGIT, PDCD1, and SIRPA; whereas LTF levels were negatively correlated with CD44, CD276, TNFSF4, CD80, CD244, TNFSF9, CD70, LAIR1, LGALS9, TNFRSF4 and NCR3LG1 (Figure 8G). Our findings together demonstrate that LTF influences the immune microenvironment of AML through various mechanisms, ultimately shaping an immunosuppressive context.
Discussion
NETs are originally thought to be formed by neutrophils to trap invading microorganisms as a defense mechanism.29,30 Accumulating evidence has shown that NETs play a pivotal role in cancer initiation, either indirectly by exacerbating inflammation or directly by perpetuating genotoxic stress.7 NETs are also demonstrated to be involved in tumor progression and diffusion.31 One mechanism through which NETs stimulate cancer cell migration is via the chemotactic effects of NET-DNA on DNA sensors.32 Another potential mechanism involves inducing epithelial-mesenchymal transition,33 which can endow epithelial-derived cancer cells with invasive properties.7 Furthermore, NETs can induce metabolic changes within the tumor microenvironment (TME).34 NETs-related genes prognostic signature has generally been reported to correlate with unfavorable clinical outcomes and low drug sensitivity across various malignant diseases.35–37 However, a systematic evaluation of the relationship between the NETs-related gene set and the occurrence and progression of AML is currently lacking. Here, our data suggested an independent prognostic value of NETs-based risk model in AML. High-risk patients exhibited lower response rates to chemotherapy and were more likely to become refractory, whereas low-risk patients experienced more treatment benefits and prolonged survival. Additionally, NETs-based signatures could add prognostic value in refining current risk stratifications for patients with AML. Furthermore, our findings provided a novel perspective on the role of NETs in the AML immune microenvironment.
The immunologic microenvironment of hematological malignancies, such as AML, is indeed distinctive. Our study innovatively integrated NETs-related genes and elucidated the states of immune escape in the TME of AML patients based on their transcriptome expression levels, representing the pioneering exploration in AML research. We observed the involvement of NETs in shaping immunosuppression in AML, displaying that the fractions of immunosuppressive cells like Tregs, MDSCs, activated NK cells, and M2 macrophages were elevated in the NETs high-score group. As an important component of NETs, Cathepsin G cleaves the NK cells-associated activating receptor NKp46, which further impairs NK cells function, including IFN-γ production and cell degranulation, implying that NETs might inhibit NK cells-based antitumor response.38 Other studies have shown that the addition of NETs to IL-4/GM-CSF-treated monocytes prevents the full differentiation of monocytes into DCs but induces their differentiation into M2 macrophages, thereby promoting tumor growth and invasion.39 Thus, our results and others suggest that NETs might contribute to tumor progression through facilitating M2 polarization of macrophages.
Emerging tumor immunotherapy approaches, including those centered on T cell activation such as chimeric antigen receptor T-cell (CAR-T) or cancer vaccines, have demonstrated promise in enhancing treatment response and clinical outcomes for AML patients.40 These strategies rely on the potent effects of CD8+ T cell activation to combat hematopoietic malignancies, given their crucial role in mediating tumor adaptive immunity.41,42 The infiltration of CD8+ T lymphocytes has been reported to exhibit an inverse association with NETs density in various solid tumors, including non-small cell lung cancer and bladder cancer.43 In our current work, we also observed a diminished enrichment of CD8+ T cells in AML patients with high NETs scores, as determined by ssGSEA, CIBERSORT, and xCell analyses. Previous studies indicate that NETs may act as a barrier, impeding the effective approach of cytotoxic CD8+ T cells to tumor cells.13 In NETs-rich TME, tumor-infiltrating CD8+ T lymphocytes display a functionally exhausted phenotype, expressing high levels of exhaustion markers such as PD-1, LAG-3, or TIM3. This shift in phenotype can be further reversed with NETs inhibitor.44 Furthermore, inhibition of NETs by systemic administration of DNase I or the use of a PAD4−/−model significantly improves the efficacy of anti-PD-1 immunotherapy, which is manifested by reduced tumor growth, increased CD8+ T cell infiltration, and enhanced cytotoxicity.13 Altogether, these data may elucidate the contribution of NETs to resistance against anti-PD-1 therapy and provide insights into novel strategies for targeting NETs to enhance anti-tumor immunotherapy.
LTF is well known as an iron-binding protein in the milk, saliva and mucosal secretions of the trachea, uterus and ovaries, representing a late stage differentiation marker of neutrophils. In our study, LTF may serve as a useful indicator of neutrophil infiltration and could have prognostic significance in AML patients. Our analyses have several strengths: the prognostic value of LTF was discovered in three relatively large cohorts; treating LTF expression as a continuous variable in predictive performance assessment enhanced the statistical power of the study, allowing for a thorough evaluation of LTF expression as a reliable prognostic predictor for individuals with AML. Regarding the molecular mechanisms underlying elevated LTF expression in AML, multiple factors collectively contribute to its regulation. LTF was demonstrated to be synthesized and stored predominantly in secondary granules of neutrophils,45,46 and its over-expression was associated with poor prognosis of AML patients.47,48 Lineage-tracing and phenotypic studies further showed that LTF expression was largely restricted to Gr-1+/CD11b+ myeloid cells in the bone marrow, confirming its specificity for committed neutrophil-lineage populations.45,49 Moreover, single-cell transcriptomic analyses suggested that LTF was specifically and highly expressed in Ly6G+ neutrophils within the leukemic niche.50 Consequently, the observed elevation of LTF in AML intrinsically arised from neutrophil-lineage dysregulation, and its quantitative level probably served as a reliable marker for neutrophil burden in the leukemic microenvironment. This provides a plausible explanation for the positive association between LTF elevation and neutrophil infiltration in AML. Consistent with our results, LTF exhibits a correlation with the prognosis of various solid tumors, including osteosarcoma, nasopharyngeal carcinoma, and clear cell renal cell carcinoma.49,51,52 Beyond its prognostic significance, LTF has demonstrated a role in promoting the occurrence and progression of diverse solid tumors. In the context of ovarian cancer, ITLN1 is identified as a suppressor of LTF’s impact on invasion potential and proliferation. This suppression is achieved by reducing MMP1 expression and inducing a metabolic shift in metastatic ovarian cancer cells.53 Consequently, it is possible that the pro-metastasis potential of LTF might confer leukemia cells with an increased invasive capacity and more extensive extramedullary infiltration, potentially resulting in a poorer survival. Despite the evidence discussed above, the precise role of elevated LTF expression in the leukemogenesis of AML is yet to be defined.
Further GO and KEGG analyses related to LTF in AML revealed that upregulated DEGs were mainly associated with biological processes such as leukocyte migration, leukocyte chemotaxis, secretory granule lumen, cytoplasmic vesicle lumen, and vesicle lumen, as well as exhibited significant enrichment in NETs formation-related pathways. This finding strongly suggests the involvement of LTF in the process of NETs formation and release. Moreover, the PPI network analysis identified the presence of genes involved in the pathogenesis of AML, such as CEBPE, CEBPA and MPO, suggesting the implications of LTF-mediated NETs formation in the development of AML. Increasing studies have demonstrated that LTF is involved in modulation of the immune response.54 Consistently, GSEA analysis in AML showed that genes upregulated in the LTF high group were predominantly enriched in the immune process. Our immune infiltration analysis further supported these observations by revealing higher immune scores in the LTF high-expression group. Notably, neutrophils, Th17 cells, mast cells, activated DCs, and activated CD4+ T cells exhibited the most robust associations with LTF expression. Additionally, in solid tumor tissues, LTF alone failed to suppress VEGF and ARG-1 expression, two pivotal mediators of M2 macrophage polarization, and thereby sustained the pro-tumorigenic M2 phenotype in tumor activated macrophages.55 In the leukemic niche, macrophage-mediated immune surveillance and clearance were suppressed. This impairment was partly mediated by elevated LTF production from chronic myeloid leukemia (CML) stem/progenitor cells,56 contributing to chemotherapy resistance. Additionally, elevated LTF levels may counteract excessive inflammation while simultaneously promoting T-cell death via ferroptosis, hereby synergistically creating an immunosuppressive niche.54,57 LTF was also found to positively correlate with PGLYRP1, an innate immune component, whose deletion in CD8+ T cells has been shown to enhance anti-tumor immunity.58 Beyond its immunomodulatory roles, LTF also contributed directly to treatment resistance. In lung squamous cell carcinoma, LTF interacted with AMPK to enhance its phosphorylation and induced pro-survival autophagy, a well-established mechanism of radioresistance.59 Given that autophagy was a conserved pathway in chemoresistance, this LTF-driven mechanism was likely also operative in AML, potentially underlying the observed resistance to chemotherapeutic agents. Collectively, these findings indicate that LTF drives a coordinated immunosuppressive program by simultaneously disabling innate immune effector functions and eliminating adaptive immune cells, which probably leads to chemotherapy resistance. Several clinical trials have assessed immunotherapy for AML, including checkpoint inhibitors, CAR-T, multi-specific antibodies, and vaccines.60–62 Nonetheless, immunotherapy has only benefited a few patients. M860, a mouse antihuman LTF monoclonal antibody, has been reported to recognize a conformational epitope and form stable immunocomplexes (IC) with LTF. Studies have revealed that LTF-IC promotes a transition of TAMs from M2 to M1 phenotype, as well as significantly inhibits tumor progression and extends the OS of tumor-bearing mice.55 It is possible that LTF might be a promising therapeutic target for AML to reduce tumor burden and remodel the highly disturbed immune microenvironment of AML. Furthermore, these data emphasize the importance of exploring immunotherapy approaches in the clinical treatment of individuals with elevated levels of LTF.
Furthermore, in order to prospectively validate the effectiveness of the NETs-based risk model in clinical trials and facilitate clinical translation, we proposed a four-pronged strategy for validation. Firstly, we will prospectively collect bone marrow samples from AML patients across disease stages at our center, and quantify the expression levels of the 16 NETs-related genes, including LTF as a key feature, to establish a real-world gene expression dataset. This will allow us to refine and validate the predictive robustness of our NETs-based prognostic model. Secondly, we will integrate this real-world gene expression dataset alongside key clinical variables to determine how the NETs-based risk score correlates with AML subtype classification, treatment efficacy, and patient survival. The findings are expected to facilitate risk stratification and enable personalized therapeutic strategies. Thirdly, based on promising validation in our single-center cohort, we are going to conduct prospective multi-center clinical validation using standardized sample processing protocols, further enhancing model generalizability and reproducibility. Finally, we aim to develop a unified and NETs-informed prognostic framework by integrating our model with established systems (eg, ELN guidelines) through multivariate analysis of multi-center data. This framework is intended to complement current risk stratification and ultimately improve clinical outcomes for AML patients. These efforts will bridge the gap between our findings and clinical utility, ultimately facilitating personalized treatment decisions for AML patients.
Conclusions
The capacity of NETs to promote metastatic dissemination and immune evasion underscores the potential for NETs-targeted therapies to inhibit metastasis and enhance the efficacy of immunotherapy. Currently, therapeutic approaches to block NETs primarily involve inhibiting the general NETs formation pathway, targeting tumor-associated induction of NETs formation, destroying NETs-DNA, and blocking NETs-cancer cell interactions, which represent promising therapeutic targets.33 The constructed NETs-related risk signature can independently predict the prognosis of AML patients, providing a basis for understanding the potential mechanism of NETs-related clinical outcome and treatment response in AML. Additionally, LTF, which influences the immune microenvironment of AML through various mechanisms, ultimately shaping an immunosuppressive context, may prove valuable in improving existing molecular-based risk classification schemes and guiding the selection of therapeutic regimens. Despite the robust prognostic performance of our NETs-based risk model, its clinical implementation faced several key challenges. On the one hand, the dynamic and transient nature of NETs formation limited the ability of static transcriptomic snapshots to fully capture their functional activity. On the other hand, NETs-related biomarkers have not yet been integrated into established AML risk stratification, which remained largely dependent on genetic and cytogenetic features. To bridge this translational gap, we proposed a dual-pronged and prospectively oriented framework: Firstly, we will prospectively collect bone marrow samples from AML patients spanning the full spectrum of disease stages, including newly diagnosed, remission, relapsed, and refractory phases, at our center, and quantify expression of 16 NETs-related genes (with LTF as a pivotal marker) to construct a real-world longitudinal gene expression dataset. This stage-stratified sampling enables robust refinement and validation of our NETs-based prognostic model across the dynamic trajectory of AML. Secondly, we will leverage harmonized clinical and molecular data from multiple centers to perform comprehensive multivariate analyses, adjusting for key covariates including age, cytogenetics, molecular mutation status, and treatment regimens, in order to integrate our NETs-derived risk score with established prognostic systems such as the ELN risk stratification. This data-driven and multi-center strategy strengthens the external validity of our model and fosters the construction of a unified and clinically implementable prognostic framework, thereby translating molecular insights into practical risk assessment tools to guide precision therapeutic strategies in AML.
Abbreviation
alloSCT, Allogeneic Stem Cell Transplantation; AML, Acute Myeloid Leukemia; AUC, Area Under the Curve; BP, Biological Process; CAR-T, Chimeric Antigen Receptor T-cell; CC, Cellular Component; CD8+ T Cells, Cytotoxic T Lymphocytes; CML, Chronic Myeloid Leukemia; CN-AML, Cytogenetically Normal Acute Myeloid Leukemia; CR, Complete Remission; DCs, Dendritic Cells; DEGs, Differentially Expressed Genes; ELN, European Leukemia Net; FAB, French-American-British Classification; FLT3-ITD, Fms-like Tyrosine Kinase 3 Internal Tandem Duplication; GO, Gene Ontology; GSEA, Gene Set Enrichment Analysis; HR, Hazard Ratio; IC, Immunocomplexes; IDH, Isocitrate Dehydrogenase; KEGG, Kyoto Encyclopedia of Genes and Genomes; LASSO, Least Absolute Shrinkage and Selection Operator; LTF, Lactotransferrin; MDSCs, Myeloid-Derived Suppressor Cells; MF, Molecular Function; NK Cells, Natural Killer Cells; NPM1, Nucleophosmin 1; NS, Non-significant; OS, Overall Survival; PCA, Principal Component Analysis; PPI, Protein-Protein Interaction; ROC, Receiver Operating Characteristic; TAMs, Tumor Associated Macrophages; Th17 Cells, T helper 17 Cells; TILs, Tumor-infiltrating Leukocytes; TME, Tumor Microenvironment; Tregs, Regulatory T Cells; WBC, White Blood Cell.
Data Sharing Statement
The original contributions presented in the study are included in the article/Supplementary Material. Further inquiries can be directed to the corresponding authors Jingjing Ye, [email protected] or Chunyan Ji, [email protected].
Ethical Statement
This study utilized publicly available de-identified data from cBioPortal, UCSC Xena and GEO databases, and did not involve any human participants or animals. According to Article 32, Paragraphs 1 and 2 of the Measures for Ethical Review of Life Science and Medical Research Involving Human Subjects (China, February 18, 2023), research involving publicly available anonymized data is exempt from IRB approval.
Statement of Informed Consent
After fully understanding the research content, all participants voluntarily signed the written informed consent form, indicating their agreement to participate in this study.
Acknowledgments
All claims expressed in this article are solely those of the authors and do not necessarily represent those of their affiliated organizations, or those of the publisher, the editors and the reviewers. Any product that may be evaluated in this article, or claim that may be made by its manufacturer, is not guaranteed or endorsed by the publisher.
Author Contributions
All authors made a significant contribution to the work reported, whether that is in the conception, study design, execution, acquisition of data, analysis and interpretation, or in all these areas; took part in drafting, revising or critically reviewing the article; gave final approval of the version to be published; have agreed on the journal to which the article has been submitted; and agree to be accountable for all aspects of the work.
Funding
This work was supported by grants from the Distinguished Taishan Scholars in Climbing Plan (tspd20210321), the Distinguished Taishan Scholars Plan (tstp20230653), the National Natural Science Foundation of China (82070160, 82370165), the Fundamental Research Funds for the Central Universities (2022JC012), the Independently Cultivate Innovative Teams of Jinan, Shandong Province (2021GXRC050).
Disclosure
The authors declare that the research was conducted in the absence of any commercial or financial relationships that could be construed as a potential conflict of interest.
References
1. DiNardo CD, Erba HP, Freeman SD, et al. Acute myeloid leukaemia. Lancet. 2023;401(10393):2073–22. doi:10.1016/s0140-6736(23)00108-3
2. Döhner H, Wei AH, Löwenberg B. Towards precision medicine for AML. Nat Rev Clin Oncol. 2021;18(9):577–590. doi:10.1038/s41571-021-00509-w
3. Short NJ, Konopleva M, Kadia TM, et al. Advances in the treatment of acute myeloid leukemia: new drugs and new challenges. Cancer Discovery. 2020;10(4):506–525. doi:10.1158/2159-8290.Cd-19-1011
4. Yamashita M, Dellorusso PV, Olson OC, et al. Dysregulated haematopoietic stem cell behaviour in myeloid leukaemogenesis. Nat Rev Cancer. 2020;20(7):365–382. doi:10.1038/s41568-020-0260-3
5. Xu J, Niu T. Natural killer cell-based immunotherapy for acute myeloid leukemia. J Hematol Oncol. 2020;13(1):167. doi:10.1186/s13045-020-00996-x
6. Lichtenegger FS, Krupka C, Haubner S, et al. Recent developments in immunotherapy of acute myeloid leukemia. J Hematol Oncol. 2017;10(1):142. doi:10.1186/s13045-017-0505-0
7. Adrover JM, McDowell SAC, He XY, et al. NETworking with cancer: the bidirectional interplay between cancer and neutrophil extracellular traps. Cancer Cell. 2023;41(3):505–526. doi:10.1016/j.ccell.2023.02.001
8. Papayannopoulos V. Neutrophil extracellular traps in immunity and disease. Nat Rev Immunol. 2018;18(2):134–147. doi:10.1038/nri.2017.105
9. Demers M, Krause DS, Schatzberg D, et al. Cancers predispose neutrophils to release extracellular DNA traps that contribute to cancer-associated thrombosis. Proc Natl Acad Sci USA. 2012;109(32):13076–13081. doi:10.1073/pnas.1200419109
10. Ronchetti L, Boubaker NS, Barba M, et al. Neutrophil extracellular traps in cancer: not only catching microbes. J Experi Clin Cancer Res. 2021;40(1):231. doi:10.1186/s13046-021-02036-z
11. Khan U, Chowdhury S, Billah MM, et al. Neutrophil extracellular traps in colorectal cancer progression and metastasis. Int J Mol Sci. 2021;22(14):7260. doi:10.3390/ijms22147260
12. Xiao Y, Cong M, Li J, et al. Cathepsin C promotes breast cancer lung metastasis by modulating neutrophil infiltration and neutrophil extracellular trap formation. Cancer Cell. 2021;39(3):423–37.e7. doi:10.1016/j.ccell.2020.12.012
13. Teijeira Á, Garasa S, Gato M, et al. CXCR1 and CXCR2 chemokine receptor agonists produced by tumors induce neutrophil extracellular traps that interfere with immune cytotoxicity. Immunity. 2020;52(5):856–71.e8. doi:10.1016/j.immuni.2020.03.001
14. Zhang Y, Chandra V, Riquelme Sanchez E, et al. Interleukin-17-induced neutrophil extracellular traps mediate resistance to checkpoint blockade in pancreatic cancer. J Exp Med. 2020;217(12). doi:10.1084/jem.20190354
15. Jaillon S, Ponzetta A, Di Mitri D, et al. Neutrophil diversity and plasticity in tumour progression and therapy. Nat Rev Cancer. 2020;20(9):485–503. doi:10.1038/s41568-020-0281-y
16. Bottomly D, Long N, Schultz AR, et al. Integrative analysis of drug response and clinical outcome in acute myeloid leukemia. Cancer Cell. 2022;40(8):850–64.e9. doi:10.1016/j.ccell.2022.07.002
17. Cerami E, Gao J, Dogrusoz U, et al. The cBio cancer genomics portal: an open platform for exploring multidimensional cancer genomics data. Cancer Discovery. 2012;2(5):401–404. doi:10.1158/2159-8290.Cd-12-0095
18. Ley TJ, Miller C, Ding L, et al. Genomic and epigenomic landscapes of adult de novo acute myeloid leukemia. New Engl J Med. 2013;368(22):2059–2074. doi:10.1056/NEJMoa1301689
19. Tyner JW, Tognon CE, Bottomly D, et al. Functional genomic landscape of acute myeloid leukaemia. Nature. 2018;562(7728):526–531. doi:10.1038/s41586-018-0623-z
20. Bindea G, Mlecnik B, Tosolini M, et al. Spatiotemporal dynamics of intratumoral immune cells reveal the immune landscape in human cancer. Immunity. 2013;39(4):782–795. doi:10.1016/j.immuni.2013.10.003
21. Charoentong P, Finotello F, Angelova M, et al. Pan-cancer immunogenomic analyses reveal genotype-immunophenotype relationships and predictors of response to checkpoint blockade. Cell Rep. 2017;18(1):248–262. doi:10.1016/j.celrep.2016.12.019
22. Newman AM, Liu CL, Green MR, et al. Robust enumeration of cell subsets from tissue expression profiles. Nature Methods. 2015;12(5):453–457. doi:10.1038/nmeth.3337
23. Aran D, Hu Z, Butte AJ. xCell: digitally portraying the tissue cellular heterogeneity landscape. Genome Biol. 2017;18(1):220. doi:10.1186/s13059-017-1349-1
24. Yoshihara K, Shahmoradgoli M, Martínez E, et al. Inferring tumour purity and stromal and immune cell admixture from expression data. Nat Commun. 2013;4(1):2612. doi:10.1038/ncomms3612
25. Warde-Farley D, Donaldson SL, Comes O, et al. The GeneMANIA prediction server: biological network integration for gene prioritization and predicting gene function. Nucleic Acids Res. 2010;38(suppl_2):W214–20. doi:10.1093/nar/gkq537
26. Wu J, Zhang F, Zheng X, et al. Identification of renal ischemia reperfusion injury subtypes and predictive strategies for delayed graft function and graft survival based on neutrophil extracellular trap-related genes. Front Immunol. 2022;13:1047367. doi:10.3389/fimmu.2022.1047367
27. Li Z, Herold T, He C, et al. Identification of a 24-gene prognostic signature that improves the European LeukemiaNet risk classification of acute myeloid leukemia: an international collaborative study. J Clin Oncol. 2013;31(9):1172–1181. doi:10.1200/jco.2012.44.3184
28. Ng SW, Mitchell A, Kennedy JA, et al. A 17-gene stemness score for rapid determination of risk in acute leukaemia. Nature. 2016;540(7633):433–437. doi:10.1038/nature20598
29. Silvestre-Roig C, Braster Q, Wichapong K, et al. Externalized histone H4 orchestrates chronic inflammation by inducing lytic cell death. Nature. 2019;569(7755):236–240. doi:10.1038/s41586-019-1167-6
30. Saffarzadeh M, Juenemann C, Queisser MA, et al. Neutrophil extracellular traps directly induce epithelial and endothelial cell death: a predominant role of histones. PLoS One. 2012;7(2):e32366. doi:10.1371/journal.pone.0032366
31. Jorch SK, Kubes P. An emerging role for neutrophil extracellular traps in noninfectious disease. Nature Med. 2017;23(3):279–287. doi:10.1038/nm.4294
32. Yang L, Liu Q, Zhang X, et al. DNA of neutrophil extracellular traps promotes cancer metastasis via CCDC25. Nature. 2020;583(7814):133–138. doi:10.1038/s41586-020-2394-6
33. Yang D, Liu J. Neutrophil extracellular traps: a new player in cancer metastasis and therapeutic target. J Experi Clin Cancer Res. 2021;40(1):233. doi:10.1186/s13046-021-02013-6
34. Yazdani HO, Roy E, Comerci AJ, et al. Neutrophil extracellular traps drive mitochondrial homeostasis in tumors to augment growth. Cancer Res. 2019;79(21):5626–5639. doi:10.1158/0008-5472.Can-19-0800
35. Feng C, Li Y, Tai Y, et al. A neutrophil extracellular traps-related classification predicts prognosis and response to immunotherapy in colon cancer. Sci Rep. 2023;13(1):19297. doi:10.1038/s41598-023-45558-6
36. Zhang Y, Guo L, Dai Q, et al. A signature for pan-cancer prognosis based on neutrophil extracellular traps. J ImmunoTherapy Cancer. 2022;10(6):e004210. doi:10.1136/jitc-2021-004210
37. Shen XT, Xie SZ, Xu J, et al. Pan-cancer analysis reveals a distinct neutrophil extracellular trap-associated regulatory pattern. Front Immunol. 2022;13:798022. doi:10.3389/fimmu.2022.798022
38. Valayer A, Brea D, Lajoie L, et al. Neutrophils can disarm NK cell response through cleavage of NKp46. J Leukocyte Biol. 2017;101(1):253–259. doi:10.1189/jlb.3AB0316-140RR
39. Guimarães-Costa AB, Rochael NC, Oliveira F, et al. Neutrophil extracellular traps reprogram IL-4/GM-CSF-induced monocyte differentiation to anti-inflammatory macrophages. Front Immunol. 2017;8:523. doi:10.3389/fimmu.2017.00523
40. Tawara I, Kageyama S, Miyahara Y, et al. Safety and persistence of WT1-specific T-cell receptor gene-transduced lymphocytes in patients with AML and MDS. Blood. 2017;130(18):1985–1994. doi:10.1182/blood-2017-06-791202
41. Zou W, Wolchok JD, Chen L. PD-L1 (B7-H1) and PD-1 pathway blockade for cancer therapy: mechanisms, response biomarkers, and combinations. Sci Trans Med. 2016;8(328):328rv4. doi:10.1126/scitranslmed.aad7118
42. Chen DS, Mellman I. Oncology meets immunology: the cancer-immunity cycle. Immunity. 2013;39(1):1–10. doi:10.1016/j.immuni.2013.07.012
43. de Andrea CE, Ochoa MC, Villalba-Esparza M, et al. Heterogenous presence of neutrophil extracellular traps in human solid tumours is partially dependent on IL-8. J Pathol. 2021;255(2):190–201. doi:10.1002/path.5753
44. Kaltenmeier C, Yazdani HO, Morder K, et al. Neutrophil extracellular traps promote T cell exhaustion in the tumor microenvironment. Front Immunol. 2021;12:785222. doi:10.3389/fimmu.2021.785222
45. Kovacic B, Hoelbl-Kovacic A, Fischhuber KM, et al. Lactotransferrin-Cre reporter mice trace neutrophils, monocytes/macrophages and distinct subtypes of dendritic cells. Haematologica. 2014;99(6):1006–1015. doi:10.3324/haematol.2013.097154
46. Liu H, Lin S, Chen PX, et al. Integrated bioinformatics analysis to develop diagnostic models for malignant transformation of chronic proliferative diseases. Blood Sci. 2025;7(2):e00226. doi:10.1097/bs9.0000000000000226
47. Zhang W, Liu B, Wu S, et al. TMT-based comprehensive proteomic profiling identifies serum prognostic signatures of acute myeloid leukemia. Open Med. 2023;18(1):20220602. doi:10.1515/med-2022-0602
48. Oberg G, Dahl R, Ellegaard J, et al. Diagnostic and prognostic significance of serum measurements of lactoferrin, lysozyme and myeloperoxidase in acute myeloid leukemia (AML): recognition of a new variant, high-lactoferrin AML. Eur J Haematol. 1987;38(2):148–155. doi:10.1111/j.1600-0609.1987.tb01154.x
49. Liu X, Wang Z, Liu M, et al. Identification of LTF as a prognostic biomarker for osteosarcoma. J Oncol. 2022;2022:4656661. doi:10.1155/2022/4656661
50. Hu T, Cheng B, Matsunaga A, et al. Single-cell analysis defines highly specific leukemia-induced neutrophils and links MMP8 expression to recruitment of tumor associated neutrophils during FGFR1 driven leukemogenesis. Exp Hematol Oncol. 2024;13(1):49. doi:10.1186/s40164-024-00514-6
51. Ni L, Yuan C, Zhang C, et al. Co-expression network analysis identified LTF in association with metastasis risk and prognosis in clear cell renal cell carcinoma. Onco Targets Ther. 2020;13:6975–6986. doi:10.2147/ott.S251000
52. Zhang W, Fan S, Zou G, et al. Lactotransferrin could be a novel independent molecular prognosticator of nasopharyngeal carcinoma. Tumour Biol. 2015;36(2):675–683. doi:10.1007/s13277-014-2650-1
53. Au-Yeung CL, Yeung TL, Achreja A, et al. ITLN1 modulates invasive potential and metabolic reprogramming of ovarian cancer cells in omental microenvironment. Nat Commun. 2020;11(1):3546. doi:10.1038/s41467-020-17383-2
54. Kruzel ML, Zimecki M, Actor JK. Lactoferrin in a context of inflammation-induced pathology. Front Immunol. 2017;8:1438. doi:10.3389/fimmu.2017.01438
55. Dong H, Yang Y, Gao C, et al. Lactoferrin-containing immunocomplex mediates antitumor effects by resetting tumor-associated macrophages to M1 phenotype. J ImmunoTherapy Cancer. 2020;8(1):e000339. doi:10.1136/jitc-2019-000339
56. Dawson A, Zarou MM, Prasad B, et al. Leukaemia exposure alters the transcriptional profile and function of BCR::ABL1 negative macrophages in the bone marrow niche. Nat Commun. 2024;15(1):1090. doi:10.1038/s41467-024-45471-0
57. Zhang R, Kang R, Tang D. Ferroptosis in gastrointestinal cancer: from mechanisms to implications. Cancer Lett. 2023;561:216147. doi:10.1016/j.canlet.2023.216147
58. Moseley CE, Zamvil SS. Targeting PGLYRP1 in cancer and autoimmunity. Nat Immunol. 2023;24(11):1785–1786. doi:10.1038/s41590-023-01649-0
59. Wen J, Zheng W, Zeng L, et al. LTF induces radioresistance by promoting autophagy and forms an AMPK/SP2/NEAT1/miR-214-5p feedback loop in lung squamous cell carcinoma. Int J Bio Sci. 2023;19(5):1509–1527. doi:10.7150/ijbs.78669
60. Tabata R, Chi S, Yuda J, et al. Emerging immunotherapy for acute myeloid leukemia. Int J Mol Sci. 2021;22(4):1944. doi:10.3390/ijms22041944
61. Uy GL, Aldoss I, Foster MC, et al. Flotetuzumab as salvage immunotherapy for refractory acute myeloid leukemia. Blood. 2021;137(6):751–762. doi:10.1182/blood.2020007732
62. Baumeister SH, Murad J, Werner L, et al. Phase I trial of autologous CAR T cells targeting NKG2D ligands in patients with AML/MDS and multiple myeloma. Cancer Immunol Res. 2019;7(1):100–112. doi:10.1158/2326-6066.Cir-18-0307
 © 2026 The Author(s). This work is published and licensed by Dove Medical Press Limited. The
full terms of this license are available at https://www.dovepress.com/terms
and incorporate the Creative Commons Attribution
- Non Commercial (unported, 4.0) License.
By accessing the work you hereby accept the Terms. Non-commercial uses of the work are permitted
without any further permission from Dove Medical Press Limited, provided the work is properly
attributed. For permission for commercial use of this work, please see paragraphs 4.2 and 5 of our Terms.
© 2026 The Author(s). This work is published and licensed by Dove Medical Press Limited. The
full terms of this license are available at https://www.dovepress.com/terms
and incorporate the Creative Commons Attribution
- Non Commercial (unported, 4.0) License.
By accessing the work you hereby accept the Terms. Non-commercial uses of the work are permitted
without any further permission from Dove Medical Press Limited, provided the work is properly
attributed. For permission for commercial use of this work, please see paragraphs 4.2 and 5 of our Terms.
Recommended articles
Comprehensive Analysis Reveals Distinct Immunological and Prognostic Characteristics of CD276/B7-H3 in Pan-Cancer
Ding J, Sun Y, Sulaiman Z, Li C, Cheng Z, Liu S
International Journal of General Medicine 2023, 16:367-391
Published Date: 2 February 2023
Clinical Characteristics and Prognosis of Acute Myeloid Leukemia Patients with Protein Tyrosine Phosphatase Non-Receptor Type 11 Gene Mutation

Huang R, Zhang YT, Lin Y, Pang RL, Yang Z, Zhao WH
Pharmacogenomics and Personalized Medicine 2023, 16:1011-1026
Published Date: 11 November 2023
Increased Co-Expression of PD-L1 and CTLA-4 Predicts Poor Overall Survival in Patients with Acute Myeloid Leukemia Following Allogeneic Hematopoietic Stem Cell Transplantation
Chen C, Qiu K, Chen J, Wang S, Zhang Y, Wang C, Li Y
ImmunoTargets and Therapy 2025, 14:25-33
Published Date: 20 January 2025
Neutrophil Extracellular Traps Enhance Procoagulant Activity and Predict Poor Prognosis in Patients With Metastatic Breast Cancer
Gong Y, Chen B, Tan Q, Wei W
International Journal of General Medicine 2025, 18:1247-1259
Published Date: 4 March 2025
A Pyroptosis-Related LncRNA Signature for Predicting Prognosis, Immune Features and Drug Sensitivity in Ovarian Cancer
Liu PW, Liu ZY, Deng SJ, Zhang X, Wang ZB, Wu NY, Liu CS, Hu MH, Wang J, Li H
OncoTargets and Therapy 2025, 18:585-601
Published Date: 23 April 2025