Back to Journals » International Journal of General Medicine » Volume 16
Comprehensive Analysis Reveals Distinct Immunological and Prognostic Characteristics of CD276/B7-H3 in Pan-Cancer
Authors Ding J, Sun Y, Sulaiman Z, Li C, Cheng Z , Liu S
Received 31 October 2022
Accepted for publication 23 January 2023
Published 2 February 2023 Volume 2023:16 Pages 367—391
DOI https://doi.org/10.2147/IJGM.S395553
Checked for plagiarism Yes
Review by Single anonymous peer review
Peer reviewer comments 2
Editor who approved publication: Dr Scott Fraser
Jinye Ding,1 Yaoqi Sun,1 Zubaidan Sulaiman,1 Caixia Li,1,2 Zhongping Cheng,1,2 Shupeng Liu1,2
1Department of Obstetrics and Gynecology, Shanghai Tenth People’s Hospital, School of Medicine, Tongji University, Shanghai, People’s Republic of China; 2Institute of Gynecological Minimally Invasive Medicine, School of Medicine, Tongji University, Shanghai, People’s Republic of China
Correspondence: Zhongping Cheng; Shupeng Liu, Email [email protected]; [email protected]
Background: CD276 (also known as B7-H3), a newly discovered immunoregulatory protein that belongs to the B7 family, is a significant and attractive target for cancer immunotherapy. Existing evidence demonstrates its pivotal role in the tumorigenesis of some cancers. However, there still lacks a systematic and comprehensive pan-cancer analysis of the role of CD276 in tumor immunology and prognosis.
Methods: We explored and validated the mRNA and protein expression levels of CD276 in multiple tumors through public databases and clinical tissues specimens. The Univariate Cox regression analysis and Kaplan–Meier analysis were applied to assess the prognostic value of CD276. The correlation between CD276 expression and clinical characteristics and immunological features in diverse tumors was also explored. GSEA was performed to illuminate the biological function and involved pathways of CD276. Moreover, the CellMiner database was used to interpret the relationship between CD276 and multiple chemotherapeutic agents. CCK-8 assay was performed to validate the biological function of CD276 in vitro.
Results: In general, CD276 was differentially expressed between most tumor tissues and their corresponding normal tissues. Higher expression levels of CD276 were associated with poorer survival outcomes in most tumor cohorts from TCGA. There was a close correlation between CD276 expression and clinical features, the infiltration levels of specific immune cells, immune subtypes, TMB, MSI, MMR, recognized immunoregulatory genes and drug sensitivity across diverse human cancers. The scRNA-seq data analysis further revealed that CD276 was mainly expressed on the tumor infiltrating macrophages. Additionally, in vitro experiments showed that knockdown of CD276 inhibited the proliferation of ovarian cancer (OV) and cervical squamous cell carcinoma and endocervical adenocarcinoma (CESC) cell lines.
Conclusion: CD276 is a potent biomarker for predicting the prognosis and immunological features in some tumors, and it may play a critical role in the tumor immune microenvironment (TIME) through macrophage-associated signaling.
Keywords: B7-H3/CD376, pan-cancer, prognosis, immune microenvironment, immunotherapy
Introduction
A hallmark of cancer cells is to evade immune eradication. Tumor cells achieve an endless evolution according to the external stimulus and exploit immune checkpoints to dampen T-cell reactivity.1 Based on these findings, immune checkpoint inhibitor (ICI) therapy, emerging to enable T-cell reactivation has brought a breakthrough in the solid tumor treatment.2 Several inhibitors targeting PD-1/PD-L1 or CTLA4 have been applied in the clinical treatment of tumors. However, most patients have no response to current immunotherapy or acquire resistance after the initial treatment.3 An overall response rate (ORR) of ICI monotherapy is relatively modest (15–20%) even though some patients could achieve complete remission. Therefore, it is of great need to explore a new immune checkpoint, which could enhance the ORR of immunotherapy and achieve a better therapeutic outcome.
CD276 is a newly found immune checkpoint molecule that belongs to B7 family,4 which shares up to 30% amino acid identity with PD-L15. Compared with normal tissues, CD276 is upregulated in most tumor tissues, including glioma, breast cancer and non-small cell lung cancer.6 Existing evidence demonstrates that CD276 functions as a co-inhibitory/co-stimulatory immune signal in regulating immune cell function.7,8 CD276 suppressed the proliferation of CD4+ and CD8+ T cells and inhibited the activity of NK cells.9,10 Recently, Wang et al reported that CD276 was hijacked by cancer stem cells (CSCs) to evade immune surveillance in head and neck squamous carcinoma (HNSC).11 Furthermore, it also showed that CD276 targeting Fc-optimized antibody was able to elicit the reactivity of NK cells against sarcoma.12 In addition, chimeric antigen receptor T cells targeting CD276 (CD276. CAR-Ts) exerted the anti-tumor effects with no apparent toxicity in pancreatic ductal adenocarcinoma, ovarian cancer and neuroblastoma.13 Especially, intraventricular CD276-specific CAR-T cells could be used to treat diffuse intrinsic pontine glioma and they preliminary exhibited favorable bioactivity and safety.14 CD276 was also able to enhance the activity of cytotoxic T cells in the presence of the anti-CD3 antibody.15 For example, Lupu et al reported that CD276 transformed naïve T cells into armed tumor-specific effector T cells to suppress the tumor growth and metastasis in colorectal adenocarcinoma mouse models.16 Existing study also demonstrated that patients with higher CD276 expression owned a better postoperative survival outcome in a study involving 68 pancreatic cancer patients.17 So far, no corroboratory ligands or receptors of CD276 have been reported, which greatly limits its use in large-scale clinical trials.18 In general, CD276 is a remarkable immunoregulatory protein and its underlying mechanism in various cancer immunity deserves further investigation.
To obtain a systematic and comprehensive understanding on the immunological and prognostic role of CD276 in pan-cancer, we assessed the different expression levels of CD276 and analyzed its correlation with the prognosis of patients across 34 human cancers in this study. RT-qPCR and IHC assay were applied to verify the mRNA and protein levels of CD276 in OV and CESC clinical tissue samples. The associations between CD276 expression levels with clinical characteristics, immune cell infiltration, immunoregulatory genes, immune subtypes, TMB, MSI, MMR, and drug sensitivity were evaluated using transcriptomic data by bioinformatics analyses. The immuno-logical role of CD276 in the TIME was further explored at single-cell level. Additionally, the biological pathways, which CD276 potentially involved in, were also assessed via the gene set enrichment analysis (GSEA). Finally, we briefly explored the biological role of CD276 in OV and CESC cell lines. In conclusion, our results indicate that CD276 is a promising immunological and prognostic biomarker in multiple human cancers. It may function in the TIME through macrophages-associated signaling.
Methods
Acquirement of Datasets and Data Processing
The RNA sequencing and related clinical data of TCGA and GTEx were downloaded from the University of California Santa Cruz (UCSC, https://xenabrowser.net/) database. The data of some tumors missing from TCGA were obtained from the Therapeutically Applicable Research To Generate Effective Treatments (TARGET, https://ocg.cancer.gov/programs/target).19 Based on the Gene Expression database of Normal and Tumor tissues (GENT2, http://gent2.appex.kr/gent2/), CD276 mRNA expression data of 34 cancer types and their normal controls from GEO were also acquired to verify the results in TCGA. To obtain the normalized expression data, the CD276 expression value in each sample was performed log2 transformation. Data from 30 cancer cell lines were obtained from the CCLE database (https://portals.broadinstitute.org/ccle/).
Clinical Samples
Tumor tissues from 16 patients with OV and 13 patients with CESC in our hospital were collected. Each of these tissues had matched normal samples for control. Ten pairs of OV and five pairs of CESC samples were used for RT-qPCR analysis. The remaining tumor tissue samples were used for IHC analysis. This study was approved by the Ethics Committee of Shanghai Tenth People’s Hospital Health Authority (SHSY-ICE-5.0/22K76/P01).
Differential Expression Analysis
The mRNA expression levels of CD276 were explored in 34 human cancers, 30 normal tissues, and 30 cancer cell lines from TCGA and GEO, GTEx, and CCLE databases, respectively. R software (Version 4.2.0) was used to calculate the expression differences between tumor samples and corresponding normal samples across 34 cancers. The statistical methods applied in this process were unpaired Wilcoxon Rank Sum and Signed Rank Tests. P < 0.05 was considered statistically significant. The differences of CD276 at protein levels in normal tissues and six tumor tissues were evaluated via The Human Protein Atlas (HPA: https://www.proteinatlas.org/) database.
RNA Extraction and Reverse Transcription qPCR
Total RNA was extracted from OV and CESC tissues and cell lines using Trizol reagent (TaKaRa, China). Subsequently, RT-qPCR was performed using the PrimeScript RT Master Mix (#RR036A, TaKaRa, China) and TB Green Premix Ex Taq (#RR820A, TaKaRa, China) by the QuantStudioDx Real-Time PCR system (ThermoScientific, USA). The relative mRNA expression levels were calculated by the 2-ΔΔCt method. The primers used were as follows: CD276: forward: CAGGGCAGCCTATGACATTC and reverse: CCTCACAGCTCTGTTTGATCTT; and GAPDH: forward: GTCGGAGTCAACGGATTTGG and reverse: CGGTGCCATGGAATTTGCC.
Immunohistochemical Staining and Analysis
Immunohistochemistry was conducted according to the protocol in the previously published literature.20 B7-H3 monoclonal antibody (#66481-1-Ig, Proteintech, China) was used to detect the protein expression in tumor tissues and their corresponding normal controls. Images were captured at 100x and 400x magnification, and three fields of view per sample were randomly selected to assess the intensity of protein staining by Image J software. H-score (H-score= [1*(% of cells 1+) + 2*(% of cells 2+) + 3*(% of cells 3+)], 1 = lack or weak expression, 2 = moderate expression, 3 = strong expression) was applied to quantify the IHC images.21
Survival and Prognostic Analysis
Most of the survival data originated from TCGA. Besides, the high-quality prognostic data of TCGA from the published studies was added.22 The follow-up data in some samples shorter than 30 days was excluded and the follow-up data supplement of the TARGET database was obtained. Finally, data including overall survival (OS), disease-specific survival (DSS), disease-free interval (DFI), and progression-free interval (PFI) were selected to analyze the correlation between CD276 expression and the prognosis of cancer patients. The R package “survival” and “forestplot” were applied to establish the Cox proportional hazards regression model and performed the Univariate Cox analysis. The survival analysis in each tumor type was performed by the Kaplan–Meier method and Log rank test (P < 0.05). The optimal cutoff value of CD276 expression calculated by R package “maxstat” was applied.
Analysis of the Correlations Between CD276 Expression and Clinical Features
The size of primary tumor, tumor stage and molecular subtypes as three clinical characteristics were selected to investigate their association with CD276 expression. R software (version 4.2.0) was used to calculate the CD276 expression in the tumor samples with different clinical stages. CD276 expression in diverse molecular subtypes was also analyzed on The Integrated Repository Portal for Tumor-Immune System Interactions (TISIDB, http://cis.hku.hk/TISIDB/index.php).23 The differential expression analysis was conducted by unpaired T-test and ANOVA.
Relationships of CD276 Expression Levels with Significant Immune Characteristics
According to the data from the Tumor Immune Evaluation Resource (TIMER, https://cistrome.shinyapps.io/timer) database,24 the infiltration levels of six types of immune cells (contains B cells, CD4(+) T cells, CD8(+) T cells, Neutrophils, macrophages and dendritic cells (DCs)) across 38 cancers were systematically studied. The correlation coefficient between CD276 expression and immune infiltration scores was assessed by Spearman correlation analysis, which was calculated through the R package “psych”. The relationships between CD276 and the subtypes of 22 immunocytes were further explored through CIBERSOR analysis. In addition, StromalScore, ImmueScore and EstimateScore were evaluated in various human cancers via the R package “estimate”. Similarly, Spearman correlation analysis was performed to determine the correlation of CD276 expression with StromalScore, ImmueScore and EstimateScore. Finally, we carried on a co-expression analysis of CD276 and recognized immune checkpoint genes, immune-related genes via the R package “limma”. The immune-regulated genes contained immune-stimulators, immune-inhibitors, MHC genes, chemokine and chemokine receptor proteins. CD276 expression immune subtypes was also analyzed on TISIDB. The single-cell TIME portal (scTIME, http://scTIME.sklehabc.com) was used to explore and analyze the correlation between CD276 and TME at the single-cell level.25 GSE114725 (breast invasive carcinoma (BRCA)), GSE127465 (NSCLC) and GSE115007 (OV) datasets were chosen to assess the association above.
Analysis of the Correlations with TMB, MSI and MMR in Pan-Cancer
TMB is an immune-response biomarker that refers to total mutation number in cancer cells. The R package “maftools” was used to calculate the number of exons mutations to determine the TMB in each tumor type. MSI is caused by functional deficiency of DNA mismatch repair in tumor tissues. The MSI scores were obtained from TCGA database and published research.26 DNA mismatch repair (MMR) corrects the base-base mispairs generated during the process of DNA replication. The expression levels of five MMR genes which contained PMS2, MLH1, MSH2, MSH6, and EPCAM were acquired from TCGA database. Spearman correlation analysis method was applied to explore the association between CD276 and TMB, MSI, MMR.
Gene Set Enrichment Analysis (GSEA)
CD276 expression file was interpreted using TCGA data. Hallmarks, Kyoto Encyclopedia of Genes and Genomes (KEGG), and Immunologic signatures gene sets were downloaded from GSEA software. Enrichment analysis was performed through the R-packages “clusterProfiler”, “biomaRt”, “org.Hs.eg.db” and “enrichplot” with the following parameters: nPerm = 1000, minGSSize = 10, maxGSSize = 1000 and p-value cutoff = 1.
Potential Sensitive Drug Prediction of CD276
CD276 mRNA expression profile and NCI-60 compound activity data were obtained from the CellMiner database (https://discover.nci.nih.gov/cellminer/home.do).27,28 The compounds approved by FDA or clinical trials were selected for the drug sensitivity analysis. The drug sensitivity was evaluated through the Pearson correlation coefficient between CD276 expression levels and 50% growth-inhibitory level (IC50) of the drug in diverse cancer cell lines. The drugs with the top 8 positive and negative correlation coefficients were selected using the R package “Hmisc” (P < 0.05).
Cell Culture
Two human ovarian cancer cell lines (A2780, SKOV3), a human cervical adenocarcinoma cell line (Hela) and a human cervical squamous cell carcinoma cell line (Siha) were obtained from the American Type Culture Collection (ATCC, USA).29–32 A2780 and SKOV3 cell lines were maintained in RMPI 1640 medium (Gibco, USA) supplemented with 10% FBS (Biological Industries, Israel). Hela cell lines were cultured in the DMEM medium (Gibco, USA) enriched with 10% FBS. And Siha cell lines were maintained in MEM medium (Gibco, USA) supplemented with 10% FBS. All the cell lines were cultured under the condition of 37°C and 5% CO2.
siRNA Transfection
Small interfering RNA (siRNA) targeting CD276 was synthesized by Genomeditech (Shanghai, China). The si-NC, si-CD276-1 and si-CD276-2 were, respectively, transfected into A2780, SKOV3, Hela and Siha cells with lipofectamine 3000 (Invitrogen, Carlsbad, USA). siRNA was used at a concentration of 100nM. All of the above procedures were operated according to the records in the manual provided by the manufacturer. Knockdown efficiency of siRNA was detected by qPCR.
CCK-8 Assay
The effect of CD276 knockdown on the proliferation of A2780, SKOV3, Hela and Siha cells was evaluated by CCK-8 assay. After 48 hours of cell transfection, a certain number of cells were seeded into 96-well plates and cultured for 24, 48 and 72 hours. Subsequently, 10ul/well CCK-8 solution was added to each well and incubated for 3 hours. The OD value of each well was measured at 450nm by the Spectrophotometer.
Statistical Analysis
All the RNA sequencing and related clinical data were normalized by log2 transformation. P < 0.05 was considered statistically significant. The statistical analysis in vitro experiments was operated in the GraphPad Prism V9.4.1. Student’s t-test or one-way anova was applied to analyze the differences of the data.
Results
Differential Expression of CD276 Between Human Normal and Cancerous Tissues
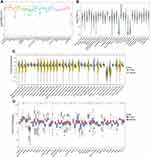
Firstly, the expression levels of CD276 were investigated in 30 normal tissues from the GTEx database. We found that CD276 was expressed relatively higher in the cervix uteri, adipose and prostate tissues, while it was relatively lower in brain, muscle and blood (Figure 1A). Then, CD276 expression in 30 tumor cell lines was analyzed according to the data from CCLE database. It showed that CD276 was differentially expressed among tumor cell lines (Figure 1B). Further, the CD276 expression in 34 tumors and their corresponding normal tissues was explored using TCGA, GTEx and TARGET databases. Except for in acute lymphoblastic leukemia (ALL), CD276 expression levels were significantly higher in tumors than in their normal controls in most tumor types, such as glioblastoma multiforme (GBM), uterine corpus endometrial carcinoma (UCEC), BRCA, lung adenocarcinoma (LUAD) and esophageal carcinoma (ESCA). There were no significant differences of CD276 expression between CESC, pheochromocytoma and paraganglioma (PCPG) and their normal controls (Figure 1C). The similar expression pattern was also observed in the validation analysis using GEO database (Figure 1D). For example, as shown in Figure 1D, CD276 was upregulated in the tumor tissues of brain, breast and lung compared with their normal controls.
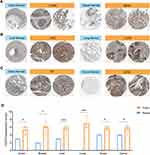
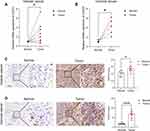
In addition, we also evaluated the CD276 expression at protein levels. The IHC images of six tumors (colon, breast, liver, lung, ovary and cervix) and related normal tissues were downloaded from the HPA database. Moderate or strong staining of CD276 were observed in tumors while no or weak staining in normal tissues (Figure 2A–C). H-score was higher in tumors than in corresponding normal tissues (Figure 2D, Supplementary Table 1). The results of the remaining tumors are presented in Supplementary Figure 1 and Supplementary Table 2. To further validate the expression levels of CD276 in tumor tissues, we collected the clinical specimens of OV and CESC for RT-qPCR and IHC experiments. The results of RT-qPCR showed that the relative mRNA levels of CD276 in OV (n = 10) were higher than in normal controls (Figure 3A). Significant differences were observed in the mRNA expression levels of CD276 between CESC (n = 5) and the matched normal tissues (Figure 3B). Moreover, IHC analysis demonstrated that the protein expression levels of CD276 in OV and CESC were significantly higher than in their corresponding normal controls (Figure 3C and D). Taken together, these findings revealed that the mRNA and protein levels of CD276 were elevated in most tumors.
Prognostic Value of CD276 in Diverse Human Cancers
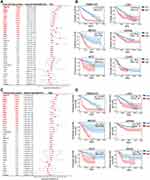
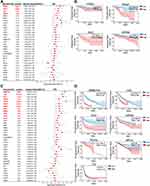
To investigate the prognostic value of CD276, we performed the univariate Cox regression analysis and survival analysis in pan-cancer. The univariate Cox regression analysis showed that CD276 was a high-risk factor for the overall survival (OS) in glioma (GBMLGG), brain lower grade glioma (LGG), mesothelioma (MESO), pan-kidney cohort (KICH+KIRC+KIRP) (KIPAN), adrenocortical carcinoma (ACC), LUAD, GBM, liver hepatocellular carcinoma (LIHC), bladder urothelial carcinoma (BLCA), BRCA, HNSC, uveal melanoma (UVM), pancreatic adenocarcinoma (PAAD), kidney renal papillary cell carcinoma (KIRP) and acute myeloid leukemia (LAML) (Figure 4A). Patients with lower expression of CD276 had longer OS than those with higher expression levels (Figure 4B, Supplementary Figure 2A). To avoid the deviation that people did not die from specific cancer, the correlation between CD276 expression and disease-specific survival (DSS) analysis was analyzed. It showed that CD276 was a risk factor for the DSS in GBMLGG, LGG, MESO, KIPAN, ACC, PAAD, BRCA, KIRP, HNSC, GBM, UVM, stomach and esophageal carcinoma (STES), BLCA and LUAD (Figure 4C). Patients with higher expression levels of CD276 owned shorter DSS than those with lower expression levels (Figure 4D, Supplementary Figure 2B). Next, the disease-free interval (DFI) analysis was performed and it uncovered that CD276 was a high-risk gene in prostate adenocarcinoma (PRAD), PAAD, ACC and KIPAN (Figure 5A). Higher CD276 expression levels were significantly correlated with the worse survival outcomes of patients in PRAD, PAAD, ACC and KIPAN (Figure 5B). Besides, the progression-free interval (PFI) analysis showed that CD276 functioned as a risk factor in GBMLGG, LGG, ACC, KIPAN, pheochromocytoma and paraganglioma (PCPG), BRCA, PRAD, GBM, MESO, UVM, PAAD and BLCA, while it was a protective factor in OV (Figure 5C). The survival curves of PFI manifested that increased expression levels of CD276 were associated with shorter PFI in GBMLGG, LGG, ACC, KIPAN, PCPG, BRCA, PRAD, GBM, MESO, UVM, PAAD and BLCA, except for in OV (Figure 5D, Supplementary Figure 2C). The results above showed that CD276 expression was associated with the prognosis of diverse cancers.
Correlation of CD276 Expression Levels with Clinical Features in Pan-Cancer
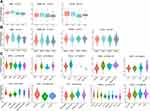
Next, we analyzed the correlation between CD276 levels and clinical features including the size of primary tumor, tumor stage and molecular subtypes in different types of tumors. CD276 levels were significantly correlated with the size of primary tumor in GBM, GBMLGG and thymoma (THYM). In these tumors, CD276 expression levels were downregulated from T1 to T2 (Figure 6A). We also found that the expression levels of CD276 were closely relevant to tumor stage in tumors such as GBM, GBMLGG, KIPAN and thyroid carcinoma (THCA) (Figure 6B). There were significant differences in CD276 expression between stage I and IV in GBM, GBMLGG and KIPAN. The decreased expression of CD276 was observed from stage I to IV in these tumors (Figure 6B). A significant difference of CD276 expression between stage I and II was found in THCA (Figure 6B). The correlation of CD276 expression with tumor stages and the size of primary tumors in other cancer types are presented in Supplementary Figure 3A and B. Furthermore, the expression levels of CD276 in different molecular subtypes among various human cancers were analyzed. The results suggested that the expression pattern of CD276 was significantly different among molecular subtypes in BRCA, colon adenocarcinoma (COAD), ESCA, HNSC, KIRP, LGG, LIHC, OV, PRAD and UCEC (Figure 6C). No difference was observed in ACC, rectum adenocarcinoma (READ), GBM, lung squamous cell carcinoma (LUSC), skin cutaneous melanoma (SKCM) and stomach adenocarcinoma (STAD) (Supplementary Figure 3C). These findings indicated that there was a close correlation between CD276 expression and the clinical characteristics.
Correlation of CD276 Expression Levels with Tumor Immune Microenvironment
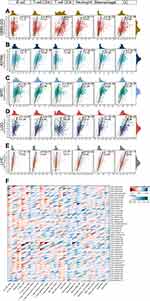
It is well known that solid tumor tissues include not only tumor cells but also infiltrating immune and stromal cells.33 There is a close interaction among those cells and they create the complex TIME. Tumor purity refers to the percentage of tumor cells in the tumor tissues, which depends on the abundance of stromal cells and immune cells. In addition, tumor purity reflects the characteristics of TIME.34 To explore whether CD276 plays an important role in TIME, we evaluated the correlation between CD276 levels and tumor purity based on Estimate algorithm. The Estimate algorithm is capable of predicting the tumor purity and it presents in three scores including StromalScore, ImmuneScore and EstimateScore. EstimateScore is the sum of StromalScore and ImmuneScore. We observed that the expression levels of CD276 were positively related to StromalScore, ImmuneScore and EstimateScore in GBMLGG, LGG, COAD and THCA, while it was negatively correlated with StromalScore and ImmuneScore in THYM (Figure 7). The results of the remaining tumors were presented in the Supplementary Figures 4–6. These results suggested that CD276 played a critical role in TIME. Next, to further understand the potential effects of CD276 in TIME, we investigated the relationships between CD276 expression and the infiltration levels of specific immune cells. The results from the TIMER database showed that CD276 levels were positively correlated with infiltration of B cells, CD4+ T cells, CD8+ T cells, neutrophils, macrophages and dendritic cells (DCs) in most tumor types, including GBMLGG, KIPAN, kidney renal clear cell carcinoma (KIRC), LGG and LIHC (Figure 8A–E). A strong negative correlation between CD276 expression and B cells, CD4+ T cells, CD8+ T cells and DCs were observed in thymoma (THYM) (Supplementary Figure 7). CIBERSORT database was used for further verification. CD276 levels were negatively correlated with infiltrating memory B cells and plasma cells, while positively associated with M0 Macrophages and M2 Macrophages in several tumor types such as SKCM, OV and sarcoma (SARC) (Figure 8F). It was worth mentioning that there was a remarkable negative correlation between CD276 levels and CD8+ T cells in HNSC and cholangiocarcinoma (CHOL), while data from TIMER did not exhibit the results (Figure 8F, Supplementary Figure 7).
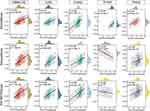 |
Figure 7 Association between CD276 expression and StromalScore, ImmuneScore and EsimateScore in GBMLGG, LGG, COAD, THYM and THCA. |
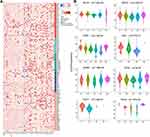
Furthermore, we analyzed the correlations between CD276 expression levels and immune characteristics including 41 chemokines, 18 chemokine receptors, 21 MHC genes, 24 immunosuppressive genes, 45 immune-activating genes and immune subtypes across cancers. Obviously, in CHOL, testicular germ cell tumors (TGCT) and THYM, there was a strong negative correlation between CD276 expression levels and HLA-DOB, BTLA, CD27, CD40LG and LTA. However, the five immune-related genes mentioned above were significantly positively correlated with CD276 levels in GBMLGG, LGG, colon adenocarcinoma/rectum adenocarcinoma (COADREAD), OV, LIHC, KIPAN and KIRC. Further, we observed that a majority of immune-related genes were positively related with CD276 expression in THCA, READ, COADREAD, OV, COAD, kidney chromophobe (KICH), PAAD, PCPG, LIHC, BLCA, KIPAN and KIRC (Figure 9A). No significant difference was found between CD276 expression levels and CCL17, CD48, CD27, CD40LG, KLRK1 and TNFRSF13B in KIRP, BRCA, STAD, SARC, LAML, uterine carcinosarcoma (UCS), PRAD, UCEC and MESO.
To further explore the correlation between CD276 levels and tumor immunity, we interpreted the expression pattern of CD276 in different immune subtypes across diverse human cancers. Thorsson et al established six immune subtypes which were closely related with the immune profiles of different tumors.35 CD276 was expressed differentially among different immune subtypes in BLCA, LGG, BRCA, STAD, KIRC, CESC, ESCA, GBM, THCA, KIRP, TGCT and SARC (Figure 9B, Supplementary Figure 8). No difference of CD276 levels among different immune subtypes was found in ACC, COAD, CHOL, HNSC, KICH, SKCM, UVM, UCEC and UCS (Supplementary Figure 8). In general, these results suggested that CD276 played an essential role in the TIME.
Analysis of Correlation Between CD276 Expression and Tumor Immune Microenvironment at Single-Cell Levels
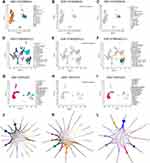
To elucidate the interactions between CD276 levels and TIME at single-cell levels, we obtained three single-cell datasets of BRCA, NSCLC and OV (GSE114725, GSE127465 and GSE115007) from scTIME. We analyzed and exhibited the cellular landscape of different immune cells in TIME through UMAP plots (Figure 10A–I). We found that CD276 was mainly expressed on macrophage clusters in BRCA (Figure 10A–C). Based on the transcriptome profile from GSE127465, a dataset that focused on the single-cell transcriptomics of human lung cancers, we observed that CD276 was principally expressed on M2 macrophages and partly expressed on M0 macrophages (Figure 10D–F). Similarly, the results in OV indicated that CD276 was primarily expressed on MACRO+ macrophages (Figure 10G–I). To confirm the potential effects of CD276 in TIME which exerted through macrophages, we provided the LR-network of CD276 in BRCA, NSCLC and OV to analyze the cell-to-cell communication among diverse cell types in TIME (Figure 10J–L). We observed that macrophage clusters had relatively high weights in the network, which indicated that macrophages played an important role in interacting with TIME. In summary, all the results above revealed that CD276 might anchor macrophage clusters to exert its effects in TIME.
Correlations of CD276 Expression Levels with Tumor Mutation Burden, Tumor Microsatellite Instability, Mismatch Repair Genes and Immune Checkpoints
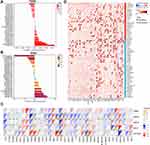
Existing studies have suggested that TMB, MSI and MMR were potential biomarkers in predicting the response to ICI therapy.36–38 The correlation between CD276 and these biomarkers was assessed to investigate whether CD276 expression was correlated with the response of tumor to ICI therapy. In SARC, UCEC, KIPAN, PAAD, LGG, ACC, GBMLGG and THYM, CD276 expression levels were positively correlated with TMB, while it was negatively correlated with TMB in CESC, ESCA and LIHC (Figure 11A). It was observed that CD276 expression was positively related to MSI in LUSC, COADREAD, COAD, UCEC, UVM and TGCT, whereas it was negatively associated with MSI in GBMLGG, KIPAN and PRAD (Figure 11B). Next, the relationship between CD276 expression and five MMR genes (PMS2, MSH6, MSH2, MLH1and EPCAM) was determined. The heatmap results showed that CD276 levels were significantly positively correlated with MSH6, MSH2 and MLH1 in ACC, ESCA, KIRP, LIHC, OV and PRAD (Figure 11C). Especially, a strong positive correlation between CD276 expression and PMS2, MSH6, MSH2, MLH1 and EPCAM was observed in KIRP, LIHC and PRAD. CD276 expression levels were negatively correlated with EPCAM in COAD, ESCA, GBM, LGG, PCPG and READ. No significant difference was found between CD276 expression and PMS2, MSH6, MSH2, MLH1 and EPCAM in CHOL and UVM. We also analyzed the relationships between CD276 expression levels and 59 immune checkpoint genes to further interpret the immunological pattern of CD276. As is shown in Figure 11D, a robust positive correlation existed between CD276 and TGFB1, C10orf54, ITGB2, TNFRSF4, TNFRSF18, ICAM1 and TLR4 in THCA, high-risk Wilms tumor (WT), KIRP, STAD, KIPAN, KIRC, BLCA, PCPG, KICH, OV, PAAD, READ, COAD, COADREAD and UVM. This result demonstrated that CD276 might exert synergistic effects with common immune checkpoints among these tumors. It was worth mentioning that CD276 was negatively associated with part of the immune checkpoints including BTLA, CD27 and CD40LG in TGCT, CESC, CHOL and THYM.
The Biological Pathways Involved CD276
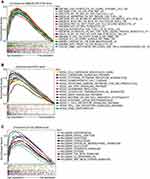
To investigate the biological functions and pathways involved CD276, we performed GSEA and found that CD276 was prominently correlated with immune-related pathways including CD8 T cells and macrophages-related signaling (Figure 12A). This finding was partly consistent with the results from single-cell sequencing (Figure 10). KEGG pathways including ′Natural killer cell mediated cytotoxicity′, ′cytokine-cytokine receptor interaction′, ′Toll-like receptor signaling pathway′ and ′JAK STAT signaling pathway′ were enriched (Figure 12B). The results of HALLMARK enrichment analysis also showed that CD276 was associated with immunological signaling such as ′TGF-β signaling′ and ′Angiogenesis′ (Figure 12C). These results indicated that CD276 might participate in the tumor immunomodulation.
Analysis of CD276 for Drug Sensitivity
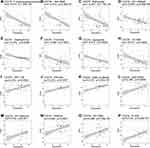
Additionally, the correlation between CD276 expression and drug sensitivity was analyzed through CellMiner database (Figure 13, Supplementary Tables 3 and 4). Figure 13A–H demonstrated that CD276 expression levels were markedly negatively associated with drug sensitivity of 7-Hydroxystaurosporine, AM-592, CFI-400945, VX-689, Palbociclib, Crizotinib, Chelerythrine and Gandotinib. Conversely, CD276 expression was positively correlated with GSK-2126458, P-529, VS-5584, Telatinib, INK-128, AZD-8055, Irofulven and PF-4989216 (Figure 13I–P). These results reflected that CD276 was potentially involved in the chemoresistance of certain chemotherapeutic drugs.
Knockdown of CD276 Inhibited the Proliferation of OV and CESC Cell Lines
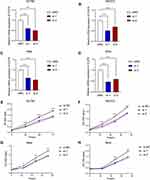
To explore the biological function of CD276 in the development of tumors, the effect of CD276 knockdown on the proliferation of A2780, SKOV3, Hela and Siha cells was evaluated by CCK-8 assay. Tumor cells were transfected with si-NC, si-CD276-1 and si-CD276-2, respectively, and sent for the subsequent analysis 48 hours later. Next, qPCR experiments verified the knockdown efficiency of siRNA in A2780, SKOV3, Hela and Siha cells (Figure 14A–D). Further, CCK-8 assay revealed that down-regulation of CD276 levels inhibited the viability of OV and CESC cells mentioned above (Figure 14E–H). Overall, the results demonstrated that CD276 could promote the proliferation of OV and CESC cell lines.
Discussion
As a newly discovered immune checkpoint, CD276 has been demonstrated that it is associated with the poor clinical prognosis of patients in some tumors, such as colorectal and pancreatic cancer. However, its obscure role in pan-cancer and elusive pathway involved in TIME restrict the rigorous application of CD276 as a target of cancer immunotherapy. In this study, we systematically assessed the prognostic value, clinical features, immune landscape and biological function of CD276 and concluded that CD276 was a potential immunological and prognostic biomarker in most human cancers. Additionally, our study revealed that CD276 might interact with TIME through macrophage clusters, which contributed to the further exploration of its molecular mechanism. All these findings provided a theoretical basis for the effectiveness of anti-CD276 in the clinical treatment of solid tumors.
First, our research analyzed the mRNA expression levels of CD276 between 34 tumor types and their corresponding normal tissues. We demonstrated that the mRNA expression levels of CD276 were upregulated in 31 human cancers compared with their normal controls, and IHC images from HPA validated the results at protein levels. These results were consistent with previous studies.7,39 Especially, we also observed the increased mRNA and protein levels of CD276 in the OV and CESC clinical tissue specimens from our department. However, the results in Figure 1C and D showed no significant difference of CD276 mRNA levels between CESC and the corresponding normal controls. These results might result from the class-imbalance (CESC: T = 304, N = 13). Further analysis demonstrated that CD276 knockdown inhibited the proliferation of OV and CESC cell lines. These findings were in accordance with other reports and revealed that CD276 played an important role in the development of tumors.40,41 CD276 levels in ALL were significantly decreased in tumor tissues compared with their normal controls. Nevertheless, the data of CD276 in ALL was from TARGET and the database applied a comprehensive genomic approach to determine molecular changes that drive childhood cancers.19 Hence, the expression levels of CD276 in adult populations with ALL deserve further exploration. Differential expression levels of CD276 were observed in different clinical stages, molecular and immune subtypes in diverse tumors, which suggested that CD276 was involved in the clinical features of tumors. We also evaluated the prognostic impact of CD276 in patients with different kinds of tumors and found that, high expression levels of CD276 were closely related to a poor prognosis in multiple tumors, especially in GBMLGG, LGG and MESO.
In addition, it has been previously shown that CD276 plays an important role in the process of tumor immunoregulation.4,7 Our study showed the correlation between CD276 expression levels and immune landscape across cancers. We observed that CD276 expression was significantly correlated with B cells, CD4+ T cells, CD8+ T cells, neutrophils, macrophages and DCs in most malignancies. Further analysis indicated that CD276 levels were markedly negatively with CD8+ T cells in several tumors, including PAAD and HNSC. To some extent, this result explains the phenomenon that patients with these tumors usually have poor prognosis. Previous studies reported that overexpression of CD276 was frequently associated with fewer tumor-infiltrating lymphocytes, faster tumor development and poor prognosis in several tumors, which was partly consistent with our results.13 In addition to the number of T cells, the activation or exhaustion of cytotoxic T cells deserves further attention. Previous study demonstrated that CD276 played a dual role in the regulation of tumor immunity.7 For one thing, CD276 promoted the activation of cytotoxic T cells.15,42 Our results also showed that the expression levels of CD276 were positively correlated with the signaling of activated T cells including CD28, CD27 and CD86 in most tumors. For another, CD276 inhibited the proliferation and activation of CD8+ T cells through suppressing the NF-κB signaling.9 The results in our study indicated that there was a positive relationship between CD276 expression and the signaling of exhausted T cells including CTLA4, LAG3 and PD-1 in the majority of tumors. The dual role of CD276 suggested that it had an intricate interaction with TIME and researchers ought to consider the specific environment of CD276.
TMB, MSI and MMR have demonstrated utility in predicting the immunotherapeutic efficacy of cancer patients.37,43 It is well known that deficiency of MMR (dMMR) genes results in the accumulation of large amounts of mutations in tumor cells. Typically, tumor types with higher TMB (which means dMMR) or high frequency of MSI respond to ICI therapy better.44 In this study, we demonstrated that CD276 expression levels were associated with TMB in 10 tumor types and with MSI in 9 tumor types. Besides, a negative correlation was observed between CD276 expression and MMR genes in several tumor types including LAML, THYM and READ. These results revealed that CD276 could predict the efficiency of immunotherapy through affecting the TMB, MSI and MMR in these tumors. Therefore, in the case of positive correlation between CD276 and TMB, we supposed that tumors with high CD276 expression levels, high TMB and MSI might have a better survival outcome after ICI treatment. We also analyzed the relationships between CD276 expression and common immune checkpoints and found that it was positively with many known immune checkpoints such as PD-1, CTLA4 and TIGIT in most tumor types, which indicated that CD276 might play a synergistic role in the combination of other recognized immune checkpoints. It is worth noting that these findings above vary with cancer types due to the tumor heterogeneity, which suggests that clinicians should focus on the personalized and precise treatment when applying the immunotherapy based on CD276.
The results from single cell datasets further confirmed the close correlation between CD276 and TIME. We observed that CD276 was highly expressed on macrophages in BRCA, NSCLC and OV. Especially, the results in NSCLC and OV showed that CD276 was mainly expressed on M2 macrophages or MARCO+ macrophages. These two macrophage subtypes equipped with tumor-promoting phenotypes.42,45 This finding was accordant with the results in Figure 6. It revealed that CD276 expression levels were positively associated with macrophage clusters in most tumors, such as THYM, KIRC and LIHC. We also observed that the weights of the macrophages were relatively high in the LR-network, which reflected that CD276 might exert its effects through macrophages. Furthermore, GSEA of CD276 suggested that chemokine signaling pathway was significantly enriched. Therefore, it is reasonable to speculate that CD276 might function in TIME through specific chemokine-macrophages pathway. Interestingly, other research demonstrated that CD276 created an immunosuppressive microenvironment via the CCL2-CCR2-M2 macrophages axis, which validated our hypothesis in OV.46
To date, the well-defined signaling pathways of CD276 are poorly understood. We observed that ′cytokine-cytokine receptor interaction signaling′, ′chemokine signaling pathway′ and ′JAK STAT signaling pathway′ were enriched in the KEGG enrichment analysis of CD276. In this result, the first two signaling pathways have been discussed in the above paragraph whereas ′JAK STAT signaling pathway′ is also of particular interest. It has been demonstrated that CD276 exerts the antiapoptotic and drug-resistant effects via JAK2/STAT3 pathway.47,48 These findings uncover that JAK2/STAT3 pathway holds a crucial position among the pro-tumorigenic signaling mechanisms of CD276.
As a newly discovered immune checkpoint, the potential possibility that CD276 has mutual effects with other clinical chemotherapeutic drugs is considerable. The analysis from CellMiner database indicated that CD276 expression was significantly correlated with multiple drug sensitivity, such as Palbociclib, Chelerythrine and Irofulven. Using Palbociclib as an example, it is a cyclin-dependent kinase 4 and 6 (CD4/6) inhibitor for the treatment of advanced breast cancer.49 In our study, we observed that relatively low expression levels of CD276 could contribute to the chemoresistance of Palbociclib. This finding suggested that CD276 would be a potential marker for drug susceptibility in the cancer treatment.
Conclusions
In summary, this study performed a comprehensive and systematic evaluation of CD276 in pan-cancer, which uncovered its essential role in predicting prognosis and regulating tumor immunity. Our research also suggested that CD276 could interact with macrophages to function in the TIME and it might be a potential target for tumor immunotherapy in some cancer types.
Supplementary Materials
All the supplementary materials are in the additional file along with the manuscript.
Abbreviations
ACC, adrenocortical carcinoma; BLCA, bladder urothelial carcinoma; BRCA, breast invasive carcinoma; CESC, cervical squamous cell carcinoma and endocervical adenocarcinoma; CHOL, cholangiocarcinoma; COAD, colon adenocarcinoma; COADREAD, colon adenocarcinoma/rectum adenocarcinoma; DLBC, lymphoid neoplasm diffuse large B-cell lymphoma; ESCA, esophageal carcinoma; GBM, glioblastoma multiforme; GBMLGG, glioma; HNSC, head and neck squamous cell carcinoma; KICH, kidney chromophobe; KIPAN, pan-kidney cohort (KICH+KIRC+KIRP); KIRC, kidney renal clear cell carcinoma; KIRP, kidney renal papillary cell carcinoma; LAML, acute myeloid leukemia; LGG, brain lower grade glioma; LIHC, liver hepatocellular carcinoma; LUAD, lung adenocarcinoma; LUSC, lung squamous cell carcinoma; MESO, mesothelioma; OV, ovarian serous cystadenocarcinoma; PAAD, pancreatic adenocarcinoma; PCPG, pheochromocytoma and paraganglioma; PRAD, prostate adenocarcinoma; READ, rectum adenocarcinoma; SARC, sar-coma; STAD, stomach adenocarcinoma; SKCM, skin cutaneous melanoma (include SKCM-P and SKCM-M); SKCM-P, Primary lesion of skin cutaneous melanoma; SKCM-M, Metastasis of skin cutaneous melanoma; STES, stomach and esophageal carcinoma; TGCT, testicular germ cell tumors; THCA, thyroid carcinoma; THYM, thymoma; UCEC, uterine corpus endometrial carcinoma; UCS, uterine carcinosarcoma; UVM, uveal melanoma; OS, osteosarcoma; ALL, acute lymphoblastic leukemia; NB, neuroblastoma; WT, high-risk Wilms tumor.
Data Sharing Statement
All the data included in this research were from open databases. Further inquiries can be directed to the corresponding authors.
Ethical Approval and Consent to Participate
The study was performed in accordance with the Declaration of Helsinki guidelines, and written informed consent was obtained from each participant. This study was approved by the Ethics Committee of Shanghai Tenth People’s Hospital Health Authority (SHSY-ICE-5.0/22K76/P01). It should be mentioned that this study was a subproject of the project “Hsa_circ_0000497 and hsa_circ_0000918 contributed to peritoneal metastasis of ovarian cancer via ascites”.
Acknowledgments
We would like to thank “Sanger box” for the excellent technical support.
Author Contributions
All authors made a significant contribution to the conception, study design, execution, acquisition of data, analysis and interpretation of data of this work; they also took part in drafting, revising or critically reviewing the manuscript; gave final approval of the version to be published; had agreed on the journal to which the article had been submitted and agreed to be accountable for all aspects of the work.
Funding
This work was supported by the Emerging Frontier Technology Research Program of Shanghai Shen-Kang Hospital Development Center (No. SHDC12021113), NSFC (National Natural Science Foundation of China, grant number 81874104) and Shanghai Tenth People’s Hospital (Climbing talent program, 2021SYPDRC006; 04.03.19.147 and 04.01.20068).
Disclosure
The authors have declared that they have no competing interests.
References
1. Jardim DL, Goodman A, de Melo Gagliato D, Kurzrock R. The challenges of tumor mutational burden as an immunotherapy biomarker. Cancer Cell. 2021;39(2):154–173. doi:10.1016/j.ccell.2020.10.001
2. Odunsi K. Immunotherapy in ovarian cancer. Ann Oncol. 2017;28(suppl_8):viii1–viii7. doi:10.1093/annonc/mdx444
3. Xin YJ, Hodge JP, Oliva C, Neftelinov ST, Hubbard-Lucey VM, Tang J. Trends in clinical development for PD-1/PD-L1 inhibitors. Nat Rev Drug Discov. 2020;19(3):163–164. doi:10.1038/d41573-019-00182-w
4. Yang S, Wei W, Zhao Q. B7-H3, a checkpoint molecule, as a target for cancer immunotherapy. Int J Biol Sci. 2020;16(11):1767–1773. doi:10.7150/ijbs.41105
5. Liu J, Yang S, Cao B, et al. Targeting B7-H3 via chimeric antigen receptor T cells and bispecific killer cell engagers augments antitumor response of cytotoxic lymphocytes. J Hematol Oncol. 2021;14(1):21. doi:10.1186/s13045-020-01024-8
6. Liu S, Liang J, Liu Z, et al. The role of CD276 in cancers. Front Oncol. 2021;11:654684. doi:10.3389/fonc.2021.654684
7. Zhou W-T, Jin W-L. B7-H3/CD276, an emerging cancer immunotherapy. Front Immunol. 2021;12:701006. doi:10.3389/fimmu.2021.701006
8. Lee Y-H, Martin-Orozco N, Zheng P, et al. Inhibition of the B7-H3 immune checkpoint limits tumor growth by enhancing cytotoxic lymphocyte function. Cell Res. 2017;27(8):1034–1045. doi:10.1038/cr.2017.90
9. Suh W-K, Gajewska BU, Okada H, et al. The B7 family member B7-H3 preferentially down-regulates T helper type 1-mediated immune responses. Nat Immunol. 2003;4(9):899–906. doi:10.1038/ni967
10. Prasad DVR, Nguyen T, Li Z, et al. Murine B7-H3 is a negative regulator of T cells. J Immunol. 2004;173(4):2500–2506. doi:10.4049/jimmunol.173.4.2500
11. Wang C, Li Y, Jia L, et al. CD276 expression enables squamous cell carcinoma stem cells to evade immune surveillance. Cell Stem Cell. 2021;28(9):1597–1613.e7. doi:10.1016/j.stem.2021.04.011
12. Hagelstein I, Engel M, Hinterleitner C, et al. B7-H3-targeting Fc-optimized antibody for induction of NK cell reactivity against sarcoma. Front Immunol. 2022;13:1002898. doi:10.3389/fimmu.2022.1002898
13. Du H, Hirabayashi K, Ahn S, et al. Antitumor responses in the absence of toxicity in solid tumors by targeting B7-H3 via chimeric antigen receptor t cells. Cancer Cell. 2019;35(2):221–237.e8. doi:10.1016/j.ccell.2019.01.002
14. Vitanza NA, Wilson AL, Huang W, et al. Intraventricular B7-H3 CAR T cells for diffuse intrinsic pontine glioma, preliminary first-in-human bioactivity and safety. Cancer Discov. 2022. doi:10.1158/2159-8290.CD-22-0750
15. Chapoval AI, Ni J, Lau JS, et al. B7-H3, a costimulatory molecule for T cell activation and IFN-gamma production. Nat Immunol. 2001;2(3):269–274. doi:10.1038/85339
16. Lupu CM, Eisenbach C, Kuefner MA, et al. An orthotopic colon cancer model for studying the B7-H3 antitumor effect in vivo. J Gastrointest Surg. 2006;10(5):635–645. doi:10.1007/BF03239969
17. Loos M, Hedderich DM, Ottenhausen M, et al. Expression of the costimulatory molecule B7-H3 is associated with prolonged survival in human pancreatic cancer. BMC Cancer. 2009;9:463. doi:10.1186/1471-2407-9-463
18. Picarda E, Galbo PM, Zong H, et al. The immune checkpoint B7-H3 (CD276) regulates adipocyte progenitor metabolism and obesity development. Sci Adv. 2022;8(17):eabm7012. doi:10.1126/sciadv.abm7012
19. Bolouri H, Farrar JE, Triche T, et al. The molecular landscape of pediatric acute myeloid leukemia reveals recurrent structural alterations and age-specific mutational interactions. Nat Med. 2018;24(1):103–112. doi:10.1038/nm.4439
20. Notter T, Panzanelli P, Pfister S, Mircsof D, Fritschy J-M. A protocol for concurrent high-quality immunohistochemical and biochemical analyses in adult mouse central nervous system. Eur J Neurosci. 2014;39(2):165–175. doi:10.1111/ejn.12447
21. Detre S, Saclani Jotti G, Dowsett M. A “quickscore” method for immunohistochemical semiquantitation, validation for oestrogen receptor in breast carcinomas. J Clin Pathol. 1995;48(9):876–878. doi:10.1136/jcp.48.9.876
22. Liu J, Lichtenberg T, Hoadley KA, et al. An integrated TCGA Pan-cancer clinical data resource to drive high-quality survival outcome analytics. Cell. 2018;173(2). doi:10.1016/j.cell.2018.02.052
23. Ru B, Wong CN, Tong Y, et al. TISIDB, an integrated repository portal for tumor-immune system interactions. Bioinformatics. 2019;35(20):4200–4202. doi:10.1093/bioinformatics/btz210
24. Li T, Fan J, Wang B, et al. TIMER, A web server for comprehensive analysis of tumor-infiltrating immune cells. Cancer Res. 2017;77(21):e108–e110. doi:10.1158/0008-5472.CAN-17-0307
25. Hong F, Meng Q, Zhang W, et al. Single-Cell analysis of the pan-cancer immune microenvironment and scTIME portal. Cancer Immunol Res. 2021;9(8):939–951. doi:10.1158/2326-6066.CIR-20-1026
26. Bonneville R, Krook MA, Kautto EA, et al. Landscape of microsatellite instability across 39 cancer types. JCO Precis Oncol. 2017;2017. doi:10.1200/PO.17.00073
27. Reinhold WC, Sunshine M, Liu H, et al. CellMiner, a web-based suite of genomic and pharmacologic tools to explore transcript and drug patterns in the NCI-60 cell line set. Cancer Res. 2012;72(14):3499–3511. doi:10.1158/0008-5472.CAN-12-1370
28. Shankavaram UT, Varma S, Kane D, et al. CellMiner, a relational database and query tool for the NCI-60 cancer cell lines. BMC Genom. 2009;10:277. doi:10.1186/1471-2164-10-277
29. Ritota M, Comitato R, Manzi P. Cow and ewe cheeses made with saffron, characterization of bioactive compounds and their antiproliferative effect in cervical adenocarcinoma (HeLa) and breast cancer (MDA-MB-231) cells. Molecules. 2022;27(6):1995. doi:10.3390/molecules27061995
30. Li X-Q, Bai Y-L, Zhang D-L, Jiao H-S, He R-X. Euphornin reduces proliferation of human cervical adenocarcinoma HeLa cells through induction of apoptosis and G2/M cell cycle arrest. Onco Targets Ther. 2018;11:4395–4405. doi:10.2147/OTT.S166018
31. Guan Y, Luan Y, Xie Y, et al. Chloride channel-3 is required for efficient tumour cell migration and invasion in human cervical squamous cell carcinoma. Gynecol Oncol. 2019;153(3):661–669. doi:10.1016/j.ygyno.2019.03.006
32. Fan L, Liu Z, Zhang Y, et al. MiRNA373 induces cervical squamous cell carcinoma SiHa cell apoptosis. Cancer Biomark. 2018;21(2):455–460. doi:10.3233/CBM-170692
33. Yoshihara K, Shahmoradgoli M, Martínez E, et al. Inferring tumour purity and stromal and immune cell admixture from expression data. Nat Commun. 2013;4:2612. doi:10.1038/ncomms3612
34. Gong Z, Zhang J, Guo W. Tumor purity as a prognosis and immunotherapy relevant feature in gastric cancer. Cancer Med. 2020;9(23):9052–9063. doi:10.1002/cam4.3505
35. Thorsson V, Gibbs DL, Brown SD, et al. The Immune Landscape of Cancer. Immunity. 2018;48(4):812–830.e14. doi:10.1016/j.immuni.2018.03.023
36. Jiang M, Jia K, Wang L, et al. Alterations of DNA damage response pathway, Biomarker and therapeutic strategy for cancer immunotherapy. Acta Pharm Sin B. 2021;11(10):2983–2994. doi:10.1016/j.apsb.2021.01.003
37. Chan TA, Yarchoan M, Jaffee E, et al. Development of tumor mutation burden as an immunotherapy biomarker, utility for the oncology clinic. Ann Oncol. 2019;30(1):44–56. doi:10.1093/annonc/mdy495
38. Dudley JC, Lin M-T, Le DT, Eshleman JR. Microsatellite instability as a biomarker for PD-1 blockade. Clin Cancer Res. 2016;22(4):813–820. doi:10.1158/1078-0432.CCR-15-1678
39. Picarda E, Ohaegbulam KC, Zang X. Molecular pathways, targeting B7-H3 (CD276) for human cancer immunotherapy. Clin Cancer Res. 2016;22(14):3425–3431. doi:10.1158/1078-0432.CCR-15-2428
40. Li Y, Zhang J, Han S, et al. B7-H3 promotes the proliferation, migration and invasiveness of cervical cancer cells and is an indicator of poor prognosis. Oncol Rep. 2017;38(2):1043–1050. doi:10.3892/or.2017.5730
41. Zhang J, Liu L, Han S, et al. B7-H3 is related to tumor progression in ovarian cancer. Oncol Rep. 2017;38(4):2426–2434. doi:10.3892/or.2017.5858
42. Chen Y, Zhang S, Wang Q, Zhang X. Tumor-recruited M2 macrophages promote gastric and breast cancer metastasis via M2 macrophage-secreted CHI3L1 protein. J Hematol Oncol. 2017;10(1):36. doi:10.1186/s13045-017-0408-0
43. Zhu Y, Zhu X, Tang C, Guan X, Zhang W. Progress and challenges of immunotherapy in triple-negative breast cancer. Biochim Biophys Acta Rev Cancer. 2021;1876(2):188593. doi:10.1016/j.bbcan.2021.188593
44. Nguyen PHD, Ma S, Phua CZJ, et al. Intratumoural immune heterogeneity as a hallmark of tumour evolution and progression in hepatocellular carcinoma. Nat Commun. 2021;12(1):227. doi:10.1038/s41467-020-20171-7
45. Chen AX, Gartrell RD, Zhao J, et al. Single-cell characterization of macrophages in glioblastoma reveals MARCO as a mesenchymal pro-tumor marker. Genome Med. 2021;13(1):88. doi:10.1186/s13073-021-00906-x
46. Miyamoto T, Murakami R, Hamanishi J, et al. B7-H3 suppresses antitumor immunity via the CCL2-CCR2-M2 macrophage axis and contributes to ovarian cancer progression. Cancer Immunol Res. 2022;10(1):56–69. doi:10.1158/2326-6066.CIR-21-0407
47. Zhang T, Jiang B, Zou S-T, Liu F, Hua D. Overexpression of B7-H3 augments anti-apoptosis of colorectal cancer cells by Jak2-STAT3. World J Gastroenterol. 2015;21(6):1804–1813. doi:10.3748/wjg.v21.i6.1804
48. Liu H, Tekle C, Chen Y-W, et al. B7-H3 silencing increases paclitaxel sensitivity by abrogating Jak2/Stat3 phosphorylation. Mol Cancer Ther. 2011;10(6):960–971. doi:10.1158/1535-7163.MCT-11-0072
49. Turner NC, Slamon DJ, Ro J, et al. Overall survival with palbociclib and fulvestrant in advanced breast cancer. N Engl J Med. 2018;379(20):1926–1936. doi:10.1056/NEJMoa1810527
 © 2023 The Author(s). This work is published and licensed by Dove Medical Press Limited. The full terms of this license are available at https://www.dovepress.com/terms.php and incorporate the Creative Commons Attribution - Non Commercial (unported, v3.0) License.
By accessing the work you hereby accept the Terms. Non-commercial uses of the work are permitted without any further permission from Dove Medical Press Limited, provided the work is properly attributed. For permission for commercial use of this work, please see paragraphs 4.2 and 5 of our Terms.

