Back to Journals » Nature and Science of Sleep » Volume 17

Prevalence and Factors Associated with Insomnia Among Chronic Disease Patients in Bangladesh: A Machine Learning Study
Authors Das P ![]() , Arif M
, Arif M ![]() , Hasan ME, ALmerab MM, Habib AA, Al Mamun F, Mamun MA, Gozal D
, Hasan ME, ALmerab MM, Habib AA, Al Mamun F, Mamun MA, Gozal D ![]()
Received 18 June 2025
Accepted for publication 23 September 2025
Published 7 October 2025 Volume 2025:17 Pages 2541—2567
DOI https://doi.org/10.2147/NSS.S547335
Checked for plagiarism Yes
Review by Single anonymous peer review
Peer reviewer comments 5
Editor who approved publication: Dr Marco Veneruso
Pronab Das,1,2 Mohammad Arif,1,3 Md Emran Hasan,1,4 Moneerah Mohammad ALmerab,5 Abdullah Al Habib,1,6 Firoj Al Mamun,1,7 Mohammed A Mamun,1,7 David Gozal8
1CHINTA Research Bangladesh, Savar, Dhaka, 1342, Bangladesh; 2One Health Institute, Chattogram Veterinary and Animal Sciences University, Chattogram, 4225, Bangladesh; 3Department of Ayurvedic Medicine, Institute of Teaching & Research in Ayurveda, Jamnagar, Gujarat, India; 4School of Computer Science and Engineering, Nanjing University of Science and Technology, Nanjing, People’s Republic of China; 5Department of Psychology, College of Education and Human Development, Princess Nourah Bint Abdulrahman University, Riyadh, Saudi Arabia; 6Department of Government and Politics, Jahangirnagar University, Dhaka, 1342, Bangladesh; 7Department of Public Health, University of South Asia, Savar, Dhaka, 1348, Bangladesh; 8Office of The Dean and Departments of Pediatrics and Biomedical Sciences, Joan C. Edwards School of Medicine, Marshall University, Huntington, WV, 25701, USA
Correspondence: Mohammed A Mamun, CHINTA Research Bangladesh, Dhaka, Bangladesh, Email [email protected] David Gozal, Office of The Dean and Department of Pediatrics, Joan C. Edwards School of Medicine, Marshall University, Huntington, WV, 25701, USA, Email [email protected]
Background: Insomnia significantly impairs both mental and physical health, and its bidirectional relationship with chronic diseases exacerbates outcomes for both conditions. While insomnia risk factors are well-studied in general populations, little is known about its prevalence and determinants among chronic disease patients in Bangladesh. Using machine learning (ML) alongside traditional analyses may improve prediction and early identification of insomnia risk in this high-vulnerability group.
Methods: This cross-sectional study recruited 1,222 adult chronic disease patients from healthcare facilities in Dhaka and Chattogram between May and November 2024. Insomnia was assessed using the Insomnia Severity Index (ISI-7). Multivariable logistic regression identified significant risk and protective factors. Six ML classifiers, K-Nearest Neighbors (KNN), Random Forest (RF), Support Vector Machine (SVM), Gradient Boosting Machine (GBM), Extreme Gradient Boosting (XGBoost), and Categorical Boosting (CatBoost), were trained and tested (with Synthetic Minority Over-sampling Technique for class imbalance), and model performance was evaluated using accuracy, precision, F1 score, log loss, and the area under the receiver operating characteristic curve (AUC-ROC). Feature importance was determined via SHapley Additive exPlanations (SHAP) and gain values.
Results: Insomnia affected 41.3% of patients. Risk factors included female gender, joint family, urban residence, smokeless tobacco and substance use, prolonged daytime napping, late disease onset, presence of other chronic diseases, and unmet mental healthcare needs. Protective factors were physical activity, 7– 9 hours of nighttime sleep, met mental healthcare needs, and notably, presence of urinary disease. Among ML models, CatBoost outperformed others (accuracy 71.67%, AUC 77.27%, F1 score 71.23%), followed closely by RF and SVM. Feature importance analysis consistently identified mental healthcare need fulfillment and nighttime sleep duration as the strongest predictors of insomnia.
Conclusion: Insomnia was common among Bangladeshi chronic disease patients and linked to sociodemographic, behavioral, clinical, and mental health factors. CatBoost and other ML models showed strong predictive ability, supporting their use in early screening. Prospective studies are needed to validate these findings and guide targeted interventions.
Keywords: insomnia, chronic disease, machine learning, bangladesh, catboost, prediction
Introduction
Insomnia is a sleep disorder characterized by persistent difficulty in falling asleep, staying asleep, or leading to non-restorative sleep.1 With 10% of the adult population suffering from insomnia and another 20% from occasional insomnia symptoms, it has become a serious global public health concern.2,3 Sleep disorders such as insomnia can affect not only the mental well-being but also the physical well-being of a person. Insomnia is prevalent among patients with chronic illnesses like diabetes mellitus, myocardial infarction, congestive heart failure, and obstructive airway disease. These conditions often exacerbate sleep disturbances, leading to a higher prevalence of insomnia.4–11 Insufficient or disrupted sleep can disrupt fundamental neural processes and impair cognitive function, which can result in the onset or worsening of mental disorders and chronic diseases.12 The relationship between insomnia and chronic disease is bidirectional rather than linear. The burden of chronic disorders can lead to poor quality sleep, financial difficulties and reduced quality of life.13,14 Moreover, chronic diseases are often associated with an increased risk of poor mental health,15 which is a significant predictor of insomnia.16,17 Conversely, sleep problems can also contribute to a higher risk of chronic non-communicable diseases, thus confirming the bidirectional relationship.18,19
In emerging economies, the prevalence of both chronic diseases and insomnia is rising at an alarming rate, representing a major public health challenge. Chronic diseases such as diabetes, cardiovascular conditions, and respiratory disorders now account for a significant proportion of morbidity and mortality in these regions, with nearly three-quarters of chronic disease-related deaths occurring in low- and middle-income countries.20 This surge is driven by factors including rapid urbanization, changing lifestyles, environmental stressors, and disparities in healthcare access. Despite the growing burden of chronic illness, the impact of these epidemiological trends on sleep health remains inadequately explored. Bangladesh exemplifies this dual burden, as chronic diseases are responsible for approximately 67% of all deaths in the country.21 Notably, the prevalence of insomnia in Bangladesh appears to be particularly high; a recent nationwide survey conducted during the COVID-19 pandemic found that 46.3% of adults experienced some form of insomnia.22 This rate is substantially greater than those reported in other South Asian nations, such as India23 and Nepal.24 These findings indicate the urgent need for focused research on the relationship between chronic disease and insomnia within the Bangladeshi context, considering its unique sociocultural and health system factors. Beyond prevalence estimates, it is also important to understand the determinants of insomnia. A variety of factors have been ascribed to the risk of developing insomnia, including socio-demographic, lifestyle, disease history, and mental health-related issues. Socio-demographic determinants for insomnia include age, gender, education, occupation, marital status, and residence. Lifestyle and behavioral factors, such as social media usage and daytime napping can also hinder sleep quality.22 Additionally, addictive behaviors, including smoking,25 smokeless tobacco,26 and substance use27 can significantly elevate the risk of insomnia. Furthermore, having a history of insomnia among biological relatives constitutes a risk factor for insomnia.28
Machine learning (ML) has seen broad uptake across chronic-disease care because it can learn complex, non-linear patterns from high-dimensional, longitudinal data that traditional models may miss. In diabetes, deep learning can detect referable diabetic retinopathy from retinal photographs with high accuracy, enabling population-scale screening.29 In cardiovascular medicine, ML predicts major adverse cardiovascular events from rich cohort data and achieves cardiologist-level performance for arrhythmia classification from ambulatory electrocardiograms (ECGs).30,31 In nephrology, ML models forecast acute kidney injury (AKI) from electronic health records. They are increasingly used to predict chronic kidney disease (CKD) progression and rapid decline in estimated glomerular filtration rate (eGFR).32,33 In respiratory disease, exacerbation-prediction algorithms for chronic obstructive pulmonary disease (COPD) are being tested alongside telemonitoring platforms.34 Within sleep medicine, ML enables automatic sleep-stage scoring from electroencephalography (EEG) and supports insomnia screening using electronic medical records (EMRs), smartphone-based digital phenotypes, and wearable actigraphy.35–37 Given the high co-occurrence of insomnia with chronic conditions and its impact on adherence, quality of life, and utilization, evaluating ML for early identification of insomnia among patients with chronic diseases is timely and clinically meaningful.
Numerous studies have evaluated risk factors for insomnia in the general population.2,38 However, potential determinants of insomnia among chronic disease patients have only been scarcely evaluated. Although traditional statistical models are useful for identifying associations, they have limitations in handling complex and non-linear relationships.39 Machine learning approaches can overcome these challenges by offering improved predictive performance and the ability to identify key predictors.40 In addition, the use of machine learning to develop algorithms that enable screening of patients to predict insomnia early is promising. While existing literature utilized machine learning to predict insomnia,41–43 few studies have assessed this aspect among chronic disease patients. Similarly, in the context of Bangladesh, there is limited evidence regarding insomnia prevalence and its risk factors among individuals with chronic conditions. Machine learning approaches have been used in general population in Bangladesh,41 but not among chronic disease patients. This study aims to address these gaps by comprehensively analyzing the prevalence and various types of factors impacting insomnia rates among chronic disease patients in Bangladesh and performing an exploration of the feasibility to predict insomnia in such patients using machine learning approaches.
Methods
Study Design and Participants
A cross-sectional survey study was conducted from 21 May 2024 to 10 November 2024 among individuals who were identified as suffering from a chronic illness. The types of chronic diseases included in the study are: respiratory, gastrointestinal, urinary tract, dermatological, reproductive, musculoskeletal, endocrine, cardiovascular, hematological, neurological, and other disorders. Data from patients were collected from the Hamdard General Hospital, Govt. Unani and Ayurvedic Medical College Hospital, Dhaka, and two outlets of Hamdard Laboratories Waqf Bangladesh, located in Dhaka and Chattogram, Bangladesh. Permission was obtained from the respective hospital and institutional authorities prior to the collection of data. A team of 8 research assistants, trained and supervised by a physician team leader, was assigned to collect data. Patients aged ≥18 years with a physician-diagnosed chronic disease of ≥3 months’ duration were eligible for inclusion. Acute conditions, non-physician-confirmed diagnoses, or chronic disease duration <3 months were excluded. Chronic diseases assessed included respiratory, gastrointestinal, urinary tract, dermatological, reproductive, musculoskeletal, endocrine, cardiovascular, hematological, neurological, and other disorders. A detailed breakdown of chronic disease categories is provided in Supplementary Table S1.
Sampling Strategy and Data Collection Procedure
A convenience sampling strategy was utilized to recruit the participants. A well-structured questionnaire was developed for the study. The participants were informed about the aims, objectives, potential benefits, and risks of the study. Data collection was done through face-to-face interviews. The responses were recorded in paper-based questionnaires. Subjects were also apprised of their right to withdraw from the survey at any moment. Upon obtaining informed consent, the questionnaires were distributed among the participants. After removing incomplete responses, 1,222 participants were included in the study for the final analysis, with almost 91% participation rate.
Measures
Sociodemographic Factors
Socio-demographic information was collected in the study, including age, gender, marital status, education, occupation, family type, permanent residence, body mass index (BMI), and monthly family income. The age of the participants was categorized into three groups: 18–30 years, 30–45 years and more than 45 years. Divorced and widowed participants were merged with single, with married being the other category for marital status. Monthly family income was classified based on percentiles into three categories: less than 25,000 BDT, 25,000–40,000 BDT, and over 40,000 BDT. The height and weight of the participants were measured using measuring tapes and weight machines at hospitals or outlets. BMI was calculated by dividing weight (kg) by height (m2), and then they were categorized into four groups: underweight 15.0–18.49 kg/m2, normal weight 18.5–24.99 kg/m2, overweight 25.0–29.99 kg/m2, and obese ≥30 kg/m2.44
Lifestyle and Behavioral Factors
Lifestyle and behavioral factors in this study include cigarette smoking, smokeless tobacco use, alcohol consumption, substance use, physical activity, frequency of physical activity, watching TV, duration of watching TV, watching Facebook reels, duration of watching Facebook reels, watching YouTube videos, duration of watching YouTube videos, afternoon sleep, afternoon sleep duration, and nighttime sleep duration. Cigarette and smokeless tobacco status was assessed by asking if they used them during the past 30 days,45 whereas alcohol and substance use were determined for lifetime usage.46 Respondents were asked whether they engaged in sustained physical activity and, if so, how frequently to determine their physical activity status and its frequency, which was categorized as daily and weekly/monthly.47 The responses for watching TV, Facebook reels, and YouTube videos were dichotomous, whereas the watch time was continuous, which was categorized into under 120 minutes and over 120 minutes.47,48 Afternoon sleep duration was classified in two groups: ≤60 minutes and >60 minutes.49 Nighttime sleep duration was classified into three categories: less than 7 hours (insufficient sleep), 7–9 hours (control), and over 9 hours (prolonged sleep).50
Chronic Diseases Related Variables
Patients with chronic illnesses, clinically diagnosed by licensed physicians, were included in this study. Chronic disease patients were asked about the onset of disease symptoms, and it was classified into: 18–25 years, 26–40 years, and >40 years. Additionally, data regarding their family history of any chronic/genetic/hereditary disorders was also inquired about as a dichotomous response. Participants were also asked by the research team whether they had previously been diagnosed with any chronic diseases, including respiratory, gastrointestinal, urinary, dermatological, reproductive, musculoskeletal, endocrine, cardiovascular, hematological, neurological, and other chronic diseases. Other chronic disease categories included patients suffering from chronic insomnia, depression, malnutrition, dental disorders, and myopia. Chronic insomnia in this context refers to a sleep disturbance occurring at least 3 nights per week for at least 3 months, clinically diagnosed by a physician.51 This is distinct from the insomnia outcome measured in this study using the Insomnia Severity Index-7 (ISI-7) scale, which captures the insomnia symptoms within the past two weeks as reported by the participants.52 A more detailed description of the list of chronic diseases is provided in Supplementary Table S1.
Mental Health-Related Factors
Perceived need for mental healthcare among the patients was assessed by two questions: 1) “During the past 12 months, was there ever a time when you felt that you needed mental health care, whether or not you received it?” and 2) “To what extent do you feel your mental health care needs were met?”.53,54 The responses for the first item were dichotomous, whereas for the second item, the responses were “fully met”, “partially met”, and “unmet”. Partially met and unmet responses were merged and converted to “unmet”.
Insomnia
The Bangla Insomnia Severity Index (ISI-7) was utilized to assess the distribution of insomnia among the respondents.52 The scale consists of 7 items that evaluate various aspects of sleep within the past two weeks (eg, “satisfaction/dissatisfaction of current sleep pattern”). Responses were recorded in a 5-point Likert Scale, ranging from 0 (not at all) to 4 (extremely). The sum of all the items ranged from 0 to 28. A threshold of 8 or above was used to indicate insomnia. Moreover, the Cronbach’s alpha for the scale in the study was 0.921, indicating excellent internal consistency.
Machine Learning Models
K-Nearest Neighbors
To handle regression and classification problems, the K-Nearest Neighbors (KNN) approach employs locally estimated functions and postpones calculation until after classification. Using a majority vote from its k nearest neighbors where k is a small positive number, it determines which k training samples in the feature space are most similar to the object being categorized and allocates the class membership accordingly. When k equals 1, the item is placed in the nearest neighbor’s class.55
Random Forest
Building several decision trees during training, Random Forest (RF) is a well-liked ensemble learning method for regression and classification problems. It generates predictions by average (for regression) or majority voting (for classification) across all of the trees. This method aggregates the output of individual trees, reducing overfitting and improving generalization. By employing distinct segments of the training data, RFs increase prediction accuracy. This varied forest of trees thus yields a more accurate representation.56
Support Vector Machine
Support Vector Machine (SVM) is a powerful supervised learning method commonly used for regression and classification tasks. Finding the best hyperplane allows it to maximally split a dataset’s various class memberships. SVM increases classification accuracy by using the data points in the support vectors that are closest to the decision boundary. SVM models non-linear decision boundaries by implicitly mapping inputs to a high-dimensional feature space via a kernel function and learning a maximum-margin hyperplane in that space. This makes it possible for SVM to manage intricate, non-linear decision boundaries.57
Gradient Boosting Algorithms: GBM and XGBoost
A refined version of Gradient Boosting Machines (GBM), XGBoost (eXtreme Gradient Boosting), is intended to increase speed and accuracy. The gradient boosting methods XGBoost and GBM both construct models in a sequential fashion, fixing mistakes in the models that came before them. A breakthrough in ensemble machine learning algorithms, XGBoost outperforms conventional approaches. By learning from past errors, it minimizes mistakes by facilitating the sequential development of decision trees.58 GBM is a powerful machine learning technique that sequentially adds weak learners, usually decision trees, to build a strong learner and uses gradient descent to minimize the loss function. GBMs are widely used in various industries due to their ability to handle complex, nonlinear data.59 XGBoost has advanced predictive modeling, surpassing the accuracy of its predecessors due to its methodical approach to speed and performance enhancement and its deft handling of large-scale data.58
Categorical Boosting
The modern machine learning technique known as Categorical Boosting (CatBoost) was created by Yandex. A gradient boosting algorithm called CatBoost was created especially to deal with categorical data effectively. It performs well with data that has been classified, especially when there is a high concentration of categorical variables. CatBoost reduces common problems with categorical data without requiring a lot of preprocessing by combining an advanced algorithmic technique with one-hot encoding to improve prediction accuracy and decrease overfitting. In contrast to conventional approaches that depend on One Hot encoding, CatBoost employs a method known as Ordered Boosting, which enhances model performance and lessens target leakage. This method is a useful tool for many applications, including recommendation systems and predictive modeling, because of its well-known scalability and effectiveness.60
Statistical Analysis
The data obtained through face-to-face interview were entered into Google Forms, which was subsequently exported into SPSS version 25 for statistical analysis. Descriptive and inferential statistics were used to analyze the data. The normality of the data was assessed using the Kolmogorov–Smirnov test (D = 0.386, p < 0.001) and histogram. Descriptive statistics for the study included frequency, mean, standard deviation, and percentage, while chi-square test and logistic regression were performed for inferential statistics. To control for potential confounders, multivariable logistic regression analysis, with a manual stepwise backward elimination technique was utilized. Variance Inflation Factors (VIF) and tolerance values were used to check multicollinearity among the study variables. A VIF cut-off <5 and tolerance >0.2 were considered, and no significant multicollinearity was observed. All the variables were included in the regression model at the first step, except for physical activity and duration of watching TV, Facebook reels, and YouTube videos, since these variables had a lower response rate. The model fitness was checked using the Hosmer and Lemeshow test (χ2 = 4.730, p = 0.786), indicating a good fit. A significance level of p < 0.05 with a 95% confidence interval was adopted for all statistical analyses.
Machine Learning Analysis
In this study, a comprehensive ML-based analysis was performed using Python to examine the predictive efficacy of machine learning models for identifying insomnia among patients with chronic diseases and to perform the analysis with the Google Colab environment. 80% of the dataset was used for training, and the remaining 20% was used for testing. The complete dataset was randomly partitioned into a training set (80%) and a test set (20%). The resulting dataset comprised 977 training entries (79.95%) and 245 test entries (20.05%). For modelling, the exported design matrices contained 1,147 training instances with 38 features and 287 test instances with 38 features. This analysis used the Synthetic Minority Over-sampling Technique (SMOTE) on the training data to alleviate the underrepresentation of the minority class and enhance model generalizability in light of the class imbalance in insomnia outcomes. The following 6 classifiers were assessed: K-Nearest Neighbors (KNN), Random Forest (RF), Support Vector Machine (SVM), Extreme Gradient Boosting (XGBoost), Gradient Boosting Machine (GBM), and Categorical Boosting (CatBoost). Distance-based (KNN), ensemble-based bagging (RF), margin-based (SVM), boosting approaches (GBM, XGBoost), and contemporary gradient boosting with categorical handling (CatBoost) are some of the algorithmic paradigms that these models were chosen to address. To ensure robustness, each model was trained and assessed using 5-fold cross-validation. The final performance metrics were presented as the average of all 5-folds. The SHAP values from CatBoost and the Gini-based feature importance from XGBoost were used for feature selection in order to improve interpretability. This study used confusion matrices and ROC curves to evaluate the model’s performance. Figure 1 provides an overview of the end-to-end ML process, covering every stage from dataset curation to performance reporting. Plotting ROC, in particular, showed how well each model could differentiate between cases of insomnia and those that were not, while confusion matrices offered a thorough analysis of prediction results. A comprehensive comparison of classifiers is made possible by this multi-model, explainable, and reproducible technique, which also makes it easier to determine which model is best for early insomnia detection in populations with chronic disease.
 |
Figure 1 End-to-end machine learning workflow for insomnia prediction, from dataset preparation and preprocessing to model training, feature selection, and performance evaluation. Abbreviation: SD, Standard Deviation; CI, Confidence Interval; AUC-ROC, Area under the Receiver Operating Characteristic Curve; SMOTE, Synthetic Minority Over-sampling Technique; CV, Cross-Validation; KNN, K-Nearest Neighbors; RF, Random Forest; SVM, Support Vector Machine; GBM, Gradient Boosting Machines; XGBoost, eXtreme Gradient Boosting; CatBoost Categorical Boosting; SHAP=SHapley Additive exPlanations. |
Feature Selection
Feature selection was performed within the training folds to prevent information leakage. For each fold, CatBoost and XGBoost were trained on the training partition only, and feature importance was computed as CatBoost SHAP values and XGBoost Gain scores, respectively. SHAP values provide an interpretable, model-agnostic estimate of each feature’s contribution to prediction, while Gain reflects the relative improvement in model accuracy when a feature is used to split the data. Features were ranked per fold, z-normalized to harmonize scales, and stability selection was applied to improve robustness: a feature was considered stable if it appeared in the top-k ranks in ≥3 of 5 folds. The final subset of predictors was defined as the consensus intersection of CatBoost-stable and XGBoost-stable features, which reduced the initial 38 predictors to 18. This subset was then fixed prior to evaluation on the held-out test set.
Ethical Considerations
The study was conducted in accordance with the principles outlined in the Declaration of Helsinki (1975 and its 2024 amendment) to ensure adherence to ethical standards for research involving human participants. Ethical approval was obtained from the institutional review board at CHINTA Research Bangladesh (Reference: CHINTA/2024/04-05). All participants were informed about the aims, objectives, benefits, and procedures of the study prior to data collection. Written informed consent was obtained from each participant, who were assured of their voluntary participation, data confidentiality, and their right to withdraw from the study at any time.
Results
Description of the Study Participants
Among the 1,222 participants included in the study, their mean age was 35.29 (± 12.87) years. The majority of the participants were male (66.4%), married (60.9%), from a nuclear family (79.7%), lived in urban areas (59.7%), and had at least a bachelor’s or higher-level education (53.2%). Regarding occupation, 31.6% were service holders, while the rest were unemployed (12.6%), businessperson (12.6%), housewives (20.1%), and others (23.1%). The mean BMI for the respondents was 23.86 (± 3.68) kg/m2, with most of them being in the (18.50–24.99) range (64.0%). 39.0% of the participants had a monthly family income in the range of (25,000–40,000) BDT.
Regarding lifestyle and behaviors, 33.0% had a smoking habit, whereas 18.7% used smokeless tobacco within the past 30 days. Only 4.2% and 6.7% of the patients consumed alcohol and substances in their lifetime. A significant proportion of the respondents reported that they did not participate in any physical activity for a significant duration (85.2%), while 14.8% did (76.8% daily and 23.2% weekly or monthly). TV, Facebook reels, and YouTube videos watching were reported by 41.5%, 62.9%, and 70.9% participants, respectively, while 54.4%, 56.0%, and 60.4% of the participants watched them ≥120 minutes per day. Almost one-third of the respondents (32.4%) napped during the afternoon, where 84.5% of the participants napped ≤60 minutes per day. In addition, only 24.0% of the participants reported 7–9 hours of nighttime sleep (Table 1).
 |
Table 1 Descriptions of Variables and Their Associations with Insomnia |
The distribution of the types of chronic diseases includes respiratory disorders (10.9%), gastrointestinal disorders (23.8%), urinary disorders (4.6%), dermatological disorders (19.1%), reproductive disorder (10.8%), musculoskeletal disorders (9.2%), endocrine disorders (5.3%), cardiovascular and hematological disorders (8.3%), neurological disorders (3.1%), and other disorders (5.0%). 35.9% of the patients developed their chronic illness between the ages of 18 and 25, while 39.4% and 24.6% of the participants had the disease onset during the 26–40 years and >40 years age range. The majority of the patients had no family history of chronic/genetic/hereditary diseases or disorders (81.3%). Moreover, the prevalence of insomnia among the participants was 41.3%, with higher prevalence in women (46.7%), older adults (>45 years) (50.9%), married (44.6%), those with only primary level education (52.3%), those belonging to joint family (55.6%), and those living in urban regions (48.2%). Most of the participants did not perceive the need for mental health support (72.5%). 85.9% reported that their need for mental healthcare was unmet, whereas 14.1% had their need fully met (Table 1).
Association of Study Variables with Insomnia
Several socio-demographic factors were associated with insomnia. As mentioned above, age was linked to insomnia, with older patients displaying increased risk (χ2 = 26.584, p < 0.001). Females reported higher insomnia rates than males (χ2 = 7.419,p = 0.006). Insomnia was more frequent among married participants compared to those who were single (χ2 = 8.532, p = 0.003). Furthermore, education status (χ2 = 12.780, p = 0.002) and family type (χ2 = 26.312, p < 0.001) were associated with insomnia. Patients with higher monthly family income had a higher frequency of insomnia, although the difference was not statistically significant (χ2 = 5.867, p = 0.053), and those residing in urban settings demonstrated a higher prevalence of insomnia than participants living in rural locations (χ2 = 35.534, p < 0.001).
Smokers had a higher frequency of insomnia (χ2 = 7.701, p = 0.006), and similarly, this increased risk applied to those using smokeless tobacco (χ2 = 32.619, p < 0.001) and those reporting substance use (χ2 = 10.694, p < 0.001). Participants who did not engage in physical activity were more likely to report insomnia (χ2 = 13.904, p < 0.001). Regularly watching TV (χ2 = 13.776, p < 0.001), Facebook reels (χ2 = 6.532, p = 0.011), and YouTube videos (χ2 = 14.199, p < 0.001) were all associated with increased risk of insomnia. Individuals who routinely napped (χ2 = 12.383, p < 0.001) or slept during the day for more than 60 minutes (χ2 = 18.024, p < 0.001) had a higher prevalence of insomnia. Furthermore, nighttime sleep duration was also significantly associated with insomnia (p < 0.001).
Insomnia was associated with the onset of chronic disease (χ2 = 29.565, p < 0.001) and with a family history of disease (χ2 = 5.935, p = 0.015). Surprisingly, patients with respiratory (χ2 = 4.980, p = 0.026) and urinary disorders (χ2 = 11.380, p = 0.001) had a lower prevalence of insomnia compared to their counterparts. Conversely, reproductive (χ2 = 10.666,p = 0.001) and other chronic disease patients (χ2 = 17.745, p < 0.001) reported higher rates of insomnia. Moreover, those who did not report a perceived need for mental healthcare (χ2 = 21.763, p < 0.001) and those with unmet mental healthcare needs (χ2 = 81.613, p < 0.001) experienced insomnia more than their counterparts (Table 1).
Factors Associated with Insomnia
An adjusted logistic regression model was constructed for insomnia utilizing backward elimination method, which explained 29.7% of the variance. Female patients had a 1.71 times higher occurrence of insomnia compared to males. Participants belonging to joint families suffered 1.73 times more from insomnia compared to those from nuclear families. Additionally, urban dwellers were more likely to suffer from insomnia than rural residents (AOR = 1.59, 95% CI = 1.19–2.13, p = 0.002).
Patients who used smokeless tobacco had 1.73 times higher odds of having insomnia than those who did not. Similarly, substance users had a 2.66 times higher likelihood of having insomnia than non-users. Conversely, sustained physical activity has a protective effect on insomnia among chronic disease patients (AOR = 0.66, 95% CI = 0.44–0.97, p = 0.033). Respondents who slept more than 60 minutes per day were 1.70 times more likely to suffer from insomnia compared to their counterparts. Moreover, those with 7–9 hours of nighttime sleep had a lower prevalence of insomnia compared to those below 7 hours (AOR = 0.41, 95% CI = 0.29–0.58, p < 0.001).
Participants diagnosed with chronic illness at 26–40 years of age and over 40 years of age were 1.45 and 2.17 times more likely to experience insomnia compared to those diagnosed at the ages of 18 to 25 years. Participants suffering from urinary disorders were less likely to report insomnia (AOR = 0.27, 95% CI = 0.13–0.54, p < 0.001), whereas those with other chronic diseases had 3.19 times higher rates of insomnia. Respondents whose mental healthcare needs were fully met were observed to have lower odds of developing insomnia (AOR = 0.12, 95% CI = 0.07–0.21, p < 0.001) (Table 2).
 |
Table 2 Multivariable Logistic Regression Analysis of Factors Associated with Insomnia |
Evaluation of Machine Learning Model Performances
Feature Selection
The stability-based feature selection procedure reduced the original 38 predictors to 18 stable features that were retained for final model training. Analysis using CatBoost SHAP values (Figure 2) and XGBoost Gain scores (Figure 3) consistently ranked fulfillment of mental healthcare needs as the most influential predictor of insomnia. This variable showed the highest SHAP impact and achieved the largest Gain value (9.28), indicating that participants with unmet mental healthcare needs were much more likely to be classified as having insomnia. Nighttime sleep duration emerged as the second most important feature across both approaches (Gain = 3.78), underscoring the central role of sleep behavior in differentiating between insomnia and non-insomnia cases.
 |
Figure 2 SHAP summary plot for CatBoost. Each point shows a feature’s contribution to insomnia risk (x-axis). Color reflects feature value (red = high, blue = low). Abbreviations: SHAP, SHapley Additive exPlanations; BDT, Bangladeshi Taka. |
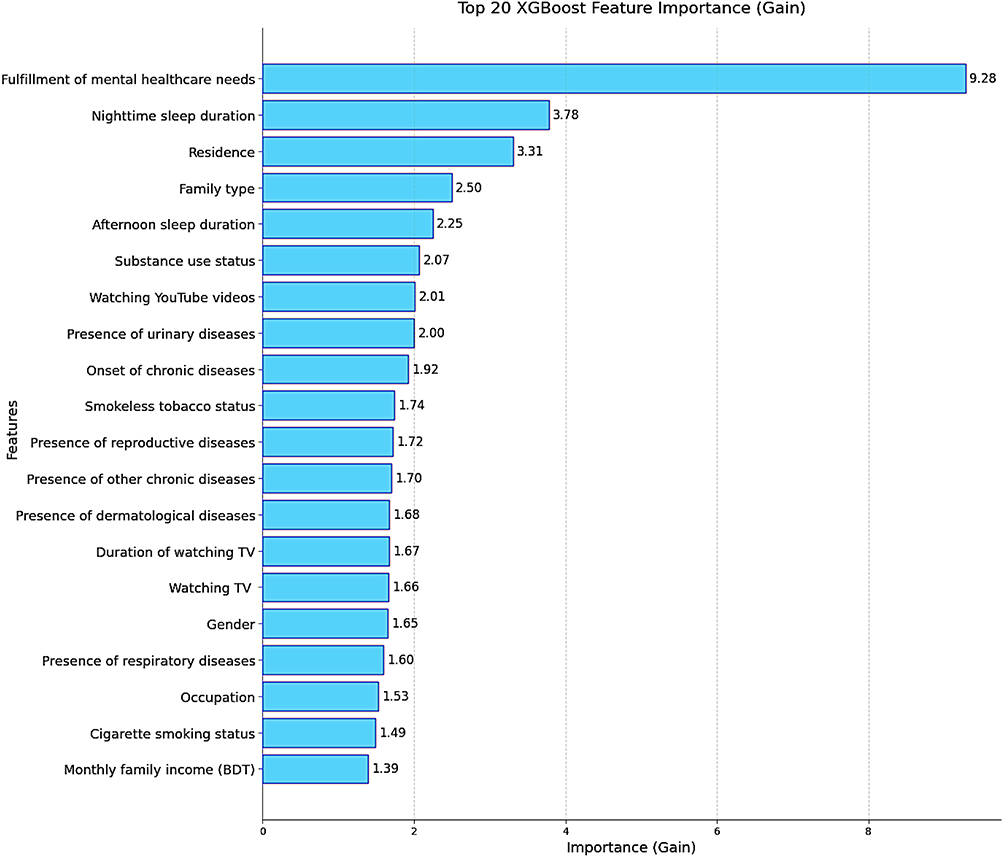 |
Figure 3 Feature importance ranking (XGBoost Gain). Top 20 predictors of insomnia are shown, with bar length indicating contribution to model accuracy. Abbreviations: XGBoost, eXtreme Gradient Boosting; BDT, Bangladeshi Taka. |
Several other predictors demonstrated moderate contributions to the models. These included residence, family type, afternoon sleep duration, smokeless tobacco use, substance use status, and onset of chronic diseases. These factors appeared consistently in both SHAP and Gain rankings, suggesting that lifestyle, environmental, and clinical background variables provided additional, though comparatively smaller, predictive value. By contrast, some variables contributed minimally to model performance. In particular, monthly family income (Gain = 1.39) and family history of chronic/genetic disorders ranked lowest across both models, suggesting that traditional sociodemographic and hereditary factors were less relevant in predicting insomnia risk in this chronic disease cohort.
Overall, the high concordance between CatBoost SHAP values and XGBoost Gain scores strengthens the robustness of the feature selection process. Together, the results indicate that the prediction of insomnia in patients with chronic disease is primarily driven by unmet mental healthcare needs and sleep-related behaviors, supplemented by certain lifestyle and health history factors, while purely sociodemographic and hereditary characteristics played only a minor role.
Machine Learning Evaluations
Table 3 summarizes the per-fold performance (5-fold CV) of 6 machine learning models for identifying insomnia in patients with chronic disease. Across five folds, the strongest single-fold results occur on Fold-3: Across the five folds, model discrimination and error rates varied, with the strongest single-fold performance observed in Fold 3. CatBoost attained the highest (AUC 0.8073, log loss 0.5237), SVM reached the top accuracy (0.7500) and F1 (0.7429) with AUC 0.8039, and RF recorded AUC 0.8007 with low log loss 0.5361. CatBoost and SVM remained consistently strong across folds (CatBoost AUC 0.7508–0.8073; SVM 0.7394–0.8039), while RF was comparably competitive (AUC up to 0.8007 and log loss 0.5361–0.5931). GBM performed moderately (AUC 0.7241–0.7947), and XGBoost showed mixed calibration with higher log loss in some folds (0.8141, 0.8438) despite solid AUCs (0.7094–0.7999). KNN was consistently weaker (AUC 0.6658–0.7331) and exhibited the largest log losses (1.3775–2.3580). Sensitivity and specificity values were also calculated from each fold’s confusion matrix and are reported in Table 3 and Table 4, enabling a fuller assessment of classification balance between positive and negative cases. Overall, boosted trees (CatBoost, RF) and SVM delivered the best fold-wise performance in both discrimination and log loss errors.
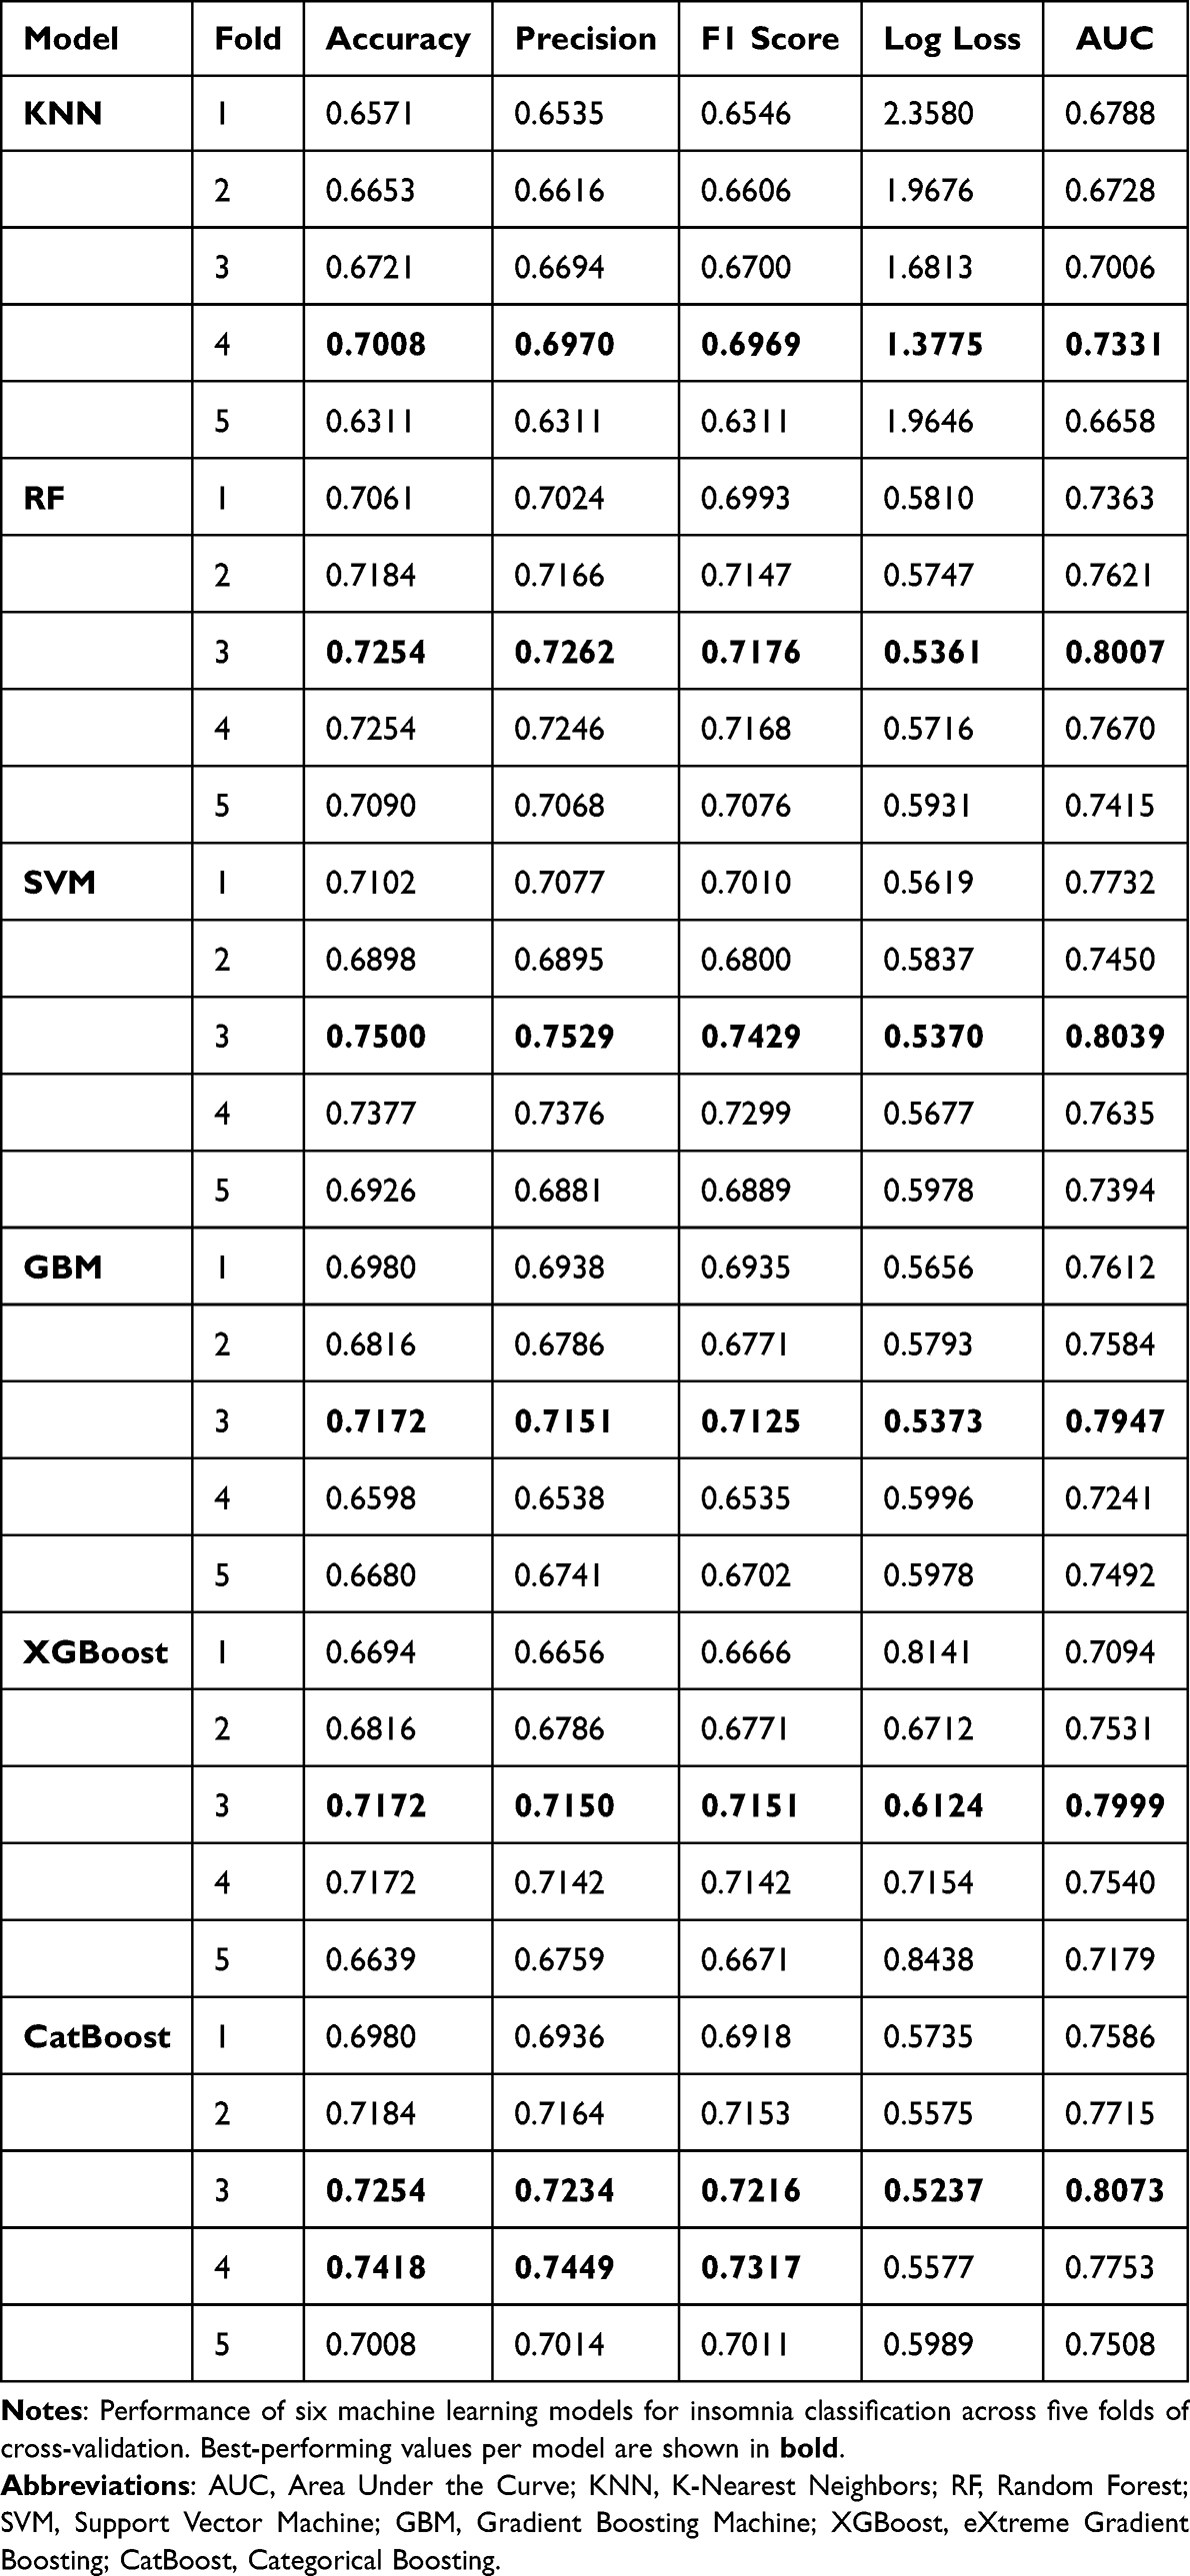 |
Table 3 Per-Fold Performance (5-Fold Cross-Validation) of Different Machine Learning Models for Insomnia Classification |
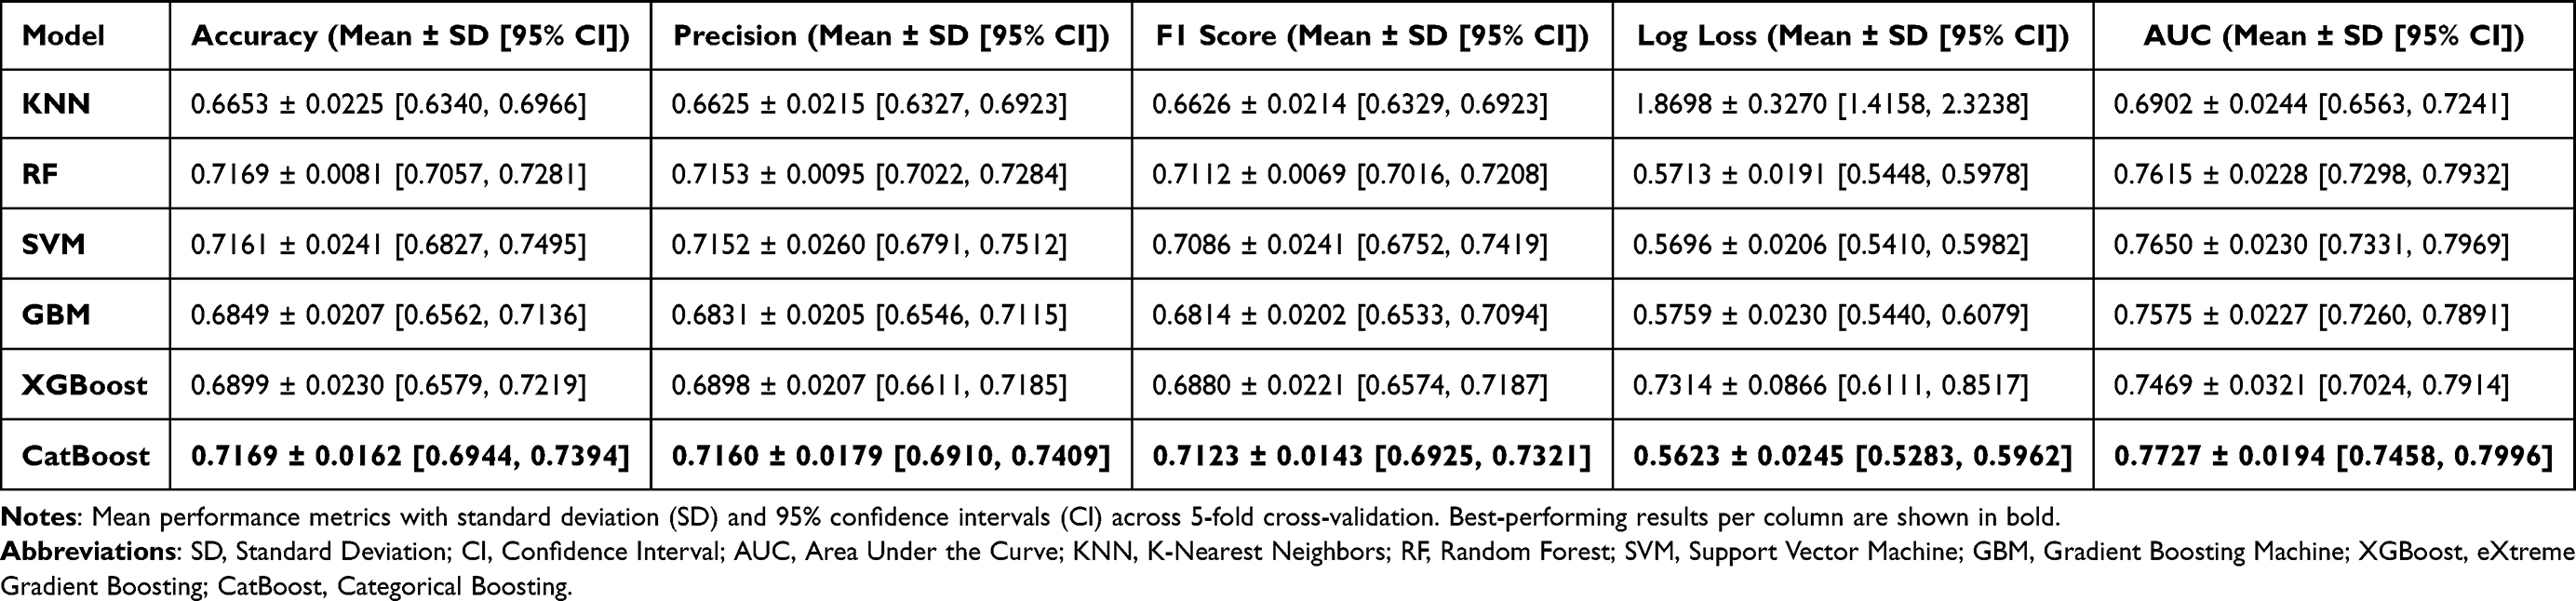 |
Table 4 Average Performance Metrics Across Folds (5-Fold Cross-Validation) of Different Machine Learning Models for Insomnia Classification |
Table 4 summarizes the average classification performance (mean, standard deviation, and 95% confidence interval) of 6 machine learning models for identifying insomnia in patients with chronic disease. Among all classifiers, CatBoost delivered the strongest and most stable results across metrics, achieving the highest mean AUC (0.7727 ± 0.0194; 95% CI: 0.7458–0.7996) and the lowest Log Loss (0.5623 ± 0.0245; 95% CI: 0.5283–0.5962), while also matching RF for the top accuracy (both at 0.7169) and yielding the highest F1-score (0.7123 ± 0.0143). SVM and RF followed closely on discrimination (AUC = 0.7650 ± 0.0230 and 0.7615 ± 0.0228, respectively) with comparably low log losses (0.5696 and 0.5713). GBM and XGBoost performed moderately (AUC = 0.7575 and 0.7469, respectively), whereas KNN lagged with lower discrimination (AUC = 0.6902) and substantially higher log loss (1.8698 ± 0.3270). Variability across folds was generally small for the tree-based ensembles (eg, CatBoost AUC SD = 0.0194; RF ACC SD = 0.0081), indicating consistent behavior across partitions. Pairwise comparisons of AUC across the folds revealed that CatBoost significantly outperformed KNN (p < 0.01) and XGBoost (p < 0.05), while its differences with SVM and RF were not statistically significant. Although 95% CIs overlapped, these tests indicate practical advantages for CatBoost. In summary, tree-based ensemble models, especially CatBoost, showed improved efficacy in detecting cases of insomnia.
Confusion Matrics
Figure 4 displays the confusion matrices for all 6 machine learning models applied to the insomnia classification task. The efficacy of each model in distinguishing between no insomnia and insomnia cases is clearly compared in these matrices. The KNN model demonstrated moderate classification ability, correctly distinguishing 108 no-insomnia and 48 insomnia cases, but also misclassified 37 and 52 instances, respectively. For example, the KNN model achieved sensitivity of 60% and specificity of 66%, reflecting its weaker classification balance. RF demonstrated better performance, with a higher number of correct predictions for both classes (117 non-insomnia and 51 insomnia), indicating a stronger balance. SVM had the lowest number of false positives (23), which emphasizes its conservative prediction strategy, with 52 correctly classified insomnia cases. GBM, XGBoost, and CatBoost all demonstrated consistent results, with GBM correctly predicting 56 insomnia cases and 115 non-insomnia cases, while CatBoost marginally outperformed with 117 correct non-insomnia and 53 insomnia predictions (sensitivity 74%, specificity 70%). Overall, ensemble models such as RF, SVM, and CatBoost showed stronger predictive ability, particularly for the insomnia class.
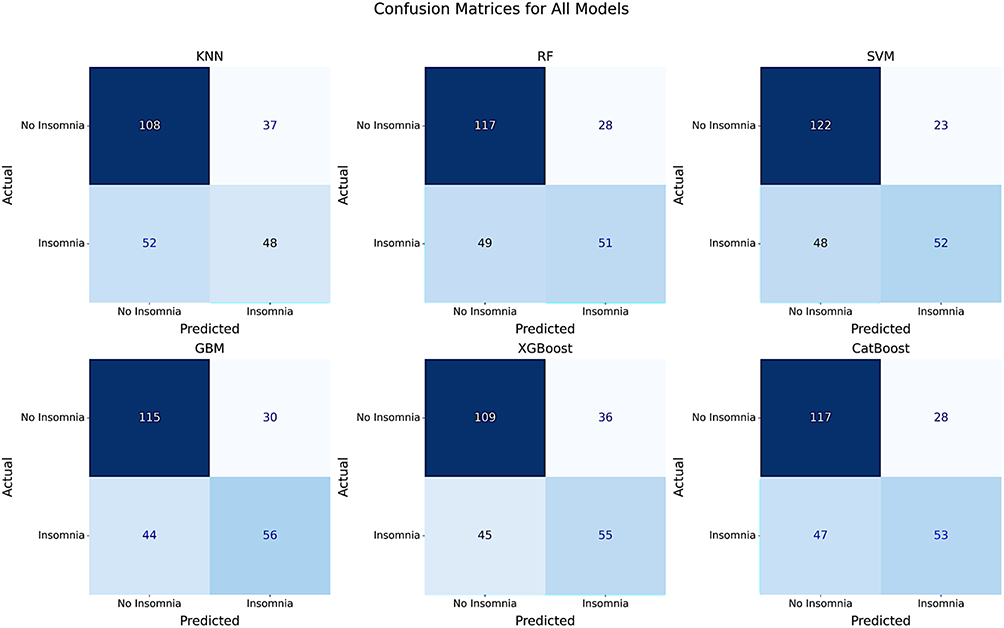 |
Figure 4 Confusion matrices of six machine learning models (KNN, RF, SVM, GBM, XGBoost, CatBoost). Numbers represent true positives, false positives, true negatives, and false negatives for insomnia classification. Abbreviations: KNN, K-Nearest Neighbors; RF, Random Forest; SVM, Support Vector Machine; GBM, Gradient Boosting Machine; XGBoost, eXtreme Gradient Boosting. |
ROC Curve
Figure 5 shows the ROC curves of 6 machine learning models used to categorize insomnia in patients with chronic disease. The capacity of each model to differentiate between cases of insomnia and non-insomnia across all threshold levels is assessed using the ROC Curve. CatBoost and SVM show the strongest discrimination with AUCs of 0.77 (95% CI 0.74–0.80) and 0.77 (95% CI 0.74–0.79), respectively, followed closely by RF at 0.76 (95% CI 0.73–0.79). GBM and XGBoost perform comparably (0.75, 95% CI 0.73–0.78 and 0.72–0.77). KNN trails with an AUC of 0.69 (95% CI 0.66–0.72). At the optimal Youden index threshold, CatBoost achieved sensitivity of 74% and specificity of 70%, while SVM achieved sensitivity of 72% and specificity of 71%, substantially outperforming KNN (sensitivity 60%, specificity 66%). The curves for the tree-based ensembles and SVM lie closer to the upper-left region across the FPR range, indicating higher sensitivity at fixed false-positive rates compared with KNN. Although CIs overlapped, CatBoost consistently showed superior calibration and discrimination across folds.
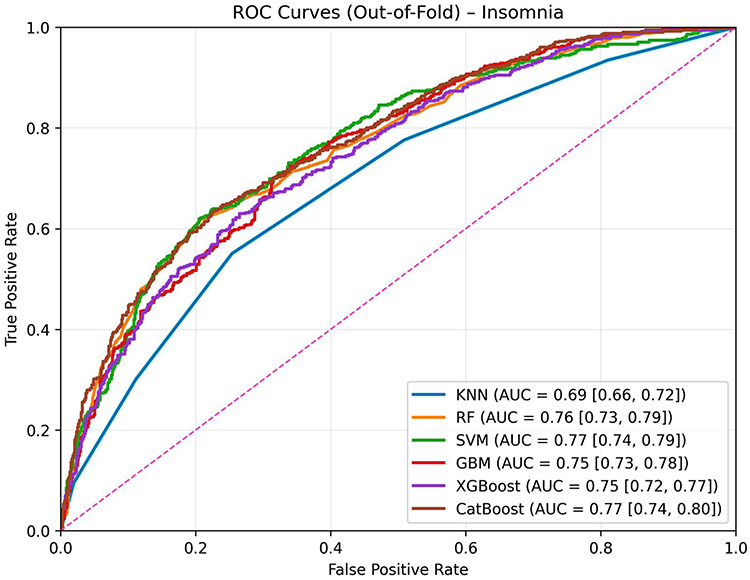 |
Figure 5 ROC curves of six machine learning models with 95% CIs. AUC values indicate discrimination, with CatBoost and SVM performing best. Abbreviations: ROC, Receiver Operating Characteristic; AUC, Area Under the Curve; CI, Confidence Interval; KNN, K-Nearest Neighbors; RF, Random Forest; SVM, Support Vector Machine; GBM, Gradient Boosting Machine; XGBoost, eXtreme Gradient Boosting. |
Discussion
The present study has comprehensively analyzed the prevalence and associated factors of insomnia among patients suffering from chronic diseases in Bangladesh. An elevated (41.3%) prevalence of insomnia was detected among these patients, and several socio-demographic, lifestyle and behavior, chronic disease, and mental health-related factors were significantly associated with the presence of insomnia. Female gender, belonging to joint family, urban residence, smokeless tobacco and substance use, physical inactivity, longer afternoon napping, short nighttime sleep duration (<7 hours), later onset of chronic disease (>40 years of age), non-urinary disease patients, other chronic disease patients, and unmet needs for mental healthcare were all significant predictors associated with insomnia. In addition, machine learning models exploring this dataset enabled the delineation of performant algorithms with predictive ability among patients suffering from chronic diseases. Thus, these findings should assist in developing evidence-based policies and interventions in preventing insomnia specific to people suffering from long-term illnesses. Importantly, the observed associations point toward potentially modifiable mechanisms—such as unmet mental healthcare needs leading to heightened stress reactivity, or lifestyle behaviors (tobacco, substance use, inactivity) contributing to circadian disruption—that can be targeted in interventions.
The prevalence of insomnia in our cohort is in line with the findings of an Ethiopian study during the pandemic period, where a 39.3% prevalence of insomnia was reported among patients with pre-existing chronic non-communicable diseases.61 A slightly lower rate of chronic insomnia (33.0%) was observed in a study among Indian adult patients. However, insomnia was more frequent among patients with comorbidities such as diabetes (50%), hypertension (37%), asthma (35%), heart disease (50%), and kidney disease (67%).23 Worldwide systematic reviews and meta-analyses revealed that insomnia was a frequent occurrence among patients with obstructive sleep apnea (38%),62 chronic kidney disease (45%),63 and chronic obstructive pulmonary disease (38.8%).64 These figures contrast with the prevalence of insomnia in the general population (22.0%)65 highlighting the increased vulnerability of chronic disease patients to insomnia.
Various factors were significantly associated with insomnia. Gender differences in insomnia are consistently reported,65 and our findings are no exception. The higher prevalence of insomnia among female patients might be due to their higher vulnerability to some chronic diseases, such as rheumatoid arthritis66 and systemic lupus erythematosus.67 Moreover, females in Bangladesh with diabetes mellitus were also more likely to suffer from depression.68 Hormonal variation during menstruation, pregnancy, and menopause, higher prevalence of mood disorders, adverse socio-economic factors, and gender discrimination have all been invoked as contributing factors that might hinder sleep quality in females.69 Unfortunately, our study design will not allow for the identification of putative gender-related contributions to the higher prevalence of insomnia in women among chronic illness patients. Nevertheless, the consistency of this pattern across diverse settings suggests that biological mechanisms (eg, hormonal fluctuations across the lifespan) interact with psychosocial stressors to produce a gendered vulnerability to insomnia.
Patients belonging to joint families had a higher occurrence of insomnia compared to those from nuclear families. A similar finding was found in an Indian study among urban West Bengal residents.70 This can be explained by individuals belonging to joint families suffering from frequent family conflicts and strained family relationships, which can impair sleep quality.71 Urban residents had a higher prevalence of insomnia compared to patients residing in rural regions. A similar observation was also found in a Bangladeshi study, which reported higher insomnia prevalence among people living in sub-district towns, district towns, and divisional towns compared to village dwellers.22 This regional disparity could stem from a lack of green spaces, reduced physical activity, concerns about job security, higher social stress, crime rate, and social isolation.72
Lifestyle and behavioral factors can significantly impact the frequency of insomnia. Smokeless tobacco and substance use were risk factors associated with insomnia in the study. Similarly, smokeless tobacco users in South Africa were observed to have 2.78 times higher odds of restless sleep.26 Moreover, an international study also found an association between substance use and insomnia.27 Addiction to various substances can disrupt the mesolimbic dopamine pathway, impairing sleep regulation while also impacting the circadian rhythms. Moreover, there might be a bidirectional association between substance use and sleep, where substance use can lead to insomnia, and insomnia, in turn, can increase the risk of relapse to substance use.73 Prolonged physical activity was associated with a lower prevalence of insomnia. Correspondingly, in the Taiwan National Health Interview Survey, a higher prevalence of insomnia among inactive participants was observed compared to the active group.74 Regular exercise can improve sleep quality by fostering melatonin production and facilitating sleep onset. Furthermore, post-exercise drop in body temperature can promote sleepiness and earlier onset of sleep.75
Daytime napping duration was a significant risk factor associated with insomnia, where more than an hour of sleep is linked with higher rates of insomnia. A Japanese nationwide survey also revealed an association between insomnia and high-frequency napping.76 Additionally, in a study among pregnant individuals with insomnia disorder, it was found that napping for a short duration might improve sleep efficacy, however, longer napping might disrupt nighttime sleep.77 Similar observations were illustrated in a review article, where napping had a beneficial effect when the duration was shorter, but can have a detrimental impact if longer cumulative duration napping is adopted.78 Moreover, longer nap duration is linked with higher odds of cognitive frailty.79 This can lead to higher rates of insomnia, as cognitive frailty has a bidirectional relationship with insomnia.80
Additionally, 7–9 hours of nighttime sleep was observed to be associated with lower odds of insomnia compared to less than 7 hours of sleep. However, more than 9 hours of sleep did not have any significant association, indicating a diminishing beneficial impact. On a similar note, a study among Norwegian younger adults also found shorter average sleep duration among those with insomnia compared to those without insomnia disorder.81 Sleep duration can have a significant impact on mental health, with 7–8 hours emerging as desirable. Furthermore, aligning sleep time with the natural circadian rhythm can enhance daytime alertness and sleep quality, attributed to lower odds of insomnia.82 Insufficient or excessive sleep duration is associated with declining cognition and mental health,83 leading to a higher prevalence of insomnia.
Participants in the study who had the onset of chronic illness in the later part of their life (>40 years) were suffering from insomnia more frequently than those with an earlier onset of their disease. A study among older Indian adults reported that late onset of chronic diseases such as hypertension, stroke, arthritis, and diabetes seemed to be at risk for mental health. Moreover, late onset of chronic illnesses such as cancer and stroke is associated with physical inactivity.84 Consequently, poor perceived mental health and physical inactivity can lead to poor sleep quality.74,85
Unexpectedly, participants with urinary disorders had a lower prevalence of insomnia in the present study. While this finding contradicts existing literature that associates urinary tract symptoms with increased sleep disruption,86 one possible explanation could involve medications used by the urinary disease patients. These may include anticholinergic drugs such as Oxybutynin,87 Tolterodine,88 and Solifenacin89,90 and alpha-blockers like Tamsulosin91 and Doxazosin,92 which are often linked to the alleviation of sleep disturbances. However, further research is warranted to clarify such a contradictory finding. On the contrary, other chronic disease patients, which included chronic insomnia, depression, dental disorders, and myopia, were more likely to be susceptible to insomnia in the current study. This finding is expected since 88.5% of the other chronic disease patients were suffering from chronic insomnia. Besides, depression,93 malnutrition,94 and dental disorders95 are also known to be associated with insomnia in the existing literature. Moreover, those whose mental healthcare needs were met exhibited a lower likelihood of insomnia. Similarly, participants with sleep disorders like sleep apnea reported a higher frequency of unmet needs for mental healthcare.96 Mental healthcare, such as mind-body therapies, can improve both physical and mental well-being, which can explain enhanced sleep quality and reduced insomnia.97
This study adds to the increasing research that employed ML approaches to identify insomnia, especially in people with chronic disease. CatBoost achieved the highest discrimination (AUC~0.77 with narrow CIs) and competitive log loss across out-of-fold evaluations, consistent with our conclusion that it is the preferred model for insomnia classification. We sought to assess and compare the efficacy of a variety of ML models in the classification of insomnia. Accuracy, precision, F1 score, log loss, and area under the receiver operating characteristic curve (AUC-ROC) were improved by the use of ensemble-based models, particularly RF and CatBoost. These findings are consistent with earlier reports showing the effectiveness of ensemble approaches in the classification of sleep disorders. Kusmakar et.al reported that RF (accuracy: 80%) outperformed SVM (accuracy: 75%) in classifying chronic insomnia cases, underscoring the robustness of ensemble approaches in handling complex, imbalanced datasets.98 In another study by Rani et al (2022), SVM classifiers to separate people with chronic insomnia from healthy sleepers based on multi-night actigraphy data achieved 81% accuracy.99 Furthermore, as demonstrated by high SHAP values in CatBoost and gain values in XGBoost, feature importance analysis showed that factors associated with the fulfillment of mental healthcare needs and nighttime sleep duration were important predictors of insomnia. These findings concur with previous research findings that highlighted the significance of psychological factors and sleep habits in identifying insomnia. In contrast, characteristics such as monthly family income had lower significance ratings, indicating that they had less of an effect on model predictions in the study dataset. This alignment between explainable AI outputs and established psychosocial mechanisms reinforces the biological plausibility of our findings.
Strengths and Limitations
A major strength of this study lies in its comprehensive analysis of the prevalence and determinants of insomnia among chronic disease patients in Bangladesh. The inclusion of a broad spectrum of factors—sociodemographic, lifestyle, behavioral, chronic disease-related, and mental health variables—enhances the study’s robustness and depth. The use of validated, established scales ensures high reliability and validity, while physician-confirmed diagnoses of chronic diseases further reinforce the credibility of the findings. Additionally, this study adopts a rigorous machine learning approach, employing a range of both conventional and ensemble models to allow for a thorough comparison of predictive performance. Class imbalance was systematically addressed through the application of SMOTE, and interpretability was strengthened by using advanced feature selection techniques such as XGBoost gain and CatBoost SHAP values. Comprehensive evaluation of model performance was achieved through multiple metrics and visualizations, including confusion matrices and ROC curves. Its ordered boosting and native handling of categorical/tabular features reduce overfitting and preprocessing burden, which likely explains its robustness on this study dataset.
Despite its strengths, this study has several limitations. The cross-sectional design restricts the ability to assess causal relationships and temporal dynamics of insomnia in the context of chronic disease. Given the recognized bidirectional relationship, some chronic diseases in our sample may have been influenced by pre-existing insomnia rather than the other way around. This could introduce bias into the observed associations. Future longitudinal studies are needed to disentangle the causal pathways and clarify the temporal dynamics between chronic diseases and insomnia. The convenience sampling method may limit generalizability and introduce selection bias. As the study relied on self-reported data, questions that depend on the patients’ memory may be prone to recall bias. Participants may have underreported socially undesirable behaviors, such as substance use or poor sleep hygiene, or overreported socially desirable ones, such as physical activity or mental health care engagement. Additionally, the subjective nature of self-reported insomnia symptoms may have been influenced by personal perceptions and psychological states, which may affect accuracy. While SMOTE improved class balance in the ML models, synthetic samples may not perfectly represent the true distribution of the data. The study was conducted in selected hospitals within a specific region of Bangladesh, which may limit the generalizability of the findings to chronic disease patients in other regions and limit external validation of the study. Due to small sample sizes for many specific diseases, we categorized similar chronic diseases together to ensure adequate statistical power; as a result, we were unable to evaluate the individual contribution of each chronic disease to insomnia. Future studies should explore the impact of specific chronic diseases on the development of insomnia with a much larger and more regionally diverse dataset. Furthermore, the study focused on a selection of chronic diseases rather than all possible conditions, which may limit the applicability of the results to other groups. The absence of external validation also constrains the broader applicability of the findings. Important unmeasured confounders, such as depression, anxiety, and stress, may have influenced the findings, as these factors might be partly attributed to relatively high prevalence of insomnia observed. Moreover, response bias cannot be ruled out, as individuals experiencing insomnia or related distress may have been more motivated to participate, potentially inflating prevalence estimates or distorting observed associations. Future research should employ longitudinal designs with randomized sampling and include a wider range of chronic illnesses and potential confounders to better elucidate causal pathways and enhance generalizability.
Conclusion and Recommendations
The present study extensively analyzed various factors associated with insomnia among individuals with chronic illness. A significant proportion of the participants were suffering from insomnia, which was associated with several factors like sociodemographic, lifestyle, behavioral, chronic disease, and mental health-related factors. Gender, family type, residence, smokeless tobacco and substance use, physical activity, afternoon napping duration, nighttime sleep duration, onset of chronic disease, presence of urinary and other chronic diseases, and meeting mental healthcare needs were associated with insomnia. The findings of the study highlight the need for evidence-based screening and interventions for a vulnerable group of chronic disease patients, such as females, urban residents, and those with late chronic disease onset. Intervention strategies should prioritize substance cessation awareness programs, promotion of physical activity and healthy sleeping practices, and improved access to mental healthcare services. While the current findings seem to support the potential of ML techniques in developing screening algorithms, efforts utilizing larger longitudinal datasets aiming to improve generalizability and implementation of deep learning models to achieve improved performance are warranted. Notably, given the cross-sectional design and reliance on self-reported data, causal inferences cannot be drawn, and the results should be interpreted as associative. Future longitudinal studies with objective sleep assessments are recommended to validate these findings.
Data Sharing Statement
The data that support the findings of this study are available from the corresponding author upon reasonable request.
Author Contributions
PD: Data curation, Investigation, Methodology, Formal analysis, Writing – Original Draft; MA: Data curation, Investigation, Methodology, Formal analysis, Methodology, Writing – Review & Editing; MEH: Data curation, Formal analysis, Methodology, Writing – Original Draft; AAH: Data curation, Investigation, Formal analysis, Methodology; Writing – Review & Editing; MMA: Conceptualization, Methodology, Formal analysis, Supervision, Writing – Review & Editing; FAM: Data curation, Investigation, Methodology, Validation, Supervision, Writing – Review & Editing; MAM: Conceptualization, Data curation, Investigation, Methodology, Supervision, Writing – Review & Editing; DG: Conceptualization, Methodology, Formal analysis, Supervision, Writing – Review & Editing.
All authors have made substantial contributions to the conception or design of the work, or the acquisition, analysis, or interpretation of data. All authors have drafted or substantially revised the paper, approved the version to be published, and agreed on the journal to which the article was submitted. They all agree to be accountable for all aspects of the work and to ensure that questions related to the accuracy or integrity of any part of the work are appropriately investigated and resolved.
Funding
MMA is currently receiving funding support from the Princess Nourah Bint Abdulrahman University Researchers Supporting Project (Number PNURSP2025R563), Princess Nourah Bint Abdulrahman University, Riyadh, Saudi Arabia. DG is supported in part by NIH grants HL166617, HL169266 and P20GM103434 grant to the West Virginia IDeA Network of Biomedical Research Excellence.
Disclosure
The authors declare that they have no competing interests, whether financial, intellectual, personal, or otherwise, that could have influenced the work reported in this study.
References
1. Roth T. Insomnia: definition, prevalence, etiology, and consequences. J Clin Sleep Med. 2007;3(5). doi:10.5664/JCSM.26929
2. Morin CM, Jarrin DC. Epidemiology of insomnia: prevalence, course, risk factors, and public health burden. Sleep Med Clin. 2022;17(2):173–191. doi:10.1016/J.JSMC.2022.03.003
3. Klimt F, Jacobi C, Brähler E, Stöbel-Richter Y, Zenger M, Berth H. Insomnia symptoms in adulthood. Prevalence and incidence over 25 years. Sleep Med. 2023;109:240–244. doi:10.1016/J.SLEEP.2023.07.013
4. Byrne EM. The relationship between insomnia and complex diseases-insights from genetic data. Genome Med. 2019;11(1):1–3. doi:10.1186/S13073-019-0668-0/METRICS
5. Carroll JE, Seeman TE, Olmstead R, et al. Improved sleep quality in older adults with insomnia reduces biomarkers of disease risk: pilot results from a randomized controlled comparative efficacy trial. Psychoneuroendocrinology. 2015;55:184–192. doi:10.1016/J.PSYNEUEN.2015.02.010
6. Dong D, Lou P, Wang J, et al. Interaction of sleep quality and anxiety on quality of life in individuals with type 2 diabetes mellitus. Health Qual Life Outcomes. 2020;18(1):1–7. doi:10.1186/S12955-020-01406-Z/TABLES/3
7. Du D, Zhang G, Xu D, et al. Prevalence and clinical characteristics of sleep disorders in chronic obstructive pulmonary disease: a systematic review and meta-analysis. Sleep Med. 2023;112:282–290. doi:10.1016/J.SLEEP.2023.10.034
8. Katz DA, McHorney CA. Clinical correlates of insomnia in patients with chronic illness. Arch Intern Med. 1998;158(10):1099–1107. doi:10.1001/ARCHINTE.158.10.1099
9. Muhammad T, Das M, Jana A, Lee S. Sex differences in the associations between chronic diseases and insomnia symptoms among older adults in India. Nat Sci Sleep. 2024;16:1339–1353. doi:10.2147/NSS.S456025
10. Stenger S, Vorobyev A, Bieber K, Lange T, Ludwig RJ, Hundt JE. Insomnia increases the risk for specific autoimmune diseases: a large-scale retrospective cohort study. Front. Netw. Physiol. 2025;5:1499297. doi:10.3389/FNETP.2025.1499297/BIBTEX
11. Zhang S, Liu J, Qu W, et al. Association between insomnia and cognitive frailty among older patients with chronic heart failure: multiple mediating effects of depressive symptoms and social support. J Cardiovasc Nurs. 2024;40(2). doi:10.1097/JCN.0000000000001124
12. Ramos AR, Wheaton AG, Johnson DA. Sleep deprivation, sleep disorders, and chronic disease. Prev Chronic Dis. 2023;20. doi:10.5888/PCD20.230197.
13. Hacker K. The Burden of Chronic Disease. Mayo Clin Proc Innov Qual Outcomes. 2024;8:112–119. doi:10.1016/j.mayocpiqo.2023.08.005
14. Gaston SA, Strassle PD, Alhasan DM, Pérez-Stable EJ, Nápoles AM, Jackson CL. Financial hardship, sleep disturbances, and their relationship among men and women in the United States during the COVID-19 pandemic. Sleep Health. 2023;9(4):551–559. doi:10.1016/j.sleh.2023.04.007
15. Huang Y, Loux T, Huang X, Feng X. The relationship between chronic diseases and mental health: a cross-sectional study. Ment Health Prev. 2023;32:200307. doi:10.1016/J.MHP.2023.200307
16. Vedaa Ø, Krossbakken E, Grimsrud ID, et al. Prospective study of predictors and consequences of insomnia: personality, lifestyle, mental health, and work-related stressors. Sleep Med. 2016;20:51–58. doi:10.1016/J.SLEEP.2015.12.002
17. Wang Y, Zhu LY, Ma YF, et al. Association of insomnia disorder with sociodemographic factors and poor mental health in COVID-19 inpatients in China. Sleep Med. 2020;75:282–286. doi:10.1016/J.SLEEP.2020.06.011
18. Runge N, Ahmed I, Saueressig T, et al. The bidirectional relationship between sleep problems and chronic musculoskeletal pain: a systematic review with meta-analysis. Pain. doi:10.1097/J.PAIN.0000000000003279
19. Basnet S, Merikanto I, Lahti T, et al. Associations of common chronic non-communicable diseases and medical conditions with sleep-related problems in a population-based health examination study. Sleep Sci. 2016;9(3):249–254. doi:10.1016/J.SLSCI.2016.11.003
20. World Health Organization (WHO). Noncommunicable diseases. Available from: https://www.who.int/news-room/fact-sheets/detail/noncommunicable-diseases.
21. World Health Organization (WHO). Improving access to noncommunicable disease services for Rohingya refugees and immediate host communities in Cox’s Bazar, Bangladesh. Available from: https://www.who.int/about/accountability/results/who-results-report-2020-mtr/country-story/2021/bangladesh.
22. Al Mamun F, Gozal D, Hosen I, Misti JM, Mamun MA. Predictive factors of insomnia during the COVID-19 pandemic in Bangladesh: a GIS-based nationwide distribution. Sleep Med. 2022;91:219–225. doi:10.1016/J.SLEEP.2021.04.025
23. Bhaskar S, Hemavathy D, Prasad S. Prevalence of chronic insomnia in adult patients and its correlation with medical comorbidities. J Family Med Prim Care. 2016;5(4):780. doi:10.4103/2249-4863.201153
24. Shrestha S, Roka T. Insomnia among elderly people in a selected urban Community. J Nepal Health Res Counc. 2023;21(2):324–329. doi:10.33314/JNHRC.V21I02.4819
25. Hu N, Wang C, Liao Y, Dai Q, Cao S. Smoking and incidence of insomnia: a systematic review and meta-analysis of cohort studies. Public Health. 2021;198:324–331. doi:10.1016/J.PUHE.2021.07.012
26. Pengpid S, Peltzer K. Tobacco use and incident sleep parameters among a rural ageing population in South Africa. Tob Induc Dis. 2023;21:02. doi:10.18332/TID/156844
27. Aernout E, Benradia I, Hazo JB, et al. International study of the prevalence and factors associated with insomnia in the general population. Sleep Med. 2021;82:186–192. doi:10.1016/J.SLEEP.2021.03.028
28. Jarrin DC, Morin CM, Rochefort A, et al. Familial Aggregation of Insomnia. Sleep. 2017;40(2). doi:10.1093/SLEEP/ZSW053
29. Gulshan V, Peng L, Coram M, et al. Development and validation of a deep learning algorithm for detection of diabetic retinopathy in retinal fundus photographs. JAMA. 2016;316(22):2402–2410. doi:10.1001/JAMA.2016.17216
30. Hannun AY, Rajpurkar P, Haghpanahi M, et al. Cardiologist-level arrhythmia detection and classification in ambulatory electrocardiograms using a deep neural network. Nat Med. 2019;25(1):65–69. doi:10.1038/S41591-018-0268-3
31. Ambale-Venkatesh B, Yang X, Wu CO, et al. Cardiovascular event prediction by machine learning: the multi-ethnic study of atherosclerosis. Circ Res. 2017;121(9):1092–1101. doi:10.1161/CIRCRESAHA.117.311312
32. Tomašev N, Glorot X, Rae JW, et al. A clinically applicable approach to continuous prediction of future acute kidney injury. Nature. 2019;572(7767):116–119. doi:10.1038/S41586-019-1390-1
33. Aoki J, Kaya C, Khalid O, et al. CKD progression prediction in a diverse us population: a machine-learning model. Kidney Med. 2023;5(9):100692. doi:10.1016/j.xkme.2023.100692
34. Kronborg T, Hangaard S, Laursen SH, et al. Impact of telemonitoring with exacerbation prediction algorithm versus telemonitoring alone on hospitalizations and health-related quality of life in patients with COPD. Respir Care. 2025;70(8):954–961. doi:10.1089/RESPCARE.12611
35. Holler E, Chekani F, Ai J, et al. Development and temporal validation of an electronic medical record-based insomnia prediction model using data from a statewide health information exchange. J Clin Med. 2023;12(9):3286. doi:10.3390/JCM12093286
36. Simon L, Terhorst Y, Cohrdes C, et al. The predictive value of supervised machine learning models for insomnia symptoms through smartphone usage behavior. Sleep Med X. 2024:7. doi:10.1016/j.sleepx.2024.100114.
37. Supratak A, Dong H, Wu C, Guo Y. DeepSleepNet: a model for automatic sleep stage scoring based on raw single-channel EEG. IEEE Trans Neural Syst Rehabil Eng. 2017;25(11):1998–2008. doi:10.1109/TNSRE.2017.2721116
38. Gardani M, Bradford DRR, Russell K, et al. A systematic review and meta-analysis of poor sleep, insomnia symptoms and stress in undergraduate students. Sleep Med Rev. 2022;61:101565. doi:10.1016/J.SMRV.2021.101565
39. Ma J, Dhiman P, Qi C, et al. Poor handling of continuous predictors in clinical prediction models using logistic regression: a systematic review. J Clin Epidemiol. 2023;161:140. doi:10.1016/J.JCLINEPI.2023.07.017
40. Froud R, Hansen SH, Ruud HK, Foss J, Ferguson L, Fredriksen PM. Relative performance of machine learning and linear regression in predicting quality of life and academic performance of school children in norway: data analysis of a quasi-experimental study. J Med Internet Res. 2021;23(7):e22021. doi:10.2196/22021
41. Al-Mamun F, Mamun MA, Hasan ME, Almerab MM, Gozal D. Exploring sleep duration and insomnia among prospective university students: a study with geographical data and machine learning techniques. Nat Sci Sleep. 2024;16:1235–1251. doi:10.2147/NSS.S481786
42. Li S, Zhu P, Cai G, Li J, Huang T, Tang W. Application of machine learning models in predicting insomnia severity: an integrative approach with constitution of traditional Chinese medicine. Front Med Lausanne. 2023;10:1292761. doi:10.3389/FMED.2023.1292761
43. Huang AA, Huang SY. Use of machine learning to identify risk factors for insomnia. PLoS One. 2023;18(4). doi:10.1371/JOURNAL.PONE.0282622
44. Centers for Disease Control and Prevention (CDC). Adult BMI Categories. Available from: https://www.cdc.gov/bmi/adult-calculator/bmi-categories.html.
45. Mamun MA, Roy N, Gozal D, Almerab MM, Hossain MS, Al Mamun F. Prevalence and associated factors of cigarette smoking and substance use among university entrance test-taking students: a GIS-based study. PLoS One. 2024;19(8):e0308697. doi:10.1371/JOURNAL.PONE.0308697
46. Moonajilin MS, Kamal MKI, Al Mamun F, et al. Substance use behavior and its lifestyle-related risk factors in Bangladeshi high school-going adolescents: an exploratory study. PLoS One. 2021;16(7):e0254926. doi:10.1371/JOURNAL.PONE.0254926
47. Cohen A, Lang JJ, Prince SA, Colley RC, Tremblay MS, Chaput JP. Are adolescents who do physical activity with their parents more active and mentally healthier? Health Rep. 2025;36(1):19–33. doi:10.25318/82-003-X202500100002-ENG
48. Kenney EL, Gortmaker SL. United states adolescents’ television, computer, videogame, smartphone, and tablet use: associations with sugary drinks, sleep, physical activity, and obesity. J Pediatr. 2017;182:144–149. doi:10.1016/J.JPEDS.2016.11.015
49. Al-Mamun F, Hussain N, Sakib N, et al. Sleep duration during the COVID-19 pandemic in Bangladesh: a GIS-based large sample survey study. Sci Rep. 2023;13(1):1–16. doi:10.1038/S41598-023-30023-1
50. Jiang B, Tang D, Dai N, et al. Association of self-reported nighttime sleep duration with chronic kidney disease: china health and retirement longitudinal study. Am J Nephrol. 2023;54(7–8):249. doi:10.1159/000531261
51. Morin CM, Benca R. Chronic insomnia. Lancet. 2012;379(9821):1129–1141. doi:10.1016/S0140-6736(11)60750-2
52. Bastien CH, Vallières A, Morin CM. Validation of the Insomnia Severity Index as an outcome measure for insomnia research. Sleep Med. 2001;2(4):297–307. doi:10.1016/S1389-9457(00)00065-4
53. Statistique Canada. Canadian community health survey (CCHS) - Annual Component - 2024. Available from: https://www23.statcan.gc.ca/imdb/p3Instr.pl?Function=assembleInstr&lang=en&Item_Id=1532313#qb1532901.
54. Meadows G, Harvey C, Fossey E, Burgess P. Assessing perceived need for mental health care in a community survey: development of the Perceived Need for Care Questionnaire (PNCQ). Soc Psychiatry Psychiatr Epidemiol. 2000;35(9):427–435. doi:10.1007/S001270050260/METRICS
55. Keller JM, Gray MR, Givens JA. A fuzzy k-nearest neighbor algorithm. IEEE Trans Syst Man Cybern. 1985;15(4):580–585. doi:10.1109/TSMC.1985.6313426
56. Belgiu M, Drăgu L. Random forest in remote sensing: a review of applications and future directions. ISPRS J. Photogramm. Remote Sens. 2016;114:24–31. doi:10.1016/J.ISPRSJPRS.2016.01.011
57. Cortes C, Vapnik V, Saitta L. Support-vector networks. Machine Learning. 1995;20(3):273–297. doi:10.1007/BF00994018
58. Chen T, Guestrin C. XGBoost: a scalable tree boosting system.
59. Friedman JH. Greedy function approximation: a gradient boosting machine. Ann Stat. 2001;29(5):1189–1232. doi:10.1214/AOS/1013203451
60. Prokhorenkova L, Gusev G, Vorobev A, Dorogush AV, Gulin A. CatBoost: unbiased boosting with categorical features. Adv Neural Inf Process Syst. 2018;31.
61. Ayalew M, Deribe B, Hussen S, Defar S, Tesfaye E, Gedefaw A. Insomnia and common mental disorder among patients with pre-existing chronic non-communicable diseases in southern Ethiopia: a survey during COVID-19 pandemic. Front Psychiatry. 2023;14:1142926. doi:10.3389/FPSYT.2023.1142926/PDF
62. Zhang Y, Ren R, Lei F, et al. Worldwide and regional prevalence rates of co-occurrence of insomnia and insomnia symptoms with obstructive sleep apnea: a systematic review and meta-analysis. Sleep Med Rev. 2019;45:1–17. doi:10.1016/J.SMRV.2019.01.004
63. Tan LH, Chen PS, Chiang HY, et al. Insomnia and Poor Sleep in CKD: a systematic review and meta-analysis. Kidney Med. 2022;4(5):100458. doi:10.1016/J.XKME.2022.100458
64. Luyster FS, Boudreaux-Kelly MY, Bon JM. Insomnia in chronic obstructive pulmonary disease and associations with healthcare utilization and costs. Respir Res. 2023;24(1):1–8. doi:10.1186/S12931-023-02401-W/FIGURES/1
65. Zeng LN, Zong QQ, Yang Y, et al. gender difference in the prevalence of insomnia: a meta-analysis of observational studies. Front Psychiatry. 2020;11:577429. doi:10.3389/FPSYT.2020.577429/BIBTEX
66. Rudan I, Sidhu S, Papana A, et al. Prevalence of rheumatoid arthritis in low– and middle–income countries: a systematic review and analysis. J Glob Health. 2015;5(1):010409. doi:10.7189/JOGH.05.010409
67. Rees F, Doherty M, Grainge MJ, Lanyon P, Zhang W. The worldwide incidence and prevalence of systemic lupus erythematosus: a systematic review of epidemiological studies. Rheumatology. 2017;56(11):1945–1961. doi:10.1093/RHEUMATOLOGY/KEX260
68. Al-Mamun F, Hasan M, Quadros S, et al. Depression among Bangladeshi diabetic patients: a cross-sectional, systematic review, and meta-analysis study. BMC Psychiatry. 2023;23(1):1–14. doi:10.1186/S12888-023-04845-2/FIGURES/5
69. Benge E, Pavlova M, Javaheri S. Sleep health challenges among women: insomnia across the lifespan. Frontiers in Sleep. 2024;3:1322761. doi:10.3389/FRSLE.2024.1322761/BIBTEX
70. Roy SK, Bhattacharjee AK, Chakraborti C, Singh R. Prevalence of insomnia in urban population of West Bengal: a community-based cross-sectional study. Int J Med Public Health. 2015;5(4):293. doi:10.4103/2230-8598.165953
71. Ailshire JA, Burgard SA. Family relationships and troubled sleep among U.S. adults: examining the influences of contact frequency and relationship quality*. J Health Soc Behav. 2012;53(2):248. doi:10.1177/0022146512446642
72. Ventriglio A, Torales J, Castaldelli-Maia JM, De Berardis D, Bhugra D. Urbanization and emerging mental health issues. CNS Spectr. 2021;26(1):43–50. doi:10.1017/S1092852920001236
73. Hasler BP, Smith LJ, Cousins JC, Bootzin RR. circadian rhythms, sleep, and substance abuse. Sleep Med Rev. 2011;16(1):67. doi:10.1016/J.SMRV.2011.03.004
74. Chen LJ, Steptoe A, Chen YH, Ku PW, Lin CH. Physical activity, smoking, and the incidence of clinically diagnosed insomnia. Sleep Med. 2017;30:189–194. doi:10.1016/J.SLEEP.2016.06.040
75. Korkutata A, Korkutata M, Lazarus M. The impact of exercise on sleep and sleep disorders. Npj Biological Timing and Sleep. 2025;2(1):1–10. doi:10.1038/s44323-024-00018-w
76. Furihata R, Kaneita Y, Jike M, Ohida T, Uchiyama M. Napping and associated factors: a Japanese nationwide general population survey. Sleep Med. 2016;20:72–79. doi:10.1016/J.SLEEP.2015.12.006
77. Badon SE, Dietch JR, Simpson N, Lyell DJ, Manber R. Daytime napping and nighttime sleep in pregnant individuals with insomnia disorder. J Clin Sleep Med. 2023;19(2):371–377. doi:10.5664/JCSM.10350/SUPPL_FILE/JCSM.10350.SM001.PDF
78. Ancoli-Israel S, Martin JL. Insomnia and daytime napping in older adults. J Clin Sleep Med. 2006;2(3):333–342. doi:10.5664/JCSM.26597
79. Liu S, Hu Z, Guo Y, Zhou F, Li S, Xu H. Association of sleep quality and nap duration with cognitive frailty among older adults living in nursing homes. Front Public Health. 2022;10:963105. doi:10.3389/FPUBH.2022.963105
80. Nemoto Y, Sato S, Kitabatake Y, et al. Bidirectional relationship between insomnia and frailty in older adults: a 2-year longitudinal study. Arch Gerontol Geriatr. 2021;97:104519. doi:10.1016/J.ARCHGER.2021.104519
81. Sivertsen B, Vedaa Ø, Harvey AG, et al. Sleep patterns and insomnia in young adults: a national survey of Norwegian university students. J Sleep Res. 2019;28(2):e12790. doi:10.1111/JSR.12790
82. Desai D, Momin A, Hirpara P, Jha H, Thaker R, Patel J. Exploring the role of circadian rhythms in sleep and recovery: a review article. Cureus. 2024;16(6):e61568. doi:10.7759/CUREUS.61568
83. Li Y, Sahakian BJ, Kang J, et al. The brain structure and genetic mechanisms underlying the nonlinear association between sleep duration, cognition and mental health. Nature Aging. 2022;2(5):425–437. doi:10.1038/s43587-022-00210-2
84. Ahmed W, Muhammad T, Muneera K. Prevalence of early and late onset of chronic diseases and multimorbidity and its association with physical, mental and functional health among older Indian adults. BMC Geriatr. 2023;23(1):1–15. doi:10.1186/S12877-023-04264-8/TABLES/5
85. Furihata R, Uchiyama M, Takahashi S, et al. The association between sleep problems and perceived health status: a Japanese nationwide general population survey. Sleep Med. 2012;13(7):831–837. doi:10.1016/J.SLEEP.2012.03.011
86. Koh JH, Lim CYJ, Yam KJM, et al. Bidirectional association of sleep disorders with chronic kidney disease: a systematic review and meta-analysis. Clin Kidney J. 2024;17(11). doi:10.1093/CKJ/SFAE279
87. Yokoyama O, Yamaguchi A, Yoshida M, et al. Once-daily oxybutynin patch improves nocturia and sleep quality in Japanese patients with overactive bladder: post-hoc analysis of a Phase III randomized clinical trial. Int J Urol. 2015;22(7):684–688. doi:10.1111/IJU.12755
88. Rovner ES, Raymond K, Andruczyk E, Juul KV. Low-dose desmopressin and tolterodine combination therapy for treating nocturia in women with overactive bladder: a double-blind, randomized, controlled study. LUTS. 2018;10(3):221–230. doi:10.1111/LUTS.12169
89. Yokoyama O, Yamaguchi O, Kakizaki H, et al. Efficacy of solifenacin on nocturia in japanese patients with overactive bladder: impact on sleep evaluated by bladder diary. J Urol. 2011;186(1):170–174. doi:10.1016/J.JURO.2011.02.2700
90. Takao T, Tsujimura A, Yamamoto K, et al. Solifenacin may improve sleep quality in patients with overactive bladder and sleep disturbance. Urology. 2011;78(3):648–652. doi:10.1016/J.UROLOGY.2011.04.020
91. Kim SO, Sik Choi H, Kwon D. The α 1 adrenoceptor antagonist tamsulosin for the treatment of voiding symptoms im-proves nocturia and sleep quality in women. Urol J. 2014;11(3):1636–1641.
92. Ceylan C, Ceylan T, Doluoglu OG, Yüksel S, Ağras K. Comparing the effectiveness of intranasal desmopressin and doxazosin in men with nocturia: a pilot randomized clinical trial. Urol J. 2013;10(3):993–998.
93. Shan W, Peng X, Tan W, Zhou Z, Xie H, Wang S. Prevalence of insomnia and associations with depression, anxiety among adults in guangdong, China: a large-scale cross-sectional study. Sleep Med. 2024;115:39–47. doi:10.1016/j.sleep.2024.01.023
94. Soysal P, Smith L, Dokuzlar O, Isik AT. Relationship between nutritional status and insomnia severity in older adults. J Am Med Dir Assoc. 2019;20(12):1593–1598. doi:10.1016/j.jamda.2019.03.030
95. Lei F, Hu X. Oral health and sleep disorders: a systematic review and meta-analysis. Biomed Rep. 2024;22(3). doi:10.3892/BR.2024.1915
96. Kaufmann CN, Susukida R, Depp CA. Sleep apnea, psychopathology, and mental health care. Sleep Health. 2017;3(4):244–249. doi:10.1016/J.SLEH.2017.04.003
97. Wang X, Li P, Pan C, Dai L, Wu Y, Deng Y. the effect of mind-body therapies on insomnia: a systematic review and meta-analysis. Evid Based Complement Alternat Med. 2019;2019(1):9359807. doi:10.1155/2019/9359807
98. Kusmakar S, Karmakar C, Zhu Y, et al. A machine learning model for multi-night actigraphic detection of chronic insomnia: development and validation of a pre-screening tool. R Soc Open Sci. 2021;8(6):202264. doi:10.1098/RSOS.202264
99. Rani S, Shelyag S, Karmakar C, et al. Differentiating acute from chronic insomnia with machine learning from actigraphy time series data. Front. Netw. Physiol. 2022;2:1036832. doi:10.3389/FNETP.2022.1036832/BIBTEX
 © 2025 The Author(s). This work is published and licensed by Dove Medical Press Limited. The
full terms of this license are available at https://www.dovepress.com/terms
and incorporate the Creative Commons Attribution
- Non Commercial (unported, 4.0) License.
By accessing the work you hereby accept the Terms. Non-commercial uses of the work are permitted
without any further permission from Dove Medical Press Limited, provided the work is properly
attributed. For permission for commercial use of this work, please see paragraphs 4.2 and 5 of our Terms.
© 2025 The Author(s). This work is published and licensed by Dove Medical Press Limited. The
full terms of this license are available at https://www.dovepress.com/terms
and incorporate the Creative Commons Attribution
- Non Commercial (unported, 4.0) License.
By accessing the work you hereby accept the Terms. Non-commercial uses of the work are permitted
without any further permission from Dove Medical Press Limited, provided the work is properly
attributed. For permission for commercial use of this work, please see paragraphs 4.2 and 5 of our Terms.
Recommended articles
Classification and Regression Tree Predictive Model for Acute Kidney Injury in Traumatic Brain Injury Patients
Wang R, Zhang J, He M, Xu J
Therapeutics and Clinical Risk Management 2024, 20:139-149
Published Date: 22 February 2024
Machine Learning-Based Predictive Modeling of Diabetic Nephropathy in Type 2 Diabetes Using Integrated Biomarkers: A Single-Center Retrospective Study
Zhu Y, Zhang Y, Yang M, Tang N, Liu L, Wu J, Yang Y
Diabetes, Metabolic Syndrome and Obesity 2024, 17:1987-1997
Published Date: 10 May 2024
Development and Validation of Upper Limb Lymphedema in Patients After Breast Cancer Surgery Using a Practicable Machine Learning Model: A Retrospective Cohort Study
Peng X, Lu Z
International Journal of General Medicine 2024, 17:3799-3812
Published Date: 2 September 2024
Identifying and Validating Prognostic Hyper-Inflammatory and Hypo-Inflammatory COVID-19 Clinical Phenotypes Using Machine Learning Methods
Ji X, Guo Y, Tang L, Gao C
Journal of Inflammation Research 2025, 18:3009-3024
Published Date: 27 February 2025
Machine Learning-Based Prediction Model for Multidrug-Resistant Organisms Infections: Performance Evaluation and Interpretability Analysis
Zhao W, Sun P, Li W, Shang L
Infection and Drug Resistance 2025, 18:2255-2269
Published Date: 6 May 2025