Back to Journals » OncoTargets and Therapy » Volume 19
Multi-Omics Analysis Identifies Phosphoglucomutase 2 as a Potential Target to Alleviate Chemoradiotherapy Resistance in Cervical Cancer Cells
Authors Yang H, Zheng Q ![]() , Li X, Wang J
, Li X, Wang J
Received 9 April 2026
Accepted for publication 1 June 2026
Published 16 June 2026 Volume 2026:19 613657
DOI https://doi.org/10.2147/OTT.S613657
Checked for plagiarism Yes
Review by Single anonymous peer review
Peer reviewer comments 2
Editor who approved publication: Prof. Dr. Gaetano Romano
Huaxiang Yang,1 Qing Zheng,2 Xin Li,2 Jingzhi Wang3
1Department of General Surgery, Chengdu Second People’s Hospital Affiliated with Sichuan University, Chengdu, People’s Republic of China; 2Department of Gastrointestinal Surgery, The First Affiliated Hospital of Shantou University Medical College, Shantou, People’s Republic of China; 3Department of Radiotherapy Oncology, The First People’s Hospital of Yancheng, Yancheng No.1 People’s Hospital, Affiliated Hospital of Medical School, Nanjing University, Yancheng, People’s Republic of China
Correspondence: Jingzhi Wang, Email [email protected]
Background: As the core treatment for cervical cancer, chemoradiotherapy efficacy is often limited by tumor heterogeneity-driven resistance. During chemoradiotherapy, the tumor microenvironment undergoes dynamic remodeling, with residual malignant cells evolving adaptively. However, the key regulatory genes driving therapeutic resistance remain elusive at single-cell resolution, which hinders the development of novel targeted therapies.
Methods: Single-cell RNA sequencing (scRNA-seq) was performed on paired clinical samples from three cervical cancer patients before and after chemoradiotherapy to identify the cellular changes and the molecular mechanisms induced by chemoradiotherapy. Through integrated multi-omics data analysis, non-heterogeneity-dependent genes with prognostic value were identified. Furthermore, the biological function of the candidate gene in chemoradiotherapy-resistant HeLa cells was verified through in vitro functional experiments, including the detection of cell proliferation, migration and invasion abilities.
Results: Chemoradiotherapy significantly reprogrammed the cellular composition of the tumor microenvironment (TME) in cervical cancer. Residual malignant cells showed activation of angiogenesis, epithelial-mesenchymal transition, stress-response, and cell-cycle programs. Eight heterogeneity-filtered prognostic genes were identified, and phosphoglucomutase 2 (PGM2) was prioritized because it was upregulated in cervical cancer, enriched in malignant cells, associated with poor prognosis, and supported by independent transcriptomic, spatial, and immunohistochemical evidence. PGM2 knockdown reduced proliferation, migration, and invasion in resistant HeLa cells.
Conclusion: PGM2 may contribute to the malignant phenotype of chemoradiotherapy-resistant cervical cancer cells and represents a candidate biomarker and therapeutic target. Further validation in larger clinical cohorts and laboratory work is needed before clinical translation.
Keywords: cervical cancer, chemoradiotherapy resistance, PGM2, single-cell RNA sequencing, tumor heterogeneity
Introduction
Cervical cancer remains one of the most common malignant tumors of the female reproductive system worldwide and continues to pose a major threat to women’s health and survival.1 Chemoradiotherapy is a standard treatment for locally advanced cervical cancer and plays an essential role in controlling disease progression.2 However, a substantial proportion of patients develop resistance to chemoradiotherapy, leading to tumor recurrence and poor clinical outcomes. Increasing evidence suggests that tumor heterogeneity and dynamic remodeling of the tumor microenvironment (TME) are noteworthy contributors to therapeutic resistance in cervical cancer.3,4 Therefore, elucidating the molecular associations underlying heterogeneity-driven chemoradiotherapy resistance and identifying effective therapeutic targets remain important challenges in cervical cancer research.
Recent advances in high-throughput sequencing technologies have greatly facilitated the investigation of tumor biology and therapeutic resistance mechanisms.5,6 In particular, single-cell RNA sequencing (scRNA-seq) has emerged as a powerful approach for characterizing cellular heterogeneity and dissecting the complex cellular composition of the TME at single-cell resolution.7,8 Previous studies have demonstrated that scRNA-seq helps reveal distinct transcriptional states of tumor cells associated with treatment response and disease progression in multiple malignancies.9,10 Nevertheless, the molecular determinants that drive chemoradiotherapy resistance in heterogeneous cervical cancer cell populations remain incompletely understood.
Metabolic reprogramming is increasingly recognized as a hallmark of cancer progression and therapy resistance.11 Alterations in glucose metabolism can promote tumor cell survival under therapeutic stress and contribute to resistance to radiotherapy and chemotherapy.12 Phosphoglucomutase 2 (PGM2), as a glucose metabolism-related enzyme, is mainly involved in the interconversion of glucose-6-phosphate and glucose-1-phosphate in glucose metabolism.13 Previous studies have suggested that PGM2 may be associated with tumor prognosis and malignant progression.14–16 Nevertheless, whether PGM2 is associated with chemoradiotherapy resistance in cervical cancer, particularly in the context of tumor heterogeneity, remains insufficiently understood.
In this study, we employed scRNA-seq technology to analyze the TME reprogramming of cervical cancer patients before and after chemoradiotherapy. By evaluating the inter-patient heterogeneity (IPH) and intra-tumor heterogeneity (ITH),17 we identified chemoradiotherapy resistance-related genes that were not affected by tumor heterogeneity. Further, we screened genes associated with the prognosis of cervical cancer. We clarified the expression pattern of PGM2 in cervical cancer and its regulatory role in the chemoradiotherapy resistance of tumor cells. This study provides potential targets for reversing the chemoradiotherapy resistance driven by tumor heterogeneity in cervical cancer.
Materials and Methods
Data Source
The scRNA-seq data were obtained from the publicly available Gene Expression Omnibus (GEO) dataset GSE236738,18 which contains paired tumor samples collected before and after chemoradiotherapy from three cervical cancer patients. The Cancer Genome Atlas-Cervical Squamous Cell Carcinoma and Endocervical Adenocarcinoma (TCGA-CESC) dataset was used for differential expression analysis and screening of prognosis-related genes. The multi-region sequencing dataset GSE5787 (containing 33 samples from 11 patients)19 was used for tumor heterogeneity analysis. The single-cell dataset GSE168652,20 spatial transcriptome data and the Human Protein Atlas (HPA) database21 were used for the verification of gene transcription and protein expression.
scRNA-Seq Data Processing and Analysis
The scRNA-seq data processing workflow is as follows:22 Initial filtering was performed by setting a minimum of 3 cells and a minimum of 200 genes. The R package DoubletFinder23 was employed to remove doublets. The novelty score24 (defined as the ratio of number of features of RNA (nFeature_RNA) to number of counts of RNA (nCount_RNA)) was calculated. Multi-dimensional filtering criteria were applied (nCount_RNA: 500–40,000; nFeature_RNA: 200–5,000; percentage of mitochondrial genes (percent.mt) ≤ 10%; novelty score ≤ 0.8), and cells meeting these criteria were retained. Normalization was conducted using the LogNormalize method. Two thousand highly variable genes were selected via the variance stabilizing transformation (VST) method. Batch correction was performed using the Harmony tool with sample type as the grouping variable. Principal Component Analysis (PCA) dimensionality reduction was performed based on highly variable genes, and the first 30 principal components were used to construct a k-nearest neighbor (KNN) graph for cell clustering. Cluster marker genes were identified using the FindAllMarkers function. Uniform Manifold Approximation and Projection (UMAP)25 plots were generated to visualize cell distribution. Finally, cell type annotation was performed using the easybio R package26 combined with known marker genes.
Malignant Cell Screening and Functional Identification
Epithelial cells were screened from the total cell population as the target cell group, with T cells serving as the normal reference. The inferCNV package27 was used to identify malignant epithelial cells. Non-negative Matrix Factorization (NMF) was performed using the GeneNMF package, with parameters set to k = 4:9, 2000 highly variable genes, and a minimum of 10 cells per sample, to extract 10 core Meta-Programs (MPs). Gene Ontology-Biological Process (GO-BP) enrichment analysis was conducted using the clusterProfiler package (Organism Homo sapiens. Ensembl Gene Database (org.Hs.eg.db)) to assign biological names and define functional modules. The AddModuleScore function was used to calculate meta-program scores, with > 0 defined as the activated state. The proportion of activated cells was statistically analyzed by Treatment-negative (TN)/Concurrent Chemoradiotherapy (CCRT) grouping, and Grammar of Graphics Plot 2 (ggplot2) was used to generate bar plots comparing the activation differences of each functional module under different clinical conditions.
Screening of Non-Heterogeneity-Dependent Resistance Genes
Gene-ITH was defined as the standard deviation of gene expression across different regions within the same patient, while IPH was quantified by calculating the mean of 10 random sampling repetitions.28 Resistance genes were classified into four heterogeneity subgroups based on the mean values of ITH and IPH. In this framework, high IPH indicates that a gene can distinguish inter-patient differences that may be relevant to individualized therapy, whereas low ITH indicates relatively stable expression within different tumor regions of the same patient, reducing the risk that the marker reflects only regional sampling bias. Therefore, genes with high IPH and low ITH were prioritized as candidate resistance genes less affected by intratumoral heterogeneity.
Core Candidate Gene Identification
Based on heterogeneity-independent resistance genes, gene expression and overall survival (OS) data from the TCGA-CESC dataset were extracted. Univariate Cox regression analysis was performed using the R package survival to screen prognostic genes significantly associated with OS (P < 0.05). These genes were classified into high-risk genes (hazard ratio (HR) > 1) and protective genes (HR < 1). Simultaneously, the limma package was used to identify differentially expressed genes between tumor and normal tissues (|log2FoldChange (FC) | > 1, P < 0.05), yielding a tumor-upregulated gene set. The intersection of high-risk genes and tumor-upregulated genes was taken to screen core candidate genes.
Spatial Transcriptome Analysis
Spatial transcriptomic data were processed according to the pipeline described by He et al29 Regions containing at least one malignant cell were defined as malignant zones (Mal), while regions without malignant cells were defined as non-malignant zones (nMal).
Cell Culture and Transfection
H8, HeLa, and MS751 cells (Saiku Biotechnology, China) were cultured at 37°C with 5% carbon dioxide (CO2). HeLa and MS751 cells were maintained in Gibco Dulbecco’s Modified Eagle Medium (DMEM) supplemented with 10% Sembek fetal bovine serum (FBS) and 1% Gibco penicillin-streptomycin; H8 cells were cultured in specialized epithelial medium (ScienCell). Medium was changed 2–3 times per week.
Induction of Chemoradiotherapy-Resistant HeLa Cells
HeLa-DDP (cis-diamminedichloroplatinum, cisplatin) cisplatin-resistant cells were purchased from Guangzhou Saiku Biotechnology Co., Ltd, seeded in T25 flasks and cultured in DMEM containing 2 μg/mL cisplatin. When cell confluence reached 60–70%, X-ray irradiation was performed (SSD 100 cm, field size 20×20 cm2), followed immediately by medium change. The initial dose was 2 gray (Gy)/min for 5 consecutive days, with a 2-day rest period, repeated for 2 cycles; the dose was subsequently increased to 3 Gy. Stable surviving clones were selected and expanded to establish the chemoradiotherapy dual-resistant cell line. This model was used as an in vitro system for functional validation.
Gene Expression Detection
Total ribonucleic acid (RNA) was extracted using Trizol reagent and reverse-transcribed into complementary deoxyribonucleic acid (cDNA). With beta-actin (β-actin) as the internal reference, relative PGM2 expression was calculated using the 2^(-ΔΔCt) method. Primer sequences: PGM2 forward, GAGGCAGTGAAACGACTAATAGC; PGM2 reverse, CTGTCCCAAACTCCATTCGGG; β-actin forward, TCCATCATGAAGTGTGACGT; β-actin reverse, GAGCAATGATCTTGATCTTCAT. PGM2 small interfering RNA (siRNA) and negative control were designed and synthesized. Transfection was performed using Lipofectamine 3000 (50 nmol/L), and cells were collected 48 hours post-transfection to verify knockdown efficiency.
Assays for Cell Proliferation
Transfected resistant HeLa cells were seeded in 96-well plates at 5×10³ cells per well. Cell Counting Kit-8 (CCK-8) reagent was added at 0, 24, 48, and 72 hours, incubated for 2 hours, and optical density (OD) values at 450 nm were measured. Proliferation curves were plotted, and experiments were repeated three times.
Wound Healing Assays for Migration
Transfected cells were seeded in 6-well plates at 2×10⁵ cells per well. When confluence exceeded 90%, a scratch was made using a pipette tip, washed three times with phosphate buffered saline (PBS), and cultured in serum-free medium. Images were captured at 0 and 24 hours, and scratch width was measured using ImageJ. Migration rate was calculated as: (width at 0h - width at detection point) / width at 0h × 100%. Experiments were repeated three times.
Transwell Assays for Migration and Invasion
Migration assay: Cells were resuspended in serum-free medium and seeded in the upper chamber at 1×10⁵ cells per well. The lower chamber contained 20% FBS DMEM. After 24 hours, cells in the upper chamber were wiped off, fixed, stained, and counted in five random fields. Invasion assay: The upper chamber was coated with Matrigel (1:8), incubated at 37°C for 30 minutes to solidify. The remaining steps were identical to the migration assay. Cells were cultured for 48 hours before counting. Experiments were repeated three times.
Statistical Analysis
Comparisons between two groups were performed using Student’s t-test (t-test) or Wilcoxon rank-sum test. Survival analysis was conducted using the Kaplan-Meier method and Log rank test. Prognostic gene screening was performed using univariate Cox regression. P < 0.05 was considered statistically significant.
Results
TME of Cervical Cancer Before and After Chemoradiotherapy
The publicly available GSE236738 dataset included paired tumor samples from three cervical cancer patients before and after chemoradiotherapy, yielding a total of 6 samples for scRNA-seq analysis. Following data quality control and filtering of low-quality cells, high-quality single-cell transcriptomic data were obtained. Through UMAP dimensionality reduction and clustering analysis (Figure 1A), nine major cell types (Figure 1B) were identified: T cells, neutrophils, epithelial cells, macrophages, natural killer (NK) cells, fibroblasts, B cells, mast cells, and endothelial cells, comprehensively covering the cell components of the cervical cancer TME.
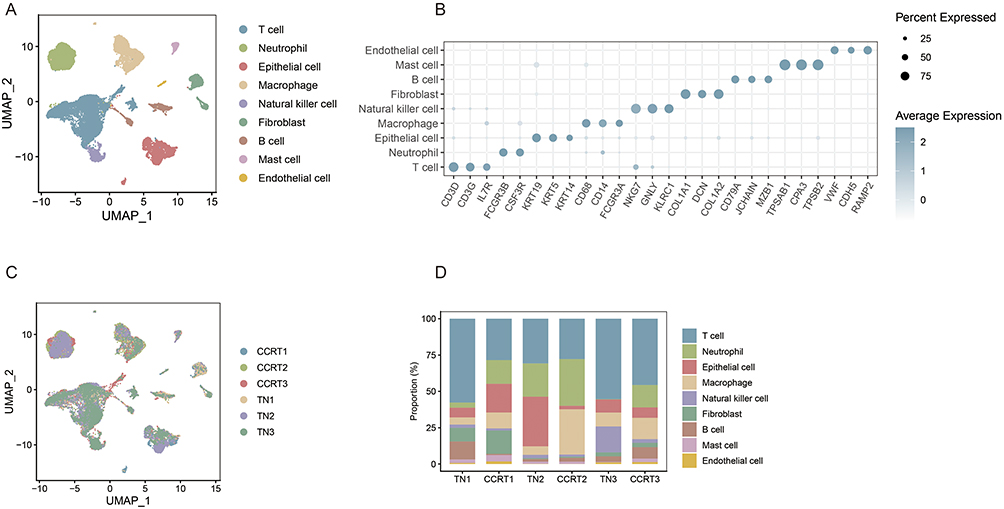 |
Figure 1 Chemoradiotherapy induced TME reprogramming of cervical cancer. (A) UMAP dimensionality reduction plot showing the clustering of all qualified single cells from 6 cervical cancer tissue samples (3 paired pre- and post-chemoradiotherapy samples). (B) UMAP plot of cell type annotation for all clustered cells, with nine major cell types labeled including T cells, neutrophils, epithelial cells, macrophages, NK cells, fibroblasts, B cells, mast cells and endothelial cells. (C) UMAP dimensionality reduction visualization of cell distribution in the Treatment-negative (TN) group and Concurrent Chemoradiotherapy (CCRT) group, showing the global cellular architecture changes of TME after chemoradiotherapy. (D) Stacked bar chart displaying the proportion changes of the nine annotated cell types in the six pre- and post-chemoradiotherapy samples, reflecting the dynamic variation of TME cellular composition induced by chemoradiotherapy. |
The annotated cells were grouped and mapped to compare changes in cellular composition of the TME before and after treatment. UMAP dimensionality reduction (Figure 1C) visualization demonstrated that CRT can reshape the cellular architecture of the cervical cancer tumor microenvironment at the global level. The stacked bar chart (Figure 1D) of cell proportions intuitively displayed the compositional changes of the nine cell types across the six samples. Epithelial cells showed high proportions in TN2 and TN3 but decreased in CCRT2 and CCRT3, suggesting marked tumor-cell reduction in these two patients. In contrast, epithelial cells increased in CCRT1 compared with TN1, indicating residual malignant-cell enrichment in this patient. Immune-cell changes were also observed, including a decrease in T-cell proportion and an increase in macrophage proportion after treatment, while neutrophils, NK cells, and B cells showed no consistent pattern across patients.
These results indicate that chemoradiotherapy can reprogram the cellular composition of the cervical cancer TME. The degree of tumor-cell elimination varied markedly among patients, supporting the need to consider inter-patient heterogeneity when interpreting treatment response and resistance.
Functional Heterogeneity of Malignant Cells
Focusing on the tumor malignant cell subpopulations (Figure 2A and B), unsupervised clustering combined with GO/ Kyoto Encyclopedia of Genes and Genomes (KEGG)30 functional enrichment analysis was performed. Based on gene co-expression modules, malignant cells were classified into 10 core functional states (Figure 2C), including angiogenesis, antigen presentation, cell cycle, ciliation, epithelial-mesenchymal transition (EMT), Hypoxia, insulin-like growth factor (IGF) signaling, inflammatory, squamous metaplasia, and stress, revealing significant functional heterogeneity within tumor cells.
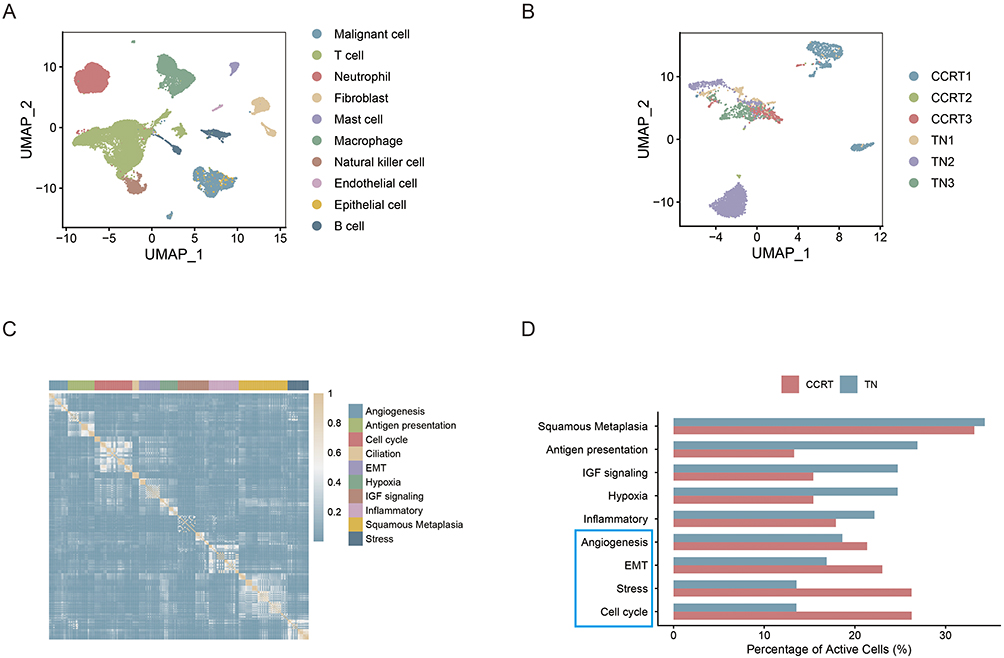 |
Figure 2 Functional heterogeneity of malignant cells in cervical cancer after chemoradiotherapy. (A) Screening of malignant epithelial cells from the total cell population using inferCNV package, with T cells as the normal reference. (B) UMAP clustering plot of the identified cervical cancer malignant cell subpopulations. (C) Classification of malignant cells into 10 core functional states based on gene co-expression modules and functional enrichment analysis. (D) Bar plot comparing the proportion of cells with activated functional pathways in the TN group and CCRT group; the red column represents the CCRT group and the blue column represents the TN group, showing the upregulation or downregulation of each functional pathway after chemoradiotherapy. The blue box highlights the pathways that were relatively more activated in the CCRT group than in the TN group. |
Comparing the proportions of cells with active functional pathways between the TN and CCRT groups (Figure 2D), the regulatory effects of chemoradiotherapy on pathway activity were analyzed. The results showed that squamous metaplasia, antigen presentation, IGF signaling, hypoxia, and inflammatory pathways were downregulated, indicating that chemoradiotherapy significantly suppressed the activity of these tumor-promoting, or immunosuppressive-related pathways. Conversely, angiogenesis, EMT, stress, and cell cycle pathways were upregulated, suggesting that residual malignant cells after chemoradiotherapy could activate these pathways to enhance their invasive and migratory capabilities, stress resistance, and proliferative escape capacity, thus establishing the molecular foundation for the development of therapeutic resistance.
Identification of Core Candidate Genes
Genes from four functional modules (angiogenesis, EMT, stress response, and cell cycle) were considered as candidate resistance genes because these pathways were activated in residual malignant cells after chemoradiotherapy. We then quantified IPH and ITH for these genes and classified them into four groups. Genes with high IPH and low ITH (Figure 3A) were prioritized because they may capture clinically relevant inter-patient differences while remaining comparatively stable within individual tumors. This selection strategy was used to reduce the confounding effect of intratumoral regional heterogeneity when screening candidate resistance targets.
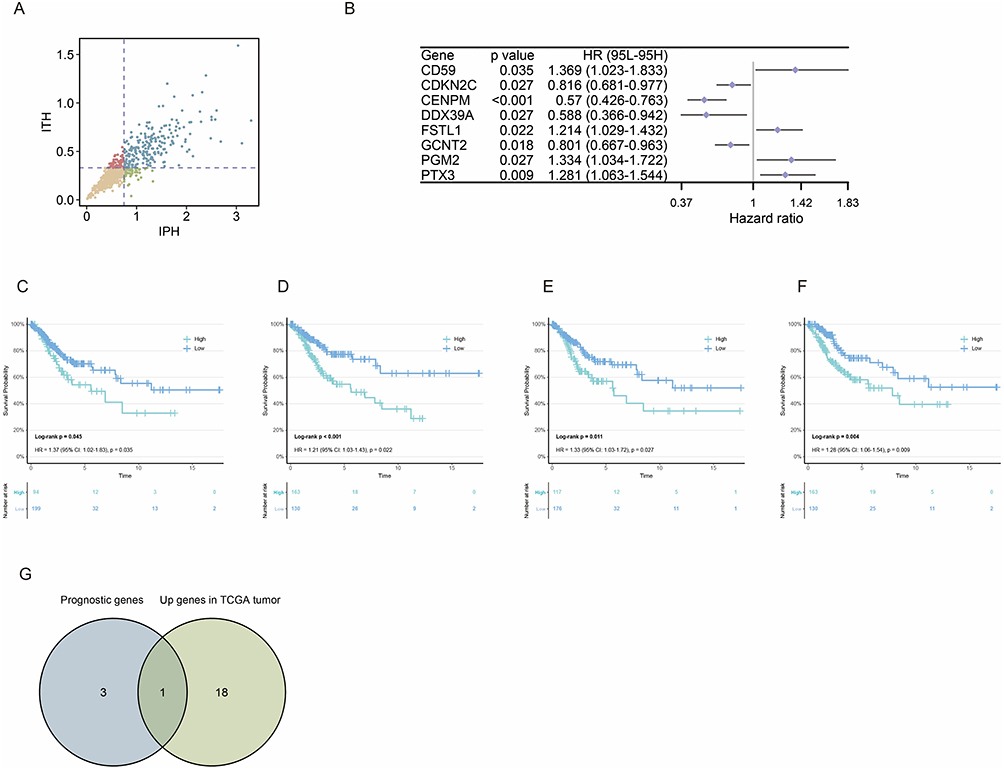 |
Figure 3 Identification of PGM2 as the core candidate gene mediating chemoradiotherapy resistance in cervical cancer. (A) Scatter plot of resistance genes classified by IPH and ITH mean values; genes in the high IPH and low ITH quadrant are defined as heterogeneity-independent resistance genes. (B) Forest plot of univariate Cox proportional hazards regression analysis for 8 prognosis-related genes significantly associated with OS of cervical cancer patients, showing HR, 95% CI and P value for each gene. (C–F) Kaplan-Meier survival curves of the four high-risk genes (CD59, FSTL1, PGM2, PTX3), with the log-rank P value indicated, demonstrating the correlation between high expression of these genes and poor OS in cervical cancer patients. (G) Venn diagram showing the intersection analysis of four high-risk genes and tumor-upregulated resistance genes in TCGA-CESC dataset, identifying PGM2 as the core candidate gene. |
Based on this framework, we attempted to explore which genes significantly influence OS in cervical cancer patients. Univariate Cox proportional hazards regression analysis identified a total of 8 prognostic genes significantly associated with OS in cervical cancer patients (P < 0.05) (Figure 3B): including 4 high-risk genes (HR > 1), namely cluster of differentiation 59 (CD59) (HR = 1.369, 95% CI: 1.023–1.833, P = 0.035), Follistatin like 1 (FSTL1) (HR = 1.214, 95% CI: 1.029–1.423, P = 0.022), PGM2 (HR = 1.334, 95% CI: 1.034–1.722, P = 0.027), and pentraxin 3 (PTX3) (HR = 1.281, 95% CI: 1.063–1.544, P = 0.009); and 4 protective genes (HR < 1). Kaplan-Meier survival curves (Figure 3C–F) also demonstrated that the four high-risk genes were associated with poor OS in cervical cancer: CD59 (Log-rank P = 0.045); FSTL1 (Log-rank P < 0.001); PGM2 (Log-rank P = 0.011); PTX3 (Log-rank P = 0.004). Intersection analysis between these four high-risk genes and the upregulated resistance gene set in TCGA cervical cancer tumor tissues ultimately identified PGM2 (Figure 3G).
Expression Characteristics of PGM2 in Cervical Cancer
Box plot analysis showed that the mRNA expression level of PGM2 was significantly elevated in cervical cancer tissues compared with normal cervical tissues (P = 0.008) (Figure 4A), verifying its specific high expression feature in tumor tissues. UMAP clustering displayed the expression distribution of PGM2 in various cell subsets, and the results suggested that PGM2 was highly enriched in malignant cell clusters (Figure 4B and C). Quantitative analysis of cell subset expression revealed that the mean expression level of PGM2 in malignant cells was higher than that in other cell types (P < 0.001) (Figure 4D). Spatial transcriptomic analysis demonstrated that the mean expression level of PGM2 in malignant area was markedly higher than that in non-malignant area (P < 0.001) (Figure 4E–I), further confirming its tumor cell-specific expression characteristic. Correlation analysis indicated that PGM2 was mainly involved in signal crosstalk among tumor cells, epithelial cells and dendritic cells (Figure 4J), suggesting that it may affect the cancer progression by regulating the cell interaction network in the TME. Immunohistochemical staining (Figure 4K–N) showed positive expression of PGM2 in cervical cancer tissues.
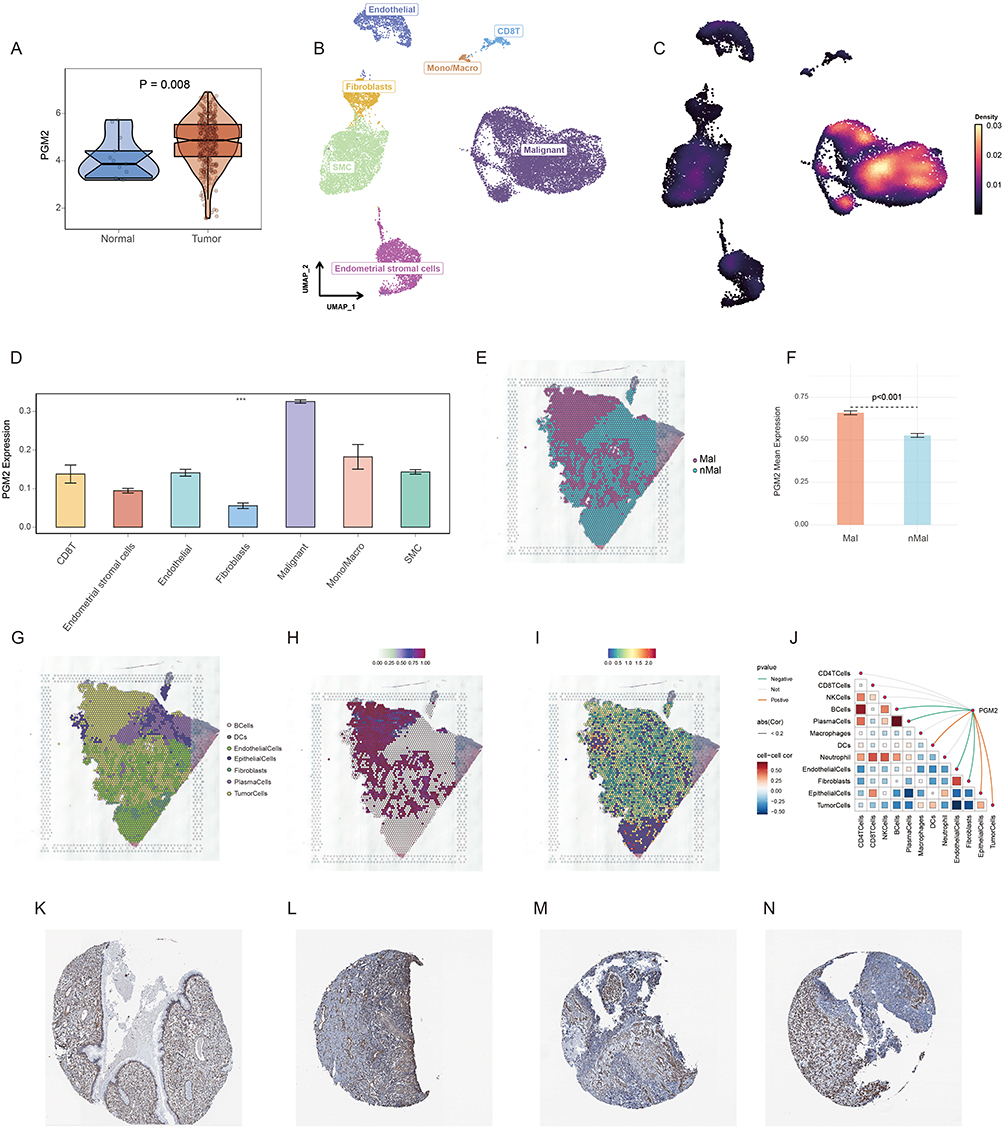 |
Figure 4 Expression characteristics of PGM2 in cervical cancer tissues and cells. (A) Box plot comparing the mRNA expression level of PGM2 between cervical cancer tissues and normal cervical tissues (P = 0.008), verifying the high expression of PGM2 in tumor tissues. (B and C) UMAP clustering plots showing the expression distribution of PGM2 in various cell subsets of cervical cancer TME; and PGM2 is highly enriched in malignant cell clusters. (D) Quantitative analysis of PGM2 expression in different cell types, showing that the mean expression level of PGM2 in malignant cells is significantly higher than that in other cell types (P < 0.001). (E) Spatial distribution map of malignant zones (Mal) and non-malignant zones (nMal) in cervical cancer tissue sections. (F) Quantitative comparison showing that the mean expression level of PGM2 was significantly higher in malignant regions (Mal) than in non-malignant regions (nMal) (P < 0.001). (G) Spatial distribution of major cell populations in the tissue section. (H) Spatial distribution of tumor-cell enrichment. (I) Spatial expression pattern of PGM2, showing its preferential localization in malignant regions. (J) Correlation analysis heatmap of PGM2 with other cell types, indicating that PGM2 is mainly involved in signal crosstalk among tumor cells, epithelial cells and dendritic cells. (K–N) Immunohistochemical staining images of PGM2 in normal cervical tissues (K) and cervical cancer tissues (L-N). ***P < 0.001. |
PGM2 Knockdown Inhibited the Malignant Phenotypes of Chemoradiotherapy-Resistant HeLa Cells
To further characterize the resistant-cell model, cisplatin sensitivity assays were performed in parental HeLa cells, cisplatin-resistant HeLa-DDP cells, and irradiation-adapted HeLa-DDP/X-ray cells. Dose-response analysis demonstrated that HeLa-DDP cells exhibited markedly increased cisplatin tolerance compared with parental HeLa cells, while additional fractionated X-ray exposure further enhanced resistance in HeLa-DDP/X-ray cells (Fig. S1A). Consistently, IC50 analysis showed a stepwise increase in cisplatin resistance from parental HeLa cells to HeLa-DDP and HeLa-DDP/X-ray cells (Fig. S1B), supporting the successful establishment of an in vitro chemoradiotherapy-resistant cervical cancer cell model.
To verify the regulatory effect of PGM2 on chemoradiotherapy-resistant cervical cancer cells, siRNA was employed to knock down PGM2 expression in resistant HeLa cells. The quantitative real-time reverse transcription polymerase chain reaction (qRT-PCR) results showed that both PGM2 siRNA1 and siRNA2 significantly reduced the mRNA expression level of PGM2 in resistant HeLa cells compared with the negative control group (siNC) (P < 0.001) (Figure 5A and B). CCK-8 assay results (Figure 5C) indicated that the OD values of resistant HeLa cells in the PGM2 knockdown group were lower than those in the negative control group at 24 hours, 48 hours and 72 hours (P < 0.001), demonstrating that PGM2 knockdown markedly suppressed the proliferative capacity of resistant HeLa cells. Wound-healing assay results revealed that the wound healing rate of cells at 24 hours was significantly lower in the PGM2 knockdown group than in the negative control group (P < 0.001) (Figure 5D and E). Transwell migration and invasion assays showed that the number of migrated and invaded cells in the lower chamber was reduced after PGM2 silencing compared with the negative control group (P < 0.001) (Figure 5F–I), confirming that PGM2 knockdown inhibited the migratory and invasive abilities of resistant HeLa cells. These findings support a functional role for PGM2 in resistant HeLa cells, while further validation in additional cervical cancer models remains necessary.
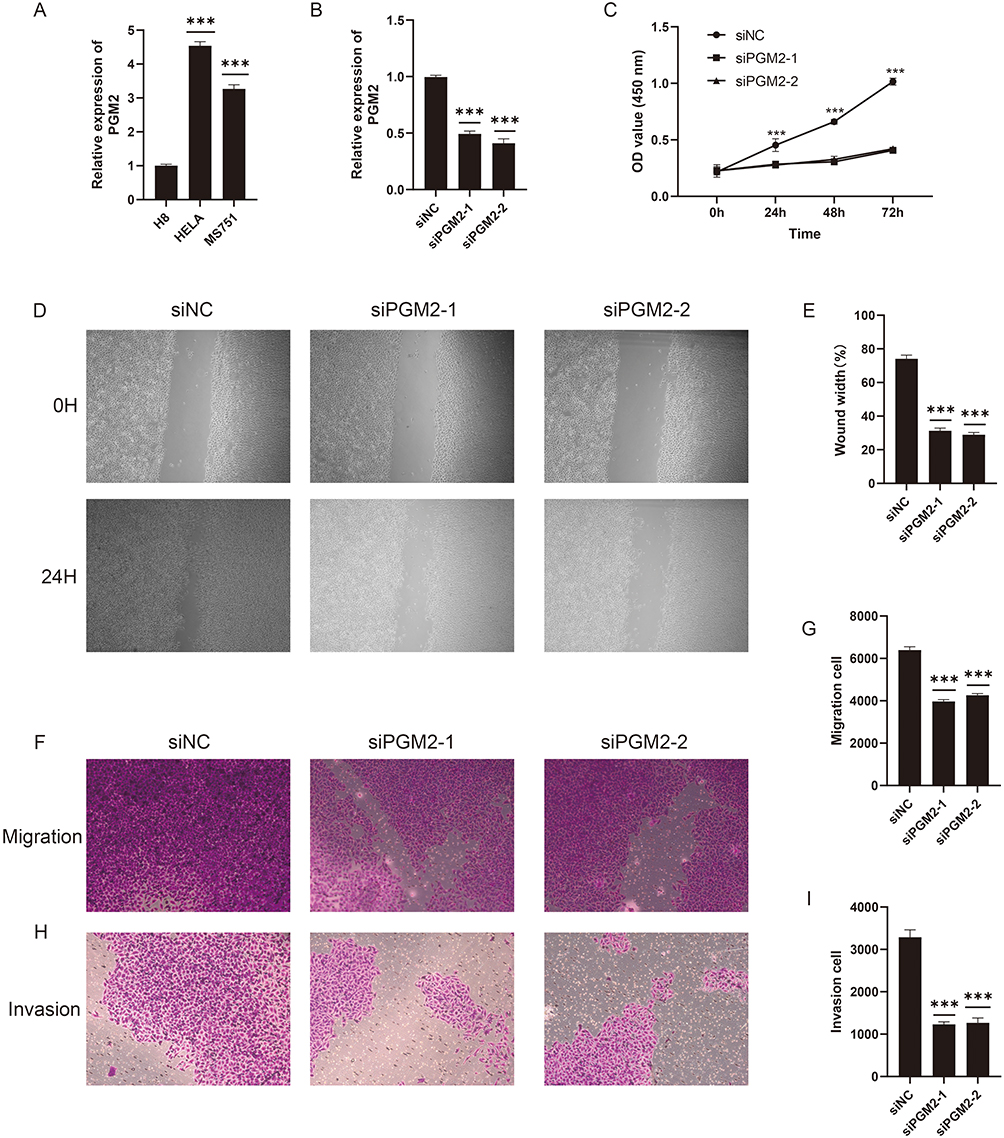 |
Figure 5 PGM2 knockdown inhibits the malignant phenotypes of chemoradiotherapy-resistant HeLa cells. (A and B) qRT-PCR results showing the mRNA expression level of PGM2 in chemoradiotherapy-resistant HeLa cells after transfection with PGM2 siRNA1, siRNA2 and negative control (siNC) (P < 0.001), verifying the efficient knockdown of PGM2. (C) CCK-8 assay proliferation curves, showing that the OD values at 450 nm in PGM2 knockdown groups are significantly lower than those in siNC group at 24 h, 48 h and 72 h (P < 0.001). (D and E) Wound healing assay results; (D) Representative images of cell scratch at 0 hour and 24 hours after transfection; (E) Quantitative analysis of wound healing rate, showing that the healing rate in PGM2 knockdown groups is significantly lower than that in siNC group (P < 0.001). (F–I) Transwell migration and invasion assay results; (F–H) Representative stained images of migrated and invaded cells in the lower chamber; (G and I) Quantitative analysis of the number of migrated and invaded cells, showing that PGM2 silencing significantly reduces the number of migrated and invaded cells compared with siNC group (P < 0.001). ***P < 0.001. |
Discussion
In this study, publicly available paired cervical cancer samples collected before and after chemoradiotherapy were analyzed by scRNA-seq to investigate therapy-induced TME remodeling. The results showed inter-patient differences in epithelial-cell dynamics after treatment: tumor cells were reduced in some patients, whereas residual malignant cells were enriched in another patient. This finding supports the concept that treatment response in cervical cancer is strongly influenced by tumor heterogeneity. Functional analysis of malignant cells identified 10 core functional states. In residual cells after chemoradiotherapy, angiogenesis, EMT, stress-response, and cell-cycle programs were upregulated, suggesting that resistant cells may escape treatment pressure by activating pathways related to invasion, stress adaptation, and proliferation. These results provide a rationale for screening candidate targets associated with chemoradiotherapy resistance.
Eight prognosis-related genes were screened via univariate Cox regression analysis, and PGM2 was identified as a core gene that satisfied both “prognosis relevance” and “specific high expression in tumor cells”. Kaplan–Meier survival analysis further validated its predictive value for poor prognosis, suggesting that PGM2 may serve as a potential biomarker for prognostic evaluation in cervical cancer. Subsequent multi-omics validation at the single-cell, spatial transcriptomic, and tissue levels showed that PGM2 expression was significantly upregulated in cervical cancer tissues and may participate in intercellular communication between tumor cells and immune cells. These findings imply that PGM2 not only regulates the malignant phenotypes of tumor cells themselves but may also further promote tumor progression and the development of therapy resistance by remodeling the cellular interaction network in the tumor microenvironment.
In vitro functional experiments in this study confirmed that knockdown of PGM2 significantly inhibited the proliferation, migration, and invasion of chemoradiotherapy-resistant HeLa cervical cancer cells, verifying the regulatory role of PGM2 in the malignant phenotypes of cervical cancer cells and revealing its potential value as a therapeutic target for cervical cancer. As a key enzyme involved in glucose metabolism, PGM2 mainly catalyzes the interconversion between glucose-6-phosphate and glucose-1-phosphate. As malignant proliferation and invasion are frequently supported by metabolic reprogramming, PGM2 may help resistant cells maintain energy and biosynthetic substrate supply under treatment pressure. However, we did not directly measure glucose-6-phosphate, glucose-1-phosphate, lactate production, glycolytic flux, or downstream signaling partners in the present study. Therefore, the metabolic mechanism remains a hypothesis supported by bioinformatic and functional evidence and requires direct biochemical validation.
This study has several limitations. First, the paired scRNA-seq cohort included only three cervical cancer patients. We attempted to reduce this limitation by integrating TCGA-CESC, GSE5787, GSE168652, spatial transcriptomic data, and HPA protein evidence, but larger independent cohorts are still required. Second, functional validation was performed in a chemoradiotherapy-resistant HeLa cell model. This model cannot fully represent the heterogeneity of clinical cervical cancer. Third, PGM2 function was verified only at the in vitro cellular level and lacks in vivo confirmation. Finally, the detailed metabolic and signaling mechanisms by which PGM2 regulates resistance remain to be clarified through targeted metabolic assays, pathway experiments, and molecular interaction analyses.
Conclusion
This study reveals the remodeling landscape of the cervical cancer TME after chemoradiotherapy and identifies PGM2 as a candidate prognosis-related gene associated with resistant malignant-cell phenotypes. Further validation in larger patient cohorts, in vivo experiments, and mechanistic metabolic studies is necessary before clinical application.
Data Sharing Statement
The datasets presented in this study can be found in online repositories. The names of the repository/repositories and accession number (s) can be found in the article.
Ethics Approval and Consent
This article does not contain any studies with human participants or animals performed by any of the authors. This study utilized publicly available data from The Cancer Genome Atlas (TCGA) database and the Gene Expression Omnibus (GEO) database. Both databases have been ethically approved by the respective institutions, and all data provided are de-identified and anonymized. As the data does not involve direct human intervention, the study was exempt from requiring institutional review board (IRB) approval based on national legislation. According to Article 32 of the Measures for Ethical Review of Life Science and Medical Research Involving Human Subjects (February 18, 2023, China), studies involving publicly available and de-identified data do not require IRB approval.
Funding
There is no funding to report.
Disclosure
The authors declare that they have no competing interests.
References
1. Waggoner SE. Cervical cancer. Lancet. 2003;361(9376):2217–12. doi:10.1016/s0140-6736(03)13778-6
2. Francoeur AA, Monk BJ, Tewari KS. Treatment advances across the cervical cancer spectrum. Nat Rev Clin Oncol. 2025;22(3):182–199. doi:10.1038/s41571-024-00977-w
3. Mo C-K, Liu J, Chen S, et al. Tumour evolution and microenvironment interactions in 2D and 3D space. Nature. 2024;634(8036):1178–1186. doi:10.1038/s41586-024-08087-4
4. Lin S, Luo Z, Li Y, et al. Integrated spatial multi-omics delineates fatty acid degradation fuels malignant evolution at the tumour periphery in cervical squamous cell carcinoma. EBioMedicine. 2026;127:106256. doi:10.1016/j.ebiom.2026.106256
5. Zheng Q, Gong Z, Li B, Wang H, Lin S. Development and validation of the antibody-dependent cellular phagocytosis-based signature: a prognostic risk model of gastric cancer. Adv Clin Experim Med. 2024;34(3):433–446. doi:10.17219/acem/189914
6. Zheng Q, Gong Z, Lin S, Ou D, Lin W, Shen P. Integrated analysis of a competing endogenous RNA network reveals a ferroptosis-related 6-lncRNA prognostic signature in clear cell renal cell carcinoma. Adv Clin Experim Med. 2024;33(12):1391–1407. doi:10.17219/acem/176050
7. Yue S, Wang Q, Zhang J, Hu Q, Liu C. Understanding cervical cancer at single-cell resolution. Cancer Lett. 2023;576:216408. doi:10.1016/j.canlet.2023.216408
8. Dagogo-Jack I, Shaw AT. Tumour heterogeneity and resistance to cancer therapies. Nat Rev Clin Oncol. 2018;15(2):81–94. doi:10.1038/nrclinonc.2017.166
9. Gavish A, Tyler M, Greenwald AC, et al. Hallmarks of transcriptional intratumour heterogeneity across a thousand tumours. Nature. 2023;618(7965):598–606. doi:10.1038/s41586-023-06130-4
10. Yin X, Li X, Mi L, Hou J, Yin F. Single-cell transcriptomic analysis reveals epithelial and microenvironmental heterogeneity in small cell carcinoma of the esophagus. Front Immunol. 2025;16:1672587. doi:10.3389/fimmu.2025.1672587
11. Mao Y, Xia Z, Xia W, Jiang P. Metabolic reprogramming, sensing, and cancer therapy. Cell Rep. 2024;43(12):115064. doi:10.1016/j.celrep.2024.115064
12. Zhang D, Li J, Wang F, Hu J, Wang S, Sun Y. 2-Deoxy-D-glucose targeting of glucose metabolism in cancer cells as a potential therapy. Cancer Lett. 2014;355(2):176–183. doi:10.1016/j.canlet.2014.09.003
13. Beck W. Differential function of the phosphoglucomutase isozymes PGM1 and PGM2. Hum Genet. 1979;50(1):93–100. doi:10.1007/bf00295595
14. Yu H, Yu Z, Qin C, Bian T, Shi M. High expression of glycolysis-related PGM2 gene in relation to poor prognosis and deficient immune cells infiltration in lung adenocarcinoma: a study based on bioinformatics analysis. J Thoracic Dis. 2022;14(9):3488–3499. doi:10.21037/jtd-22-1043
15. Zheng Z, Bai J, Shen S, Zhu C, Zhou Y, Zhang X. Meta-analysis of the effect of PGM on survival prognosis of tumor patients. Front Oncol. 2022;12:1060372. doi:10.3389/fonc.2022.1060372
16. Lyu Y, Liu C, Lin H, et al. Nuclear translocation of nucleotide enzyme Phosphoglucomutase 2 governs DNA damage response and anti-tumor immunity. Heliyon. 2024;10(17):e36415. doi:10.1016/j.heliyon.2024.e36415
17. Yang C, Zhang S, Cheng Z, et al. Multi-region sequencing with spatial information enables accurate heterogeneity estimation and risk stratification in liver cancer. Genome Medicine. 2022;14(1):142. doi:10.1186/s13073-022-01143-6
18. Dai D, Pei Y, Zhu B, et al. Chemoradiotherapy-induced ACKR2+ tumor cells drive CD8+ T cell senescence and cervical cancer recurrence. Cell Rep Med. 2024;5(5):101550. doi:10.1016/j.xcrm.2024.101550
19. Bachtiary B, Boutros PC, Pintilie M, et al. Gene expression profiling in cervical cancer: an exploration of intratumor heterogeneity. Clin Cancer Res. 2006;12(19):5632–5640. doi:10.1158/1078-0432.Ccr-06-0357
20. Li C, Guo L, Li S, Hua K. Single-cell transcriptomics reveals the landscape of intra-tumoral heterogeneity and transcriptional activities of ECs in CC. Mol Ther Nucleic Acids. 2021;24:682–694. doi:10.1016/j.omtn.2021.03.017
21. Uhlén M, Fagerberg L, Hallström BM, et al. Proteomics. Tissue-based map of the human proteome. Science. 2015;347(6220):1260419. doi:10.1126/science.1260419
22. Satija R, Farrell JA, Gennert D, Schier AF, Regev A. Spatial reconstruction of single-cell gene expression data. Nature Biotechnol. 2015;33(5):495–502. doi:10.1038/nbt.3192
23. McGinnis CS, Murrow LM, Gartner ZJ. DoubletFinder: doublet detection in single-cell RNA sequencing data using artificial nearest neighbors. Cell Systems. 2019;8(4):329–337.e324. doi:10.1016/j.cels.2019.03.003
24. Zhang Y, Zuo A, Ba Y, et al. Cancer-associated fibroblast-derived SEMA3C facilitates colorectal cancer liver metastasis via NRP2-mediated MAPK activation. Proc Natl Acad Sci USA. 2025;122(21):e2423077122. doi:10.1073/pnas.2423077122
25. Becht E, McInnes L, Healy J, et al. Dimensionality reduction for visualizing single-cell data using UMAP. Nature Biotechnol. 2018. doi:10.1038/nbt.4314
26. Cui W. easybio: an R package for single-cell annotation with CellMarker2.0. bioRxiv. 2024. doi:10.1101/2024.09.14.609619
27. Patel AP, Tirosh I, Trombetta JJ, et al. Single-cell RNA-seq highlights intratumoral heterogeneity in primary glioblastoma. Science. 2014;344(6190):1396–1401. doi:10.1126/science.1254257
28. Luo S, Jia Y, Zhang Y, Zhang X. A transcriptomic intratumour heterogeneity-free signature overcomes sampling bias in prognostic risk classification for hepatocellular carcinoma. JHEP Reports. 2023;5(6):100754. doi:10.1016/j.jhepr.2023.100754
29. Guo W, Zhou B, Yang Z, et al. Integrating microarray-based spatial transcriptomics and single-cell RNA-sequencing reveals tissue architecture in esophageal squamous cell carcinoma. EBioMedicine. 2022;84:104281. doi:10.1016/j.ebiom.2022.104281
30. Kanehisa M. KEGG: kyoto encyclopedia of genes and genomes. Nucleic Acids Res. 2000;28(1):27–30. doi:10.1093/nar/28.1.27
 © 2026 The Author(s). This work is published and licensed by Dove Medical Press Limited. The
full terms of this license are available at https://www.dovepress.com/terms
and incorporate the Creative Commons Attribution
- Non Commercial (unported, 4.0) License.
By accessing the work you hereby accept the Terms. Non-commercial uses of the work are permitted
without any further permission from Dove Medical Press Limited, provided the work is properly
attributed. For permission for commercial use of this work, please see paragraphs 4.2 and 5 of our Terms.
© 2026 The Author(s). This work is published and licensed by Dove Medical Press Limited. The
full terms of this license are available at https://www.dovepress.com/terms
and incorporate the Creative Commons Attribution
- Non Commercial (unported, 4.0) License.
By accessing the work you hereby accept the Terms. Non-commercial uses of the work are permitted
without any further permission from Dove Medical Press Limited, provided the work is properly
attributed. For permission for commercial use of this work, please see paragraphs 4.2 and 5 of our Terms.
Recommended articles
Glycolysis-Driven Immune Evasion in Microsatellite Instability-High Colorectal Cancer: An Integrated Single-Cell and Spatial Transcriptomics Study
Li C, Cai P, Zeng H, Li J, Hu H, Zhang J, Wu Z, Qin G, Deng Y
OncoTargets and Therapy 2025, 18:1027-1042
Published Date: 18 September 2025
Development of a Prognostic Stratification Model and Identification of BDH1 as an Oncoprotein in Breast Cancer Based on Subcluster-Specific Markers of B-Cell Subsets
Kang S, Li Z, Lv C, Zhang F
Breast Cancer: Targets and Therapy 2026, 18:580906
Published Date: 10 March 2026
Integrated Multi-Omics Analysis Constructs an Intratumoral Heterogeneity-Corrected Prognostic Signature for Cervical Cancer
Tang X, Zheng Q, Li X, Wang K
International Journal of General Medicine 2026, 19:593477
Published Date: 31 March 2026
Association of the CXCL–ACKR1 Signaling Axis with the Angiogenic Microenvironment in Endometrial Cancer: A Single-Cell Transcriptomic Analysis
Zhao K, Jiang Y
International Journal of Women's Health 2026, 18:582387
Published Date: 1 May 2026