Back to Journals » International Journal of General Medicine » Volume 19
Integrated Multi-Omics Analysis Constructs an Intratumoral Heterogeneity-Corrected Prognostic Signature for Cervical Cancer
Authors Tang X, Zheng Q ![]() , Li X, Wang K
, Li X, Wang K
Received 3 January 2026
Accepted for publication 19 March 2026
Published 31 March 2026 Volume 2026:19 593477
DOI https://doi.org/10.2147/IJGM.S593477
Checked for plagiarism Yes
Review by Single anonymous peer review
Peer reviewer comments 2
Editor who approved publication: Dr Ching-Hsien Chen
Xiaobo Tang,1 Qing Zheng,2 Xin Li,2 Kaisong Wang3
1Department of General Surgery, Huizhou Third People’s hospital, Guangzhou Medical University, Huizhou, Guangdong, People’s Republic of China; 2Department of Gastrointestinal Surgery, The First Affiliated Hospital of Shantou University Medical College, Shantou, Guangdong, People’s Republic of China; 3Department of General Surgery, the First Affiliated Hospital of Shantou University Medical College, Shantou, Guangdong, People’s Republic of China
Correspondence: Kaisong Wang, Email [email protected]
Introduction: Tumor heterogeneity challenges the accuracy of existing prognostic models for cervical squamous cell carcinoma and endocervical adenocarcinoma (CESC). Prognostic models that correct for tumor heterogeneity remain unexplored.
Methods: Based on the GSE5787 dataset comprising 33 multiregional samples from 11 patients with CESC, we calculated both interpatient heterogeneity (IPH) and intratumoral heterogeneity (ITH) scores. Genes with low heterogeneity were selected to construct a prognostic model using the CESC cohort from The Cancer Genome Atlas (TCGA). Key gene expression was validated in HeLa and SiHa cell lines. The functional consequences of gene knockout were assessed through Cell Counting Kit-8 (CCK-8) proliferation assays, wound healing migration assays, and Transwell assays.
Results: Genes exhibiting low heterogeneity were predominantly associated with energy metabolism pathways, whereas those displaying high heterogeneity were enriched in immune-related signaling pathways. The risk score based on Armadillo Repeat Containing X-Linked 1 (ARMCX1) and Signal Transducing Adaptor Family Member 2 (STAP2) achieved area under the curve (AUC) values of 0.74, 0.68, and 0.74 for predicting 1-year, 3-year, and 5-year overall survival, respectively. Importantly, this signature demonstrated robust performance with a risk classification inconsistency rate of merely 18%, outperforming 10 previously published CESC prognostic models. The integrative nomogram incorporating both the risk score and clinical staging demonstrated enhanced prognostic accuracy. Although patients in the high-risk group exhibited diminished immunotherapy efficacy, drug sensitivity screening identified seven potentially effective therapeutic agents as alternative treatment options. In vitro experiments demonstrated that STAP2 knockdown suppressed HeLa cell proliferation, migration, and invasive capacity.
Conclusion: This study establishes a robust gene signature through ITH correction, which may mitigate single-region sampling bias and offers a promising tool for prognostic stratification in CESC.
Keywords: biomarker, cervical cancer, immune microenvironment, prognostic model, tumor heterogeneity
Introduction
Cervical squamous cell carcinoma and endocervical adenocarcinoma (CESC) is one of the most common cancers among women worldwide and a significant cause of death. Most CESC cases occur in low- and middle-income countries, with the heaviest burden in sub-Saharan Africa and South Asia.1 Persistent infection with high-risk human papillomavirus (HPV) is the main pathogenic factor for CESC. Although the application of HPV vaccines and screening technologies has reduced the incidence rate in developed countries, the global five-year survival rate still needs improvement.2 The current International Federation of Gynecology and Obstetrics (FIGO) staging system serves as the primary guideline for CESC treatment, yet it struggles to achieve precise risk stratification and individualized prognosis prediction. This limitation underscores the urgent need to develop accuracy prognostic models to guide clinical precision treatment decisions.
Over the past two decades, high-throughput sequencing technologies have advanced cancer biology research, particularly in the identification of cancer prognostic biomarkers based on transcriptomic data.3–5 Although several prognostic models for CESC have been reported, their clinical application remains limited.6–8 This is attributed to the lack of high-quality, large-sample CESC datasets or inconsistent data quality leading to unstable model performance. Additionally, differences in data standards across research centers hinder model validation. Beyond these factors, previous studies pointed out that the role of tumor heterogeneity has not been adequately considered.9,10 Tumor heterogeneity includes interpatient heterogeneity (IPH) and intratumoral heterogeneity (ITH).11 In addition, tumor heterogeneity is commonly classified by its molecular carriers into genomic and transcriptomic dimensions.12–14 Genomic heterogeneity12 is manifested in the differences at the deoxyribonucleic acid (DNA) level among patients and between different tumor regions. Transcriptomic heterogeneity,15 arises when identical DNA templates produce divergent ribonucleic acid (RNA) outputs through differential gene activation and silencing, resulting in variable transcript types and abundances across tumor cells. Most CESC prognostic models rely on single-region sample analysis and ignore ITH, which brings challenges to the reproducibility of the predictive models.
Immunotherapy has become an important therapeutic strategy for a variety of malignant tumors including CESC. Immune checkpoint inhibitors targeting the programmed death ligand 1 (PD-L1) have shown efficacy in recurrent or metastatic CESC.16 However, ITH can lead to differentiated immune microenvironments in different regions of the same tumor,15 which may promote immune escape and trigger heterogeneous therapeutic responses. It is crucial to develop a prognostic model that can correct ITH and integrate immune-related features. Such models help identify patients who may benefit from immunotherapy and promote the development of precision medicine for CESC.
This study analyzed IPH and ITH in CESC, evaluating the inherent sampling bias in existing prognostic models. We identified two genes with consistent expression within individual tumors but significant differences between patients, including ARMCX117 (Armadillo Repeat Containing X-Linked 1, involved in mitochondrial dynamics and apoptosis regulation) and STAP218 (Signal Transducing Adaptor Family Member 2, a positive modulator of Signal Transducer and Activator of Transcription 3/Signal Transducer and Activator of Transcription 5 (STAT3/STAT5) signaling). Based on ARMCX1 and STAP2, we constructed an ITH-corrected gene signature, which improved the accuracy and reliability of prognosis assessment for patients with CESC.
Methods
Data Acquisition and Processing
Transcriptomic data of multi-region CESC samples were retrieved from the public GSE5787 dataset.19 The dataset includes microarray data (platform GPL570, HG-U133_Plus_2) from 33 tumor regions of 11 CESC patients. The raw data were preprocessed using the Robust Multi-array Average (RMA) method, and probes were converted to gene symbols using the platform annotation file, retaining the gene probe with the highest average expression.
We obtained single-region RNA sequencing (RNA-seq) data from 309 CESC patients in The Cancer Genome Atlas (TCGA) database. This dataset included transcripts per million (TPM)-normalized gene expression profiles and matched clinical records. Samples with tissue type annotated as “Primary Tumor” were selected. Patients with a survival time of less than 30 days were excluded. Prior to analysis, the transcriptomic expression profiles were transformed using log2(TPM +1). The study’s survival analysis endpoint was defined as overall survival.
The GSE16865220 single-cell RNA-seq dataset was incorporated and processed with the Seurat (v5) package.21 During quality control, we removed cells with >5% mitochondrial gene content, or those expressing fewer than 200 or more than 6000 genes. Subsequently, the Single Cell Transform (SCT) method was applied for data normalization to eliminate technical noise. We then reduced data dimensionality using the top 15 principal components and visualized cell cluster distribution with Uniform Manifold Approximation and Projection (UMAP).
Spatial transcriptomic analysis was performed following the pipeline proposed by He et al22 Seurat was used for downstream analysis, including data normalization using the SCT function. Tissue micro-regions with any malignant cells (>0%) were labeled as malignant regions (Mal). Those without malignant cells (0%) were labeled as non-malignant regions (nMal).
Somatic mutation data for CESC was obtained from TCGA. We used maftools23 to identify mutation signatures and created a waterfall plot showing how mutations were distributed across samples and genes. Furthermore, a heatmap of gene mutation co-occurrence and mutual exclusivity patterns was constructed.
Tumor Heterogeneity Analysis
Mutant-Allele Tumor Heterogeneity (MATH)24 was used to quantify intratumoral genomic heterogeneity. Transcriptomic heterogeneity was quantified based on GSE5787 multi-region data. Unsupervised hierarchical clustering of the top 1500 variably expressed genes revealed heterogeneity among patients. Cell-type Identification By Estimating Relative Subsets Of RNA Transcripts (CIBERSORT)- Absolute Mode (abs)25 was employed to quantify the proportions of immune cell subsets. Gene Set Co-regulation Analysis (GESECA) was used to assess the overall impact of the top ten enriched pathways across multi-region samples. Immuno-Oncology Biological Research 2 (IOBR2)26 was used to quantify immune activity across the seven steps of the tumor-immunity cycle.
Intratumoral and interpatient variances were measured using linear mixed-effects analysis and variance-based methods (implemented with the Non-Linear Mixed Effects (NLME) R package).19,27 From these measurements, the intratumoral variability score (ITVS) was calculated as ITVS = intratumoral variance/(interpatient variance + intratumoral variance). Hierarchical clustering was then performed iteratively, progressively increasing cluster numbers from 1 to the total sample size (N). At each clustering level, the patient grouping odds ratio (PGOR) was computed as the proportion of correctly grouped patients. The area under the PGOR curve (AUPC) was quantified via numerical integration. Using this value, the clustering consistency score (CCS) was derived from CCS = 1 - AUPC/(N-1).10,28 Finally, the integrated heterogeneity score (IHS) was determined as the geometric mean of ITVS and CCS. A lower IHS indicates reduced gene-level heterogeneity.
Prognostic Signature and Nomogram Construction
The limma package29 was employed to screen differentially expressed genes (DEGs), using a false discovery rate (FDR) < 0.05 and a cutoff value of | log2 Fold Change (FC)| > 1.5 as criteria.30 Protein-coding genes were stratified into a low-heterogeneity group using a IHS score < 0.25.31 Prognosis-related low-ITH genes were screened via univariate Cox regression and the proportional hazards (PH) assumption. Model genes were obtained by intersecting prognosis-related low-ITH genes with DEGs. During model construction, a multivariate Cox regression algorithm was applied. The TCGA-CESC dataset was divided into a 60% training set for model building and a 40% test set for model validation. Univariate and multivariate Cox analyses were performed on clinical variables and risk scores to identify significant variables for nomogram construction.
Compilation of Prognostic Gene Expression Signatures
Ten CESC-related gene prognostic risk models previously published were collected. These models employed the signature risk score formula: Risk score = Σ (Expi × Coefi), where Expi and Coefi represent the expression levels and coefficients of prognostic genes. In each of the 10 models, samples were stratified into high-risk or low-risk categories based on the median risk score cutoff derived from each cohort. For each tumor region in GSE5787, risk scores were calculated. Patients with only low-risk regions were classified as “concordant low-risk”, those with only high-risk regions as “concordant high-risk”, and those with mixed risk as “discordant”.
Drug Sensitivity Analysis
Based on gene expression profiles, drug sensitivity was predicted using the pRRophetic algorithm.32 Spearman rank correlation test was used to calculate the correlation coefficient between risk score and drug half maximal inhibitory concentration (IC50), and the Benjamini-Hochberg method was applied for FDR correction to control multiple comparison error. Drugs with |r| > 0.3 and FDR-adjusted p < 0.05 were retained as candidate drugs.33
Cell Lines
In this experiment, the following cell lines were used: human normal cervical epithelial cells H8 (Shanghai Baiye Biotechnology Center, China), human CESC cells HeLa and SiHa (both from Shanghai BiOESN Biotechnology, China). All cells were cultured in Dulbecco’s modified Eagle’s medium (DMEM), supplemented with 1% penicillin (SV30010, HyClone) and 10% fetal bovine serum (FBSSA500-S, AusGeneX). The cells were incubated at 37°C in a 5% CO2 atmosphere.
RT-qPCR
Total RNA was extracted using TRIzol Reagent (DP424, Tiangen Biotech). Reverse transcription was performed using the RevertAid First Strand cDNA Synthesis Kit (K1622, Thermo Fisher Scientific), and Polymerase Chain Reaction (PCR) amplification was carried out on an ABI Veriti thermal cycler using TB Green® Premix Ex Taq™ II (RR820A, Takara). Glyceraldehyde-3-phosphate dehydrogenase (GAPDH) was used as the internal reference gene, and the primer sequences were designed as follows. GAPDH: Forward: 5′-GAAGGTGAAGGTCGGAGTC-3′, Reverse: 5′-GAAGATGGTGATGGGATTTC-3′. ARMCX1: Forward: 5′-GTAGCCTTGGTCACTCTG-3′, Reverse: 5′-TTCTGCGTTCACACTCAA-3′. STAP2: Forward: 5′-TGGCCCAGCTGTTGACTATG-3′, Reverse: 5′-AAAGACTTTGGGCTCTGGCT-3′. The amplification protocol consisted of 30 seconds of pre-denaturation at 95°C, 40 cycles of 10 seconds at 95°C and 30 seconds at 60°C. Each sample was run in triplicate. All results were calculated using the 2−ΔΔCT formula.
Cell Function Analyses
STAP2 gene silencing was achieved using transient siRNA transfection. Two siRNAs targeting different sites of STAP2 and a negative control scrambled siRNA were synthesized, each with a working concentration of 50 nM. HeLa cells were seeded at 5×10⁴ cells/well in 6-well plates and transfected with Lipofectamine 3000 reagent according to the manufacturer’s protocol. After 48 hours of transfection, PCR was performed to assess the knockdown efficiency of STAP2.
Control and STAP2-knockdown HeLa cells were seeded at a density of 3×10³ cells per well in a 96-well plate, with 5 replicate wells per group. Ten μL of Cell Counting Kit-8 (CCK-8) reagent was added to each well. After incubation at 37°C for 1.5 hours, the absorbance at 450 nm was measured.
HeLa cells from each group were seeded in 6-well plates at 1.2×10⁵ cells per well. At 48 hours post-transfection, once cell confluence reached 100%, cells were serum-starved for 12 hours using medium containing 0.5% fetal bovine serum (FBS) to minimize proliferation interference. A sterile 200 μL pipette tip was used to create a vertical scratch, followed by phosphate-buffered saline (PBS) washing and replacement with serum-free medium. Images were captured at 0 and 24 hours post-scratching, and the percentage of migration distance was analyzed using ImageJ software.
Cells were washed twice with serum-free medium to remove residual transfection reagents. For the migration assay, a suspension containing 2×10⁴ cells was added to the upper chamber of an uncoated Transwell insert. For the invasion assay: The upper chamber was pre-coated with 60 μL of Matrigel (3 mg/mL), and the seeding density was increased to 3×10⁴ cells/well. The lower chamber was filled with medium containing 15% FBS as chemoattractant. Following 24 hours of incubation, cells were fixed and stained. Cell counting was performed by examining three randomly selected fields per chamber.
Statistical Methods
Statistical analyses were performed on the R software (version 4.3.3) platform, with the statistical significance threshold set at P < 0.05. For continuous variables that met the normality assumption, group comparisons were conducted using t-tests; for continuous variables that did not meet the normality assumption, nonparametric Wilcoxon rank-sum tests were employed. Differences in categorical variables between groups were assessed using Fisher’s exact test. The predictive capability of the model was quantified using receiver operating characteristic (ROC) curves. The predictive accuracy of the model was measured using the concordance index (C-index). Survival curves were plotted and survival rates were estimated using the Kaplan-Meier method, while comparisons of survival differences between groups were performed using the Log rank test. To explore the relationship between covariates and survival time, univariate and multivariate Cox PH regression models were constructed, and the PH assumption was verified. Additionally, Spearman’s rank correlation coefficient analysis was applied to assess the correlation between two continuous variables.
Results
Association of MATH with Clinicopathological Characteristics and Survival Prognosis in Patients
This study employed a combination of box plots and scatter plots to visualize the MATH distribution, and used the Wilcoxon rank-sum test with Benjamini-Hochberg correction to analyze differences in MATH across clinicopathological subgroups (Figure S1A). The results revealed that, in the age subgroup, elderly patients (over 65 years) exhibited significantly higher MATH scores (P = 0.038), suggesting that aging may be a significant factor promoting the accumulation of tumor subclones. Analysis by tumor stage showed that stage II patients had significantly higher MATH scores compared to stage I patients (P < 0.05), consistent with the general trend of increasing genomic heterogeneity during tumor progression. Notably, no significant differences were observed between other stage subgroups (P > 0.05). Similarly, MATH scores showed no statistically significant differences when stratified by treatment status (untreated vs. treated, P = 0.135), treatment regimen (drug therapy vs. radiation therapy, P = 0.296), or pathological type.
Kaplan-Meier survival analysis was performed to evaluate and compare overall survival differences between high-MATH and low-MATH score groups (Figure S1B). The survival curves demonstrated no significant distinction in outcomes between the two groups (Log-rank P = 0.80), indicating that the MATH score has limited predictive value for patient prognosis.
IPH and Immune Heterogeneity
Unsupervised hierarchical clustering of 1500 most variable genes across 33 multi-region tissue samples from 11 CESC patients revealed significant IPH, with different regions of the same tumor consistently clustering together (Figure 1A). Further CIBERSORT-abs analysis of 22 immune cell types demonstrated marked spatial differences in the immune microenvironment (Figure 1B). Hallmark pathway heatmaps clearly illustrated fluctuations in immune pathway activity states across tumor regions, with inconsistent activation or suppression levels of 10 core pathways in different areas (Figure 1C). Such disparities were also observed in key steps of the cancer-immunity cycle, indicating spatial dysregulation in the execution of immune response stages within the tumor (Figure 1D). Collectively, these findings unveil the complex spatial heterogeneity characteristics of the tumor microenvironment.
 |
Figure 1 Multi-region transcriptomic profiling of CESC reveals IPH and immune ITH in CESC. (A) Unsupervised hierarchical clustering of CESC samples in the GSE5787 cohort. (B) Abundance of 22 CIBERSORT-abs-based immune cell types in 33 multi-region tumor samples. (C) GSEA shows the top ten hallmark pathways with the most significant impact in the GSE5787 cohort. (D) IOBR2 calculated TIP activity across different regions. Abbreviations: CESC, cervical squamous cell carcinoma and endocervical adenocarcinoma; IPH, interpatient heterogeneity; ITH, intratumoral heterogeneity; CIBERSORT-abs, Cell-type Identification By Estimating Relative Subsets Of RNA Transcripts (absolute mode); GSEA, Gene Set Enrichment Analysis; IOBR2, Immuno-Oncology Biological Research 2; TIP, Tracking Tumor Immunophenotype. |
Gene Heterogeneity
Figure 2A displays the distribution pattern of ITVS. Extreme values (ITVS = 1) were observed in 15.7% of genes. By establishing the IHS (geometric mean of ITVS and CCS) and applying grouping to protein-coding genes, only 5% (806 genes) were classified into the low-heterogeneity group (Figure 2B). The heatmap (Figure 2C) of the top 20 genes in the low-heterogeneity group and the very-high-heterogeneity group shows a striking contrast: low-heterogeneity genes exhibit stable expression across regions, while very-high-heterogeneity genes display significant intratumorally spatial variability.
 |
Figure 2 Assessment of gene heterogeneity. (A) Distribution of ITVS. (B) IHS categorizes genes into four heterogeneity subgroups. (C) Heatmap of expression levels for the top 20 genes with the lowest and highest integrated heterogeneity scores. (D and E) KEGG enrichment analysis of all genes with the lowest (E) and highest (D) integrated heterogeneity scores. Abbreviations: ITVS, intratumoral variability score; HIS, Integrated heterogeneity score; KEGG, Kyoto Encyclopedia of Genes and Genomes. |
Functional enrichment analysis (Figure 2D) revealed that very-high-heterogeneity genes are closely associated with immune-related pathways, suggesting their role in tumor microenvironment reprogramming, while low-heterogeneity genes are linked to energy metabolism (Figure 2E), reflecting conserved functions in core cellular processes. This divergence in expression strategies unveils the survival tactics of CESC: maintaining basic cellular functions through stable metabolic gene expression while preserving heterogeneity in immune-related pathways to enhance adaptability.
DEGs Between CESC and Normal Cervical Tissues
The gene expression profiles of CESC and normal cervical tissues were compared using transcriptomic data from the TCGA database (Figure 3A). Under the screening criteria (|log2FC| > 1.5, FDR < 0.05), a total of 575 significantly DEGs were identified. The top 20 most significant DEGs were displayed using a heatmap (Figure 3B). Gene Ontology (GO) enrichment analysis (Figure 3C) revealed that these genes were associated with cell proliferation, such as chromosomal region functions. Kyoto Encyclopedia of Genes and Genomes (KEGG) pathway analysis (Figure 3D) indicated enrichment of cell cycle-related genes and the ECM-receptor interaction pathway, which may mediate the invasive potential of tumors.
 |
Figure 3 DEGs and functional enrichment in TCGA-CESC. (A) Volcano plot (FDR < 0.05). (B) Heatmap: Z-score expression patterns of top 50 differential genes (Normal vs. CESC). (C) GO enrichment bar plot: Gene counts in enriched biological processes (BP), cellular components (CC), and molecular functions (MF). (D) KEGG bubble plot: Bubble size reflects gene counts in pathways; color intensity indicates adjusted P-value. Abbreviations: DEG, differentially expressed gene; TCGA, The Cancer Genome Atlas; CESC, cervical squamous cell carcinoma and endocervical adenocarcinoma; FDR, false discovery rate; KEGG, Kyoto Encyclopedia of Genes and Genomes. |
Construction of a Prognostic Model with Low Transcriptional Heterogeneity
Venn diagram analysis of 65 low-heterogeneity prognostic genes and 575 DEGs identified ARMCX1 and STAP2 as two core prognostic factors (Figure 4A). The Cox algorithm was used to evaluate gene importance, assigning weight scores of 0.235 and −0.501 to ARMCX1 and STAP2, respectively (Figure 4B and C). A risk prediction model was constructed: risk score = (0.235 × ARMCX1 expression) + (−0.501 × STAP2 expression). In the TCGA-CESC training cohort (Figure 4D), the overall survival of high-risk CESC patients was significantly shorter than that of the low-risk group, a trend validated in the TCGA-CESC testing cohort (Figure 4E). Time-dependent ROC curve analysis (Figure 4F and G) demonstrated robust predictive performance of the model in both the training cohort (1-year area under the curve (AUC) = 0.74, 3-year AUC = 0.68, 5-year AUC = 0.74) and the TCGA test set (1-, 3-, and 5-year AUCs at 0.60, 0.70, 0.72).
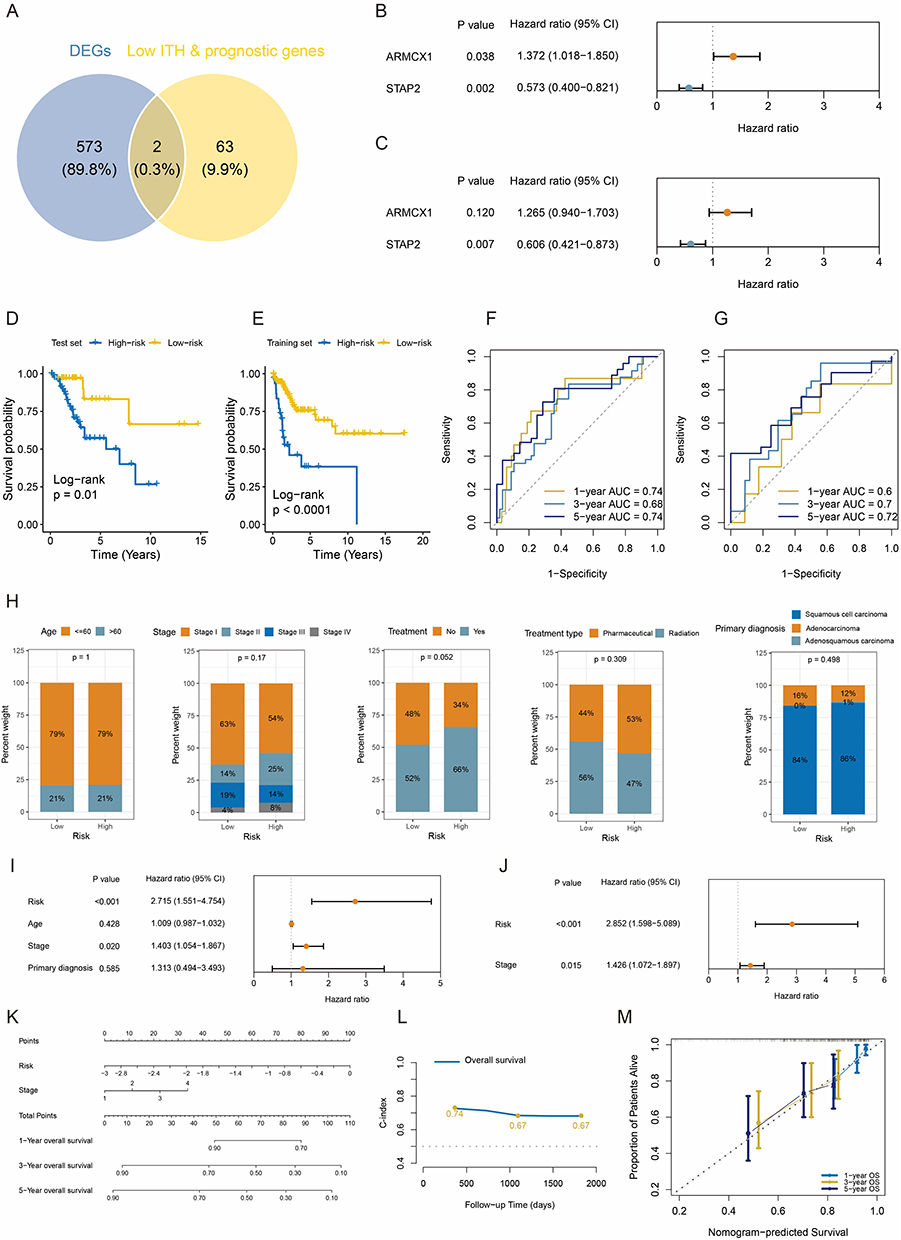 |
Figure 4 Construction and validation of the low-heterogeneity prognostic model in CESC. (A) Venn diagram indicating overlap between DEGs and low-heterogeneity prognostic genes. (B and C) Univariate and multivariate Cox regression analyses established an ARMCX1- and STAP2-based gene prognostic model. (D and E) Survival curves for high-risk and low-risk CESC groups in TCGA training and test sets. (F and G) ROC curves showing AUC values for predicting 1-, 3-, and 5-year overall survival in TCGA training and test sets. (H) Distribution of age, stage, treatment, and diagnosis status in risk groups. (I and J) Forest plots of prognostic factors. (K) Nomogram. (L) Time-dependent C-index for nomogram at 1, 3, and 5 years. (M) Calibration curves. Abbreviation: CESC, cervical squamous cell carcinoma and endocervical adenocarcinoma; DEG, differentially expressed gene; ARMCX1, armadillo repeat-containing X-linked 1; STAP2, signal-transducing adaptor protein 2; TCGA, The Cancer Genome Atlas; ROC, receiver operating characteristic; AUC, area under the curve; C-index, Concordance Index. |
Construction of a Nomogram Based on Risk Score and TNM Staging
Analysis of CESC patient data from the TCGA training cohort revealed no statistically significant differences between risk score subgroups in age, stage, treatment history (radiotherapy or chemotherapy), or histologic type (Figure 4H). This finding suggests that the predictive efficacy of our risk model is independent of baseline demographic and conventional clinical characteristics.
We further evaluated the prognostic predictive power of risk score, age, tumor-node-metastasis (TNM) stage, and histologic type. Univariate Cox regression analysis (Figure 4I) demonstrated significant associations between overall survival and both risk score (hazard ratio (HR) = 2.715, 95% CI: 1.551–4.754) and clinical stage (HR = 1.403, 95% CI: 1.054–1.867). Crucially, in the multivariate Cox model (Figure 4J), both risk score and clinical stage retained independent prognostic value, indicating their synergistic predictive role. Based on this, we developed a nomogram integrating risk score and clinical stage (Figure 4K). This visual tool quantifies the contribution weights of each variable, enabling clinicians to rapidly calculate 1-, 3-, and 5-year overall survival probabilities. Model validation demonstrated robust performance, with C-indices (Figure 4L) consistently exceeding 0.65 during 1- to 5-year follow-up, confirming stable predictive accuracy over time. Time-dependent calibration curves (Figure 4M) further validated model precision, showing close agreement between predicted and observed survival rates at 1, 3, and 5 years.
Compared to ten Existing Models, the Present Signature Effectively Reduces Transcriptomic Heterogeneity
The present prognostic model shows stable performance in risk prediction for patients with CESC. Most importantly, this model effectively alleviates the impact of tumor transcriptome heterogeneity. Traditional models built on single-region sampling exhibit low consistency, ranging from 27% to 46%, which indicates that ITH correction can significantly reduce classification bias caused by sampling location. When using our novel model, only 18% of CESC patients received inconsistent risk classification. This proportion is lower than that of 10 previously reported CESC prediction models (Figure 5A–C).
 |
Figure 5 Comparison of prognostic discrimination between the present signature and established CESC signatures. (A and B) Ten published gene signature (A) and the present signature (B) were evaluated in the GSE5787. (C) The bar chart represents the percentage of patients categorized as consistently low-risk, consistently high-risk, and discordant-risk using the 10 published CESC prognostic signatures and the present signature in the GSE5787 cohort. The x-axis displays the corresponding articles (PubMed ID). Abbreviation: CESC, cervical squamous cell carcinoma and endocervical adenocarcinoma. |
Mutation Characteristics in Risk Subgroups
This study integrated genomic data from 149 TCGA-CESC training samples (75 high-risk, 74 low-risk) to analyze the association between mutation patterns and risk stratification. Among high-risk samples (Figure 6A and B), 56 cases (74.67%) harbored at least one genetic alteration, with PIK3CA (Phosphatidylinositol-4,5-Bisphosphate 3-Kinase Catalytic Subunit Alpha) mutations being the most frequent (27%), followed by MUC16 (Mucin 16) and TTN (Titin), predominantly missense mutations. In low-risk samples (Figure 6C and D), TTN mutations reached 34%, while PIK3CA mutations were also relatively common (31%). Co-occurrence and exclusivity analysis revealed significant associations. In the high-risk group, PIK3CA and KMT2D (Lysine Methyltransferase 2D) exhibited co-occurrence (P < 0.05), suggesting synergistic oncogenic pathways; in the low-risk group, FLG (Filaggrin) and KMT2C (Lysine Methyltransferase 2C) also displayed a co-occurrence relationship.
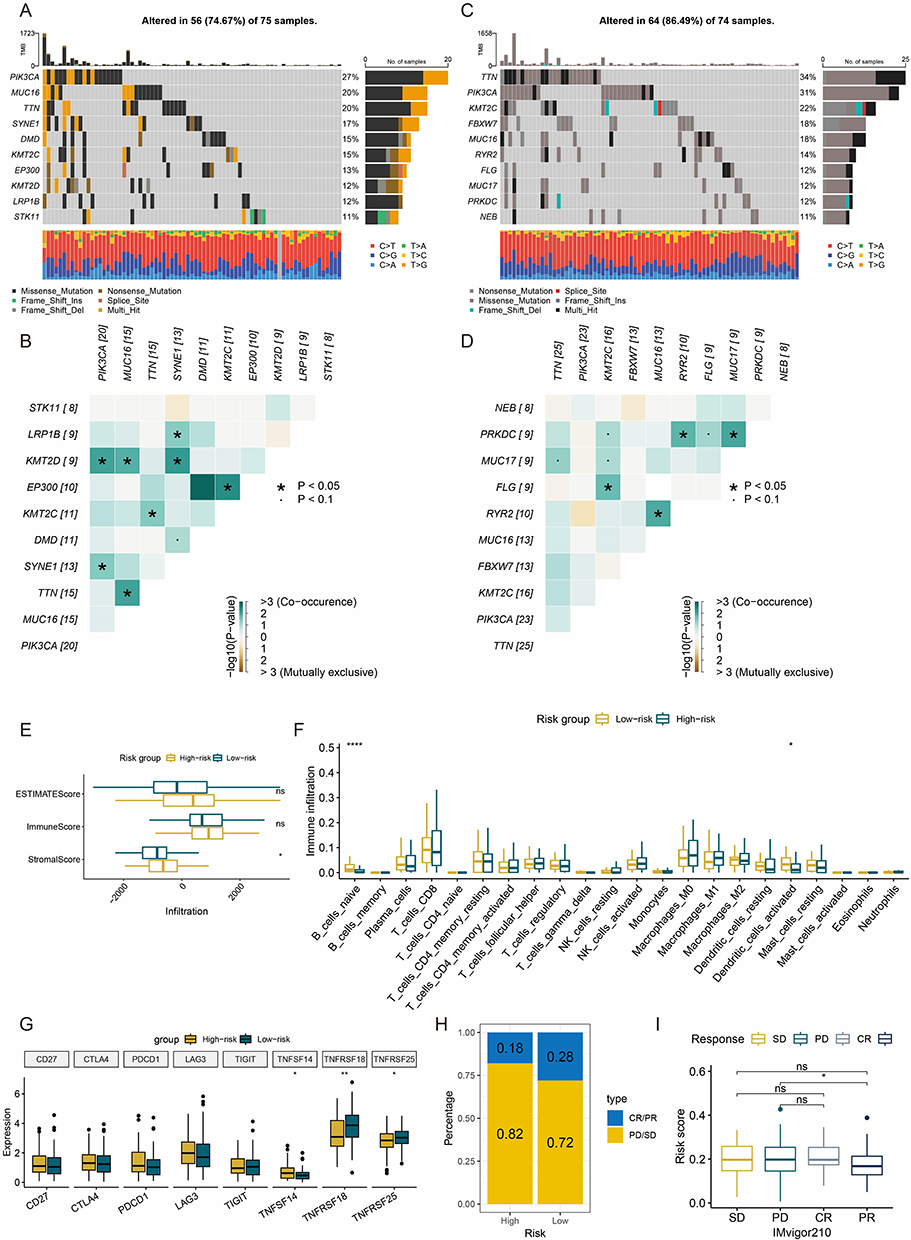 |
Figure 6 Genomic alteration and immune profiles. (A and B) High-frequency mutated genes (A), co-occurrence and mutual exclusivity heatmaps (B) of top 10 genes in high-risk group. (C and D) High-frequency mutated genes (C), co-occurrence and mutual exclusivity heatmaps (D) of top 10 genes in low-risk group. (E) Boxplots of ESTIMATE score. (F) Boxplots of immune cell subset infiltration levels via CIBERSORT-abs. (G) Boxplots of immune checkpoint gene expression. (H) Bar plot of clinical response rates. (I) Boxplots of risk scores across treatment response subgroups. *: P < 0.05. **: P < 0.01. ****: P < 0.0001. ns: not significant. Abbreviations: ESTIMATE, Estimation of STromal and Immune cells in MAlignant Tumor tissues using Expression data; CIBERSORT-abs, Cell-type Identification By Estimating Relative Subsets Of RNA Transcripts (absolute mode); CR, complete response; PR, partial response; SD, stable disease; PD, disease progression. |
Immune Infiltration Characteristics of the Risk Subgroup
Analysis using the Estimation of STromal and Immune cells in MAlignant Tumor tissues using Expression data (ESTIMATE) algorithm revealed that the high-risk group had significantly higher stromal scores than the low-risk group, while no statistical difference was observed in immune scores (Figure 6E), suggesting that the immunosuppressive state in high-risk patients primarily stems from alterations in stromal composition rather than immune cells. Further quantification of immune infiltration using the CIBERSORT-abs algorithm (Figure 6F) showed reduced dendritic cell infiltration in the high-risk group. Analysis of immune checkpoint expression profiles (Figure 6G) indicated significant downregulation of regulatory factors (Tumor Necrosis Factor Superfamily Member 18 (TNFSF18), Tumor Necrosis Factor Receptor Superfamily Member 25 (TNFRSF25)) in the high-risk group.
Given the lack of publicly available CESC immunotherapy cohorts with transcriptomic and clinical outcome data, we utilized the IMvigor210 urothelial cancer cohort as an indirect validation to assess whether our ITH-corrected signature could broadly predict immunotherapy response across tumor types. Validation based on the IMvigor210 cohort demonstrated that the high-risk group exhibited stronger resistance to immunotherapy: the proportion of cases with progressive disease (PD) and stable disease (SD) reached 82%, higher than the 72% in the low-risk group (Figure 6H). Moreover, patients achieving partial response (PR) had significantly lower median risk scores than PD cases (Figure 6I). While this provides preliminary evidence for the generalizability of our approach, we acknowledge that CESC-specific immunotherapy validation cohorts are required to confirm clinical applicability in CESC.
Drug Screening for High-Risk Patients
Given the poor prognosis and resistance to immunotherapy in high-risk patients, the pRRophetic platform identified seven anticancer drugs (Figure 7A–G) that showed a significant negative correlation (r < −0.03) with the risk score and exhibited lower IC50 values in the high-risk group. These findings suggest that risk score-based drug selection may optimize personalized treatment strategies for high-risk patients.
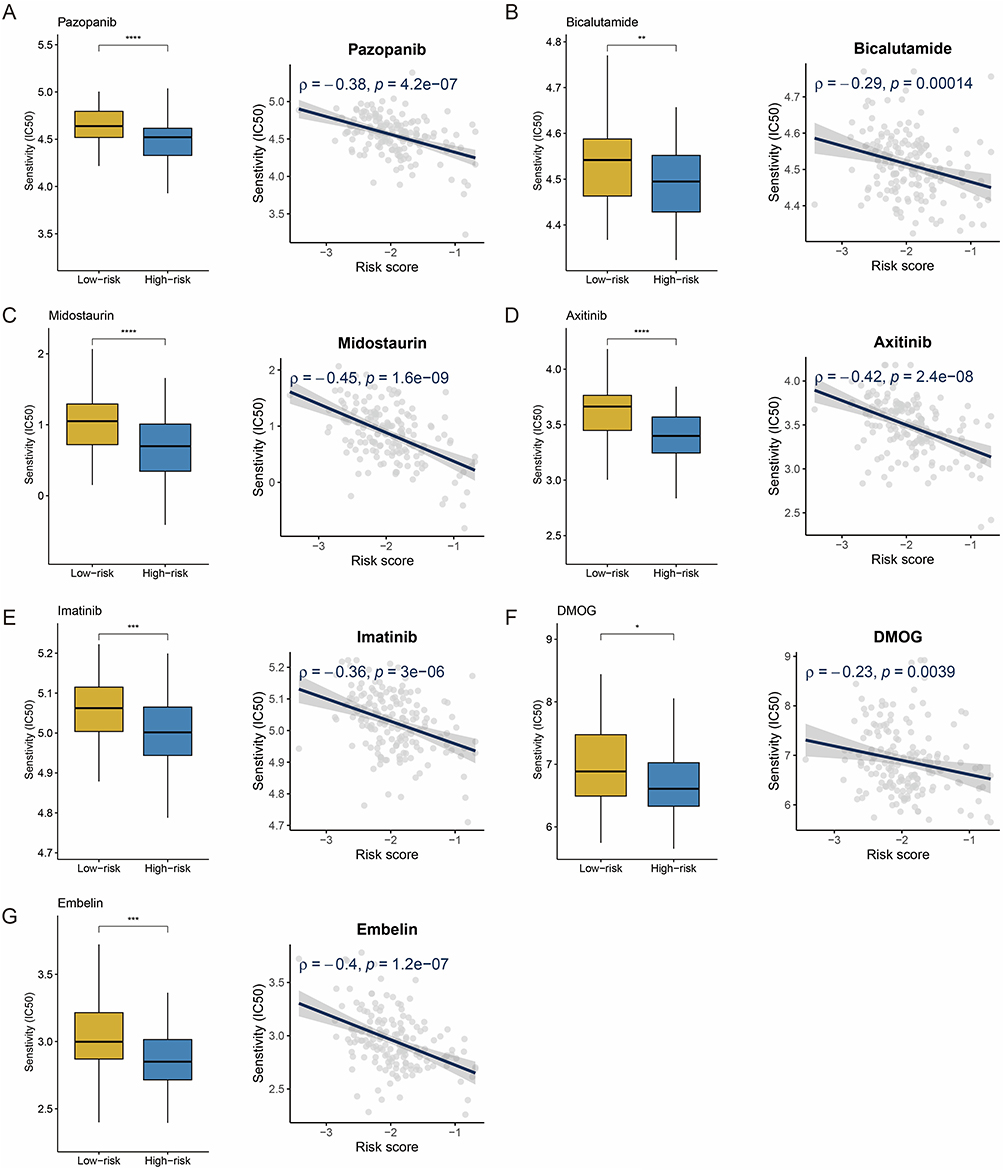 |
Figure 7 Drug sensitivity and risk score. (A–G) Boxplots and scatterplots show the association between IC50 values for seven screened drugs. IC50: half maximal inhibitory concentration. *: P < 0.05. **: P < 0.01. ***: P < 0.001. ****: P < 0.0001. |
Multi-Omics Data Reveals the Expression Patterns of ARMCX1 and STAP2 in CESC
Combining TCGA and Genotype-Tissue Expression (GTEx) sample analyses (Figure 8A), dysregulated expression of ARMCX1 and STAP2 was observed in CESC samples. To validate these findings, RT-qPCR experiments were performed (Figure 8B). Compared to normal cervical H8 cells, ARMCX1 was significantly downregulated in HeLa and SiHa cells. Notably, CESC exhibited marked upregulation in both malignant cell lines.
 |
Figure 8 Multi-omics data reveals the expression patterns of ARMCX1 and STAP2 in CESC. (A) Dysregulated expression of ARMCX1 and STAP2 in TCGA-CESC cases. (B) RT-qPCR validation of ARMCX1 and STAP2 expression dysregulation in CESC cell lines. (C and D) UMAP visualization of cell types and gene expression patterns in GSE168652 dataset. (E) Bar charts showing the expression of ARMCX1 and STAP2 in different cells. (F and G) Spatial expression patterns of ARMCX1 and STAP2 between malignant and non-malignant regions. ***: P < 0.001. ****: P < 0.0001. Abbreviations: ARMCX1, armadillo repeat-containing X-linked 1; STAP2, signal-transducing adaptor protein 2; CESC, cervical squamous cell carcinoma and endocervical adenocarcinoma; TCGA, The Cancer Genome Atlas; RT-qPCR, reverse transcription quantitative polymerase chain reaction; UMAP, Uniform Manifold Approximation and Projection. |
Single-cell and spatial transcriptomic analyses were conducted using a web-based platform (https://grswsci.top/). Single-cell sequencing resolved seven functionally defined cell subpopulations (Figure 8C), with fibroblast subpopulations showing significant enrichment of ARMCX1 (Figure 8D and E). Moreover, STAP2 was mainly expressed in malignant cells (Figure 8D and E). Spatial transcriptomic analysis of representative CESC sample classified tissue regions containing malignant cells (proportion >0) as malignant regions, while regions composed entirely of normal cells were defined as normal regions. ARMCX1 (Figure 8F) displayed significantly higher expression in non-malignant regions, whereas STAP2 (Figure 8G) was specifically enriched in tumor malignant regions.
Knockdown of STAP2 Inhibits Tumor Cell Proliferation, Migration and Invasion
PCR confirmed that STAP2 siRNA1 and siRNA2 reduced RNA expression in HeLa cells (Figure 9A). CCK-8 assays showed that STAP2 knockdown significantly inhibited proliferation (Figure 9B, p<0.05). Wound healing assays demonstrated impaired migration (Figure 9C–F). Transwell migration (Figure 9G) revealed that STAP2 silencing reduced migrated cells compared to control groups. Matrigel invasion assays (Figure 9H) further showed decreased invasive capacity. These findings indicate that STAP2 knockdown markedly suppresses HeLa cell proliferation, migration, and invasion.
 |
Figure 9 Effect of STAP2 expression on the proliferation, migration, and invasion of HeLa cells. (A) The knockdown efficiency of STAP2 by two siRNAs was evaluated using RT-qPCR. (C-F) Wound healing assays demonstrated impaired migration after knockdown of STAP2. (G) Transwell migration revealed that STAP2 silencing reduced migrated cells compared to control groups. (H) Matrigel invasion assays further showed decreased invasive capacity after knockdown of STAP2. **: P < 0.01. ***: P < 0.001. ****: P < 0.0001. Abbreviations: STAP2, signal-transducing adaptor protein 2; RT-qPCR, reverse transcription quantitative polymerase chain reaction. |
Discussion
This study quantified IPH and ITH in CESC by integrating transcriptomic data from multi-region samples, and proposed a prognostic model based on clonal expression signatures, offering a novel solution to mitigate the interference of tumor heterogeneity in prognostic evaluation. The model not only demonstrated stable predictive performance but also improved clinical utility by reducing classification inconsistency. Furthermore, immune microenvironment analysis of the model revealed mechanisms of immunotherapy resistance in high-risk patients, providing a theoretical foundation for the development of personalized treatment strategies.
Tumor heterogeneity is one of the central challenges in cancer research, particularly prominent in highly heterogeneous tumors such as CESC. This study quantifies gene expression heterogeneity by integrating multi-region transcriptomic data. The findings reveal an intriguing phenomenon: highly heterogeneous genes are primarily enriched in immune-related pathways, while low-heterogeneity genes are associated with fundamental cellular functions such as energy metabolism. This discovery aligns with the functional differentiation in tumor evolution, where tumor cells ensure survival by maintaining stable metabolic functions while leveraging the variability of immune-related pathways to enhance environmental adaptability. Such a hierarchical functional strategy may represent a survival mechanism formed under evolutionary pressure, also offering new insights for targeted therapy: targeting stable metabolic pathways may hold greater therapeutic potential than targeting highly variable immune pathways.
Methodologically, this study references the IHS proposed in prior research.31 This metric effectively distinguishes spatially stable expression genes from highly variable genes by combining ITVS and CCS. This approach helps accurately identify stable biological markers rather than false positives caused by sampling bias. When analyzing the GSE5787 multi-region dataset, the study found that only 5% of protein-coding genes belonged to the low-heterogeneity group, highlighting how overlooking ITH could lead to clinical translation failure for the vast majority of molecular markers.
In this study, ARMCX1 and STAP2, as core genes of the model, demonstrated significant correlations with CESC prognosis. ARMCX1 exhibits tumor-suppressive functions in gastric cancer and lung cancer: In gastric cancer, ARMCX1 influences the cell cycle, apoptosis, and DNA damage response by regulating the Wingless-type MMTV integration site family (WNT) and Nuclear Factor Kappa-B (NF-kappaB) signaling pathways;34 In lung adenocarcinoma, ARMCX1 inhibits tumor cell proliferation, migration, and metastasis. The mechanism involves recruiting the E3 ubiquitin ligase F-box and WD repeat domain containing 7 (FBXW7) to mediate the ubiquitination and degradation of myelocytomatosis viral oncogene homolog (c-Myc), thereby suppressing the cell cycle and epithelial-mesenchymal transition signaling.35 Additionally, studies found elevated STAP2 expression in renal fibrotic tissues and models.36 Animal experiments showed that inhibiting STAP2 significantly alleviated epithelial-mesenchymal transition, inflammatory cell infiltration, and collagen deposition during renal fibrosis. However, the specific roles of ARMCX1 and STAP2 in CESC had not been previously investigated or reported. Single-cell and spatial transcriptomic analyses revealed that ARMCX1 was significantly enriched in fibroblast subpopulations, while STAP2 was specifically expressed in malignant regions. Experimental validation demonstrated that, compared to normal cervical epithelial cells, ARMCX1 expression was significantly downregulated in HeLa and SiHa cells, whereas STAP2 was upregulated, providing a clear direction for subsequent mechanistic research. While our functional validation in HeLa cells supports the proposed role of STAP2, future studies should extend these findings to additional CESC cell lines such as SiHa to confirm the generalizability of our observations across different cellular contexts.
From a clinical application perspective, the nomogram model constructed in this study integrates risk scores and TNM staging, demonstrating predictive accuracy. Notably, the model exhibits unique advantages in reducing sample bias. This suggests that predictions based on a single biopsy sample are more reliable, helping to address diagnostic uncertainty caused by tumor spatial heterogeneity. Additionally, the model’s performance in immunotherapy prediction provides a tool for precision medicine. High-risk patients displayed a significantly higher proportion of PD-1 inhibitor resistance, and the drug screening identified seven potential sensitive drugs, offering alternative treatment options for these refractory patients.
This study also has several limitations. First, although multi-regional samples were used to correct heterogeneity, the GSE5787 sample size (11 cases, 33 regions) was relatively limited, potentially affecting generalizability. Also, multi-region sampling may miss the expression characteristics of transition regions and tiny subclonal foci. Second, the specific molecular mechanisms of ARMCX1 and STAP2 have not been fully elucidated, requiring further experimental validation of their roles in CESC development. Third, our findings are primarily derived from retrospective analyses; therefore, caution should be exercised when translating them into clinical practice, and prospective multicenter clinical trials will be essential for future validation. Moreover, the model’s immunotherapy prediction performance was validated across cancer types using the IMvigor210 cohort; ideally, it should be validated in a CESC-specific immunotherapy cohort.
Conclusion
This study develops an ITH-corrected gene expression signature, which demonstrates stable performance in prognosis prediction for patients with CESC. Future validation in independent cohorts is essential to confirm its generalizability.
Data Sharing Statement
The datasets presented in this study can be found in online repositories. The names of the repository/repositories and accession number (s) can be found in the article.
Ethics Approval and Consent
This article does not contain any studies with human participants or animals performed by any of the authors. This study utilized publicly available data from The Cancer Genome Atlas (TCGA) database and the Gene Expression Omnibus (GEO) database. Both databases have been ethically approved by the respective institutions, and all data provided are de-identified and anonymized. As the data does not involve direct human intervention, the study was exempt from requiring institutional review board (IRB) approval based on national legislation. According to Article 32 of the Measures for Ethical Review of Life Science and Medical Research Involving Human Subjects (February 18, 2023, China), studies involving publicly available and de-identified data do not require IRB approval.
Funding
There is no funding to report.
Disclosure
The authors declare that they have no competing interests in this work.
References
1. Singh D, Vignat J, Lorenzoni V, et al. Global estimates of incidence and mortality of cervical cancer in 2020: a baseline analysis of the WHO global cervical cancer elimination initiative. Lancet Glob Health. 2023;11(2):e197–18. doi:10.1016/s2214-109x(22)00501-0
2. Perkins RB, Wentzensen N, Guido RS, Schiffman M. Cervical Cancer Screening: a Review. JAMA. 2023;330(6):547–558. doi:10.1001/jama.2023.13174
3. Zheng Q, Gong Z, Li B, Wang H, Lin S. Development and validation of the antibody-dependent cellular phagocytosis-based signature: a prognostic risk model of gastric cancer. Adv Clin Exp Med. 2025;34(3):433–446. doi:10.17219/acem/189914
4. Zheng Q, Gong Z, Lin S, Ou D, Lin W, Shen P. Integrated analysis of a competing endogenous RNA network reveals a ferroptosis-related 6-lncRNA prognostic signature in clear cell renal cell carcinoma. Adv Clin Exp Med. 2024;33(12):1391–1407. doi:10.17219/acem/176050
5. Zheng Q, Gong Z, Li B, et al. Identification and characterization of CLEC11A and its derived immune signature in gastric cancer. Front Immunol. 2024;15:1324959. doi:10.3389/fimmu.2024.1324959
6. Xiang X, Kang J, Jiang J, et al. A novel DNA damage repair-related gene signature predicting survival, immune infiltration and drug sensitivity in cervical cancer based on single cell sequencing. Front Immunol. 2023;14:1198391. doi:10.3389/fimmu.2023.1198391
7. Xing X, Tian Y, Jin X. Immune infiltration and a necroptosis-related gene signature for predicting the prognosis of patients with cervical cancer. Front Genet. 2022;13:1061107. doi:10.3389/fgene.2022.1061107
8. Zuo Z, Xiong J, Zeng C, et al. Exploration of a robust and prognostic immune related gene signature for cervical squamous cell carcinoma. Front Mol Biosci. 2021;8:625470. doi:10.3389/fmolb.2021.625470
9. Biswas D, Liu YH, Herrero J, et al. Prospective validation of ORACLE, a clonal expression biomarker associated with survival of patients with lung adenocarcinoma. Nat Cancer. 2025;6(1):86–101. doi:10.1038/s43018-024-00883-1
10. Biswas D, Birkbak NJ, Rosenthal R, et al. A clonal expression biomarker associates with lung cancer mortality. Nat Med. 2019;25(10):1540–1548. doi:10.1038/s41591-019-0595-z
11. Zhao W, Zhu B, Hutchinson A, et al. Clinical implications of inter- and intratumor heterogeneity of immune cell markers in lung cancer. J Natl Cancer Inst. 2022;114(2):280–289. doi:10.1093/jnci/djab157
12. Zhang J, Späth SS, Marjani SL, Zhang W, Pan X. Characterization of cancer genomic heterogeneity by next-generation sequencing advances precision medicine in cancer treatment. Precision Clin Med. 2018;1(1):29–48. doi:10.1093/pcmedi/pby007
13. Hinohara K, Polyak K. Intratumoral heterogeneity: more than just mutations. Trends Cell Biol. 2019;29(7):569–579. doi:10.1016/j.tcb.2019.03.003
14. Dutil J, Chen Z, Monteiro AN, Teer JK, Eschrich SA. An interactive resource to probe genetic diversity and estimated ancestry in cancer cell lines. Cancer Res. 2019;79(7):1263–1273. doi:10.1158/0008-5472.Can-18-2747
15. Gavish A, Tyler M, Greenwald AC, et al. Hallmarks of transcriptional intratumour heterogeneity across a thousand tumours. Nature. 2023;618(7965):598–606. doi:10.1038/s41586-023-06130-4
16. Colombo N, Dubot C, Lorusso D, et al. Pembrolizumab for persistent, recurrent, or metastatic cervical cancer. New Engl J Med. 2021;385(20):1856–1867. doi:10.1056/NEJMoa2112435
17. Hu Z, Zhuo E, Guo J, et al. Upregulated ARMCX1 suppresses nasopharyngeal carcinoma progression by promoting TRIM21-mediated β-catenin degradation. Cell Oncol. 2026;49(1):25. doi:10.1007/s13402-025-01161-7
18. Kashiwakura JI, Oritani K, Matsuda T. The functional properties and physiological roles of signal-transducing adaptor protein-2 in the pathogenesis of inflammatory and immune disorders. Biomedicines. 2022;10(12):3079. doi:10.3390/biomedicines10123079
19. Bachtiary B, Boutros PC, Pintilie M, et al. Gene expression profiling in cervical cancer: an exploration of intratumor heterogeneity. Clin Cancer Res. 2006;12(19):5632–5640. doi:10.1158/1078-0432.Ccr-06-0357
20. Li C, Guo L, Li S, Hua K. Single-cell transcriptomics reveals the landscape of intra-tumoral heterogeneity and transcriptional activities of ECs in CC. Mol Ther Nucleic Acids. 2021;24:682–694. doi:10.1016/j.omtn.2021.03.017
21. Butler A, Hoffman P, Smibert P, Papalexi E, Satija R. Integrating single-cell transcriptomic data across different conditions, technologies, and species. Nat Biotechnol. 2018;36(5):411–420. doi:10.1038/nbt.4096
22. Guo W, Zhou B, Yang Z, et al. Integrating microarray-based spatial transcriptomics and single-cell RNA-sequencing reveals tissue architecture in esophageal squamous cell carcinoma. EBioMedicine. 2022;84:104281. doi:10.1016/j.ebiom.2022.104281
23. Mayakonda A, Lin DC, Assenov Y, Plass C, Koeffler HP. Maftools: efficient and comprehensive analysis of somatic variants in cancer. Genome Res. 2018;28(11):1747–1756. doi:10.1101/gr.239244.118
24. Mroz EA, Rocco JW. MATH, a novel measure of intratumor genetic heterogeneity, is high in poor-outcome classes of head and neck squamous cell carcinoma. Oral Oncol. 2013;49(3):211–215. doi:10.1016/j.oraloncology.2012.09.007
25. Newman AM, Liu CL, Green MR, et al. Robust enumeration of cell subsets from tissue expression profiles. Nat Methods. 2015;12(5):453–457. doi:10.1038/nmeth.3337
26. Zeng D, Fang Y, Qiu W, et al. Enhancing immuno-oncology investigations through multidimensional decoding of tumor microenvironment with IOBR 2.0. Cell Rep Methods. 2024;4(12):100910. doi:10.1016/j.crmeth.2024.100910
27. Yan W, Shih J, Rodriguez-Canales J, et al. Three-dimensional mRNA measurements reveal minimal regional heterogeneity in esophageal squamous cell carcinoma. Am J Pathol. 2013;182(2):529–539. doi:10.1016/j.ajpath.2012.10.028
28. Dunne PD, Alderdice M, O’Reilly PG, et al. Cancer-cell intrinsic gene expression signatures overcome intratumoural heterogeneity bias in colorectal cancer patient classification. Nat Commun. 2017;8(1):15657. doi:10.1038/ncomms15657
29. Ritchie ME, Phipson B, Wu D, et al. limma powers differential expression analyses for RNA-sequencing and microarray studies. Nucleic Acids Res. 2015;43(7):e47. doi:10.1093/nar/gkv007
30. Zhang Y, Song Y, Dai J, et al. Endoplasmic reticulum stress-related signature predicts prognosis and drug response in clear cell renal cell carcinoma. Front Pharmacol. 2022;13:909123. doi:10.3389/fphar.2022.909123
31. Yang C, Zhang S, Cheng Z, et al. Multi-region sequencing with spatial information enables accurate heterogeneity estimation and risk stratification in liver cancer. Genome Med. 2022;14(1):142. doi:10.1186/s13073-022-01143-6
32. Geeleher P, Cox N, Huang RS. pRRophetic: an R package for prediction of clinical chemotherapeutic response from tumor gene expression levels. PLoS One. 2014;9(9):e107468. doi:10.1371/journal.pone.0107468
33. Xia Z, Liu H, Fan S, et al. A novel four mitochondrial respiration-related signature for predicting biochemical recurrence of prostate cancer. J Clin Med. 2023;12(2):654. doi:10.3390/jcm12020654
34. Xie A, Wang P, Chen D, Zhang H. Aberrant ARMCX1 expression is an independent predictor of poor prognosis in gastric cancer. J Oncol. 2022;2022:9348917. doi:10.1155/2022/9348917
35. Wang T, Zhong H, Qin Y, et al. ARMCX family gene expression analysis and potential prognostic biomarkers for prediction of clinical outcome in patients with gastric carcinoma. Biomed Res Int. 2020;2020(1):3575038. doi:10.1155/2020/3575038
36. Yuan Y, Wei X, Xiong X, et al. STAP2 promotes the progression of renal fibrosis via HSP27. J Transl Med. 2024;22(1):1018. doi:10.1186/s12967-024-05776-6
 © 2026 The Author(s). This work is published and licensed by Dove Medical Press Limited. The
full terms of this license are available at https://www.dovepress.com/terms
and incorporate the Creative Commons Attribution
- Non Commercial (unported, 4.0) License.
By accessing the work you hereby accept the Terms. Non-commercial uses of the work are permitted
without any further permission from Dove Medical Press Limited, provided the work is properly
attributed. For permission for commercial use of this work, please see paragraphs 4.2 and 5 of our Terms.
© 2026 The Author(s). This work is published and licensed by Dove Medical Press Limited. The
full terms of this license are available at https://www.dovepress.com/terms
and incorporate the Creative Commons Attribution
- Non Commercial (unported, 4.0) License.
By accessing the work you hereby accept the Terms. Non-commercial uses of the work are permitted
without any further permission from Dove Medical Press Limited, provided the work is properly
attributed. For permission for commercial use of this work, please see paragraphs 4.2 and 5 of our Terms.
Recommended articles
Construction and Assessment of a Prognostic Risk Model for Cervical Cancer Based on Lactate Metabolism-Related lncRNAs
Gao Y, Liu H, Wan J, Chang F, Zhang L, Wang W, Zhang Q, Feng Q
International Journal of General Medicine 2023, 16:2943-2960
Published Date: 11 July 2023
A Molecular Signature of the Ubiquitin-Proteasome System for Forecasting Prognosis in Thyroid Carcinoma Patients
Zeng H, Geng X, Wan H, Qu X, Tang S, Zhang R, Zhou M, Yu Z, Pan J, Zheng H, Zhu Y, Huang S, Huang D
Journal of Inflammation Research 2024, 17:10397-10419
Published Date: 5 December 2024
Development and Validation of an Anoikis-Related Gene Signature for Prognostic Prediction in Cervical Cancer
Meng S, Li X, Zhang J, Cheng X
International Journal of General Medicine 2025, 18:2861-2879
Published Date: 4 June 2025
Identification of Key Biomarkers and Immune Microenvironment Features in Ulcerative Colitis: An Integrated Analysis Using WGCNA and Multiple Machine Learning Algorithms
Qi Y, Wang Y, Zhang S, Pan X, Li W, Cheng M, Ma W, Li J, Pei Y, Liu Y, Yu Y
Journal of Inflammation Research 2025, 18:13879-13896
Published Date: 7 October 2025
Macrophage Polarization-Related Biomarkers in Epilepsy: Integrated Bioinformatics Analysis and Clinical Validation
Li J, Zhang C, Yang X, Liu Y, Zhang Z, Zhang H, Wang X
Journal of Inflammation Research 2026, 19:581430
Published Date: 31 March 2026