Back to Journals » OncoTargets and Therapy » Volume 18
Glycolysis-Driven Immune Evasion in Microsatellite Instability-High Colorectal Cancer: An Integrated Single-Cell and Spatial Transcriptomics Study
Authors Li C, Cai P, Zeng H, Li J, Hu H, Zhang J ![]() , Wu Z, Qin G, Deng Y
, Wu Z, Qin G, Deng Y ![]()
Received 2 May 2025
Accepted for publication 14 August 2025
Published 18 September 2025 Volume 2025:18 Pages 1027—1042
DOI https://doi.org/10.2147/OTT.S538018
Checked for plagiarism Yes
Review by Single anonymous peer review
Peer reviewer comments 3
Editor who approved publication: Dr John Riches
Chenchen Li,1,2,* Peicong Cai,3,* Hengda Zeng,4,* Jianxia Li,1,2 Huabin Hu,1,2 Jianwei Zhang,1,2 Zehua Wu,1,2 Ge Qin,1,2 Yanhong Deng1,2
1Department of Medical Oncology, The Sixth Affiliated Hospital, Sun Yat-sen University, Guangzhou, People’s Republic of China; 2Guangdong Provincial Key Laboratory of Colorectal and Pelvic Floor Disease, The Sixth Affiliated Hospital, Sun Yat-sen University, Guangzhou, People’s Republic of China; 3Department of Urology, Sun Yat-sen Memorial Hospital, Sun Yat-sen University, Guangzhou, People’s Republic of China; 4Department of Urology, The Fifth Affiliated Hospital, Sun Yat-sen University, Zhuhai, People’s Republic of China
*These authors contributed equally to this work
Correspondence: Yanhong Deng, Email [email protected] Ge Qin, Email [email protected]
Purpose: Microsatellite instability-high colorectal cancer is characterized by hypermutated genomes and high neoantigen loads, yet a significant proportion of patients exhibit resistance to immune checkpoint blockade. This study aims to investigate tumor cell functional heterogeneity and its role in immune evasion.
Patients and Methods: We integrated single-cell RNA sequencing, spatial transcriptomics, and bulk RNA sequencing from microsatellite instability-high colorectal cancer patients. After quality control, normalization, and clustering, malignant epithelial subpopulations were identified through copy number variation analysis and non-negative matrix factorization. Functional characterization employed gene set enrichment analysis. Spatial transcriptomics clarified immune cell and tumor subpopulation localization, and survival analyses assessed prognostic implications.
Results: We identified a glycolysis-enriched tumor subpopulation (MP2) that co-localized with immunosuppressive niches marked by Treg accumulation, effector T-cell depletion, and FOLR2+ tumor-associated macrophages. MP2-high tumors were associated with immune checkpoint blockade resistance and poor prognosis. Mechanistically, MP2 cells secreted lactate, promoting Treg differentiation and macrophage polarization toward an immunosuppressive phenotype. Spatial transcriptomics revealed the precise organization of these lactate-rich, immune-excluded niches within tumors.
Conclusion: These findings establish tumor cell-intrinsic glycolysis as a key driver of immune evasion in microsatellite instability-high colorectal cancer and propose metabolic targeting as a strategy to overcome immune checkpoint blockade resistance.
Keywords: colorectal cancer, immune checkpoint blockade, immune evasion, tumor microenvironment, glycolysis, single-cell RNA sequencing, spatial transcriptomics
Introduction
Microsatellite instability-high and mismatch repair-deficient (MSI-H/d-MMR) colorectal cancer (CRC) represents a unique subset of tumors characterized by hypermutated genomes and abundant neoantigen loads, rendering them particularly responsive to immune checkpoint blockade (ICB).1–3 Notably, immune cell PD-L1 expression is significantly elevated in MSI-H CRC compared to MMR-proficient (MSI-L) tumors. The recommended methods for detecting mismatch repair deficiency include immunohistochemistry (IHC) or MSI testing, but interpretation is complicated by technical and biological variability. IHC may show discordant results in cases with germline mutations, possibly due to additional somatic alterations, underscoring the need for a deeper understanding of the molecular and immune context of MSI-H CRC.4 Despite the immunogenicity, a substantial proportion (40–60%) of MSI-H CRC patients display primary or acquired resistance to ICB, highlighting the need to elucidate the mechanisms of immune evasion in this population.5,6 In our previous work,7 we dissected the immune microenvironment of MSI-H CRC and identified distinct immune landscapes associated with ICB sensitivity and resistance, including the enrichment of immunosuppressive cell populations such as Tregs and myeloid-derived suppressor cells (MDSCs) in non-responders. While these findings underscored the importance of the immune milieu, the functional heterogeneity of tumor cells themselves—and their role in shaping an immunosuppressive microenvironment—remains poorly understood.
Tumor cells are not passive bystanders but active participants in immune evasion, often through metabolic reprogramming and the secretion of immunomodulatory factors.8,9 Glycolytic metabolism, a hallmark of aggressive cancers, has been associated with both immunogenic and immunosuppressive phenotypes.10,11 This indicates that metabolic roles in tumor biology may vary depending on the specific context and differ among tumor cell subpopulations. However, the functional diversity of tumor cells in MSI-H CRC, particularly their metabolic states and spatial interactions with immune cells, has not been systematically explored at single-cell resolution.
Here, we perform the first integrated analysis of single-cell RNA sequencing (scRNA-seq), spatial transcriptomics, and bulk transcriptomic data from MSI-H CRC patients to define tumor cell functional subpopulations and their roles in immune evasion. We identify a glycolysis-enriched tumor cell subpopulation that drives the formation of immunosuppressive niches, characterized by Treg and and FOLR2+ tumor-associated macrophages (TAMs) accumulation, along with effector T-cell depletion. Spatial transcriptomics further validates the co-localization of this tumor cell subpopulation with immunosuppressive microenvironments. By shifting the focus from immune cells to tumor cell functional states, our study provides a novel perspective on ICB resistance in MSI-H CRC and unveils potential therapeutic targets to reverse immunosuppression.
Materials and Methods
Data and Sample Sources
For the scRNA-seq analysis, we utilized a total of 59 MSI-high CRC samples retrieved from public database (specifically GSE132465, GSE178341, and GSE200997)12–14 and self-collected data. This dataset comprised samples from 40 MSI-high CRC patients, designated as the discovery cohort, and additional data from 19 in-house patients, designated as the validation cohort.7 For spatial transcriptomics analysis, we analyzed 31 samples retrieved from public database (scCRLM, crost dataset, GSE206552, GSE225857, GSE236698).15–19 Additionally, the study included bulk RNA sequencing data from 742 CRC samples (TCGA-COAD, GSE143985, GSE161158).20,21
This study was approved by the institutional review board of the Sixth Affiliated Hospital, Sun Yat-sen University, and informed consent was obtained from all participants for our self-collected data. Histopathological diagnoses were confirmed by at least two experienced pathologists for each patient.
Single-Cell Sequencing Data Processing
The raw scRNA-seq data were processed using the Cell Ranger 3.0.1 pipeline provided by 10x Genomics. FASTQ files generated from Illumina sequencing were aligned to the human reference genome (GRCh38). Gene-barcode matrices were then created by counting unique molecular identifiers (UMIs) and filtering out non-cell-associated barcodes. Finally, a gene-barcode matrix containing gene expression counts for the barcoded cells was generated.
Single-cell data processing was carried out using the Seurat package (version 4.4)[Software and code are available at https://satijalab.org/seurat/]. This process included the removal of double cells using the scDblFinder package [Software and code can be found at https://github.com/plger/scDblFinder]. Quality control measures involved filtering out cells with mitochondrial gene expression exceeding 20%, ribosomal gene expression below 1%, genes expressed in fewer than 100 cells, and cells expressing fewer than 300 or more than 4,000 genes. Following these steps, gene count expression matrices were normalized using the LogNormalize method with a scale factor of 10,000, in accordance with the Seurat analysis workflow. The FindVariableFeatures function was employed to identify the top 3,000 highly variable genes (HVG) using the variance stabilizing transformation (vst) method. Subsequently, the SCTransform function was applied to normalize the HVG expression matrix, mitigating the effects of mitochondrial and ribosomal gene expression as well as the percentage of genes from different samples.
Integration and Clustering
Data integration was performed using the Harmony package (version 1.2.1) [https://github.com/immunogenomics/harmony] and the BBKNN method (version 1.1.1) [https://github.com/Teichlab/bbknn] to mitigate batch effects. Dimensionality reduction was achieved through Principal Component Analysis (PCA), utilizing the first 25 principal components to correct for technical and sample-related influences, followed by Uniform Manifold Approximation and Projection (UMAP). Clustering analysis was conducted using the FindClusters function, with a resolution parameter set to 0.8, to accurately generate distinct cell subpopulation clusters.
Cell Type Annotation
After clustering, cell populations were annotated based on characteristic genes. Specific genes for different cell subpopulations were identified using the FindMarker function in Seurat, applying a significance threshold of p < 0.05 and a log2(fold change) > 0.25. The identification of cell types was based on the expression patterns of typical and well-established marker genes for major cell types. This workflow was initially executed across all single cells to identify primary cell types. The process was then reapplied to identify more granular subpopulations within the same main cluster. Notably, subsetting excluded samples containing fewer than 200 cells to mitigate the impact of batch effects and reduce the presence of artificially generated subpopulations due to low cell numbers. For example, macrophages were initially classified into a mononuclear macrophage subpopulation, which was subsequently further divided into seven distinct macrophage subpopulations.
Single-Cell Copy-Number Variation Analysis
To distinguish malignant cells from non-malignant epithelial cells, we performed genomic copy number variation (CNV) analysis using the InferCNV package (version 1.16.0). Immune cells, specifically mononuclear macrophages, were selected as a reference based on genomic CNV. The CNV scores for each epithelial subpopulation were calculated to ensure accurate classification of different subpopulations. Epithelial subpopulations with a reference immune cell CNV score exhibiting p > 0.05 were designated as normal subpopulations, while the remaining groups were classified as malignant epithelial subpopulations for further analysis.
Characterizing Intratumor Heterogeneity and Meta-Programs of MSI-High CRC
We employed the cNMF (version 1.3) Python package, compatible with Python 3.9 [https://github.com/dylkot/cNMF], to implement Non-negative Matrix Factorization (NMF) for subtyping tumor cell populations. Through cNMF, we decomposed the gene expression profiles of malignant epithelial cells, partitioning the input gene expression matrix into two matrices: W and H. We defined a range for the K value (from 2 to 14) and executed 100 iterations for each specified k value, corresponding to different component counts, with a gene density threshold set at 0.2. A K value selection curve was generated to guide this evaluation. We then balanced stability, error, and biological interpretability to determine the optimal K value for subpopulation identification. Consequently, malignant epithelial cells were classified into distinct functional modules (MP) based on this optimal K value. Furthermore, we performed enrichment analysis of the top 100 weighted gene functions for each MP using the fgsea package (version 1.30.0) [https://github.com/alserglab/fgsea], enabling the characterization of the biological functions associated with the different MP within tumor cells.
Single-Cell Pseudobulk Analysis
To evaluate the enrichment of functional modules (MP) in each sample of the single-cell validation dataset, we conducted a Pseudobulk analysis. This process followed the guidelines provided at (https://satijalab.org/seurat/ reference/ pseudobulkexpression), wherein we calculated the average gene expression value for each sample. Subsequently, we assessed the enrichment scores for different MPs using Gene Set Variation Analysis (GSVA). The resulting score heatmap was generated using the ComplexHeatmap package [https://github.com/jokergoo/ComplexHeatmap].
Recognition of Tumor Characteristics and Association with Immunotherapy
Differentially expressed genes in the in-house data were identified using the Wilcoxon rank-sum test. Genes that exhibited significant differences between tumor subpopulations were selected for subsequent functional enrichment analyses. Metabolic analysis was conducted using the scMetabolism package to evaluate the metabolic features of different cell subpopulations and assess activity differences in metabolic pathways among the various groups. The AddModuleScore function was employed to score gene sets in different cell populations, identifying gene sets associated with specific functional modules. The proportions of different subpopulations and their spatial distribution preferences were analyzed using Odds Ratio (OR) and Relative Odds Estimate (ROE) to assess the distribution and preference of cell subpopulations within the tumor tissue.
Several enrichment analyses were performed, including Gene Set Variation Analysis (GSVA), Gene Set Enrichment Analysis (GSEA), KEGG pathway analysis, and Gene Ontology (GO) analysis. These analyses were used to identify functional characteristics and signaling pathways specific to different cell populations. The differentiation status of different cell populations was analyzed using the Cytotrace2 package. Additionally, trajectory analysis was performed using Monocle2 to evaluate developmental pathways and dynamic changes in cells, providing further insights into the evolution of the tumor immune microenvironment. Cellular communication was assessed using the CellChat package, evaluating interactions between tumor cells and immune cells and revealing mechanisms of immune evasion.
Analysis of Differentially Expressed Genes and Functional Enrichment
Differentially expressed genes within the in-house dataset were identified using the Wilcoxon rank-sum test. Genes that exhibited significant expression differences between tumor subpopulations were selected for subsequent functional enrichment analyses. Metabolic features of different cell subpopulations were evaluated using the scMetabolism package (version 2.1.0) [https://github.com/wu-yc/scMetabolism], allowing for an assessment of activity differences in metabolic pathways across the various groups. Pathway analysis was conducted using gene sets from the MSigDB (version 7.4) [https://www.gsea-msigdb.org/gsea/msigdb], which included 50 Hallmark pathways such as “HALLMARK_EPITHELIAL_MESENCHYMAL_TRANSITION” “HALLMARK_GLYCOLYSIS” “HALLMARK_HYPOXIA” and “HALLMARK_INFLAMMATORY_RESPONSE.” Additionally, pathways from KEGG (https://www.genome.jp/kegg/), GO (https://www.geneontology.org/), and REACTOME (https://reactome.org/) were incorporated. Scores for glycolysis and lactate metabolism responses were defined based on the average expression of genes annotated in the MSigDB gene sets “GOBP_GLUCOSE_METABOLIC_PROCESS.v2024.1.Hs (GO:0006006)” and “GOBP_LACTATE_METABOLIC_PROCESS.v2024.1.Hs (GO:0006089).”The `AddModuleScore` function from the Seurat package and the AUCell package (https://github.com/aertslab/AUCell) were utilized to score gene sets in different cell populations, thereby identifying gene sets associated with specific functional modules.
Enrichment Analysis
Multiple enrichment analyses were conducted, including Gene Set Variation Analysis (GSVA) (version 2.0.5)[https://github.com/rcastelo/GSVA], Gene Set Enrichment Analysis (GSEA), KEGG pathway analysis, and Gene Ontology (GO) analysis. These analyses aimed to elucidate the functional characteristics and signaling pathways specific to the various cell populations.
Analysis of Subpopulation Quantity Differences
The proportions of different subpopulations and their spatial distribution preferences were analyzed using Odds Ratio (OR) and Relative Odds Estimate (ROE) [https://github.com/Japrin/STARTRAC]. This analysis assessed the distribution and preferences of cell subpopulations within tumor tissue. Subpopulations were considered to exhibit significant preferences if the OR score was greater than 2 and the p-value was less than 0.05.
Analysis of Cellular Differentiation and Pseudotime
The differentiation status of various cell populations was assessed using the Cytotrace2 package (version 1.1.0) [https://github.com/digitalcytometry/cytotrace2]. The Cytotrace2 was utilized to calculate the stemness scores for each cell, which were then visualized using box plots followed by differential analysis to evaluate the level of differentiation among distinct cell subpopulations. Additionally, trajectory analysis was conducted using Monocle2[https://cole-trapnell-lab.github.io/monocle-release/] to evaluate developmental pathways and dynamic changes within the cells, thereby providing deeper insights into the evolution of the tumor immune microenvironment.
Cellular Communication Analysis
Cellular communication was analyzed using the CellChat package (version 2.1.0) [https://github.com/jinworks/CellChat]. This analysis utilized the CellChatDB human database, which includes all experimentally validated ligand-receptor interaction relationships involving “secreted signals” “cell-cell contact” and “ECM-receptor” interactions. The communication probabilities were modeled using the Trimean algorithm, and significance testing was performed through permutation tests with 1000 iterations. Ligand-receptor pairs exhibiting significant interactions between cell subpopulations were identified with a significance threshold of p < 0.05.
Transcriptomic Scoring and Prognosis Analysis
We obtained transcriptomic data from the GEO database (https://www.ncbi.nlm.nih.gov/gds) and the Xena platform (https://xena.ucsc.edu/), specifically RNA-seq data from the TCGA-COAD cohort, which includes 514 samples that were normalized using FPKM. The top 100 characteristic genes from selected subgroups were designated as markers for performing Gene Set Variation Analysis (GSVA) scoring on the transcriptomic samples.GSVA was utilized to evaluate the enrichment of gene sets across the patient samples, with particular emphasis on key pathways related to the immune microenvironment and tumor progression. Prognostic analysis of the transcriptomic data was conducted using the survival package (version 3.2.11) [https://github.com/therneau/survival]. This analysis produced survival curves to investigate the correlation between gene expression levels and patient prognosis in colorectal cancer (CRC). To categorize patients into high and low characteristic groups, the `surv_cutpoint` function was employed to determine the optimal cutoff value. Kaplan-Meier survival curves were then generated using the `ggsurvplot` function, with a p-value threshold of <0.05 set for statistical significance. Finally, the `coxph` function was applied to fit a Cox proportional hazards model, controlling for variations in age and sex.
Spatial Transcriptomics Analysis
We analyzed 10X Visium data following the protocols provided on the Seurat website (https://satijalab.org/seurat/articles/spatial_vignette). Spatial transcriptomics data were processed by calculating cell scores and pathway scores. Gene Set Variation Analysis (GSVA) was employed to assess pathway enrichment scores, with the results visualized alongside the spatial transcriptomics data to illustrate the spatial distribution of different cell types. Additionally, we conducted a correlation analysis of the spatial transcriptomics data using Pearson correlation coefficients to evaluate the relationships among the spatial distribution of various cell types, pathway scores, and immune cell distribution within the tumor microenvironment. Correlation lines were plotted using the ggplot2 package (version 3.5.1).
Statistical Analysis
All statistical graphs and analyses were conducted using R (version 4.3.3), with error bars representing either standard error of the mean (S.E.M.) or standard deviation (S.D). Spearman correlation coefficient was utilized to assess correlations, while survival analyses were executed using the Log rank test. Statistical significance was determined using Student’s t-test, Kruskal–Wallis test, Wilcoxon rank-sum test, ANOVA, and the Limma moderated t-test, with the Benjamini-Hochberg correction applied for multiple comparisons. A p-value of < 0.05 was considered statistically significant. Additionally, all other statistical analyses in this study were performed using R (version 4.3.3).
Result
Single-Cell Atlas Reveals Six Distinct Tumor Cell Subpopulations in MSI-H CRC
The schematic of the study design and experimental procedures of this study is depicted in Figure 1A. We integrated single-cell RNA sequencing (scRNA-seq) data from 40 treatment-naïve MSI-H CRC patients (GSE132465, GSE178341, GSE200997) and 19 patients enrolled in a Phase 2 trial (NCT02926228) receiving neoadjuvant toripalimab (anti-PD1) ± celecoxib. The clinical and pathological features of the patients enrolled in the trial was shown in Table 1. Additionally, the study incorporated single-cell data with spatial transcriptomics from 31 samples and bulk RNA sequencing data from 742 samples to investigate immune resistance cell profiling in MSI-H/dMMR patients.
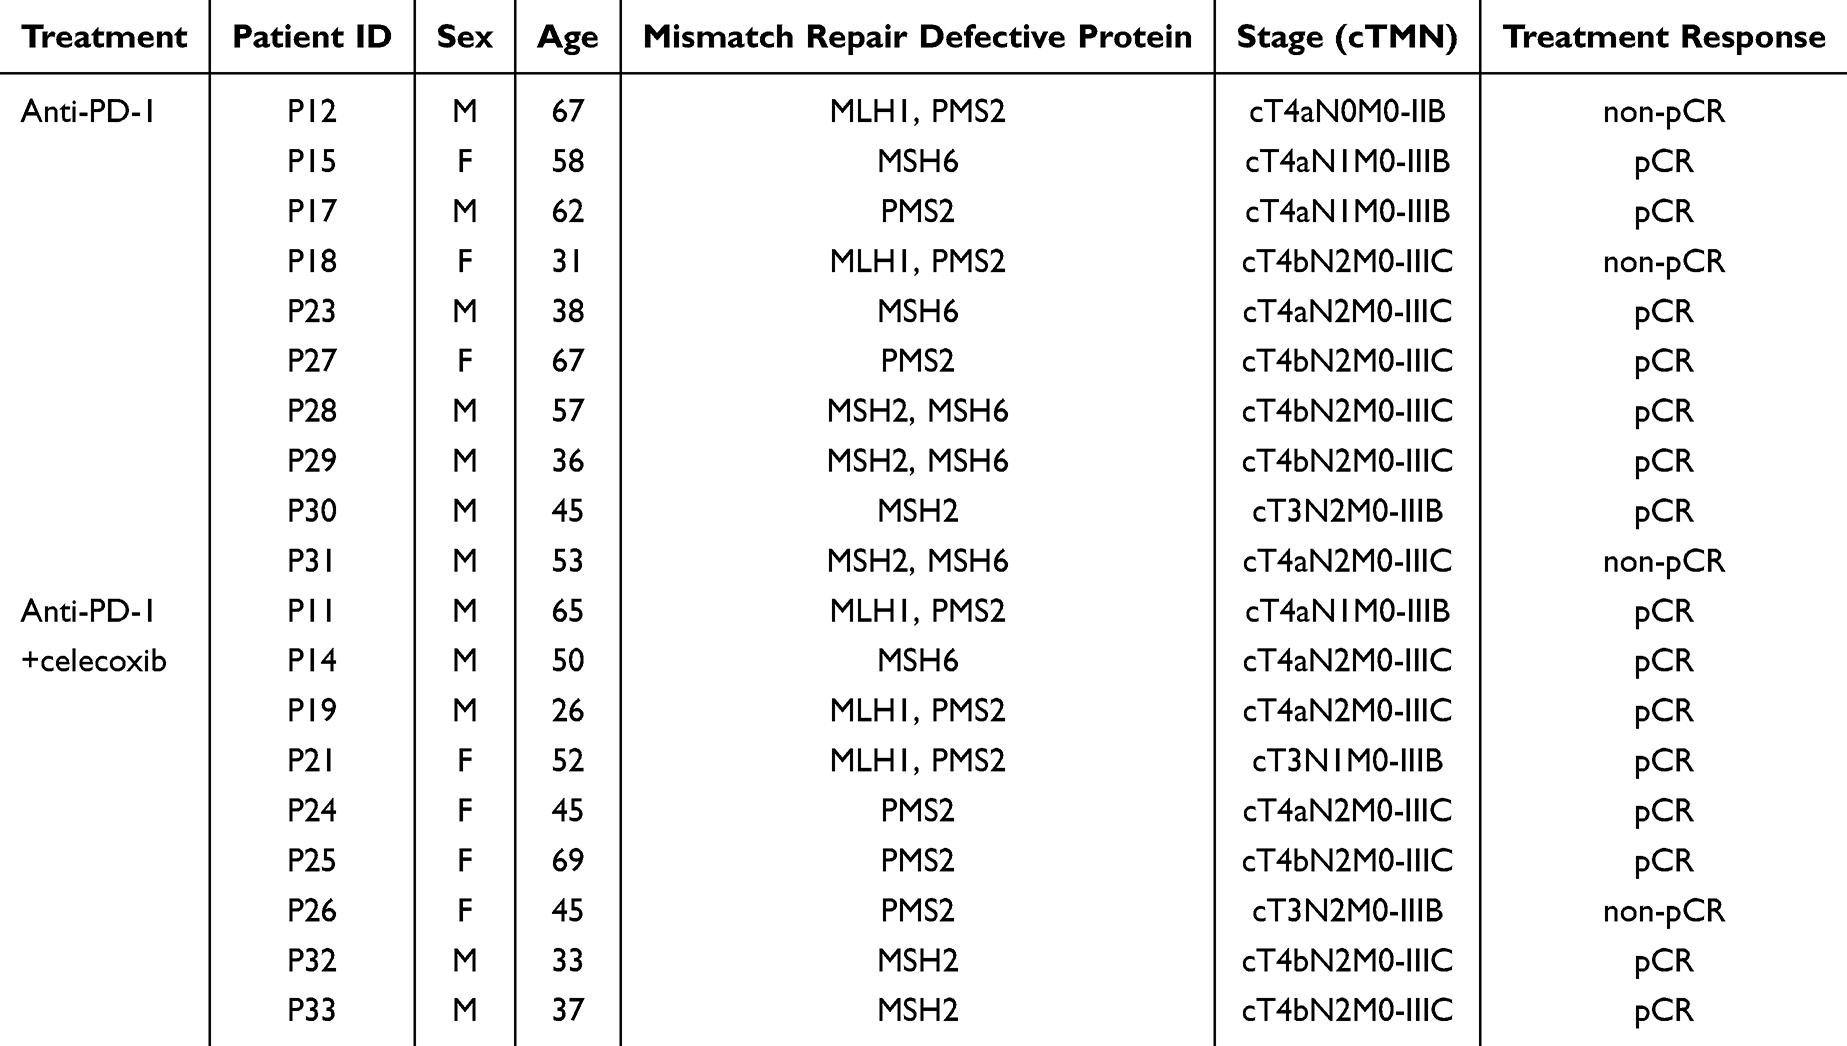 |
Table 1 The Clinical and Pathological Features of the CRC Patients |
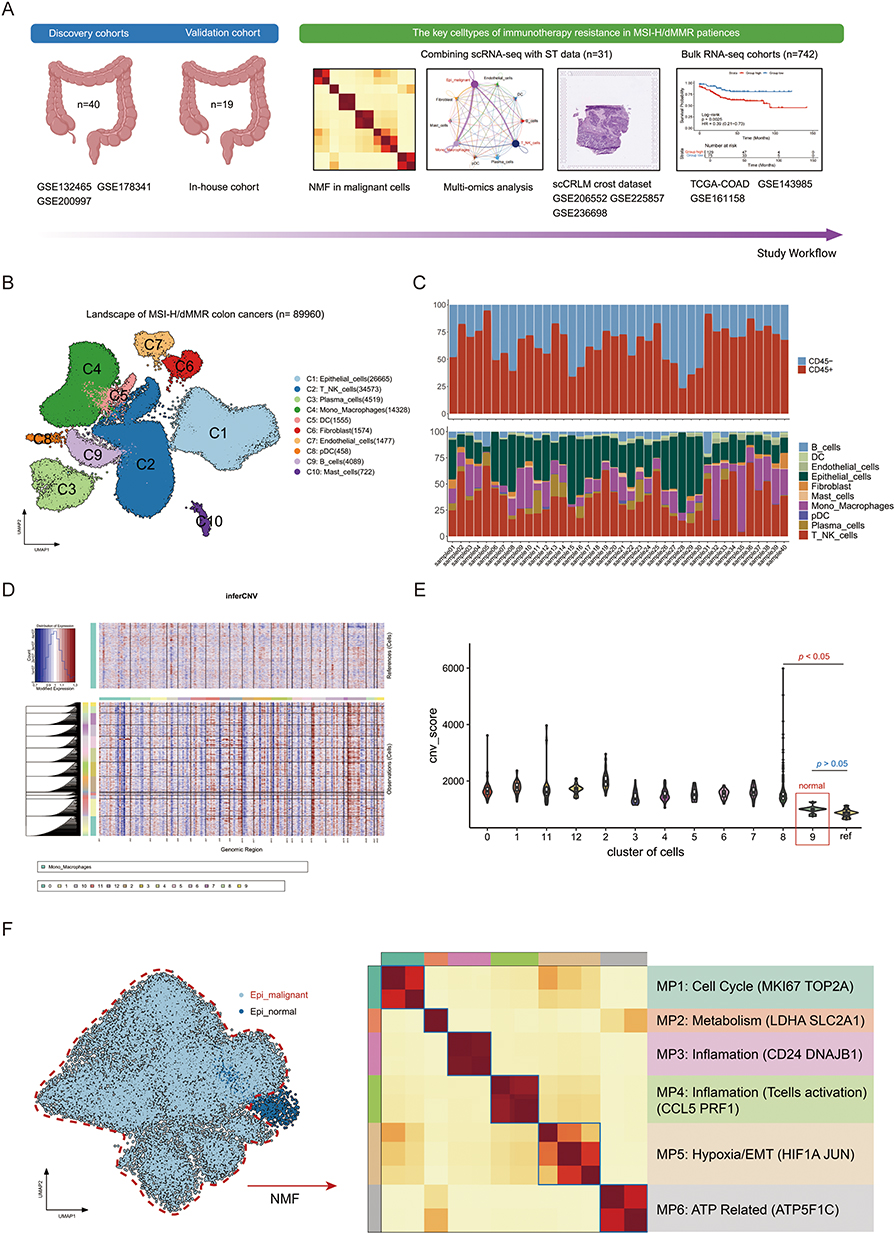 |
Figure 1 Landscape profiling of the tumor and immune microenvironment in patients with microsatellite instability-high (MSI-H) colorectal cancer. (A) Schematic overview of the study design. (B) UMAP plot displaying a total of 89,960 cells classified into 10 major cell type clusters. (C) Stacked bar plot illustrating the proportions of tumor cell subclusters within each sample. (D) Genomic copy number variation (CNV) analysis of different subclusters. (E) Violin plot depicting the CNV scores across various subclusters of epithelial cells. (F) UMAP plots showcasing normal and malignant subclusters of epithelial cells, accompanied by a heatmap revealing six macrophage populations identified through non-negative matrix factorization (NMF) analysis. |
After stringent quality control (Supplementary Figure 1A–D), including mitochondrial gene filtering (<20%) and doublet removal (DoubletFinder, FDR <0.05), we analyzed 89,960 high-quality single cells, clustering them into 10 major lineages based on distinct gene expression patterns: epithelial cells (C1, KRT19+/EpCAM+), T/NK cells (C2, CD3D+/NKG7+/PRF1+), plasma cells (C3, MZB1+/JCHAIN+), Mono_Macrohpages (C4, CD68+/CD14+), Fibroblast (C6,COL1A1+/PDGFRA+/FGF7+), Endothelial (C7, VWF+) and other immune subsets (Figure 1B and C, Supplementary Figure 1E). We verified that the well-known marker genes of each major cell type were expressed with high specificity (Supplementary Figure 1F-G). The epithelial cells underwent further clustering, and individual cells were identified through genomic CNV analysis (Figure 1D, Supplementary Figure 1H). A comparison of CNV scores indicated that cluster C9 consisted of normal cells, whereas the other clusters were characterized as malignant tumor cells (Figure 1E and F).
Recognizing the critical role of malignant cells in tumor progression and immune evasion, we employed non-negative matrix factorization (NMF) to analyze the integrated scRNA-seq data. This approach identified six prominent meta-programs (MP) with distinct transcriptional signature intrinsic to the tumor cells (optimal K=6 by cophenetic coefficient; Figure 1F, Supplementary Figure 1I). We next performed gene set-based analyses to delineate the molecular characteristics of each MP. MP1 was associated with cell cycle signaling (TOP2A+, MKI67+); MP2 was enriched in glycolysis metabolism (LDHA+, SLC2A1+); MP3/MP4 showed enhanced inflammatory response (CD24+, CCL5+); MP5 exhibited hypoxia/EMT signaling activation (HIF1A+, JUN+) and MP6 exhibited ATP synthesis (ATP5F1C+).
MP2 Glycolytic Subpopulation Drives Immune Evasion and Therapy Resistance
Utilizing single-cell sequencing data from 19 patients enrolled in a phase 2 trial (NCT02926228), we conducted dimensionality reduction, clustering, and annotation, which led to the identification of nine distinct cell clusters (Figure 2A and B). The feature maps of different subpopulations are displayed in Supplementary Figure 2A. To investigate the tumor heterogeneity of the MSI-high CRC in our clinical trial, we computed functional module scores for each MP based on their signature genes. By calculating the MP abundance across patients, we found that MP2 abundance was highest in non-pCR patients (Figure 2C and D).
 |
Figure 2 Relationship between MP2 Tumors and therapeutic efficacy of MSI-H immunotherapy. (A) UMAP plot displaying nine distinct cell clusters identified within the dataset. (B) Visualization of varying therapeutic efficacy of immunotherapy across different patient cohorts represented in a UMAP plot. (C) Heatmap illustrating abundance scores for macrophage populations (MPs) with a notable emphasis on elevated MP2 expression levels in non-pathological complete response (non-pCR) patients. (D) Bar plot quantifying the enrichment of MP2 specifically in non-pCR patients. (E) Gene Set Enrichment Analysis (GSEA) results revealing significant pathways enriched in MP2 tumors compared to other tumor categories. (F) Spatial feature plots depicting the signature scores of MP2 tumors alongside glucose metabolic process markers in tissue sections, including the Pearson correlation analysis of these scores. (G) Violin plot representing the activation levels of glucose metabolism pathways within MP2 tumors. (H) Comparative analysis of the proportions of cell types between MP2-enriched tumors and other tumor types. (I) Analysis of cell communication dynamics among different cell populations within MP2 tumors. |
Gene set enrichment analysis (GSEA) of MP2 indicated a strong correlation with glycolysis pathway genes (Figure 2E), and MP2 demonstrated elevated levels of both glycolysis and gluconeogenesis (Figure 2G). Additionally, metabolic analysis confirmed that the glycolysis pathway was activated in MP2 tumors (Supplementary Figure 2B and C). Further integration with spatial transcriptomics data revealed that areas with high MP2 enrichment coincided with regions exhibiting enhanced glycolytic activity (Figure 2F). To investigate the heterogeneity of the TME in MP2, cell-type analysis revealed that patients with MP2-enriched tumors exhibited a significant increase in monocytes/macrophages and a notable decrease in T/NK cells compared to other patients (Figure 2H). Furthermore, cell communication analysis indicated robust interactions among MP2 tumors, monocytes/macrophages, and T/NK cells (Figure 2I).
MP2 Orchestrates an Immunosuppressive Niche via Tregs and FOLR2+ Macrophages
To further analyze the immune microenvironment of MP2 tumors, we reclustered T/NK cells, resulting in the identification of 16 distinct clusters (Figure 3A). Feature maps for each cluster are presented in Supplementary Figure 3A. Markers for different CD4 T cell subpopulations are illustrated in Supplementary Figure 3B and 3C, with an odds ratio analysis revealing an enrichment of regulatory T cells (Tregs) in MP2 tumors (Supplementary Figure 3D). Similarly, markers for various CD8 T cell subpopulations are depicted in Supplementary Figure 3E and F. Notably, the metabolic activity of CD8 T cells decreased (Supplementary Figure 3G), accompanied by a reduction in effector markers and an increase in exhaustion markers (Supplementary Figure 3H and I).
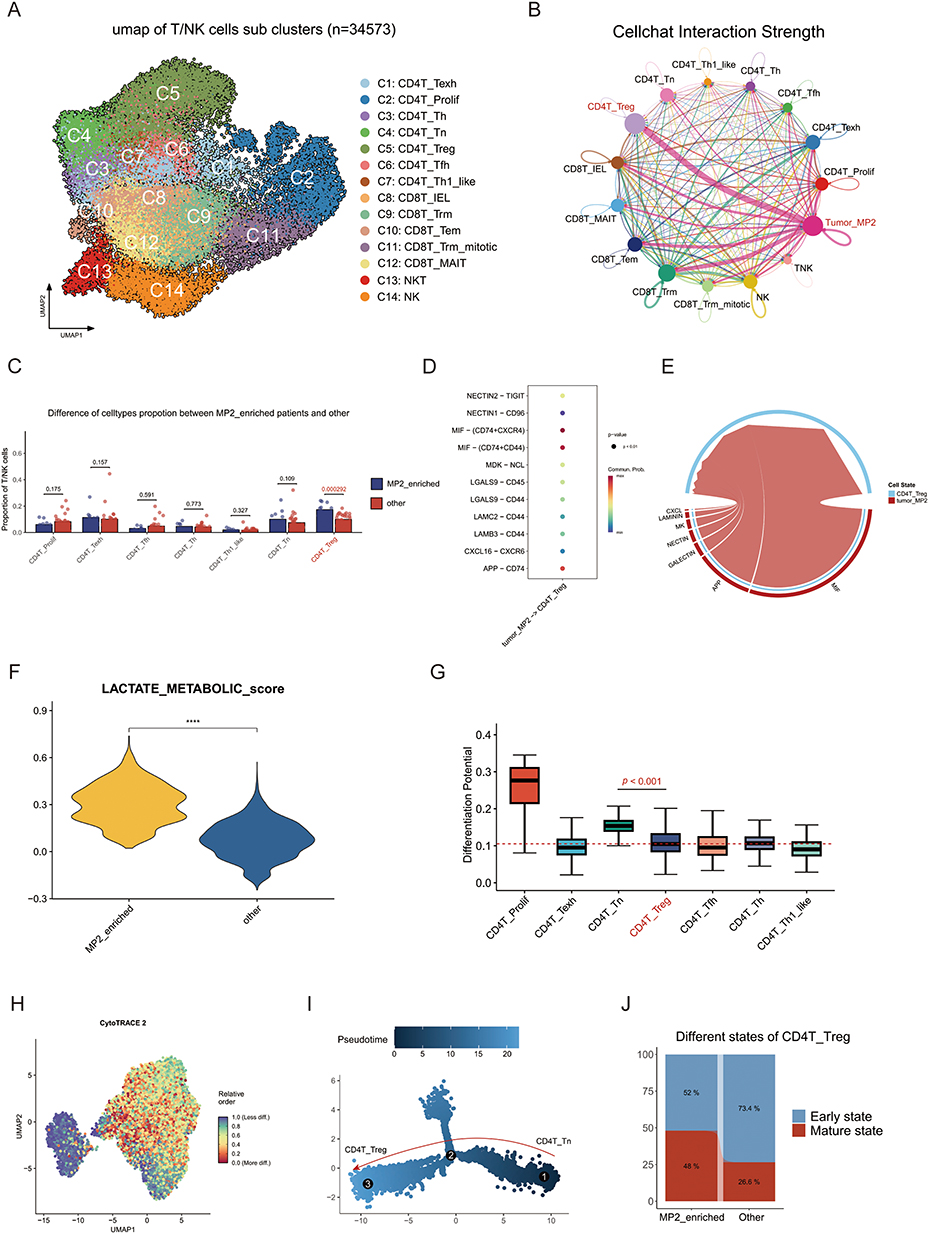 |
Figure 3 Characterization of T/NK cell in MP2 tumors. (A) UMAP plot illustrating 16 distinct clusters of T/NK cells identified within MP2 tumors. (B) Cell communication analysis depicting interactions between various T/NK cell types and the MP2 tumor microenvironment. (C) Comparative analysis of the proportion of different T/NK cell types between MP2-enriched tumors and other tumor categories. (D) Pathway analysis contrasting MP2 tumors and regulatory T cells (Tregs), highlighting key differences. (E) Detailed examination of cell communication pathways between MP2 tumors and Tregs. (F) Violin plot demonstrating a significant difference in lactate metabolic scores between MP2 tumors and other tumor types. (G) Evaluation of the differentiation potential of various T/NK cell subsets. (H) UMAP plot depicting the varying degrees of differentiation among T/NK cell populations. (I) Monocle2 trajectory analysis of T cells, illustrating developmental pathways. (J) Comparison of different states of Tregs between MP2-enriched tumors and other tumor types, emphasizing functional diversity. |
Cell communication analysis indicated that MP2 tumors predominantly influence regulatory T cells (Tregs) (Figure 3B–E). Meanwhile, MP2-enriched tumors displayed a significantly increase of T/NK cell subsets compared to other tumors (Figure 3C). Furthermore, pathway analysis was conducted to highlight the significant effect of MIF pathway between MP2 tumors and regulatory T cells (Tregs) (Figure 3D). Previous studies have suggested that Tregs contribute to lactate production; our findings support this hypothesis, as MP2 tumors displayed elevated lactate scores (Figure 3F). Pseudotime analysis (Cytotrace2) revealed a higher degree of differentiation among Tregs within MP2 tumors (Figures 3G and H), while Monocle2 analysis demonstrated that Tregs originated from naive T cells and that MP2 tumors promote their development and differentiation (Figures 3I and J).
Upon analyzing MP2 monocyte/macrophages, we identified seven distinct subpopulations based on marker genes: C1: Mono FCN1 (7%), C2: Mono IL1B (16%), C3: Mac_SPP1 (26%), C4: Mac_VAMP5 (12%), C5: Mac_TMSB4X (14%), C6: Mac_FOLR2 (20%), and C7: Mac_MKI67 (5%) (Figures 4A and B and Supplementary Figure 4A and B). Notably, further examination of the cellular proportions indicated a significant increase in Mac_FOLR2 among patients with MP2 tumor enrichment (Figure 4C). Additionally, communication analysis illustrated that MP2 tumors predominantly interact with Mac_FOLR2 (Figure 4D), with regulation occurring primarily through the MIF pathway (Figure 4E).
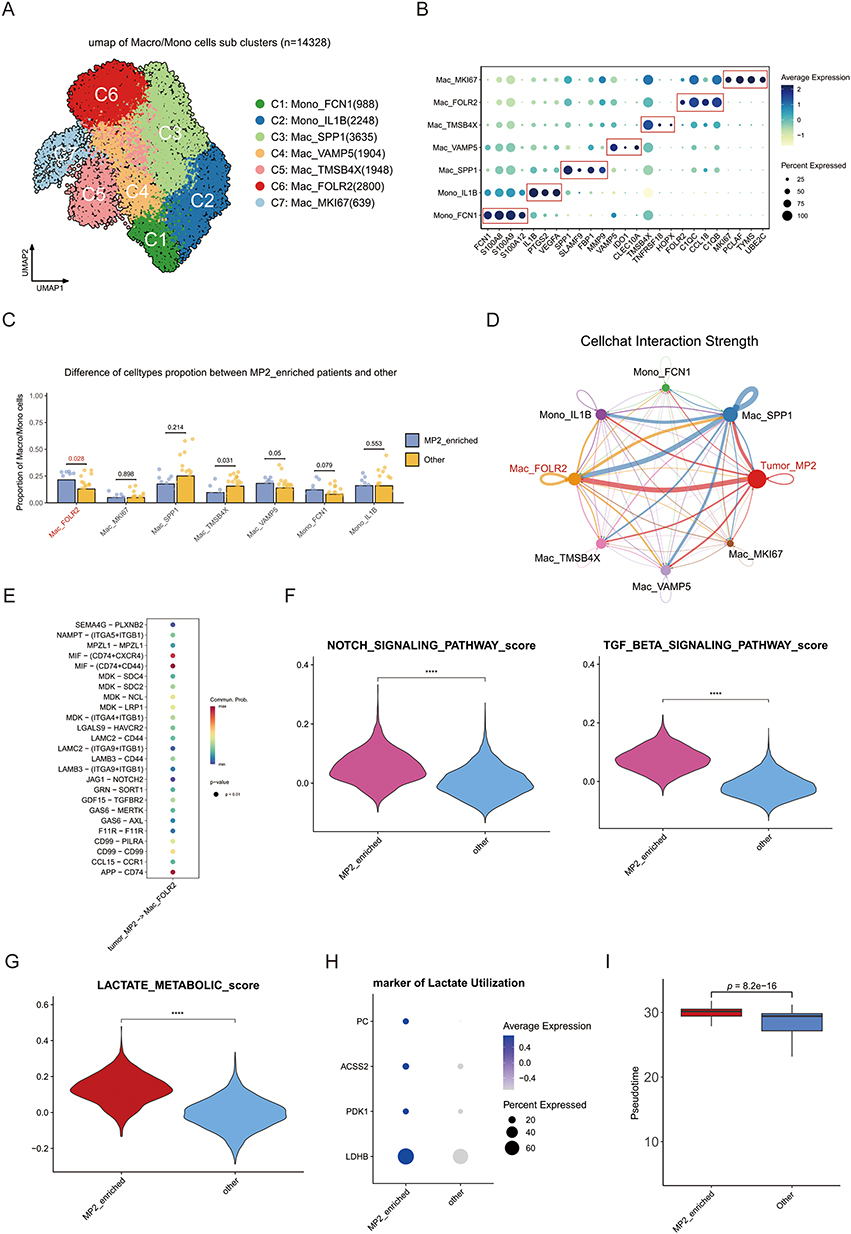 |
Figure 4 Characterization of monocytes and macrophages in MP2 tumors. (A) UMAP plot revealing 7 distinct subclusters of monocytes and macrophages within MP2 tumors. (B) Dot plot illustrating the expression levels of key marker genes across different monocyte/macrophage subclusters. (C) Comparative analysis of the proportions of various cell types between MP2-enriched tumors and other tumor types. (D) Cell communication analysis elucidating interactions between the different subclusters of monocytes/macrophages and the MP2 tumor microenvironment. (E) Identification of divergent pathways between MP2 tumors and Mac_FOLR2-expressing macrophages. (F) Violin plot demonstrating the relationship between MP2 tumors and epithelial-mesenchymal transition (EMT)-related pathways, specifically TGFB and Notch signaling. (G) Violin plot indicating the activation of lactate metabolism pathways within MP2 tumors. (H) Dot plot highlighting the elevated expression of lactate marker genes specifically in MP2 tumors. (I) Comparative assessment of the factors influencing the development of Mac_FOLR2 in MP2 tumors versus other tumor types. |
Our findings highlight that Mac_FOLR2 is highly associated with epithelial-mesenchymal transition (EMT)-related pathways, such as TGFB and Notch signaling, suggesting its role in macrophage polarization and immune suppression (Figure 4F). Moreover, Mac_FOLR2 showed signs of activated lactate metabolism, evidenced by the upregulation of genes involved in lactate utilization (Figures 4G and H). Cytotrace2 analysis indicated a higher degree of differentiation in Mac_FOLR2 (Supplementary Figure 4C and D), while Monocle2 analysis suggested that Mac_FOLR2 is at the terminal stage of subpopulation development (Supplementary Figure 4E–G). Importantly, the presence of MP2 tumors significantly influences the development of Mac_FOLR2 (Figure 4I).
Clinical Validation of MP2 as a Prognostic Biomarker
The heatmap of MP enrichment in spatial transcriptomics samples is shown in Figure 5A. In MP2 tumor-enriched samples, spatial mapping confirmed MP2/Mac_FOLR2/Treg co-localization as hallmarks of immune-suppressive niches (Figure 5B). In 742 MSI-H CRC samples (TCGA, GSE142985, GSE161158), a glycolysis signature (MP2-derived), along with signatures of Mac_FOLR2, and Tregs, predicted poor overall survival in CRC (Figure 5C).
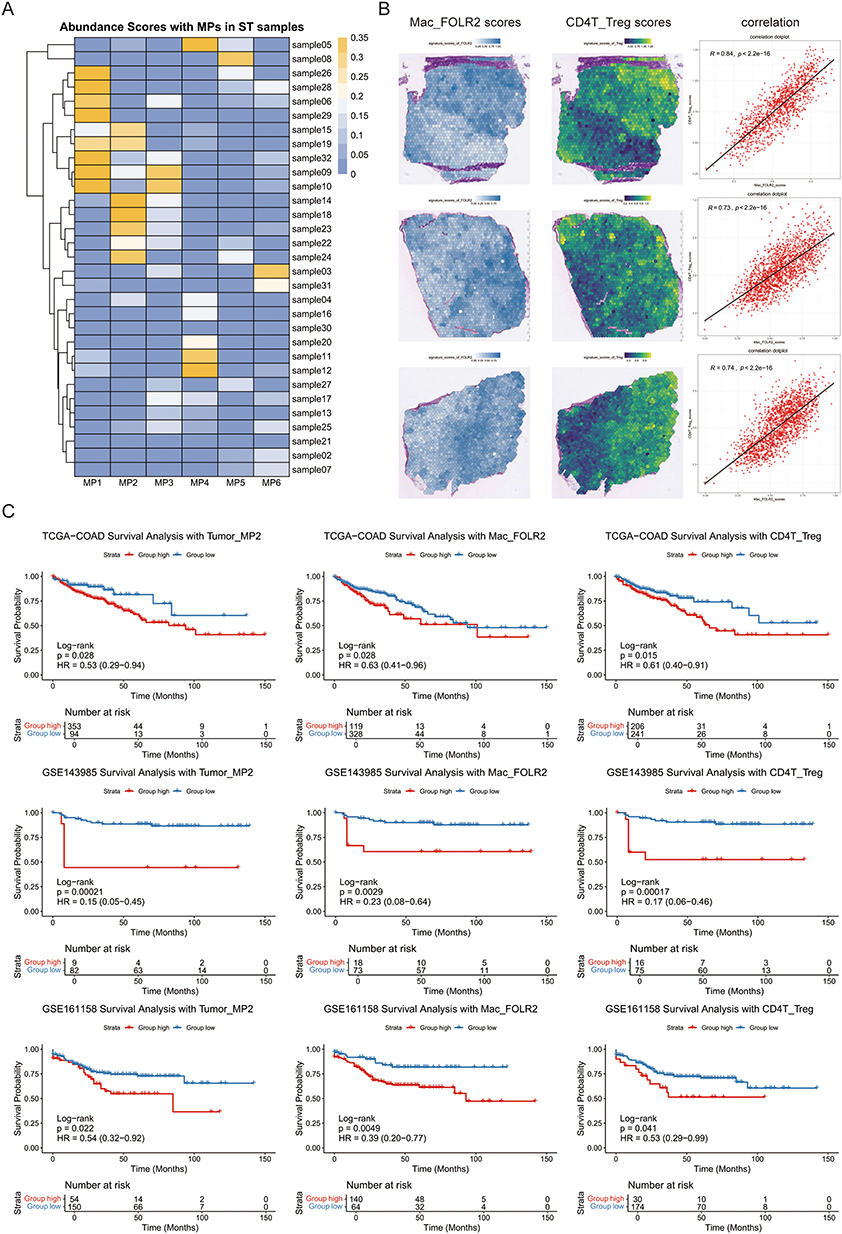 |
Figure 5 Integration of spatial transcriptomics and clinical transcriptional cohorts to validate single-cell discoveries. (A) Heatmap depicting abundance scores of MPs in spatial transcriptomics samples. (B) Spatial feature plots of signature score of MP2 tumor and glucose metabolic process in tissue section. (C) The Kaplan–Meier analysis of overall survival stratified by the signature of MP2, Mac_FOLR2, and Tregs. P-values were calculated using the Log rank test. |
Discussion
Through integrative single-cell and spatial transcriptomic analysis, we delineated a glycolytic tumor subpopulation (MP2) that drives immunosuppression and therapeutic resistance in MSI-H CRC. This subpopulation coordinates metabolic crosstalk with FOLR2+ macrophages and regulatory T cells (Tregs), establishing a spatially organized immunosuppressive niche. Our findings bridge tumor metabolic heterogeneity with immune evasion mechanisms, offering novel insights into overcoming resistance to immune checkpoint blockade (ICB) in MSI-H/dMMR CRC.
The metabolic plasticity of cancer cells has emerged as a key determinant of therapy resistance.22,23 Our findings highlight the central role of tumor cell-intrinsic metabolic reprogramming non-pCR patients receiving anti-PD1 therapy, consistent with recent reports linking Warburg effect activation to ICI resistance in melanoma and NSCLC.24,25 Notably, lactate, a byproduct of glycolysis, serves as a critical immunosuppressive metabolite.26 High lactate levels in the tumor microenvironment have been shown to inhibit effector T-cell function, promote Treg differentiation, and polarize macrophages toward an immunosuppressive phenotype.27–29 Notably, spatial transcriptomics revealed that MP2-enriched niches exhibit coordinated upregulation of glycolysis and macrophage-mediated lactate recycling, mirroring the “lactate shuttle” paradigm observed in other tumors.30 This metabolic symbiosis may establish a self-reinforcing immunosuppressive loop: MP2-derived lactate not only acidifies the TME to impair cytotoxic lymphocyte function, but also serves as a metabolic substrate for FOLR2+ TAMs, which in turn secrete TGFβ to promote Treg expansion.
The spatial resolution of our study adds another layer of novelty by revealing the precise organization of metabolic-immune interactions within the tumor ecosystem.31,32 Unlike bulk analyses, which obscure spatial relationships, our spatial transcriptomic data demonstrate that MP 2 tumor cells are not randomly distributed but instead form localized immunosuppressive niches. These niches are enriched in lactate and populated by Tregs and FOLR2+ TAMs, creating a physical and functional barrier to effector T-cell infiltration. Such spatial organization likely facilitates sustained immune evasion by concentrating immunosuppressive signals in specific regions of the tumor.
Recent studies emphasize that TME spatial organization, rather than bulk immune infiltration, determines ICB efficacy.33 Our data suggest that glycolytic tumors may represent a distinct “cold” subtype of MSI-H CRC, characterized by metabolic immunosuppression despite high mutational burden. This dichotomy explains why approximately 30–40% of MSI-H CRCs fail to respond to PD-1 blockade and underscores the need for combinatorial strategies. Preclinical models demonstrate that LDHA inhibitors reverse lactate-mediated T cell dysfunction,34 while CSF1R blockers deplete protumor macrophages.35 Synergizing these agents with ICB could disrupt the MP2-driven immunosuppressive axis, a hypothesis being tested in ongoing trials (NCT02880371).
Several limitations warrant consideration. First, although scRNA-seq reveals cellular associations, functional validation of MP2-derived lactate in driving macrophage polarization requires in vitro co-culture systems. Second, the spatial resolution of current transcriptomics (55 μm spot size) may underestimate niche-specific interactions, necessitating single-molecule FISH validation. Finally, prospective validation of the MP2 signature in randomized controlled trials is needed before clinical application.
Conclusion
Our study represents a significant step forward in understanding the mechanisms of ICB resistance in MSI-H CRC. By integrating single-cell and spatial transcriptomics, we have uncovered a glycolysis-driven tumor cell subpopulation that orchestrates immune suppression through lactate production, lactylation-mediated epigenetic reprogramming, and recruitment of FOLR2+ TAMs. These findings not only advance our fundamental knowledge of tumor-immune interactions but also provide a roadmap for developing novel therapeutic strategies, such as combining metabolic inhibitors with ICB, to overcome immune evasion in MSI-H CRC and potentially other cancers.
Abbreviations
MSI-H, Microsatellite instability-high; d-MMR, Mismatch repair-deficient; CRC, Colorectal cancer; ICB, Immune checkpoint blockade; scRNA-seq, Single-cell RNA sequencing; TAMs, Tumor-associated macrophages; MDSCs, Myeloid-derived suppressor cells; UMIs, Unique molecular identifiers; HVG, Highly variable genes; Vst, Variance stabilizing transformation; PCA, Principal Component Analysis; UMAP, Uniform Manifold Approximation and Projection; CNV, Copy number variation; NMF, Non-negative Matrix Factorization; GSVA, Gene Set Variation Analysis; GSEA, Gene Set Enrichment Analysis; OR, Odds Ratio; ROE, Relative Odds Estimate; GO, Gene Ontology; MP, Meta-programs; Tregs, Regulatory T cells.
Data Sharing Statement
The datasets for this study can be found in the TCGA (https://portal.gdc.cancer.gov/), GEO database (https://www.ncbi.nlm.nih.gov/gds), the Xena platform (https://xena.ucsc.edu/), KEGG (https://www.genome.jp/kegg/), GO (https://www.geneontology.org/), and REACTOME (https://reactome.org/).
Ethics Approval and Consent to Participate
The study involving human participants were reviewed and approved by the institutional review board of the Sixth Affiliated Hospital of Sun Yat-sen University (Guangzhou, China).
Acknowledgments
The authors would like to thank all the doctors of the Sixth Affiliated Hospital of Sun Yat-sen University providing the necessary information for this study.
Author Contributions
All authors made a significant contribution to the work reported, whether that is in the conception, study design, execution, acquisition of data, analysis and interpretation, or in all these areas; took part in drafting, revising or critically reviewing the article; gave final approval of the version to be published; have agreed on the journal to which the article has been submitted; and agree to be accountable for all aspects of the work.
Funding
This work was supported by the National Key Research and Development Program of China (Grant Numbers: 2024ZD0520806), National Natural Science Foundation of China Outstanding Youth Science Fund Project (Grant Numbers: 82425045), and NSFC General Program Project (Grant Numbers: 82272800).
Disclosure
The authors declare that the research was conducted in the absence of any commercial or financial relationships that could be construed as a potential conflict of interest.
References
1. Vilar E, Gruber SB. Microsatellite instability in colorectal cancer-the stable evidence. Nat Rev Clin Oncol. 2010;7(3):153–162. doi:10.1038/nrclinonc.2009.237
2. Wang J, Xiu J, Farrell A, et al. Mutational analysis of microsatellite-stable gastrointestinal cancer with high tumour mutational burden: a retrospective cohort study. Lancet Oncol. 2023;24(2):151–161. doi:10.1016/S1470-2045(22)00783-5
3. Andre T, Elez E, Van CE, et al. Nivolumab plus ipilimumab in microsatellite-instability-high metastatic colorectal cancer. N Engl J Med. 2024;391(21):2014–2026. doi:10.1056/NEJMoa2402141
4. Adeleke S, Haslam A, Choy A, et al. Microsatellite instability testing in colorectal patients with Lynch syndrome: lessons learned from a case report and how to avoid such pitfalls. Per Med. 2022;19(4):277–286. doi:10.2217/pme-2021-0128
5. Ludford K, Ho WJ, Thomas JV, et al. neoadjuvant pembrolizumab in localized microsatellite instability high/deficient mismatch repair solid tumors. J Clin Oncol. 2023;41(12):2181–2190. doi:10.1200/JCO.22.01351
6. Overman MJ, McDermott R, Leach JL, et al. Nivolumab in patients with metastatic DNA mismatch repair-deficient or microsatellite instability-high colorectal cancer (CheckMate 142): an open-label, multicentre, phase 2 study. Lancet Oncol. 2017;18(9):1182–1191. doi:10.1016/S1470-2045(17)30422-9
7. Li J, Wu C, Hu H, et al. Remodeling of the immune and stromal cell compartment by PD-1 blockade in mismatch repair-deficient colorectal cancer. Cancer Cell. 2023;41(6):1152–1169.e7. doi:10.1016/j.ccell.2023.04.011
8. Pavlova NN, Zhu J, Thompson CB. The hallmarks of cancer metabolism: still emerging. Cell Metab. 2022;34(3):355–377. doi:10.1016/j.cmet.2022.01.007
9. Pitt JM, Marabelle A, Eggermont A, Soria JC, Kroemer G, Zitvogel L. Targeting the tumor microenvironment: removing obstruction to anticancer immune responses and immunotherapy. Ann Oncol. 2016;27(8):1482–1492. doi:10.1093/annonc/mdw168
10. Vander Heiden MG, DeBerardinis RJ. Understanding the intersections between metabolism and cancer biology. Cell. 2017;168(4):657–669. doi:10.1016/j.cell.2016.12.039
11. Faubert B, Solmonson A, DeBerardinis RJ. Metabolic reprogramming and cancer progression. Science. 2020;368(6487):eaaw5473. doi:10.1126/science.aaw5473
12. Lee HO, Hong Y, Etlioglu HE, et al. Lineage-dependent gene expression programs influence the immune landscape of colorectal cancer. Nat Genet. 2020;52(6):594–603. doi:10.1038/s41588-020-0636-z
13. Pelka K, Hofree M, Chen JH, et al. Spatially organized multicellular immune hubs in human colorectal cancer. Cell. 2021;184(18):4734–4752.e20. doi:10.1016/j.cell.2021.08.003
14. Khaliq AM, Erdogan C, Kurt Z, et al. Refining colorectal cancer classification and clinical stratification through a single-cell atlas. Genome Biol. 2022;23(1):113. doi:10.1186/s13059-022-02677-z
15. Wu Y, Yang S, Ma J, et al. Spatiotemporal immune landscape of colorectal cancer liver metastasis at single-cell level. Cancer Discov. 2022;12(1):134–153. doi:10.1158/2159-8290.CD-21-0316
16. Valdeolivas A, Amberg B, Giroud N, et al. Charting the heterogeneity of colorectal cancer consensus molecular subtypes using spatial transcriptomics. doi:10.1101/2023.01.23.525135
17. Garbarino O, Lambroia L, Basso G, et al. Spatial resolution of cellular senescence dynamics in human colorectal liver metastasis. Aging Cell. 2023;22(7):e13853. doi:10.1111/acel.13853
18. Wang F, Long J, Li L, et al. Single-cell and spatial transcriptome analysis reveals the cellular heterogeneity of liver metastatic colorectal cancer. Sci Adv. 2023;9(24):eadf5464. doi:10.1126/sciadv.adf5464
19. Zhou H, Shen Y, Zheng G, et al. Integrating single-cell and spatial analysis reveals MUC1-mediated cellular crosstalk in mucinous colorectal adenocarcinoma. Clin Transl Med. 2024;14(5):e1701. doi:10.1002/ctm2.1701
20. Shinto E, Yoshida Y, Kajiwara Y, et al. Clinical significance of a gene signature generated from tumor budding grade in colon cancer. Ann Surg Oncol. 2020;27(10):4044–4054. doi:10.1245/s10434-020-08498-3
21. Szeglin BC, Wu C, Marco MR, et al. A SMAD4-modulated gene profile predicts disease-free survival in stage II and III colorectal cancer. Cancer Rep. 2022;5(1):e1423. doi:10.1002/cnr2.1423
22. Reinfeld BI, Madden MZ, Wolf MM, et al. Cell-programmed nutrient partitioning in the tumour microenvironment. Nature. 2021;593(7858):282–288. doi:10.1038/s41586-021-03442-1
23. Lehuédé C, Dupuy F, Rabinovitch R, Jones RG, Siegel PM. Metabolic plasticity as a determinant of tumor growth and metastasis. Cancer Res. 2016;76(18):5201–5208. doi:10.1158/0008-5472.CAN-16-0266
24. Ren Y, Kumar A, Das JK, et al. Tumorous expression of NAC1 restrains antitumor immunity through the LDHA-mediated immune evasion. J Immunother Cancer. 2022;10(9):e004856. doi:10.1136/jitc-2022-004856
25. Zhang C, Zhou L, Zhang M, et al. H3K18 lactylation potentiates immune escape of non-small cell lung cancer. Cancer Res. 2024;84(21):3589–3601. doi:10.1158/0008-5472.CAN-23-3513
26. Certo M, Tsai CH, Pucino V, Ho PC, Mauro C. Lactate modulation of immune responses in inflammatory versus tumour microenvironments. Nat Rev Immunol. 2021;21(3):151–161. doi:10.1038/s41577-020-0406-2
27. Zhou J, Gu J, Qian Q, et al. Lactate supports Treg function and immune balance via MGAT1 effects on N-glycosylation in the mitochondria. J Clin Invest. 2024;134(20):e175897. doi:10.1172/JCI175897
28. Khan F, Lin Y, Ali H, et al. Lactate dehydrogenase A regulates tumor-macrophage symbiosis to promote glioblastoma progression. Nat Commun. 2024;15(1):1987. doi:10.1038/s41467-024-46193-z
29. Liu Y, Wang F, Peng D, et al. Activation and antitumor immunity of CD8+ T cells are supported by the glucose transporter GLUT10 and disrupted by lactic acid. Sci Transl Med. 2024;16(762):eadk7399. doi:10.1126/scitranslmed.adk7399
30. She X, Wu Q, Rao Z, et al. SETDB1 methylates MCT1 promoting tumor progression by enhancing the lactate shuttle. Adv Sci. 2023;10(28):e2301871. doi:10.1002/advs.202301871
31. Gong D, Arbesfeld-Qiu JM, Perrault E, Bae JW, Hwang WL. Spatial oncology: translating contextual biology to the clinic. Cancer Cell. 2024;42(10):1653–1675. doi:10.1016/j.ccell.2024.09.001
32. Liu H, Gao J, Feng M, et al. Integrative molecular and spatial analysis reveals evolutionary dynamics and tumor-immune interplay of in situ and invasive acral melanoma. Cancer Cell. 2024;42(6):1067–1085.e11. doi:10.1016/j.ccell.2024.04.012
33. Liu C, Xie J, Lin B, et al. Pan-Cancer single-cell and spatial-resolved profiling reveals the immunosuppressive role of APOE+ macrophages in immune checkpoint inhibitor therapy. Adv Sci. 2024;11(23):e2401061. doi:10.1002/advs.202401061
34. Tang Y, Gu S, Zhu L, Wu Y, Zhang W, Zhao CLDHA. The Obstacle to T cell responses against tumor. Front Oncol. 2022;12:1036477. doi:10.3389/fonc.2022.1036477
35. Ries CH, Cannarile MA, Hoves S, et al. Targeting tumor-associated macrophages with anti-CSF-1R antibody reveals a strategy for cancer therapy. Cancer Cell. 2014;25(6):846–859. doi:10.1016/j.ccr.2014.05.016
 © 2025 The Author(s). This work is published and licensed by Dove Medical Press Limited. The
full terms of this license are available at https://www.dovepress.com/terms
and incorporate the Creative Commons Attribution
- Non Commercial (unported, 4.0) License.
By accessing the work you hereby accept the Terms. Non-commercial uses of the work are permitted
without any further permission from Dove Medical Press Limited, provided the work is properly
attributed. For permission for commercial use of this work, please see paragraphs 4.2 and 5 of our Terms.
© 2025 The Author(s). This work is published and licensed by Dove Medical Press Limited. The
full terms of this license are available at https://www.dovepress.com/terms
and incorporate the Creative Commons Attribution
- Non Commercial (unported, 4.0) License.
By accessing the work you hereby accept the Terms. Non-commercial uses of the work are permitted
without any further permission from Dove Medical Press Limited, provided the work is properly
attributed. For permission for commercial use of this work, please see paragraphs 4.2 and 5 of our Terms.
Recommended articles
Seed and Soil: Consensus Molecular Subgroups (CMS) and Tumor Microenvironment Features Between Primary Lesions and Metastases of Different Organ Sites in Colorectal Cancer
Luo Q, Quan Y, Liu W, Wu Z, Qiu W, Liang W, Yang P, Huang Q, Li G, Wei J, Wang Q, Shen F, Li W, He F, Cao J
Cancer Management and Research 2024, 16:225-243
Published Date: 20 March 2024
Integration of scRNA-Seq and Bulk RNA-Seq Identifies Circadian Rhythm Disruption-Related Genes Associated with Prognosis and Drug Resistance in Colorectal Cancer Patients
Tao Y, Li J, Pan J, Wang Q, Ke RW, Yuan D, Wu H, Cao Y, Zhao L
ImmunoTargets and Therapy 2025, 14:475-489
Published Date: 11 April 2025
Cellular Heterogeneity and IL-17 Pathway Dynamics Reveal Insights into the Transition from Ulcerative Colitis to Colorectal Cancer Through scRNA-Seq Analysis
Li Y, Sun R, Wang X, Ma M, Wang H, Yang B, Lu Y, Li Y
Journal of Inflammation Research 2025, 18:6927-6944
Published Date: 28 May 2025
Multi-Omics and Clinical Validation Identify Key Glycolysis- and Immune-Related Genes in Sepsis
Du H, Dai X, Zhang T, Zhang Z, Xu X, Liu Y, Fan Z
International Journal of General Medicine 2025, 18:5085-5103
Published Date: 3 September 2025
Kushe Tincture Ameliorates DNCB-Induced Atopic Dermatitis by Affecting NF-Kb/JAK-STAT3 Pathway: Bioinformatics Analysis and Animal Experiment Verification
Feng H, Zhou Y, Ren X, Zhu X, Duan X, Qu S, Zhu B, Li Y, Qin Y
Journal of Inflammation Research 2025, 18:15293-15308
Published Date: 4 November 2025