Back to Journals » Breast Cancer: Targets and Therapy » Volume 18
Development of a Prognostic Stratification Model and Identification of BDH1 as an Oncoprotein in Breast Cancer Based on Subcluster-Specific Markers of B-Cell Subsets
Authors Kang S, Li Z, Lv C, Zhang F
Received 12 November 2025
Accepted for publication 11 February 2026
Published 10 March 2026 Volume 2026:18 580906
DOI https://doi.org/10.2147/BCTT.S580906
Checked for plagiarism Yes
Review by Single anonymous peer review
Peer reviewer comments 2
Editor who approved publication: Professor Pranela Rameshwar
Shujuan Kang,1,2 Zhongxin Li,3 Chao Lv,4 Fenghua Zhang1,5
1Department of Surgery, Hebei Medical University, Shijiazhuang, Hebei, 050017, People’s Republic of China; 2Department of Breast Surgery, Affiliated Hospital of Hebei University of Engineering, Handan, Hebei, 056002, People’s Republic of China; 3Department of General Surgery, Handan Central Hospital, Handan, Hebei, 056002, People’s Republic of China; 4Department of Dermatology, Affiliated Hospital of Hebei Engineering University, Handan, Hebei, 056002, People’s Republic of China; 5Department of Gland Surgery, Hebei General Hospital, Shijiazhuang, Hebei, 050051, People’s Republic of China
Correspondence: Fenghua Zhang, Department of Gland Surgery, Hebei General Hospital, No. 348 Heping West Road, Xinhua District, Shijiazhuang City, Hebei Province, People’s Republic of China, Email [email protected]
Background: This study aimed to analyze the breast cancer (BC) microenvironment using single-cell RNA sequencing (scRNA-seq) data, develop a prognostic stratification model, and identify potential therapeutic targets and drugs.
Methods: scRNA-seq, bulk transcriptomic data, and clinical information were obtained from EMBL-EBI (single cell data from 17 tumor samples), TCGA (1039 tumor samples), and GEO databases [GSE20685 (324 tumor samples), GSE42568 (104 tumor samples), and GSE88770 (117 tumor samples)]. scRNA-seq data were used to analyze the tumor microenvironment landscape of BC and retrieve subcluster-specific markers (SSMs). Subtypes of BC patients were defined based on SSMs and bulk transcriptomic data, and a prognostic risk model was constructed using machine learning. The characteristic therapeutic targets of high-risk patients were further identified and potential drugs were evaluated by molecular docking and cellular thermal shift assay. In vitro and in vivo experiments were conducted to explore the functions of the core target, 3-hydroxybutyrate dehydrogenase 1 (BDH1) and tretinoin, which modulated the malignant biological behaviors of BC.
Results: A total of 2004 SSMs were identified. Six prognostic cell sub-clusters were identified, and 16 prognostic genes were identified from the SSMs of these six cell sub-clusters. Least absolute shrinkage and selection operator (LASSO)-Cox algorithm further identified four core genes, and a risk model was constructed. The overall survival time of BC patients in the high-risk group was shorter than that of the low-risk group, and the risk score was a predictor of prognosis in BC patients in both training dataset and validation datasets (P< 0.0001 in all datasets). Six potential drug targets were identified in high-risk patients, five of which were significantly highly expressed in BC, and BDH1 was associated with the overall survival of BC patients. Tretinoin showed good binding activity for all five targets. Depletion of BDH1 or tretinoin inhibits the malignant biological behaviors of BC cells in vitro, and tretinoin suppressed the malignant biological behaviors of BC cells in vitro and in vivo, and reversed by BDH1 overexpression.
Conclusion: The prognostic stratification model is promising for evaluating the clinical outcomes of BC patients, and BDH1 is an important drug target for high-risk patients, and tretinoin represses the malignancy of BC cells via targeting BDH1.
Keywords: breast cancer, single-cell RNA sequencing, machine learning, tumor microenvironment, therapeutic targets
Introduction
Breast cancer (BC) has 2.33 million new confirmed cases each year and approximately 660,000 deaths annually, accounting for nearly 6.9% of cancer deaths.1–3 The incidence and mortality rates of BC in China are on the rise.1 In 2022 alone, there were approximately 357,200 new female BC cases and 75,000 deaths in China, accounting for approximately 15.59% and 7.94% of all BC cases, respectively.4 Although various strategies have been adopted for the clinical treatment of BC in recent years, owing to recurrence, metastasis, and treatment resistance, some patients still have poor clinical outcomes.5 This is mainly attributed to the heterogeneity of BC.
The tumor microenvironment (TME) is a complex, dynamic, and multifaceted system in which tumor cells rely on. It is composed of tumor cells, various surrounding cells, extracellular matrix components, signaling molecules, and structures such as blood vessels.6 TME heterogeneity may be the main reason for differences in prognosis and treatment response among patients.7 The TME contains a variety of stromal cells such as fibroblasts, mesenchymal cells, adipocytes, and immune cells. The interactions among these cells significantly affect the carcinogenic process, tumor progression, and treatment response of BC.8 Developing a reliable classification system in the context of TME heterogeneity is conducive to stratifying patients with BC and provides forward-looking guidance for individualized treatment and precision medicine.
Importantly, anti-tumor activity of B cells in BC are poorly understood. A previous study has reported that in peripheral blood of BC patients, the proportion of total B cells was increased compared with the healthy controls.9 A recent study has reported that based on B-cell-specific gene set, the two groups of estrogen receptor-positive BC patients have distinct prognosis, suggesting B-cell-mediated immunity is crucial in BC progression.10 However this study is performed based on “bulk transcriptomics data”. Single-cell RNA sequencing (scRNA-seq) offers a new perspective for revealing the composition of tumor cells and is conducive to identifying the cell types in tumors and providing novel marker of immune cell subtypes, which makes the subtyping more precise and comprehensive.11–13 For example, with scRNA-seq analysis, it is reported that in colorectal cancer, leucine-tRNA-synthase-2-expressing B cells facilitates the immune escape of cancer cells.14 However, the role of B cell subtype in BC patients stratification is rarely reported.
3-hydroxybutyrate dehydrogenase 1 (BDH1) is a key enzyme in ketone body metabolism. It catalyzes the reversible conversion between β -hydroxybutyric acid and acetoacetic acid, thereby efficiently regulating the utilization of ketone bodies as an alternative energy source on a ketogenic diet, or under energy stress.15 In addition, BDH1 exerts a protective effect on cells by influencing the NAD+/NADH ratio and mitochondrial function, participating in the regulation of REDOX balance, autophagy and resistance to oxidative stress.16 Recent studies have found that abnormal function of BDH1 is closely related to various diseases including cancer. Its role in different human malignancies is distinct. It promotes disease progression in pancreatic cancer, lung cancer; while it functions as a tumor suppressor in acute myeloid leukemia.17–19 The role of BDH1 in BC still remains unclear.
The present study describes the TME landscape of BC using scRNA-seq data and screened subcluster-specific markers (SSMs). Using SSMs, unsupervised clustering analysis and risk models construction by machine learning were performed based on BC patients in The Cancer Genome Atlas (TCGA). Patients with different risk scores demonstrate different clinical outcomes, immune cell infiltration, and immunotherapy responses. Additionally, analysis of available drug targets was conducted for patients in the high-risk group, and the biological functions of the key target, 3-hydroxybutyrate dehydrogenase 1 (BDH1), and the suitable drug tretinoin on BC cells were explored.
Methods and Materials
“Omics” Data Collection and Processing
In this study, scRNA-seq data for BC (17 samples) [Platform: Illumina NovaSeq 6000 (Homo sapiens)] were obtained from the EMBL-EBI database (https://www.ebi.ac.uk/biostudies/arrayexpress), which included 17 tumor samples. Data were read and processed using the R package Seurat (version 5.1.0). Low-quality cells were excluded using standards “nFeature RNA ≤ 200” and “nFeature RNA > =7000”. At the same time, the cells with mitochondrial gene percentages exceeding 10% were excluded based on the PercentageFeatureSet (sce, pattern =“^MT-”) function. After reading the data with Seurat, the NormalizeData function was used to standardize the gene expression of the cells and the FindVariableFeatures function was used to identify the top 3000 highly variable genes. Subsequently, RunPCA() was used to conduct principal component analysis to construct a linear dimensionality reduction space. ElbowPlot() or JackStrawPlot() was used to determine the number of principal components that should be selected. Subsequently, Considering the possibility of batch effects between different samples, RunHarmony() was used to remove batch effects. Subsequently, similar cells were divided into different clusters using FindNeighbors() and FindClusters() (resolution, 0.5). The resolution parameter determined the granularity of the clusters; the larger the value, the greater the number of clusters. After obtaining multiple cell clusters, the R package SingleR (version 2.4.1) combined with Celldex HumanPrimaryCellAtlasData reference datasets was used to perform cell type annotation. In this study, the maximum number of active principal component was set to 30 (maximum). Next, an unsupervised clustering method based on k-nearest neighbor (KNN) graphs was adopted, and 30 principal components were used to cluster the main cell types. Considering that the presence of doublets may affect the accuracy and reliability of downstream analysis results, DoubleFinder was used to identify and eliminate doublets (Supplementary Figure 1). Visualization was performed using Uniform Manifold Approximation and Projection (UMAP) and T-distributed Random Neighborhood Embedding (t-SNE). For the reclustering analysis, based on the annotation results of single cells, single-cell data of B cells, T cells, monocytes, and epithelial cells were first extracted. Single-cell data from these cells were processed according to the above processes. The FindAllMarkers function and Wilcoxon test were used to identify differentially upregulated genes with a threshold of log2fold change (FC)>0.25 and an adjusted P value <0.05. Each cell subcluster was defined based on marker genes.
From The Cancer Genome Atlas database (TCGA, https://portal.gdc.cancer.gov/), the BC cohort data [RNA-Seq, count data, gene copy number variations (CNV), and clinical data] were downloaded from The Cancer Genome Atlas database (TCGA, https://portal.gdc.cancer.gov/). A total of 1091 tumor samples and 113 adjacent control samples were obtained. As the subsequent analysis needed to be combined with the prognostic information of the samples, the tumor samples were filtered to remove those with an overall survival time of less than 30 days or missing survival information. Eventually, 1039 tumor samples were retained, and this dataset was used as the training set. From Gene Expression Omnibus (GEO) database (https://www.ncbi.nlm.nih.gov/geo/). Three BC datasets (GSE20685, GSE42568, and GSE88770) were downloaded from the Gene Expression Omnibus database (https://www.ncbi.nlm.nih.gov/geo/). Among them, GSE20685 contained 327 tumor samples, GSE42568 contained 121 samples, including 17 control samples and 104 tumor samples, and GSE88770 contained 117 tumor samples. These three datasets served as validation datasets.
Analysis of CNV of Epithelial Cell
This study employed the R package inferCNV to infer CNVs in tumor cells at the single-cell level. The original count expression data from tumor epithelial cells were used as the input inference matrix. The clusters annotated as “B cells” were used as the input reference matrix. The cutoff value was set to “0.1” and the denoising option and hidden markov model (HMM) function were set to “TRUE”. Finally, an inferCNV heat map was drawn. We inferred copy number variation (CNV) of tumor cells and divided tumor cells into 8 subclusters (CNV_1–8) based on their CNV profiles.
Identification of SSMs of the Cells
To determine the SSMs of each cell subcluster, the initially Wilcoxon test was used, using the FindAllMarkers function, with a threshold of log2FC > 0.25 and an adjusted P value <0.05, to obtain the differentially upregulated genes. Subsequently, the SSMs were screened according to previous screening criteria.20
Consensus Clustering of Transcriptome Data in TCGA Based on SSMs
Based on the SSM of all subcluster cells, gene set variation analysis (GSVA) algorithm was used to score and quantify 1039 tumor samples in the training set, thereby obtaining the scores of all subcluster cells of each sample. Preliminary analysis was conducted using a univariate Cox proportional hazards regression model. Regression analysis was conducted with survival time as the dependent variable and the GSVA score as the independent variable to evaluate the relationship between cell subclusters and the prognosis of BC patients. Based on the expression levels of SSMs significantly related to prognosis, consensus clustering was performed on the samples using the R package ConsensusClusterPlus (version 1.66.0).
Risk Model Construction
Univariate Cox regression analysis was used to screen for SSMs associated with BC prognosis. Based on the expression of these genes and prognostic information of the samples, a LASSO-Cox regression model was constructed. Feature extraction was performed using LASSO regression to obtain key genes and construct a multivariate COX regression model. The risk scores of the samples were calculated for the training and validation datasets, including GSE20685, GSE42568, and GSE88770. The tumor samples were grouped into high- and low-risk groups based on the risk score, and ROC and Kaplan-Meier survival curves were plotted. To further explore the potential clinical prognostic value of risk scores, the clinical information of samples from TCGA and the validation set data was integrated. Subsequently, a univariate COX regression analysis was conducted on all clinical factors and sample risk scores to determine whether the risk score was significantly correlated with prognosis.
Immune Cell Infiltration and Cancer Immune Cycle Analyses
Based on the gene set of 28 immune cell types,21 a single-sample gene set enrichment analysis (ssGSEA) was used to score the 28 immune cells in each sample. The Tracking Tumor Immunophenotype (TIP) tool was used to score the cancer immune cycle (CIC) of all samples in the training set, and the relationship between the high- and low-risk groups and each step of the CIC was analyzed. In addition, the associations between the high- and low-risk groups and immunomodulator genes, such as antigen presentation (14), cell adhesion (3), co-inhibitors (8), co-stimulants (3), ligands (22), receptors (19), and others (6), were evaluated, and heat maps were drawn.
Pathway Analysis
Hallmark pathway gene sets were downloaded from the MSigDB database (https://www.gsea-msigdb.org/gsea/msigdb/index.jsp), and then based on the gene set, the scores of the tumor samples were quantified using GSVA, and Spearman correlation analysis was conducted on the Hallmark score and the risk model score. Pathway RespOnsive GENes for Activity Inference (PROGENy) is a toolkit developed based on the R language, which is mainly used to evaluate the activity of a certain pathway from transcriptome data (https://saezlab.github.io/progeny/). The R package PROGENy was used to evaluate the activity of signaling pathways in the tumor samples.
Drug Sensitivity Analysis
From the Genomics of Drug Sensitivity in Cancer database (GDSC, https://www.cancerrxgene.org/), Two drug sensitivity datasets, CTRPv2 the Cancer Therapeutics Response Portal, version 2) and CGP2016 (Cancer Genome Project 2016) were downloaded from the Genomics of Drug Sensitivity in Cancer database (GDSC, https://www.cancerrxgene.org/). The median inhibitory concentration (IC50) of the drugs was quantified using the R packages pRRophetic and oncoPredict, and the Wilcoxon test was used to compare differences in drug sensitivity among the different risk score groups. Subsequently, Spearman correlation analysis was conducted on the risk model scores and quantitative scores of the samples’ responses to all drug treatments to screen out drugs that were significantly negatively correlated with the risk scores (Spearman correlation coefficient < -0.4 and P < 0.05).
Screening of Therapeutic Targets
The computational evaluation of the RNAi and essentiality score (CERES) scoring matrix of the BC cell line was obtained from The Cancer Dependency Map database (DepMap, https://depmap.org/portal/download/all/). The risk score of the BC cell lines and the Spearman correlation between the risk model score and CERES score were evaluated. A total of 2249 drugable targets were integrated from the Drug-Gene Interaction Database (DGIdb, https://dgidb.org/) and the literature,22 and Spearman correlations between these drugable targets and risk model scores were calculated.
Molecular Docking
The NetworkAnalyst database (https://www.networkanalyst.ca/) was used to analyze available targeted and small-molecule drugs. The PubChem database (https://pubchem.ncbi.nlm.nih.gov/) was used to download the SDF files of small molecules. The 3D protein structures of the targets were obtained from UniProt database (https://www.uniprot.org/). Small molecules and proteins were processed using the AutoDock tool (version 1.5.6), including dewatering and hydrogenation, and exported as PDBQT files. The PDBQT files of the ligand and receptor were processed in AutoDock (version 1.5.6) to construct the docking box and saved as a config.txt file. Molecular docking was performed using AutoDock Vina software, and docking affinity was calculated. Finally, the complexes and binding modes were visualized using the PyMOL software.
Cell Culture
Human immortalized mammary gland cell lines MCF-10A (CRL-10317) and BC cell lines BT-474 (HTB-20), MCF-7 (HTB-22), MDA-MB-231 (HTB-26), BT-549 (HTB-122), T-47D (HTB-133), and HCC1806 (CRL-2335) (ATCC, Rockville, MD, USA) were cultured in Dulbecco’s modified Eagle’s medium (DMEM, Gibco, Grand Island, NY, USA) with 10% fetal bovine serum (FBS; Thermo Fisher Scientific, MA, USA) in a cell incubator at 37 °C with 5% CO2. Small interfering RNA (siRNAs) including si-NC, si-BDH1-1 (5′-CACTATTGCTTGGTTCTACTTCC-3′), si-BDH1-2 (5′-CGGCAAGAAGTACTTTGATGAAA-3′), control plasmid (Lv-NC), and BDH1 overexpression plasmid (Lv-BDH1) were designed by GenePharma (Shanghai, China). Transfection was performed using Lipofectamine®3000 (Invitrogen, Carlsbad, CA, USA), according to the manufacturer’s instructions. The expression of BDH1 was detected using quantitative reverse transcriptase-polymerase chain reaction (qRT-PCR) 24 h after transfection.
Cellular Thermal Shift Assay (CETSA)
MCF-7 and MDA-MB-231 were treated with or without Tretinoin for 24 h in a 37 °C constant temperature incubator. Then the cells were collected and digested with trypsin for 2 min at 37 °C, and then resuspended using PBS containing protease inhibitor phenylmethanesulfonyl fluoride. The supernatant was evenly divided into different polymerase chain reaction (PCR) tubes and heated in a gradient of 37–72 °C for three min, followed by cooling for an additional 3 min at room temperature. For protein extraction, the cells were subjected to three cycles of freezing and thawing, alternating between liquid nitrogen and room temperature. The lysates were prepared for Western blot.
Cell Viability Assessment
The cell density was adjusted to 2×10⁴ cells/mL and 100 μL of the cell suspension was added to each well of a 96-well plate. After 24 h, cells were exposed to different concentrations of tretinoin (0, 1, 10, 20, 40, 60, 80, and 100 μM). The 96-well plates were placed in a cell incubator and the cells were cultured for 24, 48, 36, or 72 h. After adding 10 μL of cell counting kit-8 (CCK-8) (Beyotime, Shanghai, China) to each well, cells were cultured for 2 h. Finally, absorbance was measured at 450 nm using a spectrophotometer (Bio-Rad, CA, USA).
Flow Cytometry
BC cell apoptosis was detected using an Annexin V-FITC/PI Apoptosis Detection Kit (Yeasen Biotech, Shanghai, China). BC cells were resuspended in binding buffer and the cell density was adjusted to 1×10⁶ cells/mL. Next, 100 μL of the cell suspension was added with 5 μL of Annexin V-FITC and 10 μL of propidium iodide (PI) and incubated in the dark at room temperature for 15 min. Next, the total volume of the mixture was made up to 500 μL, and the apoptosis level of the cells was detected using a flow cytometer (BD Biosciences, San Jose, CA, USA) within 1 h.
qRT-PCR
Total RNA was extracted from the cells using TRIzol reagent (Invitrogen, Carlsbad, CA, USA). RNA was reverse-transcribed into cDNA using a PrimeScript RT Kit (Takara, Dalian, China). qRT-PCR was performed using an AceQ Universal SYBR qPCR Master Mix kit (Vazyme, Nanjing, China). Glyceraldehyde-3-phosphate dehydrogenase (GAPDH) was used as the internal reference. The primer sequences were as follows: BDH1 primer: forward primer, 5’-ACTGGTACCTCTGCATGTCC-3’ and reverse primer, 5’-CTCCATACAGCCAGCTCTGA-3’; GAPDH primer: forward primer, 5’-TGCACCACCAACTGCTTAGC-3’ and reverse primer, 5’-GGCATGGACTGTGGTCATGAG-3.’
Western Blot
Equal amounts of protein samples from each group were separated by sodium dodecyl sulfate-polyacrylamide gel electrophoresis and transferred onto polyvinylidene difluoride membranes (Beyotime, Shanghai, China). After blocking with 5% non-fat milk, the membranes were incubated with the primary and secondary antibodies in turn. Finally, the immunoblots were visualized using enhanced chemiluminescence solution (Beyotime, Shanghai, China). Gray-scale analysis of the images was conducted using the ImageJ software (National Institutes of Health, Bethesda, MD, USA). The ratio of the gray value of the target protein to that of GAPDH was used as the relative expression level of the protein. The antibodies included anti-N-cadherin (1:500, ab76011, Abcam, Shanghai, China), anti-vimentin (1:500, ab16700, Abcam, Shanghai, China), anti-E-cadherin (1:500, ab40772, Abcam, Shanghai, China), and a secondary antibody (1:2000, ab7090, Abcam, Shanghai, China).
Xenograft Tumor Model
The procedures of the animal experiments in the present study was approved by the Medical Ethics Committee of Affiliated Hospital of Hebei Engineering University (Approval No. 2026–001), and performed according to the guidelines of Animal Research: Reporting of in vivo Experiments 2.0. Nude mice (BALB./c, 4 weeks old, female) were housed in SPF conditions. The mice were divided randomly into 4 groups: the control group, tretinoin group, tretinoin + Lv-NC group, tretinoin + Lv-BDH1 group (n = 3 in each group). 2×10⁶ MCF-7 cells were injected subcutaneously into the left flank of the mice. When tumor volumes were bigger than 100 mm3 (Tumor volume = length × width2 × 0.5), mice were randomized into control or treatment groups (n = 5 mice) which received either vehicle or 10 mg/kg Tretinoin via intraperitoneal injection daily for 21 days. Tumor volumes and body weights were measured daily. The mice were sacrificed at the end of treatment, tumors were removed, weighted, photographed. The euthanasia of animals was performed through carbon dioxide asphyxiation. Prior to placing the animals in the CO2 chamber (with a CO2 flow rate of 50% of the chamber’s volume per min), an inhalation anesthetic (isoflurane concentration: 3%; air flow: 1 L/min; maintained for 3 minutes) was initially employed to render them unconscious.
Statistical Analysis
All experimental data are presented as mean ± standard deviation (SD). Statistical analyses were performed using the R software (version 4.3.3) and GraphPad Prism 8 (GraphPad Prism, Inc., La Jolla, CA, USA). The ROUT method with a Q value of 1% was employed to identify potential outliers. In the case of comparisons between two groups, the Student’s t-test was utilized when the data adhered to the normal distribution and the homogeneity of variance; otherwise, the Mann–Whitney U-test was applied. For multiple group comparisons, one-way ANOVA followed by Tukey’s post-hoc test was used when the data satisfied the assumptions of normality and equal variance. If these assumptions were not met, the Kruskal–Wallis test with Dunn’s post-hoc test was implemented. Normality was evaluated using the Shapiro–Wilk test, and variance homogeneity was examined via Levene’s test. The Benjamini-Hochberg method was adopted for false discovery rate (FDR) correction to control for multiple comparisons. Statistical significance was set at P <0.05.
Results
Analysis of the TME of BC Based on scRNA-Seq Data
The scRNA-seq data for BC were obtained from the EMBL-EBI database, and 24 clusters were obtained. Subsequently, SingleR was used for cell annotation, and ten cell types were obtained (Figure 1A and B, Supplementary Figure 2A-B). Next, the data for B cells, T cells, monocytes, and epithelial cells were reanalyzed, and 35 subgroups of cells were obtained in the TME of BC (Figure 1C and Supplementary Figure 2C). The expression of marker genes showed significant differences among the different subsets of B cells, T cells, monocytes, and epithelial cells (Figure 1D). CNV analysis showed that compared with B cells, epithelial cell subsets had amplified and deleted on multiple chromosomes. For example, epithelial cell CVN_1 had deletions on chromosomes 4q and 8q, while chromosome 2q was amplified (Figure 1E).
 |
Figure 1 Tumor microenvironment analysis of BC based on scRNA-seq. (A) t-SNE visualization of 24 major cell clusters. (B) t-SNE visualization of 10 major cell types of cells. (C) t-SNE visualization of 40 cell subclusters. (D) The heat map of the expression of marker genes in each cell subpopulation. (E) inferCNV heatmap of the analysis results of CNV mutations in epithelial cells. Abbreviations: BC, breast cancer; scRNA-seq, single-cell RNA-sequencing; t-SNE, t-Distributed Stochastic Neighbor Embedding; CNV, copy number variation. |
Identification of BC Prognosis-Related Clusters Based on the SSMs of B-Cell Subsets
A total of 2004 SSMs were identified (Supplementary Table 1). GSVA was used to score and quantify the enrichment of different cell subsets in 1039 tumor samples in the training set (TCGA cohort). A univariate Cox regression model was used to screen the cell subsets related to prognosis; interestingly, six B cell subsets were significantly correlated with patient prognosis (Figure 2A). The SSMs of these six subsets were extracted, 53 of which were SSM-encoding proteins (Supplementary Box S1). Based on the expression of these 53 SSMs, consensus clustering analysis was conducted in the training set, and two clusters were obtained (Figure 2B). The survival time of patients in cluster 1 was longer than that of patients in cluster 2 (Figure 2C). Similar results were obtained in the validation sets GSE88770 and GSE20685 (Figure 2D and E), indicating that this clustering had a good predictive effect on patient prognosis.
 |
Figure 2 Identification of prognosis-related clusters based on cell subclusters. (A) Univariate Cox proportional hazards ratio model was used to analyze the relationship between cell subclusters and BC patients’ prognosis. (B and C) The optimal number of clusters was determined using CDF and the area under the CDF curve as two. (D) The distribution of different clusters with the index k = 2. (E) Kaplan-Meier survival analysis showed the significantly different survival rates between two subtypes of the patients in training cohort, GSE88770 cohort and GSE20685 cohort. Abbreviation: CDF, cumulative distribution function. |
Risk Models Construction Based on Machine Learning
From the 53 SSMs, 16 prognostic genes were identified based on the univariate Cox regression analysis (Figure 3A). Subsequently, 16 genes from the training set were used for LASSO regression with 10-fold cross-validation. The λ value (lambda.min) corresponding to the minimum partial likelihood deviance during the cross-validation process was selected to build the LASSO regression model. The family of the model was set as cox. The final model excluded the features with a coefficient of 0 and retained 4 key features (IGJ, CD79A, MS4A1, HLA-DOB) (Figure 3B and C, Supplementary Tables 2 and 3, Supplementary Figure 3). A multivariate Cox regression model was constructed using these four genes (Table 1). The risk scores of the samples were calculated based on the risk model, and the samples were divided into high-risk and low-risk groups, with the median risk score as the threshold value. In the training and validation sets, the survival time of the patients in the high-risk group was significantly lower than that in the low-risk group (Figure 3D). The ROC curve showed that in the training set and GSE20685, this model had good predictive performance for the 1 -, 3 -, and 5-year survival periods of patients (AUC>0.6). In all training and validation sets, this model demonstrated good predictive performance for the 3-year and 5-year survival rates of the patients (AUC>0.6) (Figure 3E). Additionally, univariate COX regression analysis showed that the risk score was a prognostic factor in all training and validation sets (Figure 3F).
 |
Table 1 The Genes in LASSO-COX Regression Model |
 |
Figure 3 The risk model constructed by machine learning. (A) The forest plot of univariate Cox regression for 16 prognostic genes in the training cohort. (B and C) The four key genes were identified using LASSO. (D) Kaplan-Meier survival analysis of different risk groups in the training set and three validation sets. (E) Time-dependent ROC curves for different risk groups in the training set and three validation sets. (F) The forest plot shows the results of univariate Cox regression analysis of risk scores and clinical features in the training set and three validation sets. Abbreviations: LASSO, least absolute shrinkage and selection operator; ROC, receiver operator characteristic. |
Immune Microenvironment Analysis for Risk Grouping
The infiltration levels of 28 immune cells in each sample of the training set were calculated using the ssGSEA algorithm. Except for central memory CD8 + T cells, the infiltration levels of all immune cells in the high-risk group were significantly lower than those in the low-risk group (Figure 4A). CIBERSORT-ABS deconvolution algorithm for immune infiltration analysis was also conducted, and the results also showed that various immune cells were significantly lower in the high-risk group compared to the low-risk group (Supplementary Figure 4). The results of the cancer immune cycle score analysis showed that the activity of all steps in the high-risk group was significantly lower than that in the low-risk group (Figure 4B). In addition, the expression analysis results of immunomodulators showed that the expression of most immunomodulators in the high-risk group was significantly lower than that in the low-risk group (Figure 4C). Subsequently, the correlation between risk scores, hallmark pathways, and PROGENy pathways was analyzed. The activities of NF-κB, TNF-α, and TRAIL in the PROGENy pathways were significantly negatively correlated with the risk score (r < -0.4, P < 0.05), and VEGF was significantly positively correlated with the risk score (r>0.4, P < 0.05) (Figure 4D). Allograft rejection, complement, IL2-STAT5 signaling, IL6-JAK-STAT3 signaling, inflammatory response, interferon gamma response, KEAS signaling upregulation, and TNFα signaling via NF-κB in the Hallmark pathways were significantly negatively correlated with risk score (Figure 4D).
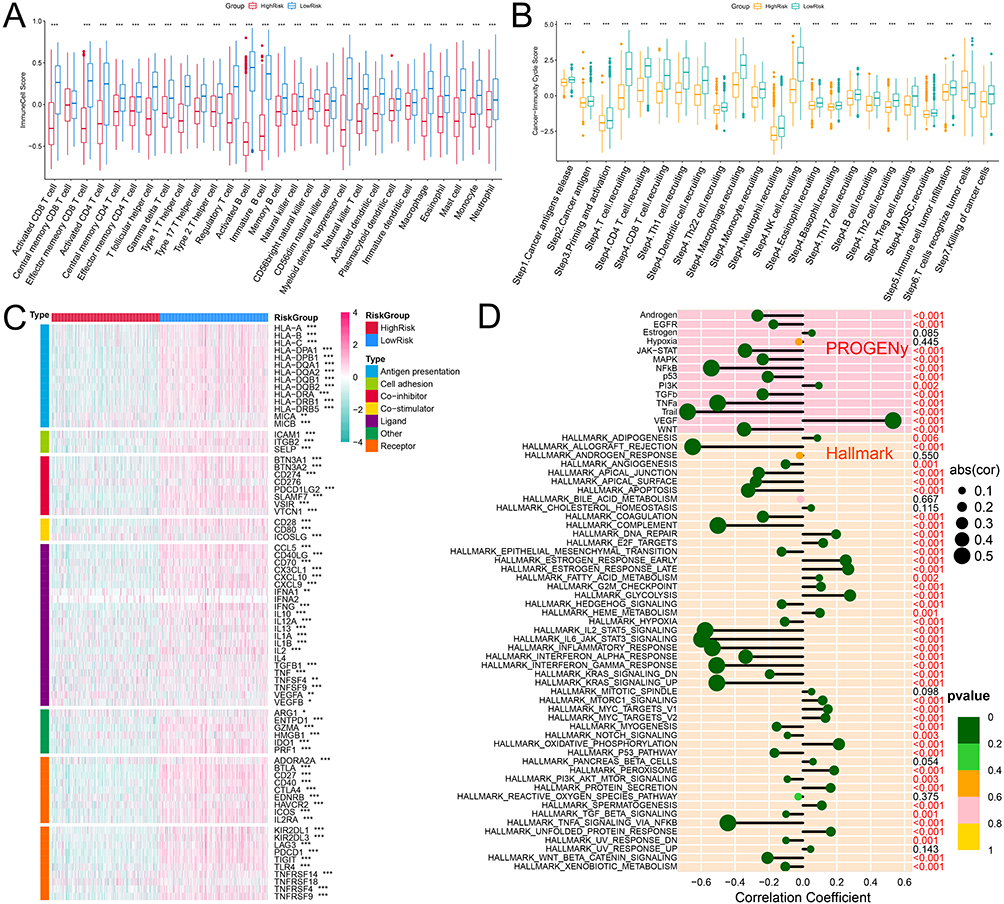 |
Figure 4 Analysis of immune cell infiltration in high-risk and low-risk groups. (A) The box plot shows the differences in immune cell scores calculated with ssGSEA between the high-risk and low-risk groups. (B) The box plot shows the differences in immune cycle scores between the high-risk and low-risk groups. (C) The heat map show the expression profiles of immunomodulator in each sample. (D) The bar chart shows the correlation between the risk score and the activity of Hallmark and PROGENy pathways. *P<0.05, **P<0.01 and ***P<0.001. Abbreviation: ssGSEA, single sample gene set enrichment analysis. |
Analysis of Drug Sensitivity and Screening of Potential Drug Targets
Eight CTRP-derived compounds and three CGP2016-derived compounds were identified (Spearman r < -0.4 and P < 0.05). The IC50 values of all compounds in the high-risk group were lower than those in the low-risk group (Figure 5A and B). Next, we screened potential druggable targets related to risk scores. Correlation analysis between the expression level of drugable targets in the Drug-Gene Interaction Database and the risk score was conducted in the training set, and 242 candidate drugable targets were identified; based on the correlation analysis between CERES score and risk score, 475 drugable targets were screened (Figure 5C and D). Six common genes were located at the intersection: BDH1, cyclin-dependent kinase 5 (CDK5), histone deacetylase 11 (HDAC11), NADH: ubiquinone oxidoreductase core subunit S8 (NDUFS8), progesterone receptor (PGR), and solute carrier family 2 member 1 (SLC2A1) (Figure 5C and D). The expression levels of these six genes were significantly positively correlated with the risk score (Figure 5E), whereas the CERES score was significantly negatively correlated with the risk score (Figure 5F). The PPI network and biological functions of these six targets and their interacting proteins were analyzed using the GeneMANIA database, and the results showed that they were mainly involved in regulating the preribosome and RNA polymerase II transcription cofactor-binding processes (Figure 5G).
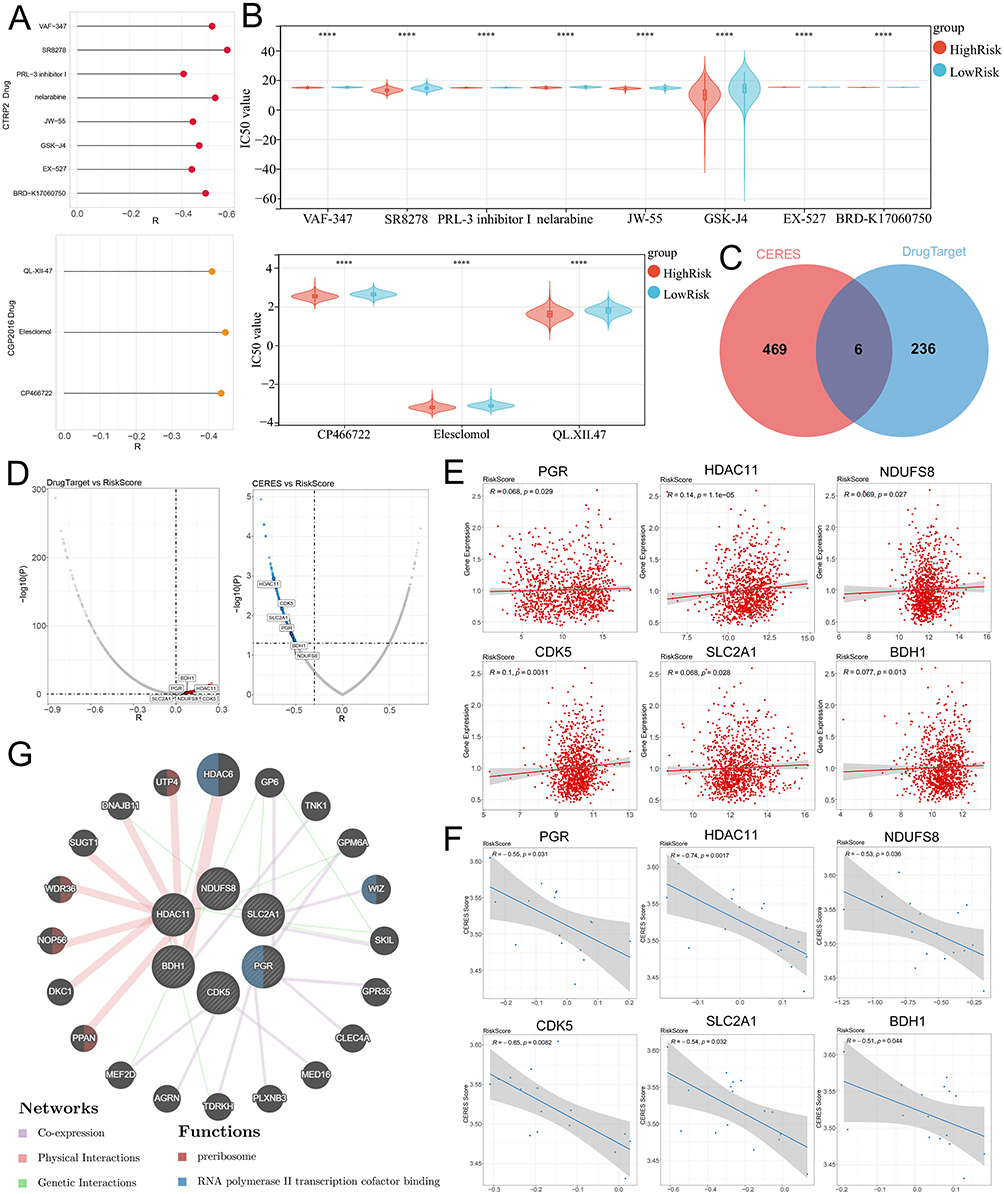 |
Figure 5 Screening of drug targets based on risk grouping. (A) Screen potential drugs that are significantly negatively correlated with the risk score based on the CTRP2 (top) and CGP2016 (bottom) databases. (B) The violin plot shows the differences in IC50 values of potential drugs in the high and low-risk groups in the CTRP2 (top) and CGP2016 (bottom) databases. (C) The Venn diagram shows the common potential drug targets screened based on the expression of drugable targets and the CERES score. (D) The volcano plot shows the Spearman correlation between drug targets (left) and CERES scores (right) and risk scores. (E) The scatter plot shows the correlation between the expression of potential drug targets and the risk score. (F) The scatter plot shows the correlation between CERES scores and risk scores. (G) The GeneMANIA database was applied to analyze the PPI networks and biological functions among six drug targets and their interacting proteins. ****P< 0.0001. Abbreviations: CTRP, The Cancer Therapeutics Response Portal; CGP, Cancer Genome Project. CERES, computational evaluation of the RNAi and essentiality score. |
Expression Characteristics of Drug Targets and Analysis of Potential Small Molecule Drugs
The expression and prognostic value of the six targets were further analyzed using the GEPIA database, and the results showed that, except for PGR, the other five genes were significantly upregulated in BC tumor tissues (Figure 6A-F). Among these, only the expression of BDH1 was significantly correlated with patient survival time (Figure 6A). Five potential drugs targeting the significantly highly expressed genes were analyzed using the NetworkAnalyst database. Among these, tretinoin (D014212) and valproic acid (D014635) targeted four targets (Figure 6G). Molecular docking further verified the relationship between the drug and the target. The results showed that tretinoin had good binding activity (affinity < -5 kcal/mol) with all five targets (Table 2 and Figure 6H). CETSA assay results show that, compared with DMSO, tretinoin stabilized BHD1 at higher temperatures in both MCF-7 cells and MDA-MB-231 cells, suggesting the direct binding between BDH1 and tretinoin (Figure 7).
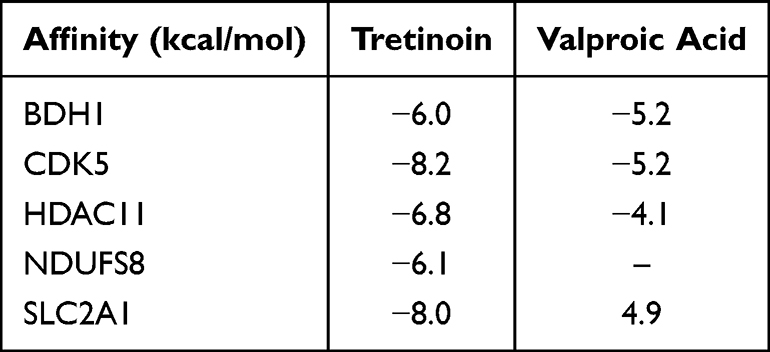 |
Table 2 Binding Affinity Between the Five Targets and Tretinoin or Valproic Acid |
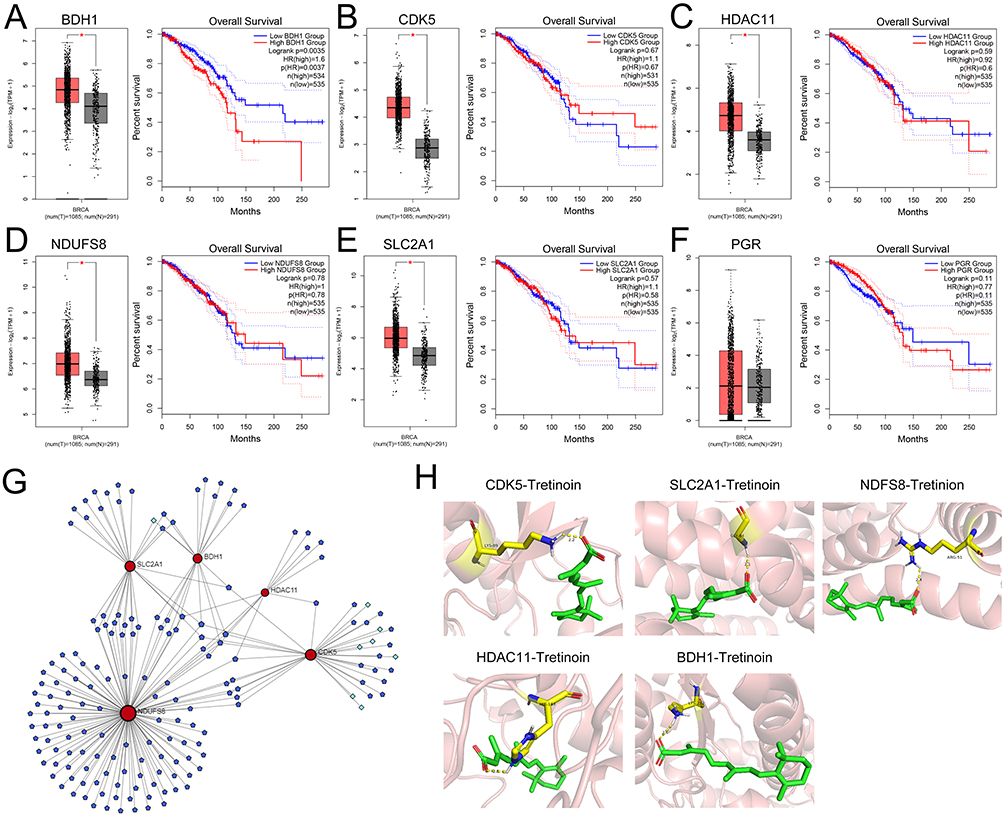 |
Figure 6 Expression of drug targets and analysis of potential drugs. (A–F) The GEPIA database was applied to analyze the expression of six targets in BC and their relationship with the prognosis of BC patients. (G) Network diagrams of five highly expressed genes and targeted drugs and small molecule drugs. Dark blue nodes represent small molecule drugs, light blue nodes represent drugs, and red nodes represent targets. (H) Molecular docking model diagrams of tretinoin with the five drug targets. *P< 0.05. Abbreviations: GEPIA, Gene Expression Profiling Interactive Analysis. BC, breast cancer. |
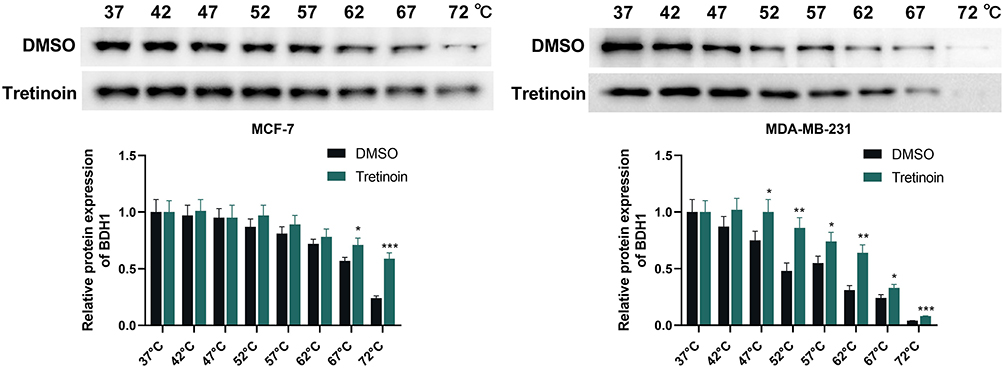 |
Figure 7 CETSA shows the direct binding between tretinoin and BDH1. CETSA analysis of intracellular target engagement between tretinoin and BDH1. *P < 0.05, **P < 0.01 and ***P < 0.001 vs DMSO group. Abbreviations: CETSA, cellular thermal shift assay; BDH1, 3-hydroxybutyrate dehydrogenase 1. |
BDH1 is Highly Expressed in BC and Promotes Malignant Behaviors of BC Cells
BDH1 was widely expressed/detectable in different cell types, but especially notable in B cells in BC tumor samples (Supplementary Figure 5A), and notably, its expression was negatively correlated with all of the seven B cell subsets (Supplementary Figure 5B), suggesting its high expression contributes to the inhibition of B cell infiltration in TME. The Human Protein Atlas database revealed that BDH1 was highly expressed in both duct carcinoma and lobular carcinoma (Figure 8A), and the overall survival time of patients with high expression of BDH1 was consistently shorter than that of patients with low expression (Figure 8B). Data from the UALCAN database also showed that BDH1 expression in BC tissues was significantly higher than that in the normal control group (Figure 8C). Compared to human immortalized mammary gland cells MCF-10A, BDH1 was highly expressed in BC cell lines, with the highest expression observed in MCF-7 and MDA-MB-231 cell lines (Figure 8D). Therefore, subsequent experiments were conducted using these two cell lines. To explore the function of BDH1 in BC, BDH1 knockdown cell lines were constructed. Compared with the negative control (si-NC), the expression of BDH1 in the knockdown cell lines was significantly inhibited (Figure 9A). Compared to the control cell line, after BDH1 knockdown, the viability of BC cells was significantly reduced (Figure 9B) and the level of apoptosis was significantly increased (Figure 9C). Western blotting was used to detect the expression of epithelial-mesenchymal transition (EMT)-related proteins. The results showed that in the cell lines with BDH1 knockdown, the expression of N-cadherin and Vimentin was significantly lower than that in the control group, and the expression of E-cadherin was significantly higher than that in the control group (Figure 9D).
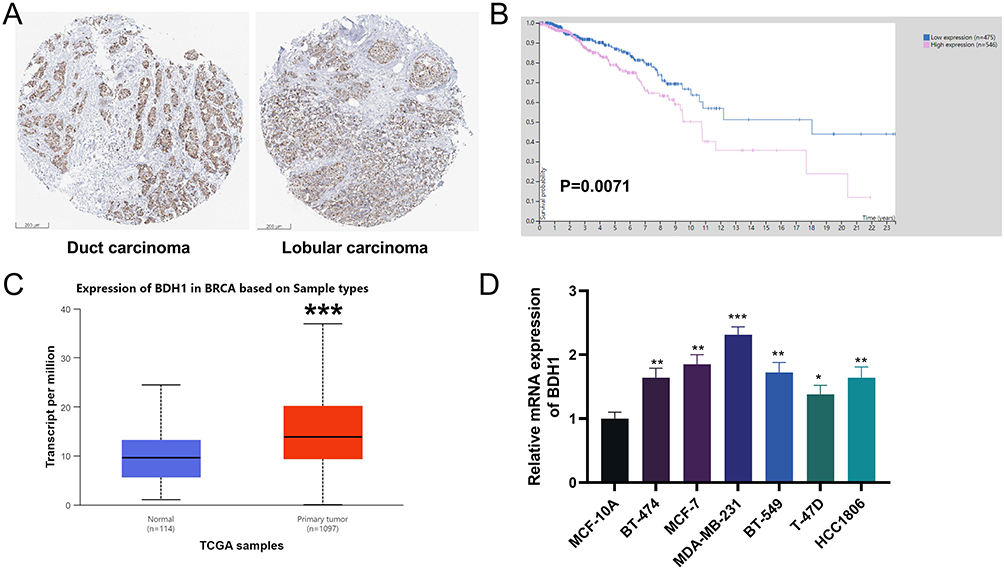 |
Figure 8 BDH1 is highly expressed in BC. (A) Immunohistochemistry of BDH1 in duct carcinoma and lobular carcinoma in HPA database. (B) Kaplan-Meier survival analysis showed the relationship between BDH1 expression and BC patients’ survival in the HPA database. (C) BDH1 is highly expressed in BC in the UALCAN database. (D) qRT-PCR was used to detect the mRNA expression levels of BDH1 in human mammary gland cell lines MCF-10A and BC cell lines (BT-474, MCF-7, MDA-MB-231, BT-549, T-47D and HCC1806). *P<0.05, **P<0.01 and ***P<0.001 vs MCF-10A cells. Abbreviations: BDH1, 3-hydroxybutyrate dehydrogenase 1; BC, breast cancer; HPA, Human Protein Atlas; qRT-PCR, quantitative reverse transcriptase-polymerase chain reaction; UALCAN, University of Alabama at Birmingham Cancer Data Analysis Portal. |
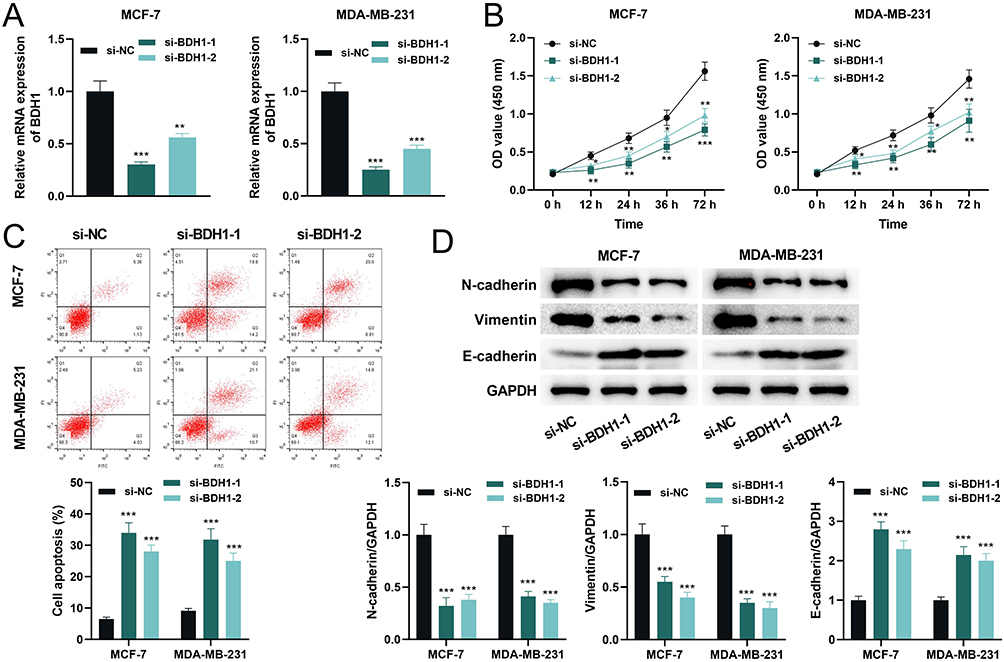 |
Figure 9 Knockdown of BDH1 inhibits the malignant behaviors of BC cells. (A) qRT-PCR was used to detect the mRNA expression level of BDH1 in cells after transfection with si-NC and si-BDH1. (B) CCK-8 was used to detect the cell viability after transfection. (C) Flow cytometry was used to detect the apoptosis level of cells after transfection. (D) Western blot was used to detect the protein expression levels of EMT-related proteins N-cadherin, Vimentin, and E-cadherin in BC cells. *P< 0.05, **P<0.01 and ***P < 0.001 vs si-NC group. Abbreviations: BDH1, 3-hydroxybutyrate dehydrogenase 1; BC, breast cancer; qRT-PCR, quantitative reverse transcriptase-polymerase chain reaction; si-NC, small interference RNA negative control; si-BDH1, small interference RNA targeting 3-hydroxybutyrate dehydrogenase 1; CCK-8, cell counting kit-8; EMT, epithelial-mesenchymal transition. |
Tretinoin Repressed of Malignant Behaviors of BC Cells by Targeting BDH1
The effect of tretinoin on BC cell viability was determined using the CCK-8 assay. The results showed that with an increase in tretinoin concentration, the viability of MCF-7 and MDA-MB-231 cells decreased significantly in a dose-dependent manner (Figure 10A). The IC50 values of tretinoin for MCF-7 and MDA-MB-231 cell lines were 45.05 μM and 56.73 μM respectively. Therefore, 50 μM was selected for subsequent experiments. Subsequently, a BDH1 overexpression cell line was generated. qRT-PCR showed that tretinoin significantly inhibited the transcriptional level of BDH1, while the expression of BDH1 was significantly increased in the overexpressing cell line (Figure 10B). Tretinoin significantly inhibited the viability of BC cells, whereas the viability of BC cells was significantly increased after BDH1 overexpression (Figure 10C). Flow cytometry showed that tretinoin promoted apoptosis of BC cells, which was counteracted by BDH1 overexpression (Figure 10D). In addition, the expression of N-cadherin and Vimentin in the tretinoin-treated group was significantly lower than that in the control group, whereas the expression of E-cadherin was significantly higher in the tretinoin-treated group than in the control group; however, these phenomena were reversed after BDH1 overexpression (Figure 10E). To assess the in vivo antitumor properties of tretinoin, BC xenograft models were established in BALB/c nude mice, followed by tretinoin treatment. The results showed that tretinoin treatment significantly slowed xenograft tumor growth (Figure 11A and B) and reduced tumor weight (Figure 11C), while overexpression of BDH1 reversed the anticancer effect of tretinoin (Figure 11A–C).
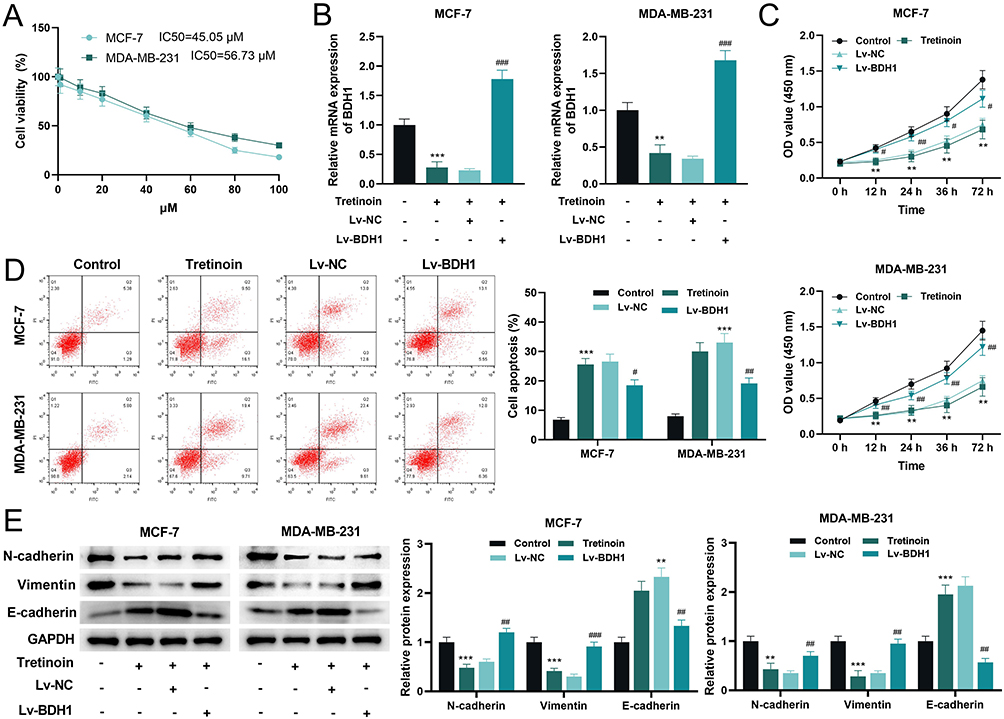 |
Figure 10 Tretinoin represses the malignant behaviors in BC cells by inhibiting the expression of BDH1. (A) CCK-8 assay was used to determine the viability of MCF-7 and MDA-MB-231 cells treated with different concentrations of tretinoin for 48 h. (B) qRT-PCR was used to detect the mRNA expression level of BDH1 in each group. (C) The CCK-8 assay was used to detect the viability of BC cells in each group. (D) Flow cytometry was used to detect apoptosis in the BC cells from each group. (E) Western blotting was used to detect the expression levels of the EMT-related proteins N-cadherin, Vimentin, and E-cadherin in the cells of each treatment group. **P<0.01 and ***P<0.001 vs Control group, #P<0.05, ## P<0.01 and ## P<0.001 vs Lv-BDH1 group. Abbreviations: BC, breast cancer; BDH1, 3-hydroxybutyrate dehydrogenase 1; CCK-8, cell counting kit-8; qRT-PCR, quantitative reverse transcriptase-polymerase chain reaction; CCK-8, cell counting kit-8; EMT, epithelial-mesenchymal transition. |
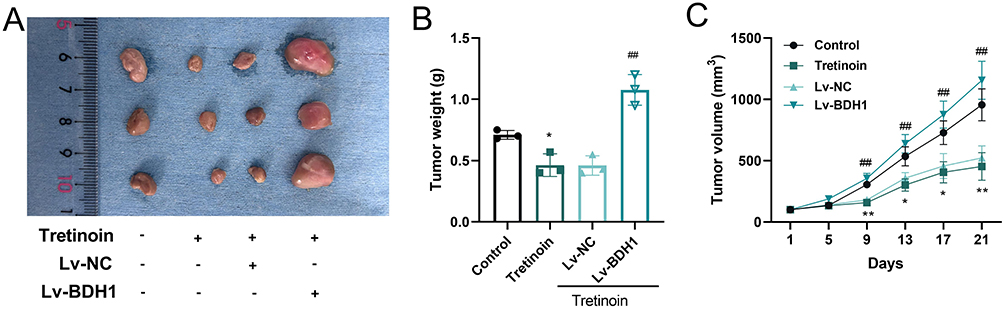 |
Figure 11 Tretinoin inhibits tumor growth by targeting BDH1 in vivo. (A) Representative images of tumors in different groups (n = 3). (B) The weight of xenograft tumors in different groups (n=3). (C) The volume of changes of xenograft tumors in different groups (n=3). *P<0.05 and **P<0.01 vs Control group, ## P<0.01 vs Lv-BDH1 group. Abbreviation: BDH1, 3-hydroxybutyrate dehydrogenase 1. |
Discussion
Through in-depth exploration of the TME, its significant role in the occurrence, development, and treatment of BC has been confirmed. For instance, patients with low T-cell infiltration showed worse survival rates, and patients with high T-cell infiltration have a larger tumor burden and higher rates of TP53 mutations.23 TME is also involved in regulating EMT of cancer cells and plays an important role in driving BC metastasis and therapeutic resistance.24 scRNA-seq provides new approaches for exploring the molecular mechanisms of cancer and is helpful for patient stratification.25 In this study, through the analysis of scRNA-seq data from patients with BC, it was revealed that six B-cell subsets were associated with patient prognosis. Based on the corresponding 53 SSMs, unsupervised cluster analysis yielded two clusters with significant differences in overall survival time. Subsequently, a risk model was constructed using machine learning. The overall survival time of patients in the high-risk group was shorter than that of patients in the low-risk group, and the risk score could effectively predict the 1-year, 3-year and 5-year survival of patients with BC. In addition, the risk score had an independent predictive ability for patient survival. Immunotherapy has shown significant efficacy in the treatment of BC; however, not all patients respond positively to immunotherapy.26 The results of this study showed that the infiltration of antitumor immune cells, such as CD8+ T cells, CD4+ T cells, NK cells, and B cells, etc, was reduced in the high-risk group.27–33 This suggests that the risk model may be also helpful in evaluating the response of BC patients to immunotherapy.
Subsequently, this study identified five therapeutic targets for high-risk patients, including BDH1, CDK5, HDAC11, NDUFS8, and SLC2A1. Cyclin-dependent kinase 5 (CDK5) enables BC cells to evade immune recognition by T cells, and therapeutic targeting of CDK5 significantly enhances the efficacy of immune checkpoint inhibitors and inhibits brain metastasis of BC.34,35 HDAC11 is a type IV histone deacetylase that inhibits the invasion and metastasis of basal-like cells.36 In BC patients with lymph node metastasis, blocking HDAC11 can inhibit tumor growth, while significantly increase distant metastasis.37 NDUFS8 is a key subunit of the mitochondrial complex I and is involved in oxidative phosphorylation and cellular energy production.38 NDUFS8 enhances the activity of mitochondrial complex I, and increases ATP levels, promotes the activation of Akt-mTOR signaling, and increases the proliferation, motility, and radiation resistance of non-small cell lung cancer cells.39 SLC2A1 encodes glucose transporter 1 (GLUT1), a key rate-limiting enzyme for glucose uptake and is highly expressed in triple-negative breast cancer (TNBC).40 Preclinical studies have shown that targeting GLUT1 has significant tumor-suppressive effects in TNBC.41,42
3-hydroxybutyrate dehydrogenase 1 (BDH1) plays a promoting role in liver, lung and pancreatic cancers17,18,43 and exerts a tumor-suppressive effect in acute myeloid leukemia.19 In BC, BDH1 can promote the formation of ketogenic fibroblasts, which promotes the growth of adjacent breast cancer cells by increasing mitochondrial biogenesis.44 In this study, we found that BDH1 was highly expressed in BC tissues and that high BDH1 expression was associated with unfavorable prognosis in BC patients. Additionally, knockdown of BDH1 inhibited the malignant biological behavior of BC cells, which further supports the oncogenic role of BDH1 in BC. Additionally, it was also found that tretinoin (also known as all-trans retinoic acid) is a potential drug for the high risk patients, which potentially targeted multiple characteristic proteins including BDH1. Previous studies have shown that tretinoin is a powerful anti-cancer agent that exerts inhibitory effects on the growth, differentiation, and induction of apoptosis in various types of cancer.45 In addition to suppressing the malignant behavior of tumor cells, tretinoin can also regulate the phenotypes of cancer-associated fibroblasts, adipocyte homeostasis and differentiation, and angiogenesis, which plays important roles in modulating the TME.46 The present study confirmed that tretinoin could inhibit the malignant phenotypes of BC cells, and that BDH1 overexpression reversed these effects. Therefore, tretinoin exerts its anti-cancer effects by inhibiting the expression of BDH1.
It is worth noting that this study still has limitations. First, a large-sample cohort from multiple medical centers should be used to verify the validity of the risk model developed in this study. Second, it is necessary to use preclinical models (such as patient-derived organoids) in subsequent studies to explore the biological role of BDH1 in BC progression and the anti-BC effects of tretinoin, especially their roles in modulating the immune profiling of TME. Third, the downstream molecular mechanism through which BDH1 regulates the malignant phenotype of BC cells requires further investigation. Last but not least, the efficacy, optimal and safe dose of tretinoin before clinical translation application requires further validation. In the following work, detailed preclinical pharmacokinetic and pharmacodynamic studies are needed, to determine the optimal therapeutic dose, administration route, and treatment duration, while also evaluating its potential side effects and toxicity profiles. Additionally, the combined application of tretinoin with other anti-cancer agents may be applied, to assess whether synergistic effects can be achieved, thereby enhancing therapeutic efficacy and overcoming drug resistance.
Conclusion
This study constructs a prognostic risk model for BC, which has reference value for prognosis prediction in BC patients. Furthermore, BDH1 may serve as a promising therapeutic target in BC. Tretinoin exerts its anti-cancer effect by inhibiting the expression of BDH1, providing a theoretical basis for the clinical treatment of high-risk BC patients with tretinoin.
Data Sharing Statement
Data used to support the findings of this study are available from the corresponding author upon request.
Ethics Statement
The collection of use of human data in the present study is exempt from approval based on item 1 and 2 of Article 32 of the Measures for Ethical Review of Life Science and Medical Research Involving Human Subjects dated February 18, 2023, China. The procedures of the animal experiments in the present study was approved by the Medical Ethics Committee of Affiliated Hospital of Hebei Engineering University (Approval No. 2026-001), and performed according to the guidelines of Animal Research: Reporting of In Vivo Experiments 2.0.
Author Contributions
All authors made a significant contribution to the work reported, whether that is in the conception, study design, execution, acquisition of data, analysis and interpretation, or in all these areas; took part in drafting, revising or critically reviewing the article; gave final approval of the version to be published; have agreed on the journal to which the article has been submitted; and agree to be accountable for all aspects of the work.
Funding
This project was supported by the Clinical Medicine Excellent Talent Training Program of Hebei Province (Grant No. ZF2024013), the Handan Science and Technology Research and Development Program (Grant No. 24422083076ZC).
Disclosure
The authors declare that they have no competing interests in this work.
References
1. Lei S, Zheng R, Zhang S, et al. Global patterns of breast cancer incidence and mortality: a population-based cancer registry data analysis from 2000 to 2020. Cancer Commun. 2021;41(11):1183–20. doi:10.1002/cac2.12207
2. Siegel RL, Giaquinto AN, Jemal A. Cancer statistics, 2024. Ca A Cancer J Clin. 2024;74(1):12–49. doi:10.3322/caac.21820
3. Bray F, Laversanne M, Sung H, et al. Global cancer statistics 2022: GLOBOCAN estimates of incidence and mortality worldwide for 36 cancers in 185 countries. Ca A Cancer J Clin. 2024;74(3):229–263. doi:10.3322/caac.21834
4. Sun K, Zhang B, Lei S, et al. Incidence, mortality, and disability-adjusted life years of female breast cancer in China, 2022. Chinese Med J. 2024;137(20):2429–2436. doi:10.1097/CM9.0000000000003278
5. Xiong X, Zheng LW, Ding Y, et al. Breast cancer: pathogenesis and treatments. Signal Transduction Targeted Ther. 2025;10(1):49.
6. Desai SA, Patel VP, Bhosle KP, Nagare SD, Thombare KC. The tumor microenvironment: shaping cancer progression and treatment response. J Chemother. 2025;37(1):15–44. doi:10.1080/1120009X.2023.2300224
7. S W, A G, Deng X, Liu L, Wang Y. Evolving immunotherapeutic solutions for triple-negative breast carcinoma. Cancer Treat Rev. 2024;130:102817. doi:10.1016/j.ctrv.2024.102817
8. Akinsipe T, Mohamedelhassan R, Akinpelu A, et al. Cellular interactions in tumor microenvironment during breast cancer progression: new frontiers and implications for novel therapeutics. Front Immunol. 2024;15:1302587.
9. Tsuda B, Miyamoto A, Yokoyama K, et al. B-cell populations are expanded in breast cancer patients compared with healthy controls. Breast Cancer. 2018;25(3):284–291. doi:10.1007/s12282-017-0824-6
10. Lee S, Kang BH, Lee HB, Jang BS, Han W, Kim IA. B-cell-mediated immunity predicts survival of patients with estrogen receptor-positive breast cancer. JCO Precis Oncol. 2024;8:e2300263. doi:10.1200/PO.23.00263
11. Hawsawi YM, Khoja B, Aljaylani AO, et al. Recent progress and applications of single-cell sequencing technology in breast cancer. Front Genet. 2024;15:1417415. doi:10.3389/fgene.2024.1417415
12. Gao R, Bai S, Henderson YC, et al. Delineating copy number and clonal substructure in human tumors from single-cell transcriptomes. Nature Biotechnol. 2021;39(5):599–608. doi:10.1038/s41587-020-00795-2
13. Liu K, Han H, Xiong K, et al. Single-cell landscape of intratumoral heterogeneity and tumor microenvironment remolding in pre-nodal metastases of breast cancer. J Transl Med. 2024;22(1):804. doi:10.1186/s12967-024-05625-6
14. Wang Z, Lu Z, Lin S, et al. Leucine-tRNA-synthase-2-expressing B cells contribute to colorectal cancer immunoevasion. Immunity. 2022;55(6):1067–1081.e8. doi:10.1016/j.immuni.2022.04.017
15. Ma X, Wang Z, Gao H, et al. β-Hydroxybutyrate dehydrogenase 1: a promising therapeutic target for diverse diseases. Biochem Pharmacol. 2025;239:117070. doi:10.1016/j.bcp.2025.117070
16. Uchihashi M, Hoshino A, Okawa Y, et al. Cardiac-specific Bdh1 overexpression ameliorates oxidative stress and cardiac remodeling in pressure overload-induced heart failure. Circ Heart Fail. 2017;10(12):e004417. doi:10.1161/CIRCHEARTFAILURE.117.004417
17. Wei X, Zhang C, Zheng X, et al. β-hydroxybutyrate dehydrogenase promotes pancreatic cancer cell proliferation through regulation of the NAD+/NADH balance and mitochondrial acetylation. J Biol Chem. 2025;301(10):110636. doi:10.1016/j.jbc.2025.110636
18. Zhang Z, Bi X, Lian X, Niu Z. BDH1 promotes lung cancer cell proliferation and metastases by PARP1-mediated autophagy. J Cell Mol Med. 2023;27(7):939–949. doi:10.1111/jcmm.17700
19. Han F, Zhao H, Lu J, et al. Anti-tumor effects of BDH1 in acute myeloid leukemia. Front Oncol. 2021;11:694594. doi:10.3389/fonc.2021.694594
20. Chen Y, Deng X, Y L, et al. Comprehensive molecular classification predicted microenvironment profiles and therapy response for HCC. Hepatology. 2024;80(3):536–551. doi:10.1097/HEP.0000000000000869
21. Charoentong P, Finotello F, Angelova M, et al. Pan-cancer immunogenomic analyses reveal genotype-immunophenotype relationships and predictors of response to checkpoint blockade. Cell Rep. 2017;18(1):248–262. doi:10.1016/j.celrep.2016.12.019
22. Finan C, Gaulton A, Kruger FA, et al. The druggable genome and support for target identification and validation in drug development. Sci Trans Med. 2017;9(383):eaag1166. doi:10.1126/scitranslmed.aag1166
23. Zhang W, Lee A, Tiwari AK, Yang MQ. Characterizing the tumor microenvironment and its prognostic impact in breast cancer. Cells. 1518;13(18):2024.
24. Yuan J, Yang L, Zhang H, et al. Decoding tumor microenvironment: EMT modulation in breast cancer metastasis and therapeutic resistance, and implications of novel immune checkpoint blockers. Biomed Pharmacothe. 2024;181:117714. doi:10.1016/j.biopha.2024.117714
25. Xiang L, Rao J, Yuan J, Xie T, Yan H. Single-cell RNA-sequencing: opening new horizons for breast cancer research. Int J Mol Sci. 2024;25(17):9482. doi:10.3390/ijms25179482
26. Heater NK, Warrior S, Lu J. Current and future immunotherapy for breast cancer. J Hematol Oncol. 2024;17(1):131. doi:10.1186/s13045-024-01649-z
27. Gong Y, Chen W, Chen X, et al. An injectable epigenetic autophagic modulatory hydrogel for boosting umbilical cord blood NK cell therapy prevents postsurgical relapse of triple-negative breast cancer. Adv Sci. 2022;9(23):e2201271. doi:10.1002/advs.202201271
28. Cao L, Peng H, Chen Y, et al. ICOS-expressing CAR-T cells mediate durable eradication of triple-negative breast cancer and metastasis. J ImmunoTher Cancer. 2024;12;11:e010028.
29. Choi J, Gyamfi J, Jang H, Koo JS. The role of tumor-associated macrophage in breast cancer biology. Histol Histopathol. 2018;33(2):133–145. doi:10.14670/HH-11-916
30. Gong Z, Q L, Shi J, et al. Immunosuppressive reprogramming of neutrophils by lung mesenchymal cells promotes breast cancer metastasis. Sci Immunol. 2023;8(80):eadd5204. doi:10.1126/sciimmunol.add5204
31. Sammut SJ, Galson JD, Minter R, et al. Predictability of B cell clonal persistence and immunosurveillance in breast cancer. Nat Immunol. 2024;25(5):916–924. doi:10.1038/s41590-024-01821-0
32. Blomberg OS, Kos K, Spagnuolo L, et al. Neoadjuvant immune checkpoint blockade triggers persistent and systemic T(reg) activation which blunts therapeutic efficacy against metastatic spread of breast tumors. Oncoimmunology. 2023;12(1):2201147. doi:10.1080/2162402X.2023.2201147
33. W X, Zhang T, Zhu Z, Yang Y. The association between immune cells and breast cancer: insights from Mendelian randomization and meta-analysis. Int J Surg. 2025;111(1):230–241. doi:10.1097/JS9.0000000000001840
34. Yuzhalin AE, Lowery FJ, Saito Y, et al. Astrocyte-induced Cdk5 expedites breast cancer brain metastasis by suppressing MHC-I expression to evade immune recognition. Nat Cell Biol. 2024;26(10):1773–1789. doi:10.1038/s41556-024-01509-5
35. Zhao D, Wen X, Wu J, Chen F. Photoimmunotherapy for cancer treatment based on organic small molecules: recent strategies and future directions. Transl Oncol. 2024;49:102086. doi:10.1016/j.tranon.2024.102086
36. Z Y, Wenwen L, Kun W, Jian S. Overexpression of histone deacetylase 11 suppresses basal-like breast cancer cell invasion and metastasis. Nan Fang Yi Ke Da Xue Xue Bao. 2019;39(7):751–759. doi:10.12122/j.issn.1673-4254.2019.07.01
37. Leslie PL, Chao YL, Tsai YH, et al. Histone deacetylase 11 inhibition promotes breast cancer metastasis from lymph nodes. Nat Commun. 2019;10(1):4192. doi:10.1038/s41467-019-12222-5
38. Wang S, Kang Y, Wang R, et al. Emerging roles of NDUFS8 located in mitochondrial complex I in different diseases. Molecules. 2022;27(24):2022. doi:10.3390/molecules27062022
39. W X, Fang H, Cao X, et al. NADH: ubiquinone oxidoreductase core subunit S8 expression and functional significance in non-small cell lung cancer. Cell Death Dis. 2025;16(1):321. doi:10.1038/s41419-025-07638-5
40. Alluri P, Newman LA. Basal-like and triple-negative breast cancers: searching for positives among many negatives. Surg Oncol Clin North Am. 2014;23(3):567–577. doi:10.1016/j.soc.2014.03.003
41. S O, Kim H, Nam K, Shin I. Glut1 promotes cell proliferation, migration and invasion by regulating epidermal growth factor receptor and integrin signaling in triple-negative breast cancer cells. BMB Rep. 2017;50(3):132–137. doi:10.5483/BMBRep.2017.50.3.189
42. Wu Q, Ba-Alawi W, Deblois G, et al. GLUT1 inhibition blocks growth of RB1-positive triple negative breast cancer. Nat Commun. 2020;11(1):4205. doi:10.1038/s41467-020-18020-8
43. Zhang H, Chang Z, Qin LN, et al. MTA2 triggered R-loop trans-regulates BDH1-mediated β-hydroxybutyrylation and potentiates propagation of hepatocellular carcinoma stem cells. Signal Transduction Targeted Ther. 2021;6(1):135. doi:10.1038/s41392-021-00464-z
44. Martinez-Outschoorn UE, Lin Z, Whitaker-Menezes D, et al. Ketone body utilization drives tumor growth and metastasis. Cell Cycle. 2012;11(21):3964–3971. doi:10.4161/cc.22137
45. Brown G, Tanko G, Vacaru AM, Ghila L, Chera S, Vacaru A-M. Deregulation of all-trans retinoic acid signaling and development in cancer. Int J Mol Sci. 2023;24(15):2023. doi:10.3390/ijms24032023
46. Caricasulo MA, Zanetti A, Terao M, Garattini E, Paroni G. Cellular and micro-environmental responses influencing the antitumor activity of all-trans retinoic acid in breast cancer. Cell Commun Signaling. 2024;22(1):127. doi:10.1186/s12964-024-01492-2
 © 2026 The Author(s). This work is published and licensed by Dove Medical Press Limited. The
full terms of this license are available at https://www.dovepress.com/terms
and incorporate the Creative Commons Attribution
- Non Commercial (unported, 4.0) License.
By accessing the work you hereby accept the Terms. Non-commercial uses of the work are permitted
without any further permission from Dove Medical Press Limited, provided the work is properly
attributed. For permission for commercial use of this work, please see paragraphs 4.2 and 5 of our Terms.
© 2026 The Author(s). This work is published and licensed by Dove Medical Press Limited. The
full terms of this license are available at https://www.dovepress.com/terms
and incorporate the Creative Commons Attribution
- Non Commercial (unported, 4.0) License.
By accessing the work you hereby accept the Terms. Non-commercial uses of the work are permitted
without any further permission from Dove Medical Press Limited, provided the work is properly
attributed. For permission for commercial use of this work, please see paragraphs 4.2 and 5 of our Terms.
Recommended articles
Chromosomal Instability as Enabling Feature and Central Hallmark of Breast Cancer
Castellanos G, Valbuena DS, Pérez E, Villegas VE, Rondón-Lagos M
Breast Cancer: Targets and Therapy 2023, 15:189-211
Published Date: 9 March 2023
Machine Learning Algorithm to Estimate Distant Breast Cancer Recurrence at the Population Level with Administrative Data
Izci H, Macq G, Tambuyzer T, De Schutter H, Wildiers H, Duhoux FP, de Azambuja E, Taylor D, Staelens G, Orye G, Hlavata Z, Hellemans H, De Rop C, Neven P, Verdoodt F
Clinical Epidemiology 2023, 15:559-568
Published Date: 5 May 2023
Comprehensive Analysis of SLC35A2 in Pan-Cancer and Validation of Its Role in Breast Cancer
Sun X, Yuan Z, Zhang L, Ren M, Yang J, Xu Y, Hao J
Journal of Inflammation Research 2023, 16:3381-3398
Published Date: 11 August 2023
The Emerging Roles of Exosomal miRNAs in Breast Cancer Progression and Potential Clinical Applications
Li J, He D, Bi Y, Liu S
Breast Cancer: Targets and Therapy 2023, 15:825-840
Published Date: 16 November 2023
Identification and Evaluation of Lipocalin-2 in Sepsis-Associated Encephalopathy via Machine Learning Approaches
Hu J, Chen Z, Wang J, Xu A, Sun J, Xiao W, Yang M
Journal of Inflammation Research 2025, 18:3843-3858
Published Date: 14 March 2025