
Back to Journals » International Journal of General Medicine » Volume 19
Machine Learning-Based Prediction Model for Type 2 Diabetic Peripheral Neuropathy: Role of Bilateral Brachial-Ankle Pulse Wave Velocity and Anthropometric Indicators
Authors Zhang Z  , Sun L, Wang Y, Wang Y
Received 6 February 2026
Accepted for publication 15 June 2026
Published 26 June 2026 Volume 2026:19 601767
DOI https://doi.org/10.2147/IJGM.S601767
Checked for plagiarism Yes
Review by Single anonymous peer review
Peer reviewer comments 2
Editor who approved publication: Dr Sarah Cipriani
Zhengshan Zhang,1 Luying Sun,1– 3 Yue Wang,1 Yahui Wang2
1Department of Nephrology and Endocrinology, Dongzhimen Hospital, Beijing University of Chinese Medicine, Beijing, People’s Republic of China; 2Department of Nephrology, Fangshan Hospital, Beijing University of Chinese Medicine, Beijing, People’s Republic of China; 3Integrated Chinese and Western Medicine Metabolic Disease Research Center, Fangshan Hospital, Beijing University of Chinese Medicine, Beijing, People’s Republic of China
Correspondence: Luying Sun, Department of Nephrology, Fangshan Hospital, Beijing University of Chinese Medicine, 4 Health Care Road, Fangshan District, Beijing, 102400, People’s Republic of China, Tel +86-10-69314293, Email [email protected]
Purpose: Establishing a machine learning model to predict diabetic peripheral neuropathy (DPN) in patients with type 2 diabetes mellitus (T2DM) and exploring the role of bilateral brachial-ankle pulse wave velocity and anthropometric indices.
Patients and Methods: Clinical data of 966 T2DM patients were retrospectively analyzed. According to sensory nerve conduction test results, they were divided into a DPN group and a non-DPN group. The BorutaShap method was employed to screen influencing factors, based on which nine machine learning models were established and compared. Interpretative analysis was performed using the SHAP (SHapley Additive exPlanations) package in Python. The mean absolute SHAP value of feature parameters was defined as their importance and ranked accordingly. The relationship between each feature and DPN was determined based on SHAP values, and quantitative analysis was conducted for continuous variables.
Results: Among 966 T2DM patients, 469 were diagnosed with DPN and 13 influencing factors identified. Of nine machine learning models, the Support Vector Machine (SVM) model performed best (accuracy 0.74[95% CI: 0.69– 0.79], AUC 0.82[95% CI: 0.77– 0.87], recall 0.66[95% CI: 0.58– 0.74], precision 0.80[95% CI: 0.73– 0.86], F1 0.72[95% CI: 0.66– 0.78]). SHAP analysis of the SVM model showed left brachial-ankle pulse wave velocity (LBAPWV) as the most influential predictor (SHAP=0.70), followed by gender, Glucose 0min, fT3, diabetes duration, and hip circumference. Right brachial-ankle pulse wave velocity (RBAPWV) contributed less (SHAP=0.20). Risk factors included LBAPWV, Gender, Glucose 0min, Diabetes duration, Insulin therapy, RBAPWV, UACR, Smoking, Height, and In-hospital blood glucose value; protective factors were fT3, Hip circumference, and C-peptide 180min.
Conclusion: Machine learning enables robust DPN prediction. Our model revealed asymmetric importance between LBAPWV and RBAPWV, with LBAPWV showing stronger DPN associations. Hip circumference was a protective anthropometric predictor. These findings enhance DPN risk stratification.
Keywords: type 2 diabetes mellitus, type 2 diabetic peripheral neuropathy, machine learning, predictive model, bilateral brachial-ankle pulse wave velocity, hip circumference
Introduction
According to the International Diabetes Federation (IDF), approximately 537 million adults worldwide were living with diabetes in 2021, with projections indicating a surge to 783 million by 2045—a staggering 46% increase. China currently has the largest diabetic population globally.1 Diabetic peripheral neuropathy (DPN) is one of the most prevalent complications of diabetes.2 It can lead to neuropathic pain, foot ulcers, amputations, and substantial socioeconomic burdens. Furthermore, DPN is associated with an increased risk of myocardial ischemia, arrhythmias, and sudden cardiac death.3,4 Evidence suggests that DPN begins to progress during the prediabetic stage, and approximately 50% of patients with early-stage DPN are asymptomatic. However, nerve conduction studies (NCS), which are only sensitive to large-fiber dysfunction, are prone to missing small-fiber damage, leading to misdiagnosis and delayed treatment.5 Therefore, early identification of risk factors and timely intervention are of paramount importance.
Brachial-ankle pulse wave velocity (baPWV) has emerged as a non-invasive, reliable, and widely adopted clinical tool for quantifying arterial stiffness. An elevated baPWV reflects reduced vascular compliance from the aorta to peripheral arteries and serves as a robust independent predictor of cardiovascular morbidity and mortality. The progression of arterial stiffness in diabetes is multifactorial; notably, dyslipidemia, particularly elevated low-density lipoprotein cholesterol (LDL-C) and triglyceride levels, exacerbates this process by promoting atherosclerotic plaque formation and inducing endothelial dysfunction. Furthermore, the diabetic state is characterized by persistent low-grade systemic inflammation. Inflammatory biomarkers, such as high-sensitivity C-reactive protein (hs-CRP), interleukin-6 (IL-6), and tumor necrosis factor-alpha (TNF-α), are frequently upregulated in patients with type 2 diabetes and correlate directly with arterial stiffness.6 The intricate interplay between these specific biochemical parameters, such as hyperglycemia, dyslipidemia, and inflammation, and the clinical metric of arterial stiffness (baPWV) provides insight into how systemic disease translates into target organ damage, including peripheral neuropathy. Traditionally, baPWV has been utilized as a composite or average index reflecting overall systemic arterial stiffness. However, this approach may obscure critical and clinically significant information embedded in potential left-right asymmetries. Based on fundamental human circulatory anatomy, the left subclavian artery originates directly from the apex of the aortic arch, whereas the right subclavian artery arises from the brachiocephalic trunk. This anatomical distinction subjects the left vasculature to more direct, unattenuated pulsatile flow and higher velocities, creating complex asymmetric hemodynamic patterns. Chronic asymmetric mechanical loading may accelerate the aging and atherosclerotic progression of the left-sided vessels. Consequently, this anatomical and hemodynamic disparity may render LBAPWV a more sensitive indicator than RBAPWV for revealing risks of systemic vascular disease and microvascular complications, such as DPN.
Body mass index (BMI) and waist circumference (WC) are the most commonly used anthropometric measures in clinical practice. Previous studies have consistently demonstrated a significant positive correlation between higher BMI levels and the risk of DPN.7 Despite its widespread use, BMI has a primary limitation: it cannot differentiate between fat and muscle mass, nor does it reflect the specific distribution of adipose tissue. In contrast, the predictive value of WC has been repeatedly validated in DPN research, with an increased WC serving as a strong independent risk factor for DPN in patients with type 2 diabetes. Currently, some studies have employed the waist-to-hip ratio (WHR) as an indicator for assessing DPN risk and have identified significant associations.8 However, compared to the well-defined pathogenic role of waist circumference, the role of hip circumference is considerably more complex. Hip circumference primarily reflects gluteal-femoral fat deposition, which possesses distinct metabolic properties compared to abdominal visceral fat. Gluteal-femoral adipose tissue secretes higher levels of beneficial adipokines, such as adiponectin, exerting anti-inflammatory and anti-atherosclerotic effects. Clarifying the independent relationship between hip circumference and DPN holds substantial clinical and scientific significance, as it could lead to a more nuanced understanding of obesity-related risks and potentially uncover novel protective factors. Nevertheless, studies directly investigating the relationship between hip circumference and DPN remain scarce.
Previous studies have analyzed risk factors for DPN, including age,9 duration of diabetes, and glycated hemoglobin.10 Although numerous risk factors have been identified, the conclusions regarding some factors remain inconsistent across different studies. Moreover, current research has inadequately explored several emerging potential risk factors, resulting in suboptimal clinical applicability of existing DPN prediction indicators.
Machine learning (ML) has emerged as a powerful new tool for risk prediction and early identification in clinical practice.11 A core advantage of ML models is their ability to deliver highly personalized risk prediction. This study developed DPN prediction models for T2DM patients using multiple ML algorithms to explore the potential predictive utility of underutilized variables, providing new insights for early DPN screening and intervention in T2DM.
Materials and Methods
Study Design and Participants
We conducted a retrospective analysis of data from 2894 patients with T2DM recruited from the Branch Center of the National Metabolic Management Center (MMC) at Fangshan Hospital of Beijing University of Chinese Medicine between November 2021 and August 2025. After applying exclusion criteria, a total of 966 patients were ultimately included in the final analysis (Figure 1), encompassing 184 measured indicators. Baseline characteristics, including gender, age, blood pressure, and BMI were collected. Medical history data covered diabetes duration, smoking and alcohol consumption history, medication history, and comorbidities. Given that BMI fails to capture fat distribution, we focused on more specific anthropometric measures that better reflect metabolic risk. Anthropometric measurements included visceral fat area, neck circumference, waist circumference, and hip circumference. Following an 8–12 hour overnight fast, blood samples were collected. A full automatic biochemical analyzer was used to measure liver and renal function as well as lipid profiles, while a full automatic hematology analyzer was employed for routine blood tests. Thyroid function, including free triiodothyronine (fT3) and free thyroxine (fT4), was measured using chemiluminescence immunoassay. A standardized Steamed Bread Meal Tolerance Test was performed as follows: after collecting fasting venous blood, subjects were instructed to consume a 100-gram standard steamed bun within 5–10 minutes. Blood glucose and C-peptide levels were measured at 0 (the first bite), 30, 60, 120, and 180 minutes post-meal using chemiluminescent immunoassay. BAPWV was measured by trained nurses using a volume plethysmograph (BP-203RPE III, Omron, Japan). Carotid Doppler ultrasound and cardiac ultrasound examinations were independently performed by two senior physicians using a color Doppler ultrasound diagnostic system (Mindray, China), and relevant sonographic parameters were recorded. According to the results of sensory nerve conduction velocity tests, the subjects were stratified into a peripheral neuropathy group and a non-peripheral neuropathy group. All data were sourced from the electronic medical records of Fangshan Hospital. This study was conducted in accordance with the principles of the Declaration of Helsinki and was approved by the Ethics Committee of Fangshan Hospital of Beijing University of Chinese Medicine (approval number: FZY LK-2026-014).
 |
Figure 1 Flowchart of the study population. |
Inclusion Criteria
(1) Participants meeting the diagnostic criteria for T2DM as defined by the 2024 American Diabetes Association (ADA) guidelines. (2) Participants who had completed sensory nerve conduction velocity (SNCV) testing.
Exclusion Criteria
(1) Participants under 18 years of age. (2) Patients with neuropathies attributable to other causes were excluded. These causes included chronic alcoholism, vitamin B12 deficiency, uremic neuropathy, hereditary neuropathies, and neuropathies secondary to malignancies or autoimmune diseases. Additionally, individuals with a prior clinical diagnosis of thyroid disease, such as hypothyroidism or hyperthyroidism, or those currently taking thyroid medications were also excluded. (3) Presence of acute complications, such as diabetic ketoacidosis or hyperosmolar coma. (4) Severe dysfunction of the heart, liver, or kidneys. (5) Pregnant or lactating females.
Data Processing
Prior to importing the data into Python (version 3.8.19), we first performed initial data curation, manually excluding 24 variables from the initial 184. These excluded variables comprised (1) identifiers lacking clinical relevance, such as medical record numbers; (2) completely redundant variables, including duplicate measurements; and (3) near-zero variance features, defined as those where over 99% of patients had constant or nearly constant values, which provided no predictive information. This process yielded a dataset containing 160 candidate features. We then assessed the data completeness of the remaining 160 features to address missing values. A total of 33 features with a missing rate exceeding 50% were excluded from further analysis. Following this exclusion, the remaining features exhibited missing rates ranging from 1% to 1.5%. Missing values in the remaining categorical variables were imputed using the mode of each variable, while missing values in continuous variables were filled with the mean. The final dataset comprised 469 patients with DPN and 497 patients without DPN.
Feature Selection
To ensure rigor and unbiasedness in model evaluation, the complete dataset comprising 966 patients was randomly partitioned into training and test sets. Subsequently, to identify predictors highly relevant to DPN and to enhance model interpretability and performance, the BorutaShap algorithm was strictly applied for feature selection exclusively on the training set.
Model Development
Nine machine learning algorithms were employed to construct the predictive models, including Logistic Regression (LR), Support Vector Machine (SVM), K-Nearest Neighbors (KNN), Decision Tree (DT), Random Forest (RF), AdaBoost, Gradient Boosting Decision Tree (GBDT), Extreme Gradient Boosting (XGBoost), and Light Gradient Boosting Machine (LightGBM). Using the high-risk predictive factors identified through feature selection as input features and the presence or absence of DPN as the outcome variable, we randomly split the 966-patient dataset into training and testing sets at a 7:3 ratio using the Scikit-learn (sklearn) library in Python 3.8.19. The training set contained 676 samples, and the testing set contained 290 samples. Models were trained on the training set using five-fold cross-validation, where the training data were randomly divided into five equal folds. In each iteration, the model was trained on four folds (approximately 541 samples) and validated on the remaining fold (approximately 135 samples), with this process cycling five times. To mitigate overfitting, hyperparameter tuning was performed based on the Receiver Operating Characteristic (ROC) curve and the Area Under the Curve (AUC). Using a two-stage approach combining random search and grid search, we tuned the hyperparameters for the respective models: the regularization strength C for LR, the kernel coefficient gamma for SVM, n_neighbors for KNN, max_depth for DT, n_estimators for RF, n_estimators for AdaBoost, subsample for GBDT, learning_rate for XGBoost, and learning_rate for LightGBM. For the SVM model, the final hyperparameters were determined as follows: radial basis function (RBF) kernel, regularization parameter C of 3.34, and kernel coefficient gamma of 0.01. Finally, the optimized models were validated on the independent test set to evaluate their generalizability.
Model Performance Evaluation
The predictive performance was evaluated using accuracy, recall, and precision scores. The effectiveness of the binary classification models was further assessed using the F1 score and the AUC. Calibration curves were generated to assess the accuracy of the predicted probabilities. In these plots, the closer the model’s curve approaches the diagonal dotted line (the ideal calibration line), the better the calibration, indicating that the predicted probabilities closely match the actual observed outcomes.
Model Interpretation
To interpret the “black-box” model exhibiting the best predictive performance, we employed the Shapley Additive Explanations (SHAP) algorithm, utilizing the KernelSHAP explainer. The importance of each selected feature was determined by the mean absolute SHAP value and ranked accordingly. The relationship (positive or negative contribution) between each feature and the risk of diabetic peripheral neuropathy was established based on the SHAP values. Furthermore, a quantitative dependence analysis was conducted for continuous variables among the influencing factors.
Statistical Analysis
All statistical analyses were performed using SPSS software (version 26.0). Categorical variables were expressed as frequencies and percentages, and were compared using the Chi-square test. Normally distributed continuous variables were presented as mean ± standard deviation ( ) and compared between groups using the independent samples t-test. For non-normally distributed continuous variables, data were expressed as median [interquartile range (IQR), P25-P75] and compared using the Mann–Whitney-U test. A two-sided p-value < 0.05 was considered statistically significant.
Results
Comparison of Baseline Characteristics Between the Non-DPN and DPN Groups
Significant intergroup differences were observed between the Non-DPN and DPN groups regarding the following variables: gender, in-hospital blood glucose value, height, neck circumference, hip circumference, waist-to-hip ratio (WHR), duration of diabetes, smoking status, alcohol consumption, and oral lipid-lowering medication use. Additionally, indices related to glucose metabolism, including Glucose (0min, 120min) and C-peptide (0min, 60min, 120min, 180min), demonstrated statistical significance. Furthermore, differences in HbA1c, AST, BUN, HDL-c, fT3, UACR, and LBAPWV/RBAPWV were noted, as well as disparities in left atrial diameter, interventricular septum thickness, LVEF, heart rate, insulin therapy, and peripheral arterial disease (p < 0.05 for all comparisons). The study also revealed that Glucose 60 min (p = 0.066) and Glucose 180 min (p = 0.056) exhibited borderline non-significant increasing trends in the DPN group (Table 1).
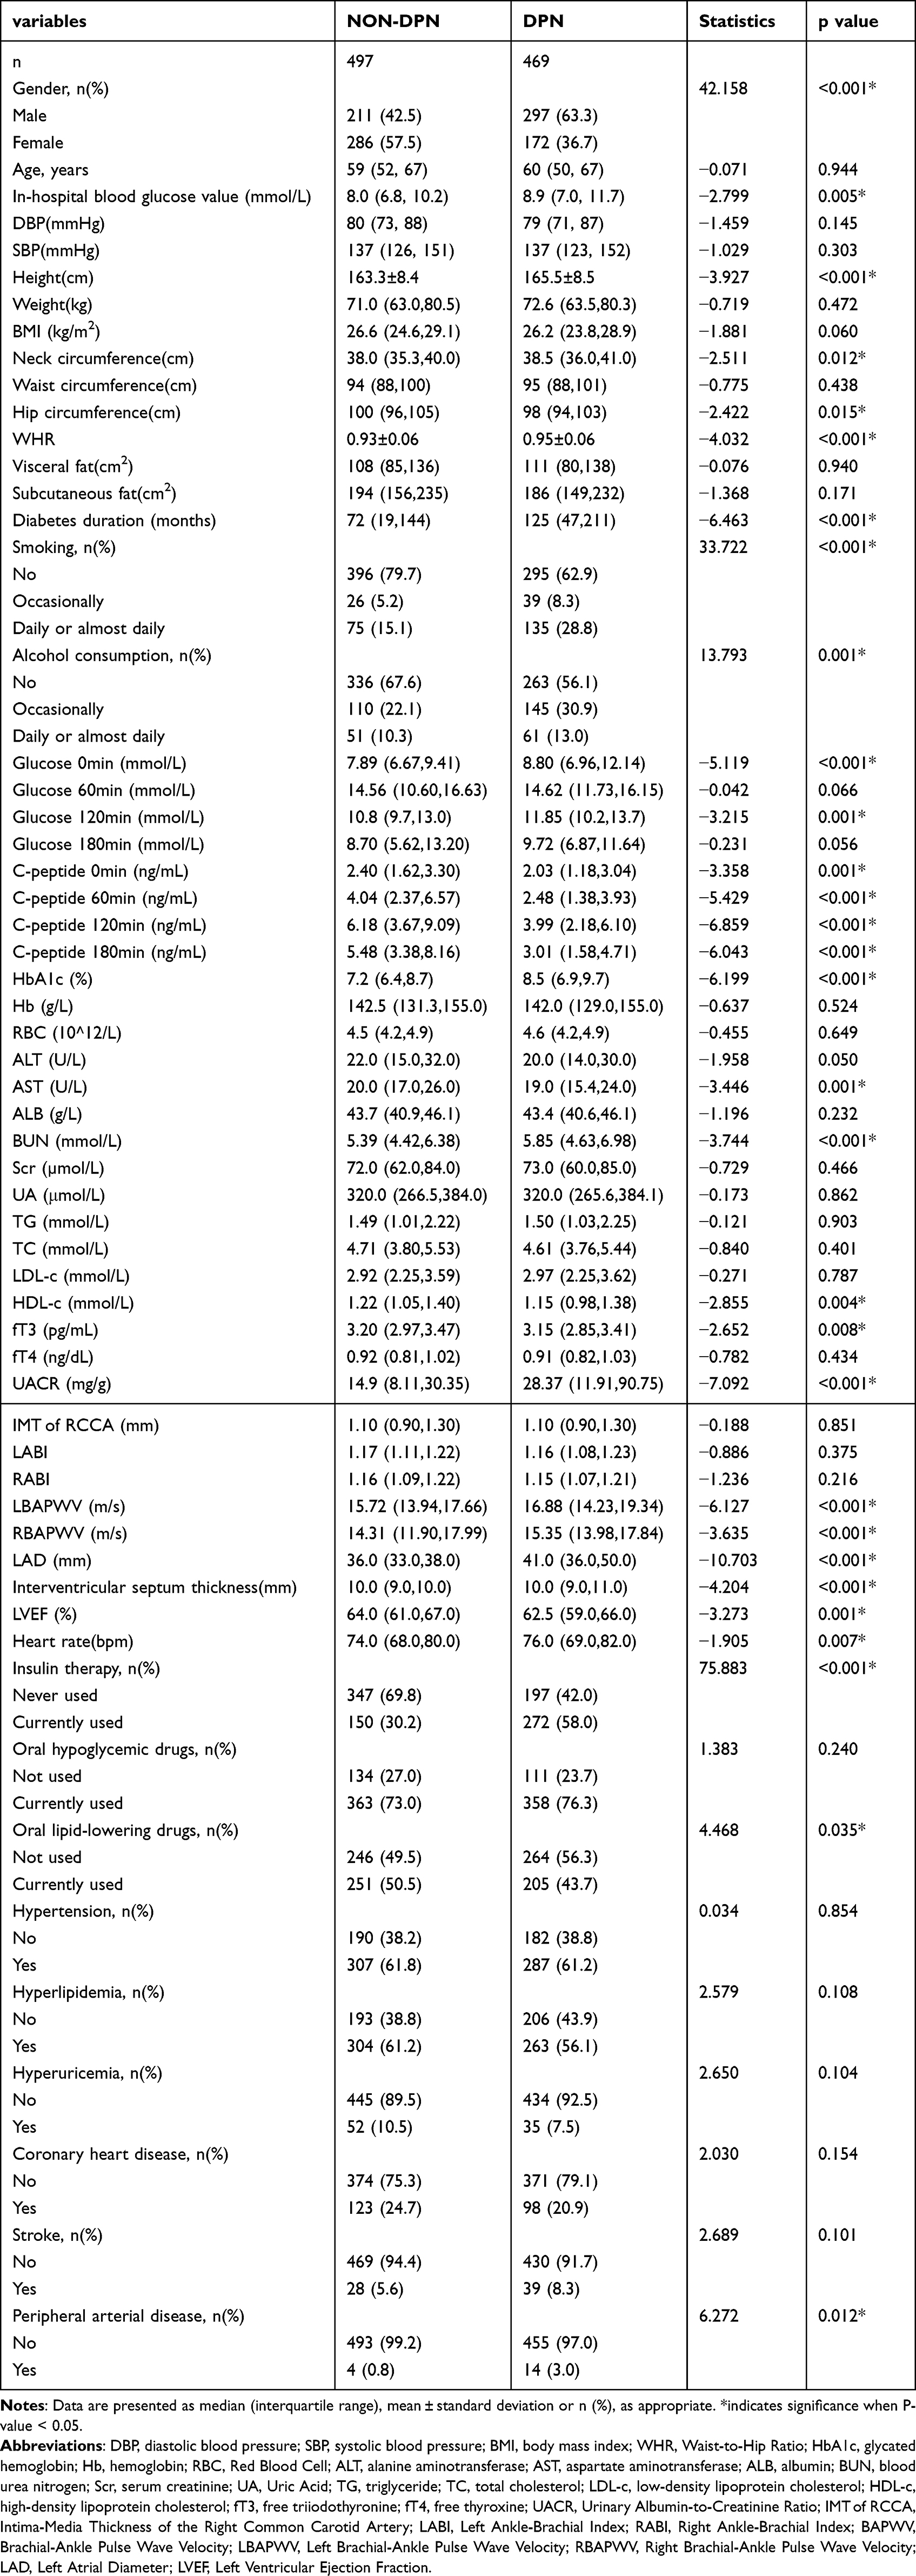 |
Table 1 Comparison of Baseline Characteristics Between NON-DPN and DPN Groups |
Feature Selection
Thirteen potential predictors were identified through the BorutaShap algorithm. These features are listed as follows: LBAPWV, Gender, Glucose 0min, fT3, Diabetes Duration, Hip Circumference, Insulin Therapy, RBAPWV, UACR, C-peptide 180min, Smoking, Height, and In-hospital Blood Glucose Value. The coding schemes for the categorical variables are presented in Table 2.
 |
Table 2 Variable Assignment |
Model Development and Evaluation
Nine machine learning models were developed and compared. As illustrated in Figure 2, Logistic Regression and SVM demonstrated the highest AUC values (both 0.82[95% CI:0.77–0.87]), whereas the Decision Tree model exhibited the lowest AUC (0.72[95% CI:0.69–0.77]).
 |
Figure 2 Receiver Operating Characteristic Curves of Nine Machine Learning Models. Abbreviations: LR, Logistic Regression; SVM, Support Vector Machine; KNN, K-Nearest Neighbors; DT, Decision Tree; RF, Random Forest; Adaboost, Adaptive Boosting; GB, Gradient Boosting; XGBoost, Extreme Gradient Boosting; LightGBM, Light Gradient Boosting Machine. |
The comprehensive evaluation metrics for the nine algorithms are summarized in Table 3. Notably, the SVM model achieved the highest performance across multiple indices, including accuracy (0.74[95% CI: 0.69–0.79]), AUC (0.82[95% CI: 0.77–0.87]), recall (0.66[95% CI: 0.58–0.74]), and F1-score (0.72[95% CI: 0.66–0.78]). Although the Decision Tree model yielded the highest precision (0.84[95% CI:0.79–0.88]), its performance in accuracy, AUC, recall, and F1-score was suboptimal. Furthermore, calibration curves (Figure 3) indicated that the SVM and Logistic Regression models possessed superior calibration, suggesting high consistency between predicted probabilities and actual observations. Collectively, these results suggest that the SVM and Logistic Regression models outperformed the other candidates, with the SVM model demonstrating marginally better overall performance than Logistic Regression. Therefore, the SVM model was identified as the optimal model for predicting DPN.
 |
Table 3 Comparison of Performance of the Nine Machine Learning Models |
 |
Figure 3 Calibration Curves of the Nine Machine Learning Models. |
Interpretable Analysis Based on the SHAP Algorithm
We employed SHAP to elucidate the relationship between model features and outputs, ranking features according to their contribution to the model prediction. LBAPWV exhibited the highest contribution to the SVM model (SHAP value = 0.7), followed by Gender, Glucose 0min, fT3, Diabetes Duration, and Hip Circumference (Figure 4A). To further investigate the specific impact of each predictor, SHAP values were utilized to reveal the association between individual features and diabetic peripheral neuropathy (Figure 4B). As depicted in Figure 4B, LBAPWV, Gender, Glucose 0min, Diabetes Duration, Insulin Therapy, RBAPWV, UACR, Smoking, Height, and In-hospital Blood Glucose Value were identified as risk factors, whereas fT3, Hip Circumference, and C-peptide 180min were determined to be protective factors. The influence of individual continuous features on model prediction was further illustrated using dependence plots (Figure 5).
 |
Figure 4 SVM Model Feature Importance Matrix. Notes: The y-axis represents the feature names, and the x-axis represents the SHAP values. Features are ranked by the mean of absolute SHAP values. The SVM model utilized the radial basis function (RBF) kernel, with the SHAP explainer type set to KernelSHAP. In plot (A), higher SHAP values indicate a greater contribution to the model. In plot (B), the analysis was performed based on 290 samples. Each row represents a feature, with color indicating the feature value (red for high, blue for low). The relationship (positive or negative) between each feature and DPN is determined by the distribution of actual feature values and SHAP values. |
 |
Figure 5 The SVM model utilized the radial basis function (RBF) kernel, with the SHAP explainer type set to KernelSHAP. Quantitative Analysis of Individual Features. Notes: Figures (A–J) show the quantitative analysis of LBAPWV, Glucose 0min, fT3, Diabetes duration, Hip circumference, RBAPWV, UACR, C-peptide 180min, Height, and In-hospital blood glucose value, respectively. The x-axis represents the actual feature values, and the y-axis represents the corresponding SHAP values. A SHAP value greater than 0 indicates an increased risk of DPN. |
 |
Figure 5 continued. |
Discussion
DPN represents one of the most prevalent chronic complications of diabetes mellitus, posing a substantial burden on global public health systems.12 However, current nerve conduction studies primarily assess the function of large myelinated fibers and are insensitive to small fiber neuropathy. Consequently, early-stage DPN is often asymptomatic and prone to underdiagnosis; many patients are not diagnosed until severe complications arise, at which point neural damage is frequently irreversible. Therefore, the early identification of clinical indicators, predictive factors, and risk factors for DPN is of paramount importance. In this study, we developed nine machine learning-based predictive models for DPN. Comparative analysis revealed that the SVM model demonstrated superior predictive performance.
Previous studies have also established predictive models for DPN. Zhang13 developed a nomogram for DPN prediction, demonstrating its clinical utility, although its predictive performance was constrained by a limited dataset. Lian14 constructed machine learning-based DPN prediction models and identified the XGBoost model as the top performer, while also highlighting analytical challenges posed by datasets composed entirely of continuous variables. Wu15 established four predictive nomograms and selected the optimal model, but reliance on the Toronto Clinical Scoring System (TCSS) for DPN diagnosis introduced potential subjectivity. Wei16 developed a DPN prediction model using a random forest algorithm; however, the absence of benchmarking against alternative models may have compromised its accuracy. A broader review of contemporary literature reveals that common methodological challenges persist across studies, including our own, with a key limitation being reliance on data from a single medical institution and sample size frequently serving as a prevalent constraint.17 Against this backdrop, although the present study is a retrospective single-center analysis based on 966 patients, it aims to identify the most robust predictive model for our dataset through rigorous comparative analysis of nine different machine learning algorithms. More importantly, we seek to expand the existing feature space by investigating the potential predictive utility of variables that have not been sufficiently explored.
In this study, the optimal SVM model achieved a recall of 0.66. Although this was counterbalanced by a precision of 0.80, the associated clinical false negative rate remains a concern, as missed diagnoses could lead to the loss of opportunities for early intervention. Therefore, it is imperative to emphasize that this model should serve strictly as an adjunctive clinical tool rather than a replacement for clinical examinations, which remain essential for capturing cases potentially overlooked by the model. Future work should focus on enhancing the model’s sensitivity through potential approaches such as incorporating novel biomarkers and exploring alternative algorithmic methodologies. Previously identified influencing factors for DPN include Gender, Glucose 0min, fT3, Diabetes duration, Insulin therapy, UACR, Smoking,18 and Height—findings consistent with our results. Furthermore, our study presents additional novel discoveries.
Our findings demonstrate that both LBAPWV and RBAPWV are significant risk factors for DPN, a conclusion that aligns closely with previous research on the association between arteriosclerosis and neuropathy.19,20 Elevated PWV, indicative of arterial stiffness, may promote DPN development through mechanisms such as ischemic nerve injury and direct impairment of nerve fiber conduction.21,22 However, prior studies have generally treated BAPWV as a singular, undifferentiated measure of arterial stiffness, without distinguishing between left and right limbs. Notably, in a study constructing a DPN prediction model, researchers input left and right foot vibration perception thresholds (VPT) as independent features. Subsequent SHAP analysis revealed that the VPT values from each side contributed differentially to the model’s predictive power.23 Although this finding did not involve PWV, it provides compelling evidence that neuropathic damage in DPN may be asymmetric and that such asymmetry can be captured by machine learning models as effective predictive information. A key finding from our model interpretability analysis is the differential predictive contribution of left versus right baPWV. SHAP analysis identified LBAPWV as the most influential single feature in the SVM model, with a SHAP value of 0.7, substantially higher than the 0.2 observed for RBAPWV. This disparity in SHAP values reflects differences in feature importance for predicting DPN within the specific context of our dataset and modeling framework, rather than a direct quantification of physiological differences in arterial stiffness between limbs. Nevertheless, this asymmetry in predictive utility is noteworthy. It suggests that the information captured by left-side measurements exhibits a more consistent and stronger association with DPN presence according to the patterns learned by the algorithm. The higher attribution importance of LBAPWV may stem from feature collinearity, potentially involving less overlap with other strong predictors in the model compared to RBAPWV, thereby conferring a unique and stronger predictive role during model training. While prior DPN prediction models have noted differential contributions from bilateral features such as vibration perception threshold, suggesting that machine learning can capture lateralized aspects of neuropathy, applying this concept to baPWV necessitates dedicated physiological validation. Therefore, we do not assert definitive anatomical or hemodynamic underpinnings for this finding. Instead, the differential importance of LBAPWV in our model underscores the need for future prospective studies with standardized bilateral measurements to explore potential underlying physiological mechanisms. Our results have significant clinical implications. The superior predictive performance of LBAPWV offers a more precise tool for the early diagnosis of DPN. Incorporating LBAPWV into predictive models not only forecasts the occurrence of DPN but also assesses its severity; generally, higher LBAPWV levels correlate with more severe neuropathy and poorer prognosis. Nevertheless, these findings warrant further validation through prospective, multicenter, and large-sample clinical studies in the future.
A particularly noteworthy finding from the SVM model was that hip circumference was identified as a feature associated with a reduced risk of DPN. While previous research has predominantly focused on the WHR, our model retained hip circumference as a predictor after eliminating WHR, yielding significant clinical insights. Numerous studies on DPN have established a high WHR as a significant risk factor for both the onset and severity of neuropathy.24 Prior evidence suggests that a larger hip circumference is associated with a reduced risk of type 2 diabetes.25 This protective effect remains significant even after adjusting for waist circumference, implying that individuals with greater hip girth have a lower diabetes risk, even at comparable levels of central obesity. Mechanistically, gluteal adipose tissue is rich in the adipocytokine adiponectin, which exerts anti-inflammatory, insulin-sensitizing, and vasoprotective effects.26 Furthermore, hip fat serves as a “metabolic buffer”, effectively sequestering free fatty acids and reducing ectopic lipid deposition in nerves and muscle tissue. It must be emphasized that our findings only reflect association, not causation. Our findings do not diminish the importance of central obesity, which remains a well-established risk factor for DPN. These findings suggest that clinical assessments should value hip circumference alongside traditional risk alerts like waist circumference and WHR. For patients with elevated waist circumference, a larger hip circumference may indicate greater metabolic reserves to counteract the detrimental effects of central obesity, potentially conferring a relatively lower risk of DPN. Future DPN risk assessment models should consider incorporating both waist and hip circumferences independently, rather than relying solely on WHR, to achieve more precise individualized risk stratification.
Our study identifies C-peptide 180min as a protective factor against DPN. This aligns with previous evidence indicating that lower C-peptide levels are significantly associated with an elevated risk of DPN.27 C-peptide is known to exert protective effects through multiple mechanisms, including improving endoneurial blood flow,28 repairing nerve structure,29 enhancing neuronal function, and attenuating oxidative stress and inflammation.30 Elevated postprandial C-peptide levels directly reflect robust and sustained β-cell secretory capacity. This physiological advantage enables more effective attenuation of postprandial glycemic excursions, thereby maintaining tighter glycemic control and reducing glucose variability. Consequently, this mitigates the chronic glucotoxicity imposed on peripheral nerves. Our findings provide additional evidence underscoring the pivotal role of C-peptide in the pathogenesis of DPN.
The model identified in-hospital blood glucose values as a risk factor for DPN, a finding that corroborates previous evidence indicating long-term strict glycemic control significantly reduces the risk of DPN onset and progression.31 Furthermore, multiple studies suggest that severe glycemic fluctuations represent an independent risk factor for DPN, even when HbA1c levels are within target ranges.32 Defined as random blood glucose, in-hospital blood glucose can induce toxic damage to peripheral nerves through various complex biochemical pathways. As an indicator reflecting the current level of glucotoxicity exposure, this parameter further underscores the critical importance of maintaining blood glucose stability.
An interesting and important finding from the feature selection process is that although left atrial diameter (LAD) demonstrated a highly significant univariate association with DPN in our cohort (p < 0.001), it was not selected. LAD serves as an indicator of cardiac remodeling and correlates with a spectrum of cardiovascular risk factors, including hypertension, obesity, and systemic arterial stiffness.33 Our model instead selected baPWV, a direct measurement of arterial stiffness, and the UACR, a marker of vascular endothelial dysfunction, alongside established risk factors such as smoking and diabetes duration. Arterial stiffness and endothelial injury are likely upstream pathological processes that drive peripheral nerve damage while concurrently contributing to left atrial enlargement. Therefore, within the multivariate context of the model, the predictive information provided by LAD is highly probable to be subsumed by more direct measures of vascular health, specifically baPWV and UACR. This demonstrates the capacity of machine learning-based feature selection to move beyond simple correlations.
In our initial dataset, we also conducted comprehensive measurements of the standard lipid profile, including total cholesterol, triglycerides, LDL-C, and HDL-C. Univariate analysis demonstrated that lower HDL-C levels were significantly associated with DPN. However, following rigorous multivariate feature selection using the BorutaShap algorithm, these conventional lipid markers were not retained in the final predictive model. This does not negate their biological importance but rather suggests that their predictive signal may be more effectively captured by other, more integrative variables within the model. For example, baPWV serves as a cumulative indicator of long-term vascular impairment, for which chronic dyslipidemia is a primary driver. Similarly, UACR, which reflects microvascular damage, shares pathological pathways with dyslipidemia. Consequently, the predictive impact of dyslipidemia in our model appears to be manifested indirectly.
The true drivers of DPN, including chronic hyperglycemia, systemic inflammation, and oxidative stress, are fundamentally biochemical in nature. Our model indeed integrated key metabolic features, such as Glucose 0min, C-peptide, UACR, and fT3, among others. However, we strongly advocate that future DPN risk prediction models must integrate a comprehensive array of biochemical markers. Such holistic models would not only improve predictive accuracy but also provide deeper mechanistic insights, thereby enabling more targeted and personalized therapeutic interventions.
This study acknowledges several limitations. (1) Our study is subject to the limitations of the diagnostic criteria for DPN. While nerve conduction studies are sensitive to large-fiber dysfunction, they may fail to detect small-fiber neuropathy, resulting in inherent classification bias in the outcome variable. Consequently, the model’s ability to accurately identify patients completely free of neuropathy may be overestimated, and SHAP analysis may underestimate the importance of features strongly associated with small-fiber neuropathy. Future prospective studies should adopt a multimodal diagnostic framework that integrates physical examination, symptom scoring, and assessments of both large- and small-fiber function to establish more robust predictive models. (2) The treatment of missing values relied on mean and mode imputation. More sophisticated approaches, such as Multiple Imputation by Chained Equations (MICE), were not employed to generate more robust estimates. Additionally, sensitivity analyses comparing different imputation strategies were not conducted. (3) Inherent selection bias stemming from the retrospective design is difficult to avoid. Furthermore, as the data were exclusively sourced from Fangshan Hospital of Beijing University of Chinese Medicine without external validation, the generalizability of our findings to other regions remains to be established. Therefore, future investigations should prioritize multicenter collaborations and adopt prospective study designs. Concurrently, conducting external validation and incorporating multidimensional data are crucial for further optimizing model performance and broadening its scope of applicability. (4) Constrained by the available clinical data, our study lacked a comprehensive set of advanced biomarkers, specifically high-sensitivity C-reactive protein (hs-CRP), proinflammatory cytokines, advanced glycation end products (AGEs), and the atherogenic index of plasma (AIP). Future prospective investigations will aim to incorporate these biomarkers. Furthermore, leveraging bioinformatics approaches, these studies will explore the complex interactions among clinical data, imaging markers, and multi-omics data encompassing immune infiltration signatures. This integrated analysis will be crucial for further elucidating the intricate etiology of DPN. (5) Although patients with diabetic nephropathy (DN) were not included in our study cohort, DPN and DN are known to share fundamental pathophysiological mechanisms, including endothelial dysfunction, oxidative stress, and inflammation. Future investigations should therefore adopt a more comprehensive approach by evaluating these microvascular complications concurrently. Such parallel assessment will deepen our understanding of the systemic progression of diabetes and may facilitate the discovery of shared biomarkers and therapeutic targets.
Conclusion
In this study, we developed a machine learning-based DPN prediction model. Comparative analysis demonstrated that the SVM algorithm achieved optimal overall performance. Notably, our model revealed an asymmetry in the predictive importance of bilateral baPWV, with left-sided measurements exhibiting a significantly stronger association with DPN. Furthermore, hip circumference was identified as a potential protective predictor. However, the retrospective design and lack of comprehensive biochemical data represent limitations that must be acknowledged. Therefore, future large-scale, multicenter prospective studies are essential to validate these findings by integrating vascular and anthropometric markers with extensive biochemical parameters. Such efforts will facilitate the construction of more robust, mechanistically informed models for the early prediction and prevention of DPN.
Abbreviations
T2DM, type 2 diabetes mellitus; ML, machine learning; DPN, diabetic peripheral neuropathy; DBP, diastolic blood pressure; SBP, systolic blood pressure; BMI, body mass index; WHR, Waist‑to‑Hip Ratio; HbA1c, glycated hemoglobin; Hb, hemoglobin; RBC, Red Blood Cell; ALT, alanine aminotransferase; AST, aspartate aminotransferase; ALB, albumin; BUN, blood urea nitrogen; Scr, serum creatinine; UA, Uric Acid; TG, triglyceride; TC, total cholesterol; LDL-c, low-density lipoprotein cholesterol; HDL-c, high-density lipoprotein cholesterol; fT3, free triiodothyronine; fT4, free thyroxine; UACR, Urinary Albumin-to-Creatinine Ratio; IMT of RCCA, Intima-Media Thickness of the Right Common Carotid Artery; LABI, Left Ankle-Brachial Index; RABI, Right Ankle-Brachial Index; BAPWV, Brachial-Ankle Pulse Wave Velocity; LBAPWV, Left Brachial-Ankle Pulse Wave Velocity; RBAPWV, Right Brachial-Ankle Pulse Wave Velocity; LAD, Left Atrial Diameter; LVEF, Left Ventricular Ejection Fraction; ROC, Receiver Operating Characteristic; AUC, Area Under the Curve; SHAP, Shapley additive explanations; LR, Logistic Regression; SVM, Support Vector Machine; KNN, K-Nearest Neighbors; DT, Decision Tree; RF, Random Forest; Adaboost, Adaptive Boosting; GB, Gradient Boosting; XGBoost, Extreme Gradient Boosting; LightGBM, Light Gradient Boosting Machine; Sklearn, Scikit-learn.
Data Sharing Statement
The datasets generated during and/or analyzed during the current study are available from the corresponding author on reasonable request.
Ethics Approval and Informed Consent
This study was conducted in accordance with the principles of the Declaration of Helsinki and was approved by the Ethics Committee of Fangshan Hospital of Beijing University of Chinese Medicine (approval number: FZY LK-2026-014). Patient privacy information was strictly protected. As no personal patient information was collected, the requirement for informed consent was waived by the Ethics Committee.
Acknowledgments
The authors gratefully acknowledge the Endocrinology Department of Fangshan Hospital, Beijing University of Chinese Medicine, for its help and support in this study. Simultaneously, we extend our gratitude to the statistical experts for their assistance.
Author Contributions
All authors made a significant contribution to the work reported, whether that is in the conception, study design, execution, acquisition of data, analysis and interpretation, or in all these areas; took part in drafting, revising or critically reviewing the article; gave final approval of the version to be published; have agreed on the journal to which the article has been submitted; and agree to be accountable for all aspects of the work.
Funding
This study was supported by the Research Project on Collaborative Management of Chronic Diseases with Integrated Traditional Chinese and Western Medicine: A Real-World Study on the Evaluation of Insulin Sensitivity in Diabetic Patients with Integrated Traditional Chinese and Western Medicine (CXZH2024097).
Disclosure
The authors report no conflicts of interest in this work.
References
1. Sun H, Saeedi P, Karuranga S, et al. IDF diabetes atlas: global, regional and country-level diabetes prevalence estimates for 2021 and projections for 2045. Diabetes Res Clin Pract. 2022;183:109119. doi:10.1016/j.diabres.2021.109119
2. Liu Z, Fu C, Wang W, Xu B. Prevalence of chronic complications of type 2 diabetes mellitus in outpatients - a cross-sectional hospital based survey in urban China. Health Qual Life Outcomes. 2010;8:62. doi:10.1186/1477-7525-8-62
3. Ko SH, Ko SH. Letter: diabetic polyneuropathy and cardiovascular complications in type 2 diabetic patients (diabetes metab j 2011;35:390-6). Diabetes Metab J. 2011;35(5):558–17. doi:10.4093/dmj.2011.35.5.558
4. Tavakoli M, Gogas Yavuz D, Tahrani AA, Selvarajah D, Bowling FL, Fadavi H. Diabetic neuropathy: current status and future prospects. J Diabetes Res. 2017;2017:5825971. doi:10.1155/2017/5825971
5. Jensen TS, Karlsson P, Gylfadottir SS, et al. Painful and non-painful diabetic neuropathy, diagnostic challenges and implications for future management. Brain. 2021;144(6):1632–1645. doi:10.1093/brain/awab079
6. Diamant M, Lamb HJ, van de Ree MA, et al. The association between abdominal visceral fat and carotid stiffness is mediated by circulating inflammatory markers in uncomplicated type 2 diabetes. J Clin Endocrinol Metab. 2005;90(3):1495–1501. doi:10.1210/jc.2004-1579
7. Christensen DH, Knudsen ST, Gylfadottir SS, et al. Metabolic factors, lifestyle habits, and possible polyneuropathy in early type 2 diabetes: a nationwide study of 5249 patients in the danish centre for strategic research in type 2 diabetes (DD2) cohort. Diabetes Care. 2020;43(6):1266–1275. doi:10.2337/dc19-2277
8. Obrosova IG. Diabetes and the peripheral nerve. Biochim Biophys Acta. 2009;1792(10):931–940. doi:10.1016/j.bbadis.2008.11.005
9. Khan S, Ahmad S, Khan M, Lohani M, Khan MS, Haneef M. Diabetic peripheral neuropathy: navigating controversies and pioneering advances. Adv Life Sci. 2025;12(1):01–12. doi:10.62940/als.v12i1.3627
10. Levitt Katz LE, White NH, El Ghormli L; TODAY Study Group. Risk factors for diabetic peripheral neuropathy in adolescents and young adults with type 2 diabetes: results from the TODAY study. Diabetes Care. 2021;45(5):1065–1072. doi:10.2337/dc21-1074
11. Baskozos G, Themistocleous AC, Hebert HL, et al. Classification of painful or painless diabetic peripheral neuropathy and identification of the most powerful predictors using machine learning models in large cross-sectional cohorts. BMC Med Inform Decis Mak. 2022;22(1):144. doi:10.1186/s12911-022-01890-x
12. Hicks CW, Selvin E. Epidemiology of peripheral neuropathy and lower extremity disease in diabetes. Curr Diab Rep. 2019;19(10):86. doi:10.1007/s11892-019-1212-8
13. Zhang W, Chen L. A nomogram for predicting the possibility of peripheral neuropathy in patients with type 2 diabetes mellitus. Brain Sci. 2022;12(10):1328. doi:10.3390/brainsci12101328
14. Lian X, Qi J, Yuan M, et al. Study on risk factors of diabetic peripheral neuropathy and establishment of a prediction model by machine learning. BMC Med Inform Decis Mak. 2023;23(1):146. doi:10.1186/s12911-023-02232-1
15. Wu B, Niu Z, Hu F. Study on risk factors of peripheral neuropathy in type 2 diabetes mellitus and establishment of prediction model. Diabetes Metab J. 2021;45(4):526–538. doi:10.4093/dmj.2020.0100
16. Wei Z, Wang X, Lu L, et al. Construction of an early risk prediction model for type 2 diabetic peripheral neuropathy based on random forest. Comput Inform Nurs. 2024;42(9):665–674. doi:10.1097/CIN.0000000000001157
17. Luo L, Long X, Cheng C, Xu Q, Li J. Development and validation of a risk nomogram model for predicting peripheral neuropathy in patients with type 2 diabetes mellitus. Front Endocrinol. 2024;15:1338167. doi:10.3389/fendo.2024.1338167
18. Tian Z, Fan Y, Sun X, et al. Predictive value of TCM clinical index for diabetic peripheral neuropathy among the type 2 diabetes mellitus population: a new observation and insight. Heliyon. 2023;9(6):e17339. doi:10.1016/j.heliyon.2023.e17339
19. Ha BK, Kim BG, Kim DH, et al. Relationships between brachial-ankle pulse wave velocity and peripheral neuropathy in type 2 diabetes. Diabetes Metab J. 2012;36(6):443–451. doi:10.4093/dmj.2012.36.6.443
20. Wang Y, Liu P, Shang C, et al. Association of brachial-ankle pulse wave velocity with subclinical diabetic peripheral neuropathy in patients with type 2 diabetes mellitus. J Diabetes Investig. 2025;16(5):874–883. doi:10.1111/jdi.70008
21. Aso K, Miyata M, Kubo T, et al. Brachial-ankle pulse wave velocity is useful for evaluation of complications in type 2 diabetic patients. Hypertens Res. 2003;26(10):807–813. doi:10.1291/hypres.26.807
22. Schillaci G, Pucci G. Lower-limb pulse wave velocity: correlations and clinical value. Hypertens Res. 2013;36(8):679–681. doi:10.1038/hr.2013.47
23. Sheikh MM, Balachandra M, N VG, Maiya AG. Predicting diabetic peripheral neuropathy through advanced plantar pressure analysis: a machine learning approach. Sci Rep. 2025;15(1):20962. doi:10.1038/s41598-025-07774-0
24. Dhillon S, Fithrie A, Batubara CA. The association between waist Hip ratio and severity of diabetic peripheral neuropaty in diabetes melitus type 2 by using toronto clinical scoring system. J Soc Med. 2023;2(4):107–116. doi:10.47353/jsocmed.v2i4.47
25. Parker ED, Pereira MA, Stevens J, Folsom AR. Association of hip circumference with incident diabetes and coronary heart disease: the atherosclerosis risk in communities study. Am J Epidemiol. 2009;169(7):837–847. doi:10.1093/aje/kwn395
26. Snijder MB, Dekker JM, Visser M, et al. Trunk fat and leg fat have independent and opposite associations with fasting and postload glucose levels: the Hoorn study. Diabetes Care. 2004;27(2):372–377. doi:10.2337/diacare.27.2.372
27. Fu Y, Xing Y, Yang L, Liu J, Ma H. Relationship between fasting c-peptide to diabetes duration ratio (FCP/DD) and diabetic peripheral neuropathy. Diabetes Metab Syndr Obes. 2024;17:4469–4477. doi:10.2147/DMSO.S491560
28. Sloan G, Selvarajah D, Tesfaye S. Pathogenesis, diagnosis and clinical management of diabetic sensorimotor peripheral neuropathy. Nat Rev Endocrinol. 2021;17(7):400–420. doi:10.1038/s41574-021-00496-z
29. Wahren J, Foyt H, Daniels M, Arezzo JC. Long-acting C-peptide and neuropathy in type 1 diabetes: a 12-month clinical trial. Diabetes Care. 2016;39(4):596–602. doi:10.2337/dc15-2068
30. Liu X, Hu J. Association of serum magnesium level with small fiber neuropathy in patients with type 2 diabetes. Front Med. 2025;12:1509820. doi:10.3389/fmed.2025.1509820
31. AlShareef AA, Alrawaili MS, Almutairi SA, Ayyad MM, Alshora W. Association of hematological parameters and diabetic neuropathy: a retrospective study. Diabetes Metab Syndr Obes. 2024;17:779–793. doi:10.2147/DMSO.S453766
32. Jia Y, Long D, Yang Y, Wang Q, Wu Q, Zhang Q. Diabetic peripheral neuropathy and glycemic variability assessed by continuous glucose monitoring: a systematic review and meta-analysis. Diabetes Res Clin Pract. 2024;213:111757. doi:10.1016/j.diabres.2024.111757
33. Raisi-Estabragh Z, McCracken C, Condurache D, et al. Left atrial structure and function are associated with cardiovascular outcomes independent of left ventricular measures: a UK Biobank CMR study. Eur Heart J Cardiovasc Imaging. 2022;23(9):1191–1200. doi:10.1093/ehjci/jeab266
 © 2026 The Author(s). This work is published and licensed by Dove Medical Press Limited. The
full terms of this license are available at https://www.dovepress.com/terms
and incorporate the Creative Commons Attribution
- Non Commercial (unported, 4.0) License.
By accessing the work you hereby accept the Terms. Non-commercial uses of the work are permitted
without any further permission from Dove Medical Press Limited, provided the work is properly
attributed. For permission for commercial use of this work, please see paragraphs 4.2 and 5 of our Terms.
© 2026 The Author(s). This work is published and licensed by Dove Medical Press Limited. The
full terms of this license are available at https://www.dovepress.com/terms
and incorporate the Creative Commons Attribution
- Non Commercial (unported, 4.0) License.
By accessing the work you hereby accept the Terms. Non-commercial uses of the work are permitted
without any further permission from Dove Medical Press Limited, provided the work is properly
attributed. For permission for commercial use of this work, please see paragraphs 4.2 and 5 of our Terms.
Recommended articles

Development of Machine Learning Models for Predicting Osteoporosis in Patients with Type 2 Diabetes Mellitus—A Preliminary Study
Wu X, Zhai F, Chang A, Wei J, Guo Y, Zhang J
Diabetes, Metabolic Syndrome and Obesity 2023, 16:1987-2003
Published Date: 30 June 2023
Prediction of the Risk of Bone Mineral Density Decrease in Type 2 Diabetes Mellitus Patients Based on Traditional Multivariate Logistic Regression and Machine Learning: A Preliminary Study
Zhang J, Xu Z, Fu Y, Chen L
Diabetes, Metabolic Syndrome and Obesity 2023, 16:2885-2898
Published Date: 19 September 2023
Application of Interpretable Machine Learning Models Based on Ultrasonic Radiomics for Predicting the Risk of Fibrosis Progression in Diabetic Patients with Nonalcoholic Fatty Liver Disease
Meng F, Wu Q, Zhang W, Hou S
Diabetes, Metabolic Syndrome and Obesity 2023, 16:3901-3913
Published Date: 2 December 2023
Prediction of Acute Kidney Injury in Intracerebral Hemorrhage Patients Using Machine Learning
She S, Shen Y, Luo K, Zhang X, Luo C
Neuropsychiatric Disease and Treatment 2023, 19:2765-2773
Published Date: 11 December 2023
A Machine-Learning Model Based on Clinical Features for the Prediction of Severe Dysphagia After Ischemic Stroke
Ye F, Cheng LL, Li WM, Guo Y, Fan XF
International Journal of General Medicine 2024, 17:5623-5631
Published Date: 28 November 2024