Back to Journals » Diabetes, Metabolic Syndrome and Obesity » Volume 16
Development of Machine Learning Models for Predicting Osteoporosis in Patients with Type 2 Diabetes Mellitus—A Preliminary Study
Authors Wu X ![]() , Zhai F
, Zhai F ![]() , Chang A, Wei J, Guo Y, Zhang J
, Chang A, Wei J, Guo Y, Zhang J
Received 16 February 2023
Accepted for publication 22 June 2023
Published 30 June 2023 Volume 2023:16 Pages 1987—2003
DOI https://doi.org/10.2147/DMSO.S406695
Checked for plagiarism Yes
Review by Single anonymous peer review
Peer reviewer comments 3
Editor who approved publication: Prof. Dr. Antonio Brunetti
Xuelun Wu,1 Furui Zhai,2 Ailing Chang,1 Jing Wei,1 Yanan Guo,1 Jincheng Zhang1
1Department of Endocrinology, Cangzhou Central Hospital, Cangzhou City, Hebei Province, People’s Republic of China; 2Gynecological Clinic, Cangzhou Central Hospital, Cangzhou City, Hebei Province, People’s Republic of China
Correspondence: Xuelun Wu, Department of Endocrinology, Cangzhou Central Hospital, 16 Xinhua West Road, Cangzhou City, Hebei Province, People’s Republic of China, Tel +86-317-2075501, Email [email protected]
Purpose: Diagnosing osteoporosis in T2DM based on bone mineral density (BMD) remains challenging. We sought to develop prediction models employing machine learning algorithms for use as screening instruments for osteoporosis in T2DM patients.
Patients and Methods: Data were collected from 433 participants and analyzed using nine categorical machine learning algorithms to select features based on demographic and clinical variables. Multiple classification models were compared using the area under the receiver operating characteristic curve (ROC-AUC), accuracy, sensitivity, specificity, the average precision (AP), precision, F1 score, precision-recall curves, calibration plots, and decision curve analysis (DCA) to determine the best model. In addition, 5-fold cross-validation was utilized to optimize the model, followed by an evaluation of feature significance using Shapley Additive exPlanations (SHAP). Using latent class analysis (LCA), distinct subpopulations were identified by constructing several discrete clusters.
Results: In this study, nine feature variables were identified to construct predictive models for osteoporosis in individuals with T2DM. The machine learning algorithms achieved an AP range of 0.444– 1.000. The XGBoost model was selected as the final prediction model with an AUROC of 0.940 in the training set, 0.772 in the validation set for 5-fold cross-validation, and 0.872 in the test set. Using SHAP methodology, 25(OH)D was identified as the most important risk factor. Additionally, a 3-Class model was constructed using LCA, which categorized individuals into high, medium, and low-risk groups.
Conclusion: Our study developed a predictive model with high accuracy and clinical validity for predicting osteoporosis in type 2 diabetes patients. We also identified three subpopulations with varying osteoporosis risk using clustering. However, limited sample size warrants cautious interpretation of results, and validation in larger cohorts is needed.
Keywords: type 2 diabetes mellitus, osteoporosis, prediction model, machine learning, latent class analysis
Introduction
Type 2 diabetes mellitus (T2DM) and osteoporosis are chronic conditions associated with high rates of morbidity and mortality. As the world’s population ages, their incidence will soon become a global pandemic that will place a strain on healthcare systems.1 In recent years, scholarly consensus has emerged regarding the relationship between diabetes and osteoporosis. The increasing prevalence of osteoporosis in patients with diabetes mellitus (DM) has led physicians to identify osteoporosis, along with the associated bone fragility and fracture risk, as the most severe complication of type 2 diabetes.2 Consequently, due to the severity of diabetic osteoporosis (DO), which differs from common osteoporosis, it is essential to identify and diagnose osteoporosis in T2DM early and adequately to prevent further symptoms and impairments.
However, due to the complexity and multifactorial nature of the pathophysiological mechanisms relating to DO, osteoporosis in type 2 diabetes is difficult to diagnose. Although dual-energy X-ray absorptiometry (DXA), which measures bone mineral density (BMD), is the gold standard for detecting osteoporosis, confirming its presence, and predicting the likelihood of future fractures, DXA, as well as other bone mineral density (BMD)-based assessments may not be adequate for diagnosing certain DO subtypes.3 In addition, BMD frequently varies irregularly at various stages of type 2 diabetes development, compounding the difficulty of using BMD alone as a diagnostic criterion for osteoporosis.4,5 Therefore, the development more precise and accessible methods for assessing osteoporosis in these T2DM patients is highly essential.
Multiple pathophysiological mechanisms have been associated with bone mass loss in T2DM.1 However, the potential risk factors for osteoporosis in Chinese T2DM patients, such as gender, age, body mass index (BMI), diet, habits, blood glucose level, glycosylated hemoglobin (GHb), serum lipids, disease course, the presence of T2DM-related chronic complications, and medication, remain controversial and inconclusive. Given the possibility of developing a predictive model, precise estimates of osteoporosis risk factors among Chinese diabetics require further research.6
With their flexible modeling capabilities and ability to detect more complex relationships between input features and outputs, machine learning (ML) algorithms have recently been implemented in various medical settings, thereby enhancing prediction performance.7,8 Several ML models in osteoporosis have been developed, with a focus on elderly or postmenopausal women in order to predict osteoporosis using more readily available data.9 Yoo et al10 compared four popular machine learning models with four traditional osteoporosis prediction models. They concluded that the support vector machine (SVM) model achieved the best predictive performance with 76.8% accuracy, 64.8% positive predictive value (PPV), and an area under the curve (AUC) of 0.827 using 15 clinical factors at any site in 1674 postmenopausal women. Shim et al11 targeted 1792 postmenopausal women and developed seven machine learning models for comparison. The artificial neural network (ANN) model showed the best performance with an AUC of 0.743. Park et al12 assessed three machine learning models using 20 features extracted from extreme gradient boosting (XGBoost) to predict osteoporosis in 2210 men and 1099 women. XGBoost showed the best performance with AUC of 0.73 in men and 0.79 in women. However, this study focused mainly on individuals under the recommended age group. Yang et al13 reported better predictive performance of five machine learning models, including ANN, SVM, random forest (RF), k-nearest neighbors (KNN), and logistic regression (LR), compared to the traditional model (OSTA) in 3053 men and 2929 women using 16 and 19 input features, respectively. More recently, ML algorithms have been applied to predict osteoporosis risk in T2DM (Table S1). Recent research by Pan et al,14 utilized the least absolute shrinkage and selection operator regularization (LASSO) model to develop a risk assessment tool for detecting osteoporosis in older women with T2DM based on age, BMI, serum sex hormone-binding globulin (SHBG), and CTX. In another SVM (support vector machine) model developed by Wang et al,15 based on sex, age, BMI (body mass index), TP1NP (total procollagen I N-terminal propeptide), and OSTEOC (osteocalcin), the accuracy of the final model in predicting osteoporosis was greater than 88%. Alam et al16 developed a machine learning (ML) model that uses bone mass, fat mass, lean mass, anthropometric measurements, and bone mineral content (BMC) to distinguish diabetic patients with osteoporosis or osteopenia from diabetic patients without these conditions. The model’s performance surpasses that of conventional models. However, it should be noted that the model’s extrapolation is limited to a single algorithm, a specific population, and a single feature selection.
The current study aims to develop optimal prediction models employing a variety of ML algorithms that have been extensively utilized in decision-making processes. These include: XGBoost, LR, Light Gradient Boosting Machine (LightGBM), RF, Adaptive Boosting (AdaBoost), Gaussian Naive Bayes (Gaussian NB), Multilayer Perceptron (MLP), SVM, and KNN. Correspondingly, they were used for detecting osteoporosis in T2DM patients, including men and women, using readily available input features such as physical characteristics, personal and medical history, and laboratory tests. Meanwhile, the important variables were evaluated using SHapley Additive exPlanation (SHAP), and Latent class analysis (LCA) was used on the basis of risk factors to identify the subpopulation with a high risk of incident osteoporosis to account for heterogeneity in type 2 diabetic patients. By using predictive models as screening tools in clinical practice, patients and physicians can better assess the risk of developing osteoporosis and take preventative measures to avoid unnecessary complications. The contribution of this work can be summarized as follows:
- We developed and validated our models in both men and women with type 2 diabetes by performing feature filtering, classification multi-model comparison, and internal cross-validation.
- The SHAP method enables an interpretation of the individual value of the variables.
- Using a novel person-centered approach of LCA, we classified patients with T2DM into three osteoporosis risk classes based on demographic and clinical variables.
Materials and Methods
Study Population
The study was conducted at the Department of Endocrinology at Cangzhou Central Hospital between January 2019 and December 2020 with approval from the hospital’s ethical committee. The study involved 433 patients diagnosed with T2DM, out of which 121 were diagnosed with osteoporosis while 312 did not have osteoporosis. In addition, the World Medical Association Declaration of Helsinki and ethical guidelines for human research were stringently followed during the course of this study. Accordingly, physical characteristics, personal and medical histories of patients, laboratory results, and other clinically relevant data on T2DM were obtained retrospectively.
Inclusion and Exclusion Criteria
For enrollment, the following inclusion and exclusion criteria were used: age greater than 45 and individuals diagnosed with T2DM, according to the World Health Organization (WHO 1999);17 (c) individuals diagnosed with OP based on the diagnostic criteria recommended in the Guidelines for the Diagnosis and Treatment of Osteoporosis in the Elderly in China.18 In addition, patients with the following characteristics were excluded from this study: (a) patients with acute diabetic complications; (b) patients with bone metabolism and sex hormone disorders like thyroid disease, parathyroid disease, Cushing syndrome, and hypogonadism; (c) patients with severe chronic diseases like rheumatoid arthritis, chronic kidney disease stage 4 or 5, liver cirrhosis, digestive tract diseases, and malignant tumors; (d) pharmacotherapy, which may include glucocorticoids, hormonal therapy, alfacalcidol, calcitonin, and bisphosphonates; (e) patients with mobility issues, age-related infirmity, communication barriers, and inability to cooperate with various examinations. Participants with T2DM who exhibited risk factors for osteoporosis, including advanced age, low body mass index, smoking, alcohol consumption, physical inactivity, malnutrition, longer duration of diabetes, poor glycemic control or significantly reduced bone mass, were selected and measured using DXA.
Anthropometry and Biochemical Measurements
All participants underwent anthropometric and biochemical evaluations. Correspondingly, the data on the duration of diabetes, height, weight, BMI, and blood pressure were gathered. BMI was calculated using the following formula:  . All overnight fasting blood samples were collected in the morning. The serum samples were separated by centrifugation and then stored at −80°C. Standard techniques were utilized to measure alanine aminotransferase (ALT), aspartate aminotransferase (AST), serum creatinine (Cre), urea nitrogen (Urea), fasting blood glucose (FBG), fasting blood insulin (FINS), fasting blood C-peptide, hemoglobin A1c (HbA1c), total cholesterol (TC), triglyceride (TG), high-density lipoprotein cholesterol (HDL-C), low-density lipoprotein cholesterol (LDL-C), serum calcium, and serum phosphorus. In addition, serum 25-(OH)D was quantified using an automated Roche electrochemiluminescence system (Roche Diagnostics, Basel, Switzerland). The threshold levels for deficiency, insufficiency, and sufficiency of 25(OH)D were defined as follows: less than 12 ng/mL (30 nmol/L) for deficiency, between 12 and 30 ng/mL (30 and 75 nmol/L) for insufficiency, and above 30 ng/mL (> 75 nmol/L) for sufficiency.19 Furthermore, HOMA-IR was calculated using the following formula:
  . In addition, the estimated glomerular filtration rate (eGFR) was calculated from the MDRD-GFR formula.20 Because it was a retrospective study, informed consent was not required, and the data were analyzed anonymously.
Feature Selection
The 31 potential factors, which include demographic and clinical variables, are presented in Table 1. In the process of feature selection, we ranked the significance of all variables based on the model coefficients using nine categorical ML algorithms. These include Extreme Gradient Boosting (XGBoost), Logistic Regression (LR), Light Gradient Boosting Machine (LightGBM), Random Forest (RF), Adaptive Boosting (AdaBoost), Gaussian Naive Bayes (Gaussian NB), Multilayer Perceptron (MLP), support vector machine (SVM), and K nearest neighbors (KNN), which in turn filtered the independent variables by the frequency of their occurrence and applied them to the subsequent formal modeling.
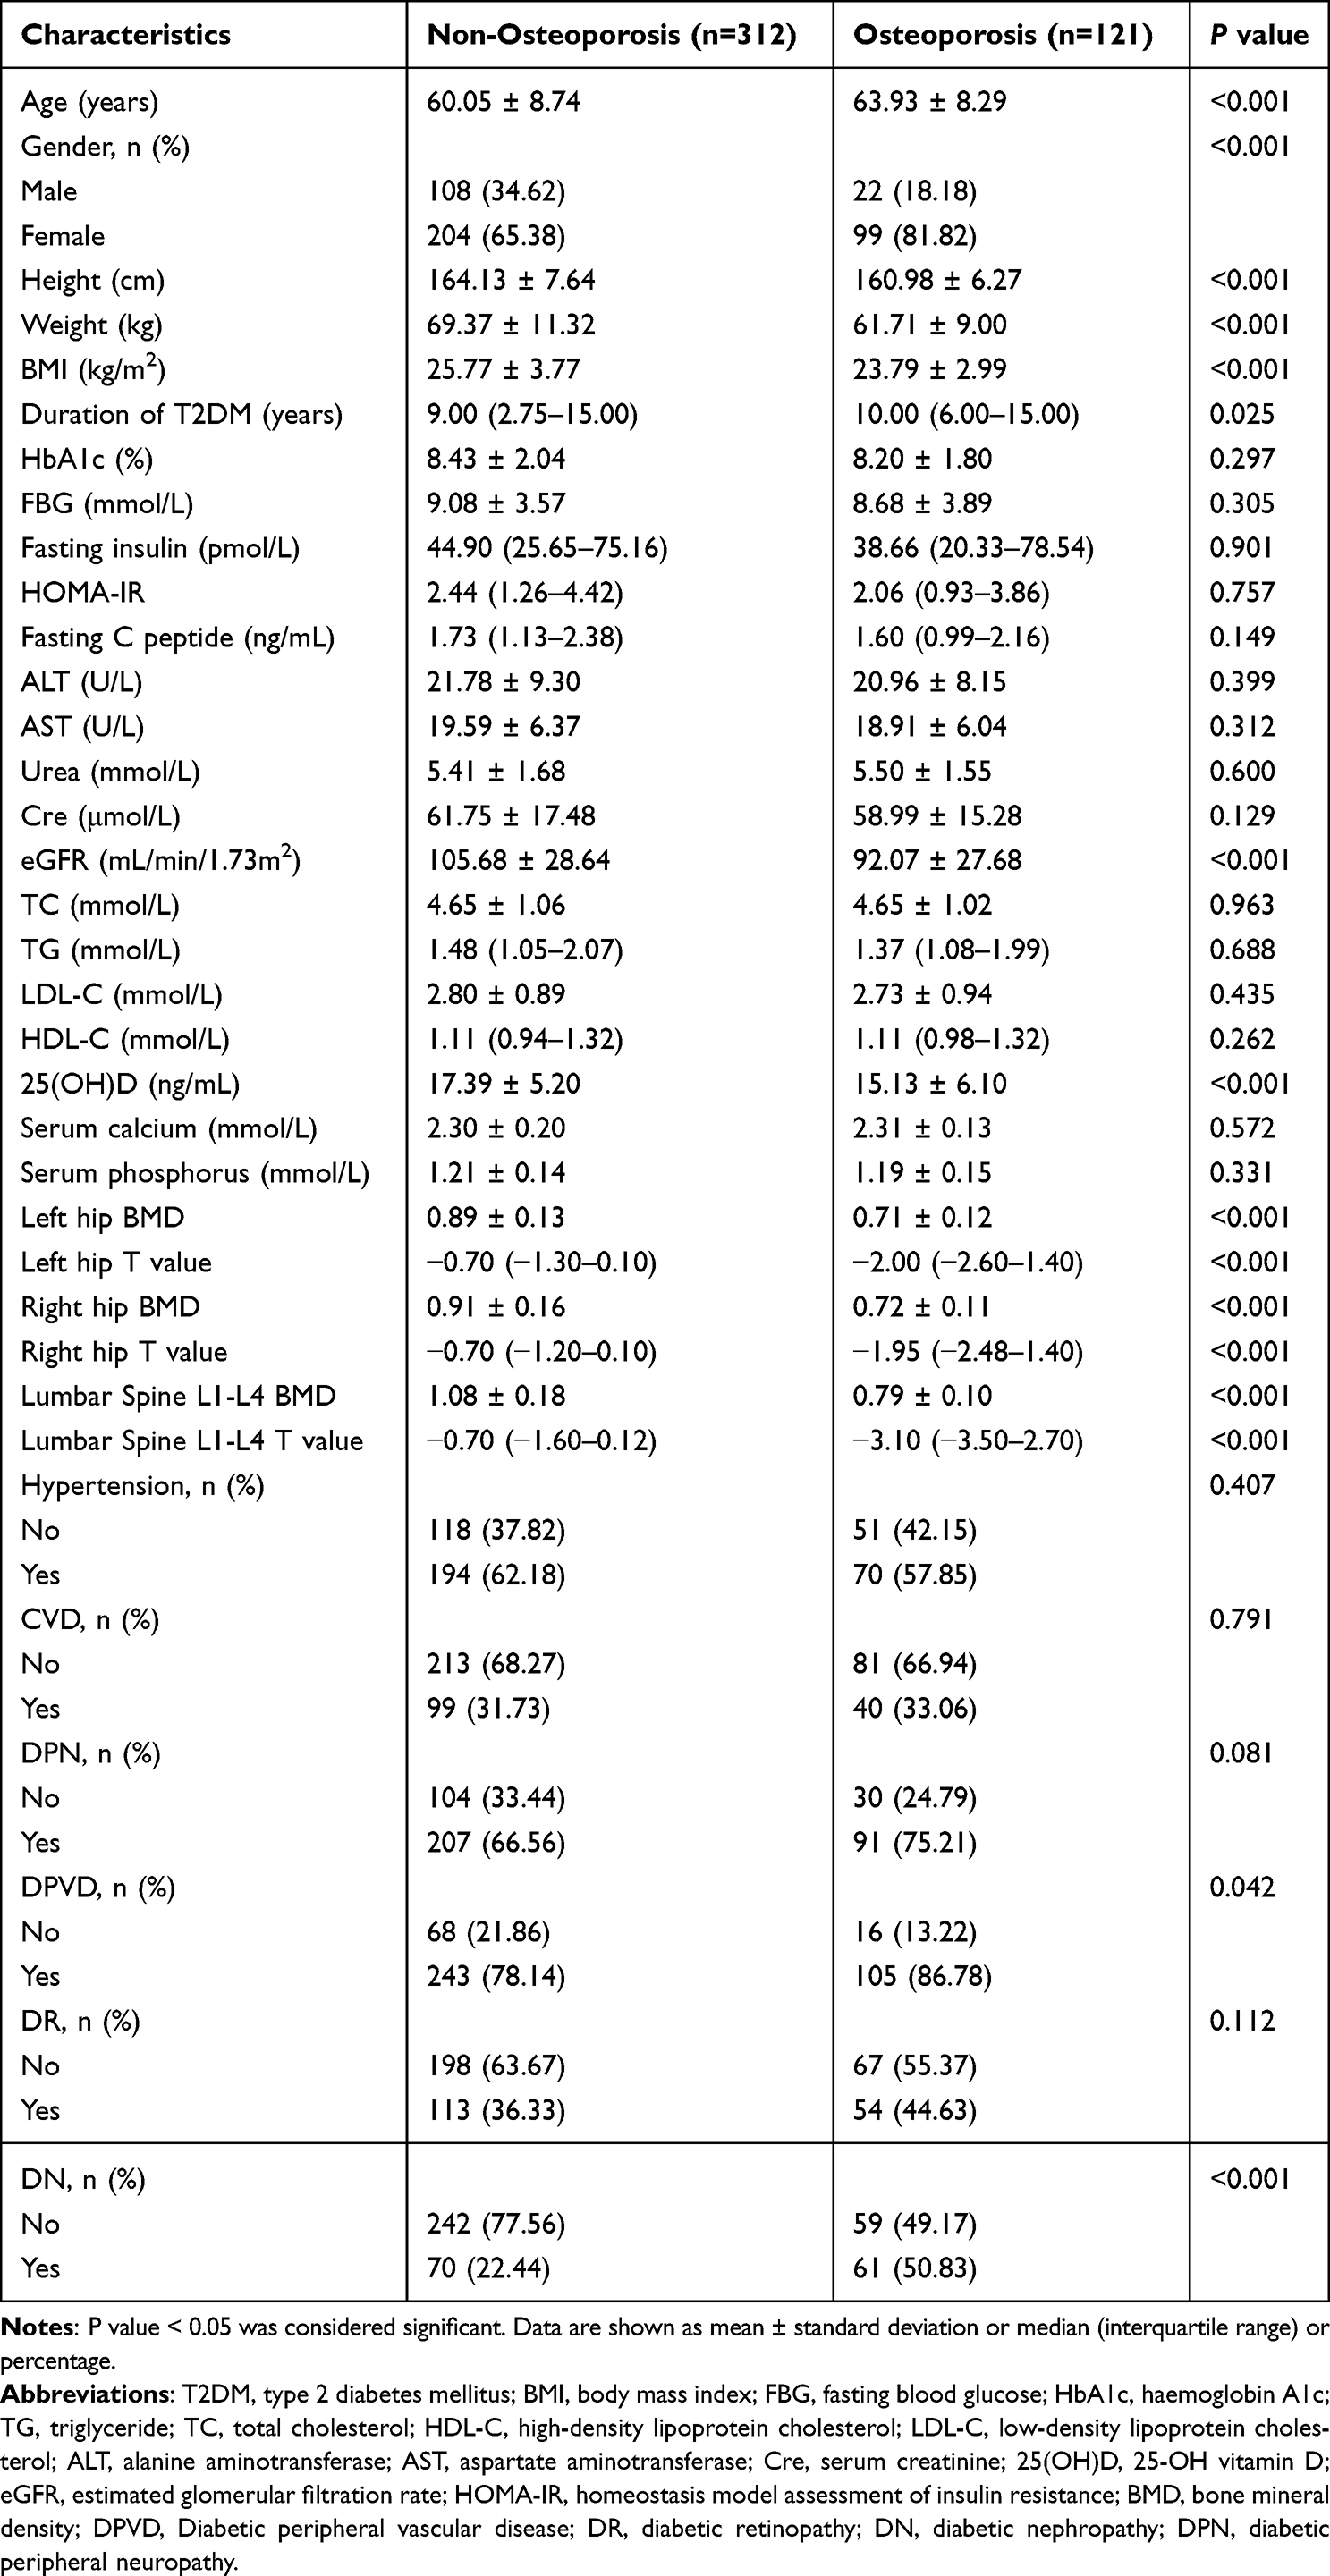 |
Table 1 Comparison of Baseline Characteristics Between Non-Osteoporosis and Osteoporosis Groups in T2DM |
Model Building
We adopted a resampling technique for training and validating the classification ML models. All patients were randomly assigned to a training and test group with a ratio of 8:2. To determine the optimal model, the area under the receiver operating characteristic curve (ROC-AUC), accuracy, sensitivity, specificity, the average precision (AP), precision, F1 score, precision-recall curves, calibration plots, and decision curve analysis (DCA) were utilized to evaluate the prediction performance of these models.
Model Optimization and Feature Importance Analyses
To ensure the stability of the model, a 5-fold cross-validation was conducted to evaluate the model’s predictive ability. The training set was randomly divided into five groups. In each iteration of the 5-fold cross-validation, four groups were selected at random for training, while the remaining group served as the validation set. Prior to that, the accuracy of the models was evaluated by randomly selecting 15% of the training dataset during each model-training session. Subsequently, model discrimination was quantified utilizing ROC curve analysis, and predictive accuracy was assessed using the obtained AUCs and calibration plots. Additionally, decision curve analysis (DCA) was implemented to determine clinical utility and net benefit. Furthermore, the feature significance was evaluated using Shapley Additive Explanations (SHAP). Both positive and negative SHAP values indicate the direction in which each variable value contributes to the model’s decision.
Clustering Methods
We employed Latent Class Analysis (LCA) to generate discrete clusters of T2DM patients based on selected essential features in order to identify a unique subpopulation at high risk of developing incident osteoporosis. LCA proved to be a valuable method for categorizing individuals based on their distinguishable response patterns.21 We conducted a range of models with one to four classes to determine the optimal number of classes. The selection of the best model was based on various model fit indicators such as the Bayesian information criterion (BIC) and Akaike information criterion (AIC), where a decreasing number indicates a better model fit. The number of subjects assigned to each class was also considered, as a small number may not represent a clinically significant subgroup. Additionally, we used entropy values to assess class separation, where values greater than or equal to 0.80 indicated good class separation. Finally, we employed the Vuong-Lo-Mendell-Rubin (VLMR) test to determine if k classes fit the data better than k-1.22
After determining the appropriate number of classes, we allocated study participants to their respective classes and analyzed their baseline characteristics using ANOVA, Kruskal Wallis H (for continuous variables) or the chi-squared test (for categorical variables). Furthermore, we utilized the chosen machine learning model to compute the osteoporosis risk probability for each type 2 diabetes patient and compared the risk probabilities (as a continuous variable) across various classes.
Statistical Analysis
The unpaired t-test or the Mann–Whitney U-test, as applicable, was used to analyze continuous variables presented as mean, standard deviation, median, and interquartile range. To analyze categorical variables expressed as absolute number (n) and relative frequency (%), either the chi-square test or Fisher’s exact test was utilized. All classification models were implemented using Python 3.7 with the packages “xgboost 1.2.1” for XGBoost, “lightgbm 3.2.1” for LightGBM, and “sklearn 0.22.1” for others. LCA was performed using the statistical software package R (http://www.R-project.org, The R Foundation) and Empower-Stats (http://www.empowerstats.com, X&Y Solutions, Inc., Boston, MA). Correspondingly, statistical differences with p <0.05 were considered to be significant.
Results
Baseline Characteristics of Non-Osteoporosis and Osteoporosis Patients with T2DM
According to the inclusion and exclusion criteria, 433 patients with T2DM were finally included to this study (Figure 1). The patients were divided into two groups, non-osteoporosis (n = 312) and osteoporosis (n = 121), based on the diagnostic criteria for osteoporosis discussed previously. Table 1 lists the anthropometric, biochemical, and clinical characteristics of the investigated population. There were significant differences in anthropometric parameters (Age, gender distribution, height, and weight), duration of T2DM, related indices (BMI and eGFR), prevalence of vascular diseases [diabetic peripheral vascular disease (PDVD) and diabetic nephropathy (DN)], and vitamin D status 25(OH)D between the non-osteoporosis and osteoporosis groups. Other biochemical biomarkers demonstrated no significant differences. Compared to the non-osteoporosis group, T2DM patients with osteoporosis were significantly older, female, had T2DM for a longer duration, and demonstrated a higher proportion of PDVD and DN, a lower 25(OH)D level, as well as lower height, weight, BMI, and eGFR (P <0.05).
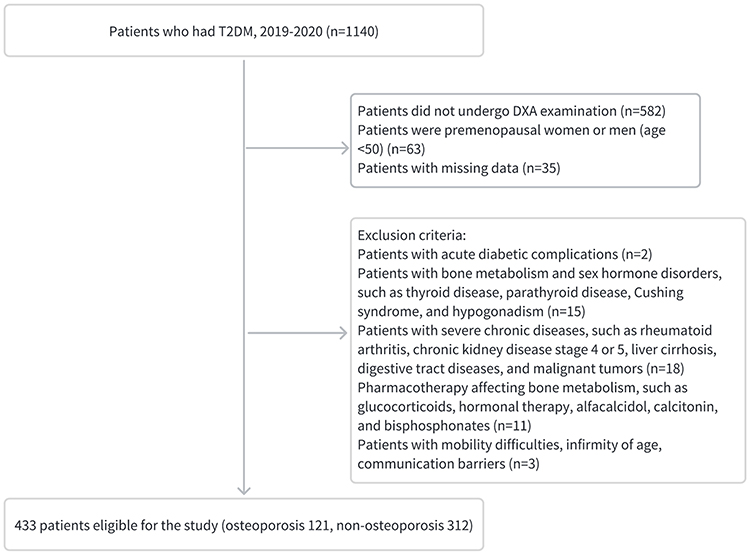 |
Figure 1 Flow diagram of participant enrollment. |
Feature Selection
Table 1 displays the potential variables for predicting osteoporosis risk in T2DM patients. To filter the independent variables for the final modeling for osteoporosis risk assessment, nine ML algorithms were used to rank the variables by calculating the score for each variable to select the ten highest scoring variables. Figure 2A–G successfully displays the outcomes of seven algorithms, including AdaBoost, KNN, LR, XGBoost, Gaussian NB, RF, and SVM. In each model, the significance of high-ranking variables was arranged in a descending order. Finally, we identified nine variables [BMI, Age, Gender, HbA1c, homeostasis model assessment of insulin resistance (HOMA-IR), eGFR, LDL-C, 25(OH)D, and DN] based on the frequency with which they occurred in the results, as well as their clinical value and interrelationships.
 |
Figure 2 Relative importance ranking of each input variable for prediction of diabetic osteoporosis in the machine learning algorithms. (A) Adaptive Boosting. (B) k-nearest neighbors. (C) Logistic Regression. (D) Extreme Gradient Boosting. (E) Gaussian Naive Bayes. (F) Random Forest. (G) Support vector machine. |
The Performance of Prediction Models
Comparisons of the prediction performance of the nine ML algorithm models in the training and validation sets are summarized in Table 2 and Table 3, and Figure 3. The ROC curves for various machine learning models for osteoporosis in training and validation sets are compared in Figure 3A and B, while the precision-recall curves for the same models are compared in Figure 3E and F. The nine machine learning algorithms achieved AP of 0.444–1.000 for predicting osteoporosis in individuals with T2DM. Among all models, the random forest (ranked by AP) performed best in the training set, whereas XGBoost performed best in the verification set. However, both the models were found to be inconsistent. Random Forest was most likely to be susceptible to overfitting, whereas XGBoost was likely to be relatively stable. As a result, calibration plots (Figure 3C) were constructed to determine the accuracy of our models. In addition, decision curve analysis (Figure 3D) of the nine models was subsequently conducted, showing that most of the models achieved net clinical benefit against a treat all-or none plan. Accordingly, XGBoost was selected as the final prediction model.
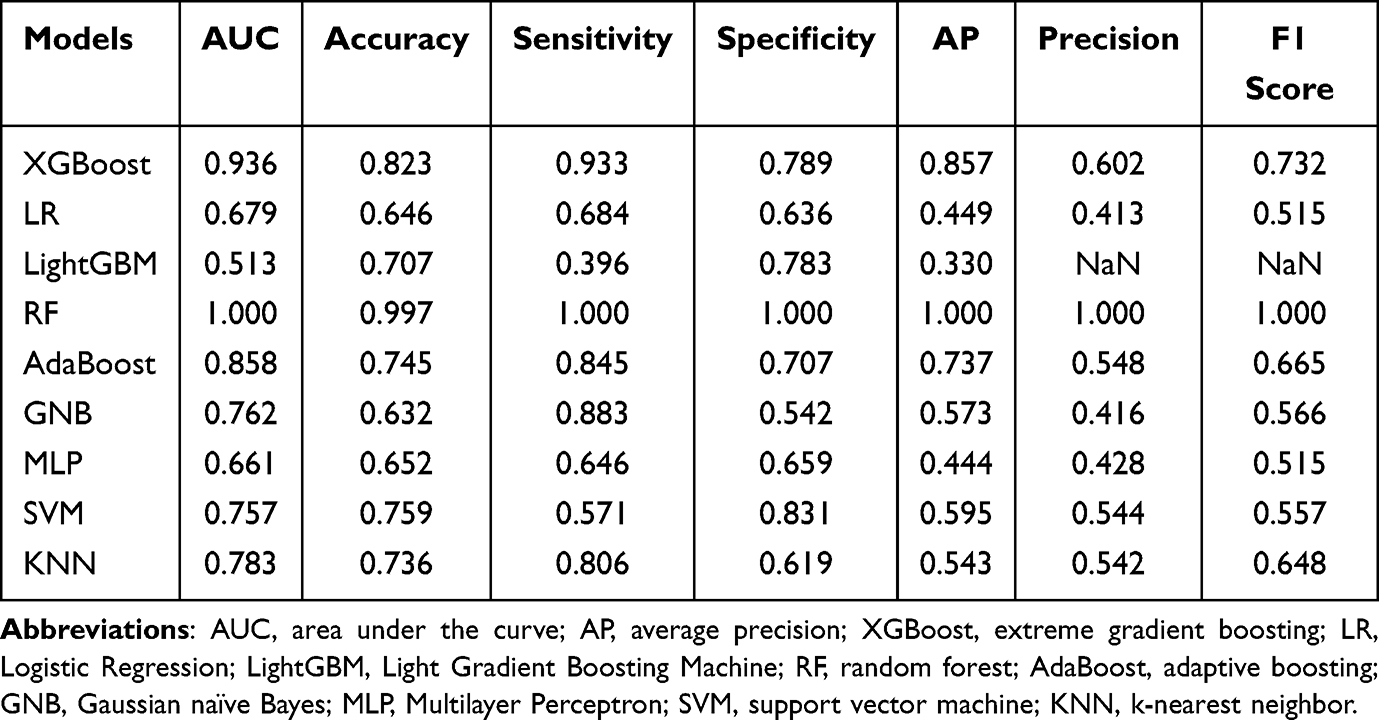 |
Table 2 Predictive Performance Comparison of the Nine Machine Learning Algorithms in the Training Sets for Osteoporosis with T2DM |
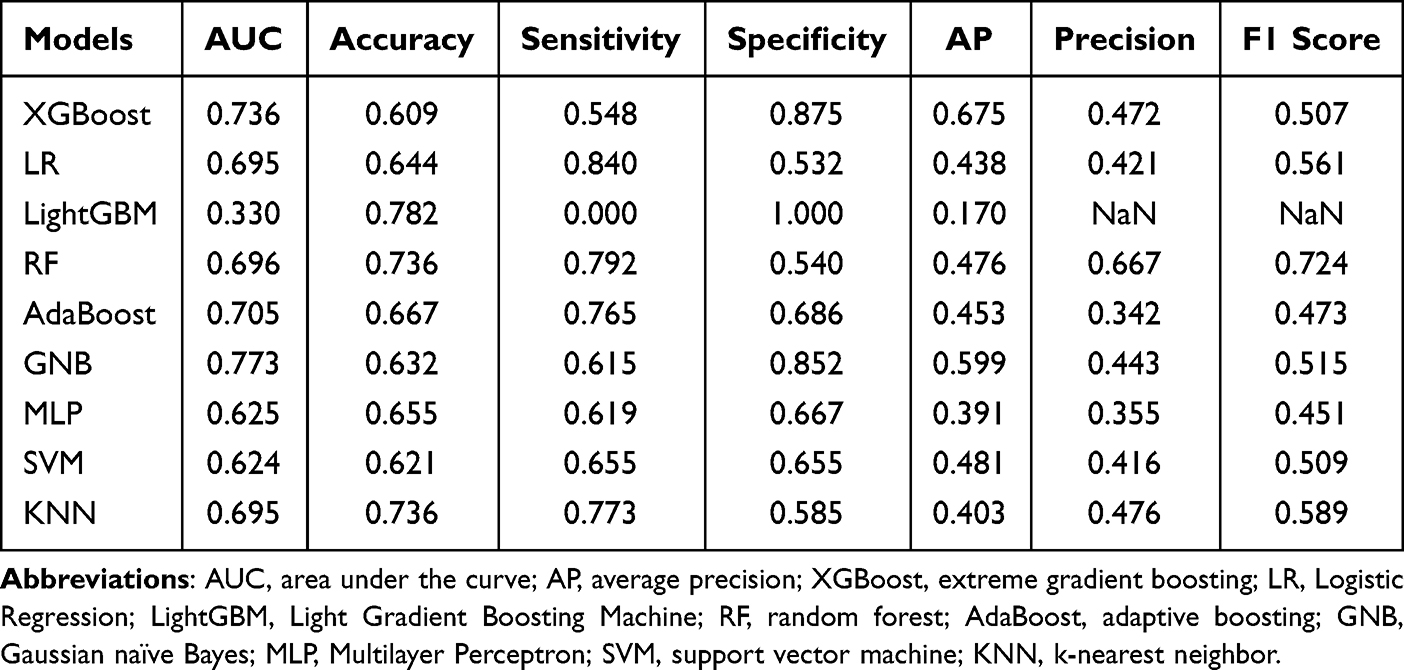 |
Table 3 Predictive Performance Comparison of the Nine Machine Learning Algorithms in the Validation Sets for Osteoporosis with T2DM |
 |
Figure 3 Construction and comparison of multiple machine learning models. ROC curve analysis of machine learning algorithms for prediction of diabetic osteoporosis (DO) in training (A) and validation (B) set. (C) Calibration plots for predicting DO with various models. (D) Decision curve analysis of each model. The x-axis represents the threshold probability of the depression. The y-axis represents net benefit. The average precision recall curves in training (E) and validation (F) set, indicating the trade off between precision and recall. |
Optimization and Interpretation of Model
The as-selected XGBoost model was used for classification, with the controlling parameters automatically optimized. Osteoporosis comprised the categorical variable. The variables included in the model were as listed above. The test set (15.00%) was randomly selected from the entire set of data. The remainder were used as the training set for 5-fold cross-validation, with AUC = 0.940 in the training set, AUC = 0.772 in the validation set, and AUC = 0.872 in the test set (Table 4; Figure 4A–C), followed by the AUC learning curve (Figure 4D) in classification model training and the reliability curve (Figure 4E) to evaluate the predictive power of the model. DCA of this model was subsequently constructed in our study (Figure 4F), illustrating that the ML model demonstrated a greater net benefit in comparison to a treat all-or-none plan with a risk threshold of less than 85%.
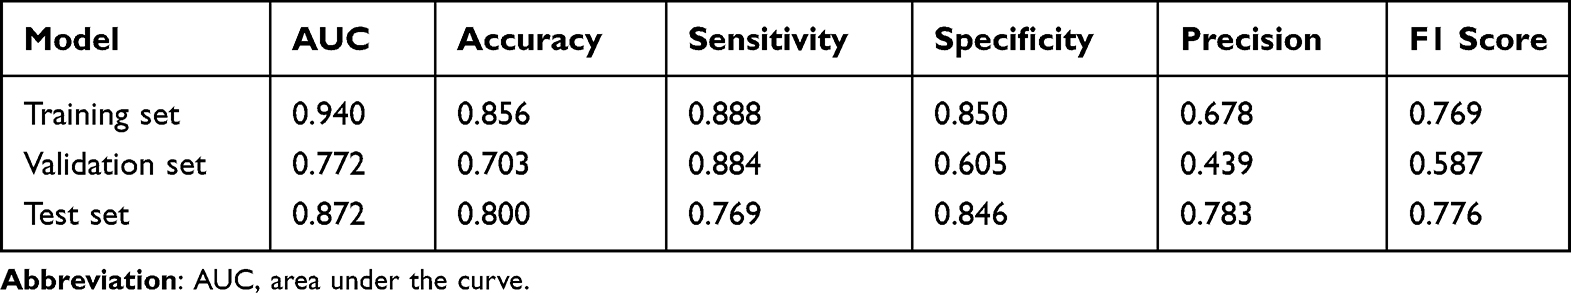 |
Table 4 Diagnostic Performance of the XGBoost Model for the Prediction of Osteoporosis in T2DM |
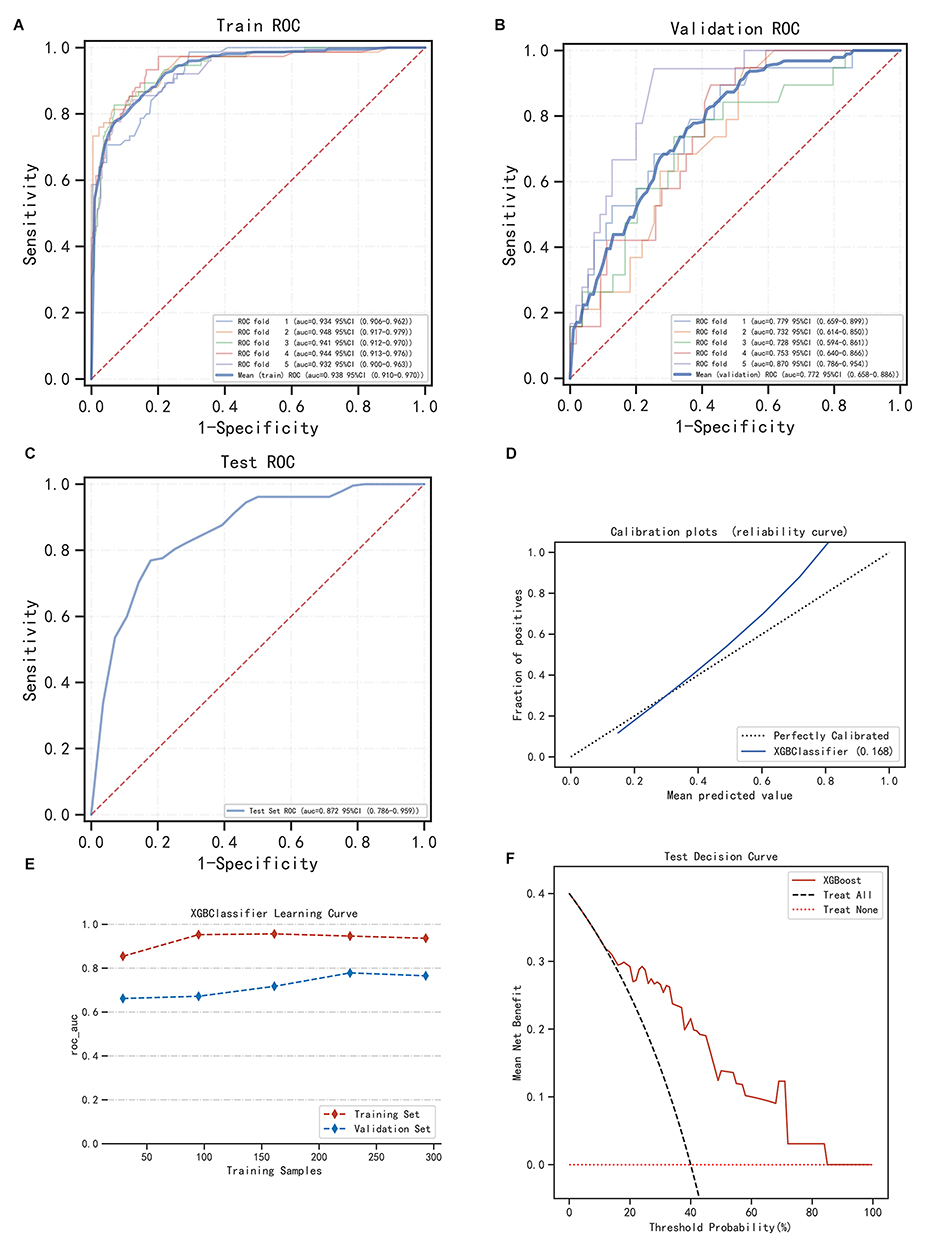 |
Figure 4 Construction and assessment of extreme gradient boosting (XGBoost) classification prediction model. (A–C) The ROC curves of XGBoost using the 5-fold cross-validation on the training set (A), validation set (B), and test set (C). (D) Calibration plots and (E) Machine learning curve for XGBoost. (F) Decision curve analysis graph showing the net benefit against threshold probabilities based on decisions from model outputs. |
In addition, the SHAP value diagram (Figure 5A–C) illustrated the overall interpretability of the model and the interpretability of a single patient. The analysis of feature importance and correlations revealed that the model heavily relied on 25(OH)D, DN, eGFR, HOMA-IR, and Age (Figure 5A and B), and that lower 25(OH)D age, higher prevalence of DN, lower eGFR, lower HOMA-IR, and older individuals were associated with increased model prediction scores. In addition, Figure 5C depicts an individual-level breakdown of how these model features lead to changes in individual risk prediction scores for an example patient by identifying which feature values strongly affect the final risk prediction score by increasing or decreasing it.
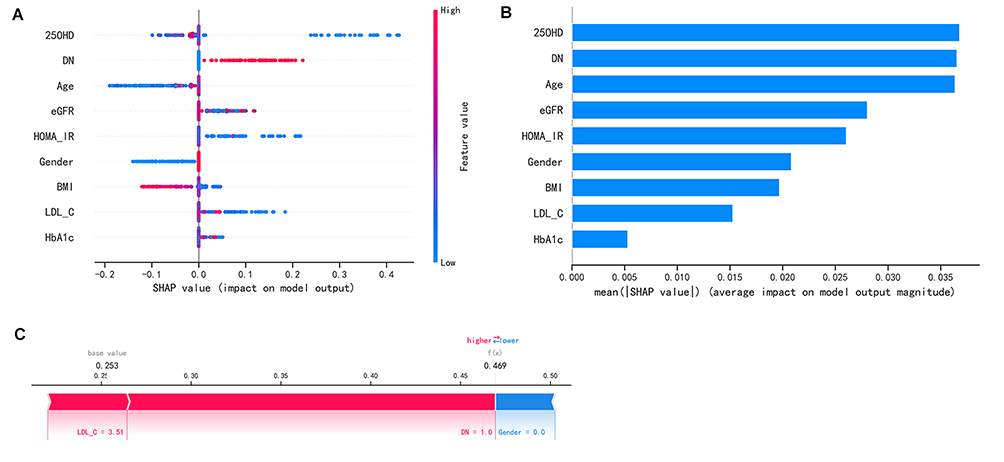 |
Figure 5 Feature Importance bar chart and SHAP summary chart. (A) The left dot plot represents the direction of contribution of each value of each variable, with red representing larger values and blue representing lower values of each variable. (B) The bars on the right represent the importance of the variables and their overall contribution to the model predictions. (C) SHAP scores explain the predicted risk of osteoporosis in one subject. |
Latent Profile Analysis
Tables S2 and S3 present the model fit statistics for LCA. Sequentially, the Bayesian Information Criterion (BIC) and Akaike Information Criterion (AIC) decreased with the addition of a new class to the models. However, the greatest reduction in BIC and AIC occurred when transitioning from a two-class to a three-class model compared to models with more classes. Statistical significance was observed in the improvement for the three-class model as compared to the two-class model (p < 0.0001). Although the three and four-class models’ fit was statistically significant, it did not show evident improvement in model fit, particularly based on Entropy with values of 0.694 and 0.695 in the three-class model and four-class model (Table S2), respectively. Table S3 shows the posterior probabilities for three-class and four-class models. The three-class model had higher posterior probabilities for each class than the four-class model. Based on these observations and the number of subjects assigned to each class, the three-class model was considered the best fit for the population.
We further analyzed the differences in class-defining variables among the three classes and presented these differences in Figure 6A and B. In particular, we demonstrated the differences in continuous and categorical variables (gender and DN) between the classes. Class 1 was defined by lower BMI and HOMA-IR, whereas Class 2 was defined by higher age, HOMA-IR, and a higher proportion of females and DN. Class 3 was defined by lower age and higher eGFR, with a lower proportion of females and DN. We also found significant differences in the risk of osteoporosis among Type 2 diabetes patients in the three classes, as shown in Figure 6C. Accordingly, we categorized the three classes as high (Class 1), medium (Class 2), and low-risk (Class 3) groups. To get a better understanding of the characteristics that differentiated each class, we examined the demographic and clinical features as detailed in Table S4. Our analysis showed that participants in the high-risk group were more likely to exhibit lower BMI, Fasting insulin, HOMA-IR, eGFR, TG levels, and higher HbA1c and HDL-C levels. In contrast, participants in the low-risk group were younger, more likely to be male, and with a shorter duration of T2DM. They also had higher eGFR, HDL-C, and 25(OH)D levels, and a lower incidence of hypertension, cardiovascular disease, and complications of diabetes such as DPVD, DPN, DR, and DN.
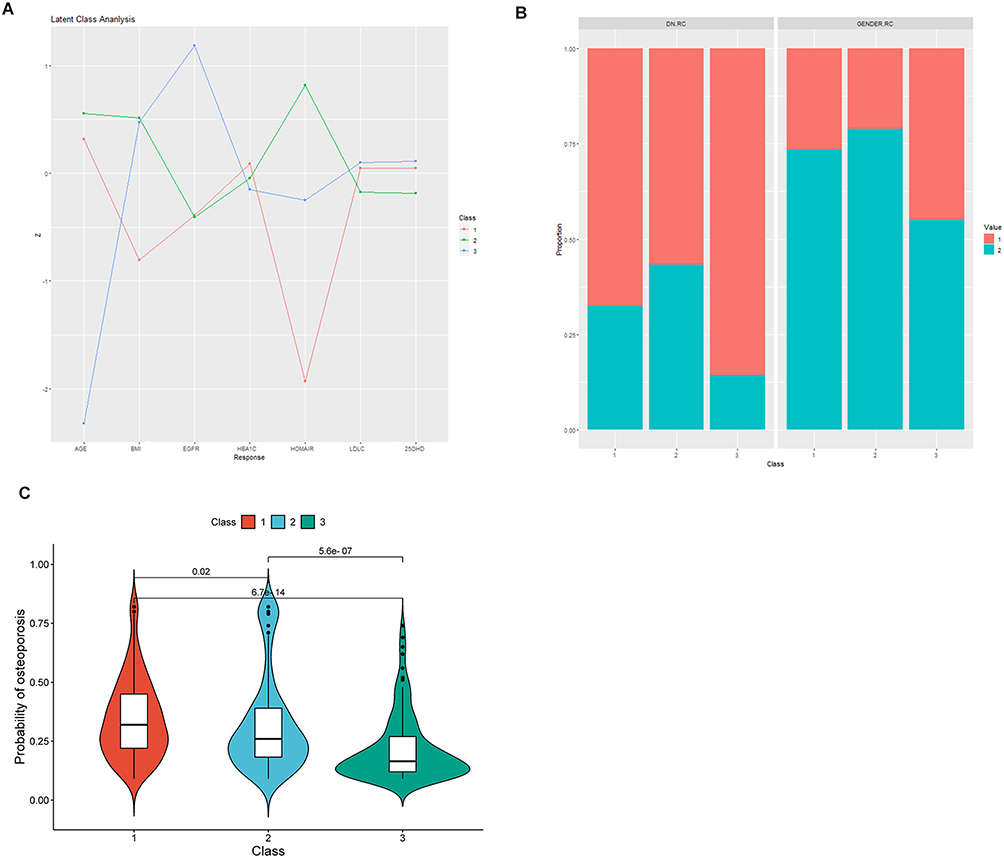 |
Figure 6 Differences in the standardized values of individual continuous variables (A), categorical variables (gender, DN) (B), and osteoporosis risk prediction scores (C), based on class assignment in the 3-class model. Figure 5A displays the differences in standardized values of each variable by classes in the 3-class model on the y-axis, while the individual continuous variables are shown along the x-axis. The variables have been standardized, meaning that all means are scaled to 0 and standard deviations to 1. A value of +1 for the standardized variable indicates that the mean value for a given class was one standard deviation higher than the mean value as a whole. Figure 5B As for DN, the red bar represents participants without family history, the green bar represents participants with family history. As for gender, the red bar represents male and the green bar represents female. |
Discussion
The current study comprised a novel attempt towards developing an osteoporosis prediction model for men and women with T2DM using nine ML algorithms, on the basis of physical characteristics, laboratory tests, personal history, complications history, and comorbidities. A comparison of ML algorithms revealed that the XGBoost model provided the best performance. The model was further optimized and evaluated for its accuracy and clinical validity via automatic parameter adjustment and internal cross-validation by making use of calibration curves and DCA curves. In addition, exploratory analysis of the ML model displayed in the SHAP value plot revealed the significance of the nine variables in the development of osteoporosis. Furthermore, we defined subgroups of people with type 2 diabetes by LCA based on screening characteristic variables to identify people at high risk for osteoporosis.
Previous research suggests that the adverse effect of diabetes on bone physiology may be multifactorial, with inadequate glycemic control, abnormal energy metabolism, vitamin D, electrolytes, and other organ functions of diabetes mellitus, as well as its acute and chronic complications, all contributing to osteoporosis.23 Thus, based on prior research, we co-modeled both women and men using multiple ML algorithms, incorporating clinically accessible risk factors as variables, and selected XGBoost as the optimal model. XGBoost, one of the most effective methods for constructing prediction models, is a gradient boosting algorithm that has been utilized extensively in numerous medical studies.24,25 As evident from Table 2 and Table 3, as well as from Figure 3A and B, XGBoost and Random Forest models outperformed the LR model in the training set. However, the overall performance of the nine ML algorithms in the training and validation set revealed that the Random Forest models may have exhibited an overfitting phenomenon, whereas the XGBoost model performed more consistently; consequently the XGBoost model was selected. In addition, from the perspective of discrimination, accuracy, and clinical validity, our model appears to be a reliable tool for predicting the risk of osteoporosis in patients with type 2 diabetes.
The use of artificial intelligence in osteoporosis prediction has been extensive and multifaceted. However, the contributions of the features were not evaluated in these studies. Herein, we used the SHAP approach to assess the significance of the features. This allowed for an evaluation of the value of each feature’s contribution and could provide insights relating to clinical decisions, allowing for an evaluation of the individual value of the variables and contributing to the concept of personalized medicine.26,27
According to an analysis of the value of algorithm model features, many of the features identified as essential for model prediction are consistent with the current understanding of osteoporosis caused by diabetes. As presented in Figure 5A and B, 25(OH)D is the most prominent of these nine characteristics. Vitamin D is presumed to be responsible for maintaining normal serum calcium and phosphorus levels to support bone health.28 Correspondingly, a decrease in intestinal calcium absorption due to low vitamin D levels may result in an increase in parathyroid hormone levels and bone turnover, followed by osteopenia and osteoporosis.29 In recent years, widespread attention has been paid to the extraskeletal effects of vitamin D.30 Moreover, lower levels of serum 25(OH)D have been associated with an increased risk of type 2 diabetes.31,32 In addition, patients with type 2 diabetes had lower 25(OH)D levels than controls, and a lower vitamin D status in patients with type 2 diabetes was associated with poorer glycemic control.33,34 Thus, the current study is in line with the literature, and provides evidence from an explanatory model that 25(OH)D was negatively associated with the risk of osteoporosis in T2DM patients.
Microangiopathy is a common complication of diabetes. Previous research indicated that cortical porosity in patients with type 2 diabetes was associated with decreased microvascular blood flow as measured by transcutaneous oxygen tension, indicating that microvascular disease affects the bone microarchitecture of these individuals.35 Recent studies have demonstrated a correlation between neuropathy, retinopathy, and decreased BMD at the lumbar spine and femoral neck.36,37 This is consistent with our findings from the current study, which demonstrated that a higher prevalence of DN was associated with a higher risk of osteoporosis in type 2 diabetes. Among them, the incidence of DN had the greatest impact on osteoporosis risk prediction. In particular, chronic kidney disease in DM patients resulted in abnormal calcium and phosphorus metabolism, gradually decreased proteinuria and renal functions, which were manifested in our study using eGFR, another critical variable in our model, as well as over-expression of inflammatory cytokines,38 ultimately leading to damage to bone microstructure and a reduction in bone mass, with consequent osteoporosis and fractures. These findings, therefore, suggest that the severity of DN is associated with the high incidence of osteoporosis in type 2 diabetes. Thus, the greater the severity of kidney damage, the greater the risk of osteoporosis.
In our study, the sex and age of the reference population were the most significant predictors of autonomous BMD. As anticipated, the effects of Gender and Age, which are universally acknowledged as risk factors for low bone mass, were observed in our study of T2DM patients. Consistent with the findings of Yong et al,6 we observed that the prevalence of osteoporosis was significantly higher in female T2DM patients (48.5%) than in male patients (20.3%). Age was also a significant factor in the development of osteoporosis in T2DM patients. On the Chinese Mainland, the prevalence of osteoporosis was higher among patients with an average age of over 60 years (40.1%) than among patients under 60 years of age (26.5%).39 This result and ours were consistent with the widely held belief that human bone mass would decline with age after reaching a peak.
Recent studies have shown that insulin directly affects bone cells. However, its effects on insulin resistance and osteoporosis remain unknown. According to Bilic-Curcic et al,40 postmenopausal women with T2DM may benefit from abdominal obesity and hyperinsulinemia as a result of increased total femoral bone mineral density. In a cohort study of older adults, insulin resistance was associated with increased bone mineral density.41 Although the contribution of HOMA-IR to the predictive model was relatively modest, the results of these studies corroborate our findings.
Previous research has demonstrated that both weight and BMI influence osteoporosis by stimulating new bone formation and inhibiting bone loss, as well as by contributing to bone formation through the secretion of hormones from adipose tissue and estrogen.42,43 This was consistent with our finding that lower values of height, weight, and BMI indicated the likelihood of osteoporosis. However, a higher BMI is frequently accompanied by elevated lipid levels, such as TC, LDL-C, TGs, etc.44 as indicated by our study. In human studies, the relationship between lipid profile and osteoporosis remains controversial. Contrary to most studies that reported negative associations between serum lipids and BMD, Ersoy et al,45 found that LDL-C positively correlated with osteoporosis. However, the mechanisms underlying the effects of obesity and lipids on osteoporosis are incompletely understood, and additional research is required.
The beneficial effect of improved glycemic control in preventing numerous other complications of diabetes is well-established, but its role in osteoporosis remains controversial. A recent study revealed a correlation between poor glycemic control and high BMD in type 2 diabetes.46 However, a second meta-analysis found no correlation between HbA1C and BMD.47 Conversely, our findings support a previous study in elderly male T2DM patients, which reported that poor glycemic control was associated with an increased risk of osteoporosis.48 In addition, long-term hyperglycemia may contribute to it mechanically by causing impaired osteoblast function.49
Latent class analysis (LCA) is a versatile statistical technique that can be applied without restrictions to examine and comprehend observable patterns in potentially complex clinical scenarios. A full-information maximum likelihood technique is used to estimate latent class models, permitting the incorporation of all data from all eligible participants into the definition of the prospective class model.50 LCA can identify subgroups according to the convergence of symptoms, specific behaviors, and risk factors. LCA has been widely used to identify disease subphenotypes in the medical field;51 however, it has not been used extensively for risk prediction. This study is the first to use the LCA strategy to identify the subpopulation of T2DM patients most at risk for developing incident osteoporosis. In contrast to previous osteoporosis risk correlation studies, which always focused on the relationship between an independent variable and a dependent variable, we used filter-based features to identify three distinct subpopulations without considering the outcomes. This significantly improved the reproducibility and stability of the latent class solutions and somewhat reduced the observational bias. In addition, the subtype characteristics of high-risk and low-risk group further confirm the relationship between the variables in the model prediction and the risk of osteoporosis occurrence in order to individualize the prediction of type 2 diabetic patients and to intervene early in the group with a higher risk of osteoporosis in order to minimize and prevent fractures.
The current study has a number of merits. However, it is also equally important to consider the study’s limitations. First, because this is a cross-sectional study, the predictive analysis is limited by inherent flaws. Second, the sample size of this study was insufficient for testing the robustness of the model. Third, when the input samples and model parameters vary, our model may select slightly different contributing factors. In addition, nutritional factors, socioeconomic status, and bone turnover markers are not readily accessible through clinical practice. Due to the effects of various drugs on bone metabolism and the small number of patients taking a specific drug, the model was ultimately trained without drug use as a feature. However, despite these limitations, this study is still valuable because it provides an informative predictive model that identifies T2DM patients at high risk for osteoporosis based solely on clinical risk factors.
In order to fully evaluate the effectiveness of the osteoporosis prediction model for patients with T2DM, it is important to consider both its advantages and limitations. One advantage of the methodological approach used is that it has the ability to process large amounts of data and identify complex patterns that may be difficult for humans to recognize. As more data is collected and analyzed, these algorithms can be refined over time, leading to improved accuracy. By handling multiple variables, machine learning algorithms can provide a comprehensive framework for risk assessment, which can enhance the accuracy of prediction models. Furthermore, these algorithms have the potential to automate and streamline the prediction process, allowing for rapid and accurate identification of patients at risk for osteoporosis. However, the accuracy of machine learning algorithms is heavily reliant on the quality and comprehensiveness of the input data. Any biases or errors in the data can lead to inaccurate predictions. Moreover, the complexity of these algorithms makes it challenging to interpret their outputs. Additionally, the sensitivity of machine learning algorithms to variations in the data may result in poor performance when applied to new populations or contexts. Therefore, it is important to validate and test these algorithms before they can be used in clinical practice. It is also worth noting that machine learning algorithms may not be suitable for all applications.
Conclusions
Using publicly available input variables, ML algorithms were used to develop prediction models that serve as screening tools for osteoporosis in type 2 diabetes patients. Based on a comparison of multiple classification models, the XGBoost model was the most accurate ML classification model for predicting osteoporosis risk. Thus, by incorporating this model into clinical practice, patients and physicians can better understand the disease and may benefit from early diagnosis and treatment of T2DM-related osteoporosis.
Data Sharing Statement
Some or all of the datasets generated and/or analyzed in the current study are not publicly available, but are available on reasonable request by the relevant authors.
Ethics
This study was approved by the Ethics Committee of Cangzhou Central Hospital.
Consent to Participate
Written informed consent for participation was not required for this study in accordance with the national legislation and the institutional requirements.
Consent for Publication
All of the authors approved the publication of the article.
Acknowledgments
This work is supported by the the Extreme Smart Analysis and Empower-Stats platform (http://xsmartanalysis.cn/). Thanks are also extended to Bullet Edits Company for professional language improvement.
Funding
This study was supported by the Youth Science and technology project, Hebei Medical Science Research Project (20211155).
Disclosure
The authors declare no competing interests.
References
1. Eller-Vainicher C, Cairoli E, Grassi G, et al. Pathophysiology and management of type 2 diabetes mellitus bone fragility. J Diabetes Res. 2020;2020:7608964. doi:10.1155/2020/7608964
2. Sheu A, Greenfield JR, White CP, et al. Assessment and treatment of osteoporosis and fractures in type 2 diabetes. Trends Endocrinol Metab. 2022;33(5):333–344. doi:10.1016/j.tem.2022.02.006
3. Kendler DL, Compston J, Carey JJ, et al. Repeating measurement of bone mineral density when monitoring with dual-energy X-ray absorptiometry: 2019 ISCD official position. J Clin Densitom. 2019;22(4):489–500. doi:10.1016/j.jocd.2019.07.010
4. Rakic V, Davis WA, Chubb SA, et al. Bone mineral density and its determinants in diabetes: the Fremantle Diabetes Study. Diabetologia. 2006;49(5):863–871. doi:10.1007/s00125-006-0154-2
5. Hamann C, Kirschner S, Gunther KP, et al. Bone, sweet bone--osteoporotic fractures in diabetes mellitus. Nat Rev Endocrinol. 2012;8(5):297–305. doi:10.1038/nrendo.2011.233
6. Si Y, Wang C, Guo Y, et al. Prevalence of osteoporosis in patients with type 2 diabetes mellitus in the Chinese mainland: a protocol of systematic review and meta-analysis. Medicine. 2020;99(16):e19762. doi:10.1097/MD.0000000000019762
7. Hu H, Wang H, Wang F, et al. Prediction of influenza-like illness based on the improved artificial tree algorithm and artificial neural network. Sci Rep. 2018;8(1):4895. doi:10.1038/s41598-018-23075-1
8. Mortazavi BJ, Bucholz EM, Desai NR, et al. Comparison of machine learning methods with national cardiovascular data registry models for prediction of risk of bleeding after percutaneous coronary intervention. JAMA Netw Open. 2019;2(7):e196835. doi:10.1001/jamanetworkopen.2019.6835
9. Cruz AS, Lins HC, Medeiros RVA, et al. Artificial intelligence on the identification of risk groups for osteoporosis, a general review. Biomed Eng Online. 2018;17(1):12. doi:10.1186/s12938-018-0436-1
10. Yoo TK, Kim SK, Kim DW, et al. Osteoporosis risk prediction for bone mineral density assessment of postmenopausal women using machine learning. Yonsei Med J. 2013;54(6):1321–1330. doi:10.3349/ymj.2013.54.6.1321
11. Shim JG, Kim DW, Ryu KH, et al. Application of machine learning approaches for osteoporosis risk prediction in postmenopausal women. Arch Osteoporos. 2020;15(1):169. doi:10.1007/s11657-020-00802-8
12. Park HW, Jung H, Back KY, et al. Application of machine learning to identify clinically meaningful risk group for osteoporosis in individuals under the recommended age for dual-energy X-ray absorptiometry. Calcif Tissue Int. 2021;109(6):645–655. doi:10.1007/s00223-021-00880-x
13. Ou Yang WY, Lai CC, Tsou MT, et al. Development of machine learning models for prediction of osteoporosis from clinical health examination data. Int J Environ Res Public Health. 2021;19(1):18. doi:10.3390/ijerph19010018
14. Pan F, Cui W, Gao L, et al. A risk assessment tool for identifying osteoporosis in older women with type 2 diabetes mellitus. Exp Clin Endocrinol Diabetes. 2021;130(7):426–433. doi:10.1055/a-1702-5168
15. Wang C, Zhang T, Wang P, et al. Bone metabolic biomarker-based diagnosis of type 2 diabetes osteoporosis by support vector machine. Ann Transl Med. 2021;9(4):316. doi:10.21037/atm-20-3388
16. Musleh S, Nazeemudeen A, Islam MT, et al. A machine learning based study to assess bone health in a diabetic cohort. Informat Med Unlocked. 2022;33:101079. doi:10.1016/j.imu.2022.101079
17. Drouin P, Blickle JF, Charbonnel B, et al. [Diagnosis and classification of diabetes mellitus: the new criteria]. Diabetes Metab. 1999;25(1):72–83.
18. Yuan-Zheng MA, Wang YP, Liu Q, et al. 2018 China guideline for diagnosis and treatment of senile osteoporosis. Chin J Pract Intern Med. 2019;12:38–61.
19. Cosman F, de Beur SJ, LeBoff MS, et al. Clinician’s guide to prevention and treatment of osteoporosis. Osteoporos Int. 2014;25(10):2359–2381. doi:10.1007/s00198-014-2794-2
20. Levey AS, Bosch JP, Lewis JB, et al. A more accurate method to estimate glomerular filtration rate from serum creatinine: a new prediction equation. Modification of Diet in Renal Disease Study Group. Ann Intern Med. 1999;130(6):461–470. doi:10.7326/0003-4819-130-6-199903160-00002
21. Lin JS, Chan FY, Leung J, et al. Longitudinal association of built environment pattern with physical activity in a community-based cohort of Elderly Hong Kong Chinese: a latent profile analysis. Int J Environ Res Public Health. 2020;18(1):17. doi:10.3390/ijerph18010017
22. Berlin KS, Williams NA, Parra GR. An introduction to latent variable mixture modeling (part 1): overview and cross-sectional latent class and latent profile analyses. J Pediatr Psychol. 2014;39(2):174–187. doi:10.1093/jpepsy/jst084
23. Li C, Wang S, Du M, et al. Clinical characteristics and controllable risk factors of osteoporosis in elderly men with diabetes mellitus. Orthop Surg. 2021;13(3):1001–1005. doi:10.1111/os.12957
24. Huang Y, Chen H, Zeng Y, et al. Development and validation of a machine learning prognostic model for hepatocellular carcinoma recurrence after surgical resection. Front Oncol. 2020;10:593741. doi:10.3389/fonc.2020.593741
25. Xiang L, Wang H, Fan S, et al. Machine learning for early warning of septic shock in children with hematological malignancies accompanied by fever or neutropenia: a single center retrospective study. Front Oncol. 2021;11:678743. doi:10.3389/fonc.2021.678743
26. Hyland SL, Faltys M, Huser M, et al. Early prediction of circulatory failure in the intensive care unit using machine learning. Nat Med. 2020;26(3):364–373. doi:10.1038/s41591-020-0789-4
27. Kim SH, Jeon ET, Yu S, et al. Interpretable machine learning for early neurological deterioration prediction in atrial fibrillation-related stroke. Sci Rep. 2021;11(1):20610. doi:10.1038/s41598-021-99920-7
28. Holick MF. Holick MF Vitamin D deficiency. N Engl J Med. 2007;357(3):266–281. doi:10.1056/NEJMra070553
29. van den Bergh JP, Bours SP, van Geel TA, et al. Optimal use of vitamin D when treating osteoporosis. Curr Osteoporos Rep. 2011;9(1):36–42. doi:10.1007/s11914-010-0041-0
30. Holick MF. Holick MF Vitamin D: extraskeletal health. Endocrinol Metab Clin North Am. 2010;39(2):381–400. doi:10.1016/j.ecl.2010.02.016
31. Pittas AG, Nelson J, Mitri J, et al. Plasma 25-hydroxyvitamin D and progression to diabetes in patients at risk for diabetes: an ancillary analysis in the Diabetes Prevention Program. Diabetes Care. 2012;35(3):565–573. doi:10.2337/dc11-1795
32. Goswami R, Nair A. Nair A Diabetes mellitus, vitamin D & osteoporosis: insights. Indian J Med Res. 2019;150(5):425–428. doi:10.4103/ijmr.IJMR_1920_19
33. Zhang J, Li Y, Lai D, et al. Vitamin D status is negatively related to insulin resistance and bone turnover in Chinese non-osteoporosis patients with type 2 diabetes: a retrospective cross-section research. Front Public Health. 2021;9:727132. doi:10.3389/fpubh.2021.727132
34. Mitri J, Dawson-Hughes B, Hu FB, et al. Effects of vitamin D and calcium supplementation on pancreatic beta cell function, insulin sensitivity, and glycemia in adults at high risk of diabetes: the Calcium and Vitamin D for Diabetes Mellitus (CaDDM) randomized controlled trial. Am J Clin Nutr. 2011;94(2):486–494. doi:10.3945/ajcn.111.011684
35. Samakkarnthai P, Sfeir JG, Atkinson EJ, et al. Determinants of bone material strength and cortical porosity in patients with type 2 diabetes mellitus. J Clin Endocrinol Metab. 2020;105(10):e3718–e3729.
36. Shanbhogue VV, Hansen S, Frost M, et al. Compromised cortical bone compartment in type 2 diabetes mellitus patients with microvascular disease. Eur J Endocrinol. 2016;174(2):115–124. doi:10.1530/EJE-15-0860
37. Chen J, Hendriks M, Chatzis A, et al. Bone vasculature and bone marrow vascular niches in health and disease. J Bone Miner Res. 2020;35(11):2103–2120. doi:10.1002/jbmr.4171
38. Zhao Z. Correlation analysis of urine proteins and inflammatory cytokines with osteoporosis in patients with diabetic nephropathy. J Musculoskelet Neuronal Interact. 2018;18(3):348–353.
39. Si Y, Wang C, Guo Y, et al. Prevalence of osteoporosis in patients with type 2 diabetes mellitus in the Chinese mainland: a systematic review and meta-analysis. Iran J Public Health. 2019;48(7):1203–1214.
40. Bilic-Curcic I, Makarovic S, Mihaljevic I, et al. Bone mineral density in relation to metabolic syndrome components in postmenopausal women with diabetes mellitus type 2. Acta Clin Croat. 2017;56:58–63. doi:10.20471/acc.2017.56.01.09
41. Fornari R, Marocco C, Francomano D, et al. Insulin growth factor-1 correlates with higher bone mineral density and lower inflammation status in obese adult subjects. Eat Weight Disord. 2018;23(3):375–381. doi:10.1007/s40519-017-0362-4
42. Xu H, Wang Z, Li X, et al. Osteoporosis and osteopenia among patients with type 2 diabetes aged >/=50: role of sex and clinical characteristics. J Clin Densitom. 2020;23(1):29–36. doi:10.1016/j.jocd.2019.04.004
43. Shanbhogue VV, Mitchell DM, Rosen CJ, et al. Type 2 diabetes and the skeleton: new insights into sweet bones. Lancet Diabetes Endocrinol. 2016;4(2):159–173. doi:10.1016/S2213-8587(15)00283-1
44. Fassio A, Idolazzi L, Rossini M, et al. The obesity paradox and osteoporosis. Eat Weight Disord. 2018;23(3):293–302. doi:10.1007/s40519-018-0505-2
45. Ersoy GS, Simsek EE, Vatansever D, et al. Lipid profile and plasma atherogenic index in postmenopausal osteoporosis. North Clin Istanb. 2017;4(3):237–241. doi:10.14744/nci.2017.61587
46. Oei L, Zillikens MC, Dehghan A, et al. High bone mineral density and fracture risk in type 2 diabetes as skeletal complications of inadequate glucose control: the Rotterdam Study. Diabetes Care. 2013;36(6):1619–1628. doi:10.2337/dc12-1188
47. Vestergaard P. Discrepancies in bone mineral density and fracture risk in patients with type 1 and type 2 diabetes--A meta-analysis. Osteoporos Int. 2007;18(4):427–444. doi:10.1007/s00198-006-0253-4
48. Xu L, Cheng M, Liu X, et al. Bone mineral density and its related factors in elderly male Chinese patients with type 2 diabetes. Arch Med Res. 2007;38(2):259–264. doi:10.1016/j.arcmed.2006.10.003
49. He H, Liu R, Desta T, et al. Diabetes causes decreased osteoclastogenesis, reduced bone formation, and enhanced apoptosis of osteoblastic cells in bacteria stimulated bone loss. Endocrinology. 2004;145(1):447–452. doi:10.1210/en.2003-1239
50. Wraith D, Wolfe R. Wolfe R Classifying patients by their characteristics and clinical presentations; the use of latent class analysis. Respirology. 2014;19(8):1138–1148. doi:10.1111/resp.12408
51. Wiersema R, Jukarainen S, Vaara ST, et al. Two subphenotypes of septic acute kidney injury are associated with different 90-day mortality and renal recovery. Crit Care. 2020;24(1):150. doi:10.1186/s13054-020-02866-x
 © 2023 The Author(s). This work is published and licensed by Dove Medical Press Limited. The
full terms of this license are available at https://www.dovepress.com/terms
and incorporate the Creative Commons Attribution
- Non Commercial (unported, 3.0) License.
By accessing the work you hereby accept the Terms. Non-commercial uses of the work are permitted
without any further permission from Dove Medical Press Limited, provided the work is properly
attributed. For permission for commercial use of this work, please see paragraphs 4.2 and 5 of our Terms.
© 2023 The Author(s). This work is published and licensed by Dove Medical Press Limited. The
full terms of this license are available at https://www.dovepress.com/terms
and incorporate the Creative Commons Attribution
- Non Commercial (unported, 3.0) License.
By accessing the work you hereby accept the Terms. Non-commercial uses of the work are permitted
without any further permission from Dove Medical Press Limited, provided the work is properly
attributed. For permission for commercial use of this work, please see paragraphs 4.2 and 5 of our Terms.
Recommended articles
Association Between Hemoglobin Levels and Osteoporosis in Chinese Patients with Type 2 Diabetes Mellitus: A Cross-Sectional Study
Ye T, Lu L, Guo L, Liang M
Diabetes, Metabolic Syndrome and Obesity 2022, 15:2803-2811
Published Date: 14 September 2022
Prevalence and Risk Factors of Osteoporosis in Patients with Type 2 Diabetes Mellitus in Nanchang (China): A Retrospective Cohort Study
Li T, Hu L, Yin XL, Zou Y, Fu HY, Li HL
Diabetes, Metabolic Syndrome and Obesity 2022, 15:3039-3048
Published Date: 28 September 2022
Using Machine Learning Algorithms to Predict High-Risk Factors for Postoperative Delirium in Elderly Patients
Liu Y, Shen W, Tian Z
Clinical Interventions in Aging 2023, 18:157-168
Published Date: 8 February 2023
Prediction of the Risk of Bone Mineral Density Decrease in Type 2 Diabetes Mellitus Patients Based on Traditional Multivariate Logistic Regression and Machine Learning: A Preliminary Study
Zhang J, Xu Z, Fu Y, Chen L
Diabetes, Metabolic Syndrome and Obesity 2023, 16:2885-2898
Published Date: 19 September 2023
Development and External Validation of a Machine Learning-Based Model for Predicting Heart Failure Risk in Type 2 Diabetes
Liu Y, Wang P, Wang M, Chen Y, Kasyanju SM, Yang Y, Yang T, Peng L, Sun M
Diabetes, Metabolic Syndrome and Obesity 2025, 18:4177-4191
Published Date: 13 November 2025