Back to Journals » Diabetes, Metabolic Syndrome and Obesity » Volume 16
Prediction of the Risk of Bone Mineral Density Decrease in Type 2 Diabetes Mellitus Patients Based on Traditional Multivariate Logistic Regression and Machine Learning: A Preliminary Study
Authors Zhang J, Xu Z ![]() , Fu Y, Chen L
, Fu Y, Chen L
Received 13 June 2023
Accepted for publication 5 September 2023
Published 19 September 2023 Volume 2023:16 Pages 2885—2898
DOI https://doi.org/10.2147/DMSO.S422515
Checked for plagiarism Yes
Review by Single anonymous peer review
Peer reviewer comments 3
Editor who approved publication: Professor Gian Paolo Fadini
Junli Zhang,1,* Zhenghui Xu,1,* Yu Fu,2,* Lu Chen1,2
1Department of Endocrinology and Metabolism, The Third Affiliated Hospital of Soochow University, Changzhou, People’s Republic of China; 2Department of Clinical Nutrition, The Third Affiliated Hospital of Soochow University, Changzhou, People’s Republic of China
*These authors contributed equally to this work
Correspondence: Lu Chen, Department of Endocrinology and Metabolism, The Third Affiliated Hospital of Soochow University, Changzhou, 213003, People’s Republic of China, Tel +86 0519-68870424, Email [email protected]
Purpose: There remains a lack of a machine learning (ML) model incorporating body composition to assess the risk of bone mineral density (BMD) decreases in type 2 diabetes mellitus (T2DM) patients. We aimed to use ML algorithms and the traditional multivariate logistic regression to establish prediction models for BMD decreases in T2DM patients over 50 years of age, and compare the performance of the two methods.
Patients and Methods: This cross-sectional study was conducted among 450 patients with T2DM from 1 August 2016 to 31 December 2022. The participants were divided into a normal BMD group and a decreased BMD group. Traditional multivariate logistic regression and six ML algorithms were selected to construct male and female models. Two nomograms were constructed to evaluate the risk of BMD decreases in the male and female T2DM patients, respectively. The ML models with the highest area under the curve (AUC) were compared with the traditional multivariate logistic regression models in terms of discriminant ability and clinical applicability.
Results: The optimal ML model was the extreme gradient boost (XGBoost) model. The AUCs of the traditional multivariate logistic regression and the XGBoost models were 0.722 and 0.800 in the male testing dataset, respectively, and 0.876 and 0.880 in the female testing dataset, respectively. The decision curve analysis results suggested that using the XGBoost models to predict the risk of BMD decreases obtained more net benefits compared with the traditional models in both sexes.
Conclusion: We preliminarily proved that the XGBoost models outperformed most other ML models in both sexes and achieved higher accuracy than traditional analyses. Due to the limited sample size in the study, it is necessary to validate our findings in larger prospective cohort studies.
Keywords: type 2 diabetes mellitus, bone mineral density decrease, prediction model, machine learning, nomogram
Introduction
Osteoporosis (OP), an important chronic complication of type 2 diabetes mellitus (T2DM), is regarded as the most common systemic bone disease.1 With an increase in the aging population, the incidence of OP is also increasing. The incidence of OP in Chinese women over 50 years old is 20.7%, and that in men reaches 14.4%.2 Furthermore, the incidence of OP and osteopenia in women over 50 years of age is four times and twice that of men, respectively.3 However, the risk of OP in the diabetic population should not be ignored. A meta-analysis in China showed that the prevalence of OP in T2DM patients is 44.8% in women and 37.0% in men.2 Moreover, more studies are reporting that individuals with T2DM have a higher fracture risk than nondiabetic individuals.4–6 Therefore, to avoid future symptoms and fractures, it is critical to detect and diagnose bone mineral density (BMD) decreases in T2DM patients as early as possible.
Currently, the gold standard for the diagnosis of OP or osteopenia is BMD determined by dual-energy X-ray absorptiometry (DXA).3 Unfortunately, since DXA scanners are a limited resource and because of radiation, especially in developing countries,7 it may not be suitable as a large-scale screening tool. Therefore, developing a convenient, accurate, and noninvasive prediction model that does not rely on BMD data and which contributes to prioritization of DXA scans is of great significance in public health management, assisting in the early detection and treatment of BMD decreases.
Bioelectrical impedance analysis is an easy-to-use, cheap, and radiation-free method, which has been widely used to assess body composition in the past 30 years.8 Changes in body composition are extremely common in T2DM patients, and include a loss in muscle mass and muscle strength, and a rise in fat mass (FM).9 In recent years, there has been an increasing focus on the impact of body composition on BMD. Body composition parameters such as lean mass (LM),10,11 FM,12,13 body mass index (BMI),14 and waist circumference (WC)15 are closely related to BMD. Apart from the effects of sex and age on BMD,16 body composition parameters can be modified by adjusting lifestyle, such as controlling weight and increasing exercise. Thus, it is necessary to incorporate these parameters into the prediction models of BMD decreases, to provide recommendations on healthy lifestyles for bone health.
Machine learning (ML) is a subfield of artificial intelligence which, with the rapid development of big data and the improvement of computer capacity, has been promptly introduced into the medical field.17 Recently, studies have applied ML algorithms to develop OP or fracture risk prediction models, which showed excellent diagnostic accuracy. These studies focused on specific populations without T2DM. Although some studies have been conducted in T2DM patients, they failed to incorporate body composition parameters and lacked results from the Chinese population. Wu et al targeted 8842 participants over 40 years and developed seven ML models for OP risk, among which the XGBoost model had the highest area under the curve (AUC) of 0.890 with 15 top variables.18 Yoo et al developed four prevalent ML models and compared them with four traditional OP risk assessment tools in terms of the prediction ability in 1674 postmenopausal women. They demonstrated that the support vector machine (SVM) model performed best with the highest AUC of 0.827, outperforming the four traditional risk assessment tools.19 In a cross-sectional study in China,12 289 T2DM patients were selected, and a predictive model based on the SVM algorithm was constructed to predict the risk of OP incidence, which achieved an AUC of 0.890 and an accuracy of 88%. Another retrospective study from China included 303 postmenopausal women with T2DM, wherein Wu et al constructed nine ML algorithms to predict OP and the XGBoost model performed the best performance with an AUC of 0.993 in the training dataset and 0.798 in the validation dataset, which significantly outperformed conventional OP risk assessment models.20 Furthermore, Yosibash et al developed a risk assessment tool for the prediction of hip fractures in T2DM and non-T2DM populations by combining autonomous finite element analyses data based on computed tomography scans with ML algorithms, and the tool provided a unique prediction accuracy.21
Due to the lack of a systematic and scientific method to assess the risk of BMD decreases in diabetic patients, we constructed ML models for T2DM participants after incorporating body composition parameters, filling the gap in this domain for the Chinese population. We aimed to use six common ML algorithms and traditional multivariate logistic regression to establish prediction models of BMD decreases in males and females separately and compare the performance of these models. By utilizing these predictive models as screening tools in the clinic, patients and clinicians can better evaluate the risk of BMD decreases and promptly intervene to avoid adverse outcomes. The added value of this study can be summarized as follows:
- With the incorporation of common clinical variables and body composition parameters, we successfully constructed and validated our models in both males and females with T2DM in the Chinese population.
- To our knowledge, this is a completely new attempt to use intracellular water (ICW) as an important predictor of BMD decreases in female patients.
- The XGBoost models have been proven to outperform the traditional multivariate logistic regression models in our preliminary study.
Materials and Methods
Study Population and Data Collection
We enrolled 450 patients over 50 years old, including 252 males and 198 females, from the Third Affiliated Hospital of Soochow University in this preliminary cross-sectional study from 1 August 2016 to 31 December 2022. The possibility of OP or osteopenia increases due to estrogen insufficiency in the elderly female population after entering menopause.22 Furthermore, the incidence of osteoporotic fracture increases significantly after the age of 50 in males and females.23 Therefore, we preliminarily collected data from participants over 50 years. Due to the actual gender distribution of our inpatients, there were more male patients than female ones. We included patients aged ≥ 50 years old and those diagnosed with T2DM according to the American Diabetes Association criteria.24 We excluded patients with other diseases affecting bone metabolism; a history of fracture; severe hepatic or renal insufficiency; acute complications of diabetes such as diabetic ketoacidosis, hypertonic hyperglycemia syndrome, diabetic foot, and hypoglycemia; and those with a history of taking drugs that affect bone metabolism. The workflow of participant inclusion is shown in Figure 1.
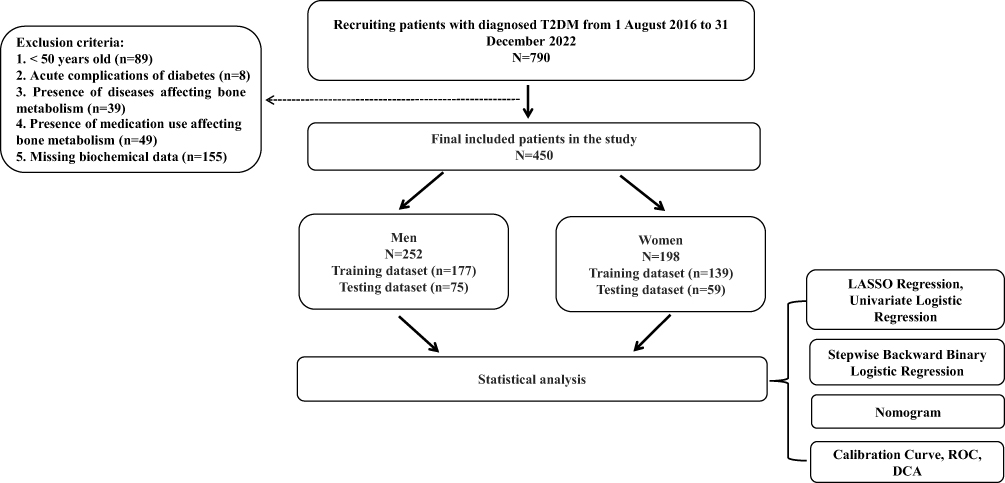 |
Figure 1 Workflow of the study. Abbreviations: T2DM, type 2 diabetes mellitus; LASSO, least absolute shrinkage and selection operator; ROC, receiver operating characteristic; DCA, decision curve analysis. |
Characteristics of patients were retrieved from electronic health records, including demographic characteristics, biochemical indicators, and information of diabetic complications. The following biochemical indicators were measured by standard laboratory methods: alanine aminotransferase (ALT), aspartate aminotransferase (AST), total bilirubin, alkaline phosphatase (ALP), calcium (Ca), uric acid (UA), total cholesterol, triacylglycerol (TG), high-density lipoprotein (HDL), low-density lipoprotein, free triiodothyronine (FT3), free thyroxine (FT4), thyroid stimulating hormone, glycated hemoglobin A1c (HbA1c), fasting C-peptide (FCP), fasting plasma glucose (FPG), N-terminal propeptide of type I procollagen (PINP), C-terminal telopeptide of type I collagen (CTX), parathyroid hormone (PTH), and estimated glomerular filtration rate (eGFR). The recorded complications of diabetes included diabetic nephropathy, diabetic retinopathy, cardiovascular disease (CVD), and diabetic peripheral neuropathy.
Body composition parameters were measured by the same nutritionist with a bioelectrical impedance analyzer (Inbody 770, Biospace, Seoul, Korea).25 Measurements included total body water (TBW), ICW, extracellular water (ECW), body FM (BFM), fat-free mass (FFM), skeletal muscle mass (SMM), BMI, percentage of body fat (PBF), basal metabolic rate (BMR), waist-to-hip ratio (WHR), appendicular skeletal muscle mass (ASM) and phase angle (PhA). The homeostasis model assessments for insulin resistance (HOMA-IR) and for islet beta-cell function (HOMA-islet) were calculated by the following equations: modified HOMA-IR = 1.5 + FPG (mmol/L) ×FCP (pmol/L)/2800; modified HOMA-islet = 0.27 × FCP (pmol/L)/[FPG (mmol/L) - 3.5];15 triglyceride-glucose (TyG) index = ln [fasting TG (mg/dL) × FPG (mg/dL)/2]; appendicular skeletal muscle mass index (ASMI) = ASM (kg)/ height2 (m2); fat-free mass index = FFM (kg)/ height2 (m2); fat mass index (FMI) = BFM (kg)/height2 (m2); percentage of fat-free mass (PFFM) = FFM (kg)/weight (kg); percentage of SMM (PSMM) = SMM (kg)/weight (kg). According to the OP diagnostic standard issued by the World Health Organization (WHO),26 a T-score ≥ –1.0 was defined as normal bone mass whereas 2.5 < T-score < –1.0 and T-score ≤ –2.5 were defined as osteopenia and OP, separately. All patients were divided into two groups: the normal BMD group and the decreased BMD group.
Statistical Analysis
All statistical analyses were completed through SPSS 26, R 4.2.2, and Python 3.8. The data of normal distribution are presented as mean ± standard deviation. The data of non-normal distribution are presented as median (interquartile range). Categorical data are presented as numbers and percentages. To fill in missing data, the average and mode replacement algorithms were used for continuous and categorical variables, respectively. The original datasets of males and females were randomly separated into training and testing datasets in a 70:30 ratio. The training datasets were used to build the models, and the testing datasets were utilized to validate their robustness. The least absolute shrinkage and selection operator (LASSO) regression was used to solve the multicollinearity problem between variables in the training datasets. A Spearman correlation analysis was employed to assess the relationship between variables with statistically significant differences from the univariate logistic regression. Finally, in the male and female training datasets, the variables with statistically significant differences were selected by univariate analysis (univariate logistic regression) for ML model construction or traditional multivariate analysis (stepwise backward binary logistic regression).
Six common ML algorithms, including logistic regression (LR), random forest (RF), XGBoost, SVM, decision tree (DT), and K-nearest neighbors, were performed to construct male and female models of BMD decreases. All models were developed with 10-fold cross-validation. The establishment and evaluation process of ML models are shown in Figure S1. The eventual ML hyper-parameters for each model are depicted in Table S1. The performance of the ML models in the training and testing datasets was primarily evaluated based on the accuracy, AUC, recall, precision, and F1-score. Two-tailed analyses were performed, and statistically significant differences were defined as P < 0.05.
Results
Baseline Characteristics
This cross-sectional study included 450 patients, and the prevalence of BMD decreases in T2DM patients aged ≥ 50 years was 67.8%. The baseline information of the study population is described in Table 1. Compared with the patients in the normal BMD group, those in the decreased BMD group were older; had a lower percentage of males and alcohol drinkers; a higher percentage of CVD patients; higher levels of ALP, HDL, PINP, and CTX; and lower levels of ALT, UA, Ca, TG, and TG/HDL. In terms of body composition, ASMI, TBW, ICW, ECW, BFM, FFM, SMM, BMI, BMR, WHR, FFMI, FMI, and PhA presented statistically significant differences between the two groups in the total population. However, indicators such as FCP, FBG, HbA1c, HOMA-IR, and HOMA-islet presented no difference between the two groups. The baseline characteristics of the study are described in Tables S2 and S3.
 |
Table 1 Baseline Characteristics of the Study Population |
Body Composition Parameters Were Ideal Predictive Indicators of BMD Decreases in T2DM Patients
The results of the LASSO regression analysis suggested that sex, PSMM, TBW, ICW, ECW, FFM, SMM, BMR, TBW/FFM and FMI were eliminated in the total study population (Figure S2A). Furthermore, through the LASSO regression, TBW, ICW, ECW, BFM and FFM were deleted in the male training dataset, and smoking, TBW, FFM, SMM, BMR and FMI were deleted in the female training dataset (Figure S2B and C). Finally, 43 candidate variables of the total study population were included in the univariate analysis. 47 candidate variables of the male patients and 45 candidate variables of the female patients were selected and further included in the univariate analysis. Spearman correlation analysis heat maps indicated that most of the body composition parameters were positively correlated with each other in both sexes (Figure S3). Table 2 shows the results of the univariate and multivariate analysis of the total study population. Table S4 shows the results of the univariate and multivariate analysis in the male patients, and Table S5 shows those in the female patients. In the univariate analysis of the total population, age, drinking, ALP, UA, Ca, PINP, CTX, CVD, ASMI, BFM, BMI, AHR, FFMI and PhA were associated with BMD decreases. Furthermore, the multivariate analysis indicated that age, ALP, UA, Ca, CTX, CVD, ASMI and WHR were independent predictors of BMD decreases in the total population. In the univariate analysis of males, drinking, ALP, UA, PINP, CTX, ASMI, SMM, BMI, BMR, WHR and FMI were associated with BMD decreases. Meanwhile, the multivariate analysis indicated that drinking, ALP, UA and ASMI were independent predictors of BMD decreases in males. In the univariate analysis of females, age, Ca, PINP, CTX, CVD, ASMI, PFFM, ICW, ECW, BFM, BMI, PBF, WHR, FFMI and PhA were associated with BMD decreases. Moreover, a multivariate analysis suggested that age, PINP, ICW and PBF were independent predictors of BMD decreases in females.
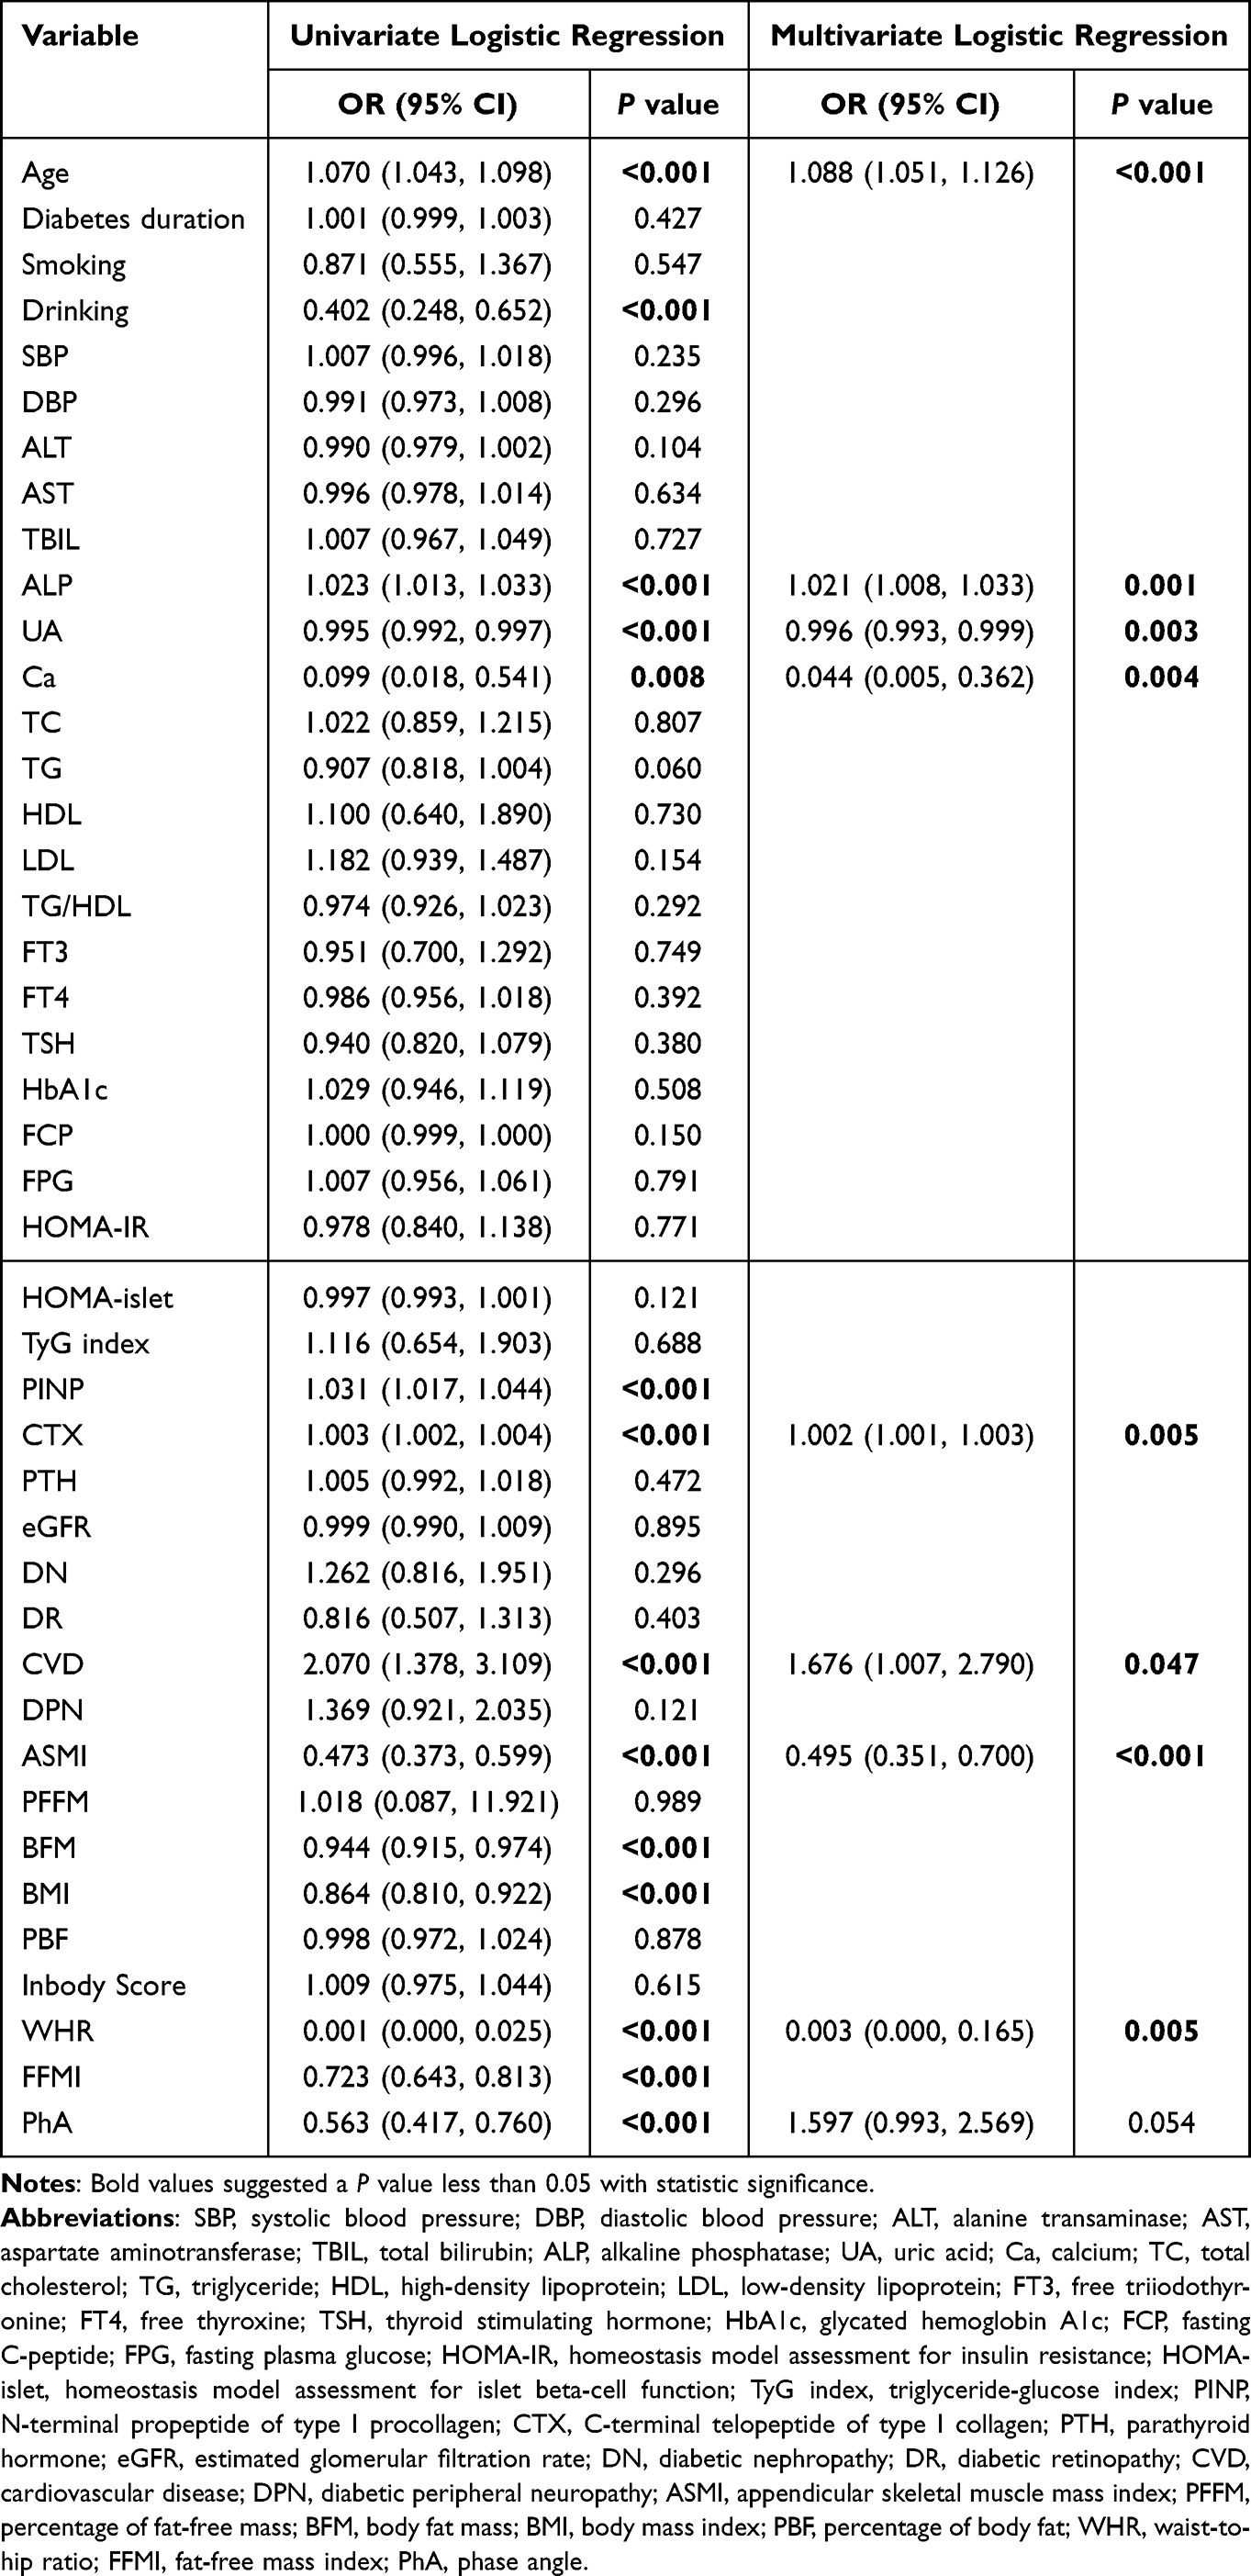 |
Table 2 Univariate and Multivariate Analysis of Factors Associated with a BMD Decrease in Total Study Population |
ICW Was Positively Correlated with BMD
ICW was newly identified as an independent predictor of BMD decreases in female patients. The Spearman correlation analysis was further employed to investigate the relationship between ICW and BMD at different measured sites. For the first time, we found that ICW was positively correlated with BMD at the femoral neck, total hip, and lumbar vertebra (Figure S4, r = 0.42, r = 0.41, r = 0.31, respectively, P < 0.001). We also found that ICW was inversely associated with CTX (Figure S3, r = –0.18, P < 0.05).
The XGBoost Models Outperformed Most Other ML Models in Both Sexes
As our preliminary findings shown in Figure 2, the XGBoost models performed best in the male and female training datasets and showed the best performance in the female testing dataset compared with other ML models. Although LR and SVM performed best in the male testing dataset with an AUC of 0.87 and 0.87, the XGBoost model also showed excellent performance with an AUC of 0.80. The predefined evaluation indicators for the six ML models are summarized in Tables S6 and S7. The importance analysis of characteristics from the XGBoost models displayed that the top five variables were ALP, SMM, FMI, BMI, and CTX in male patients (Figure S5A) and CTX, age, PINP, ECW, and ICW in female patients (Figure S5B). However, due to the relatively small number of patients with T2DM, the model performance metrics reported should be interpreted with caution.
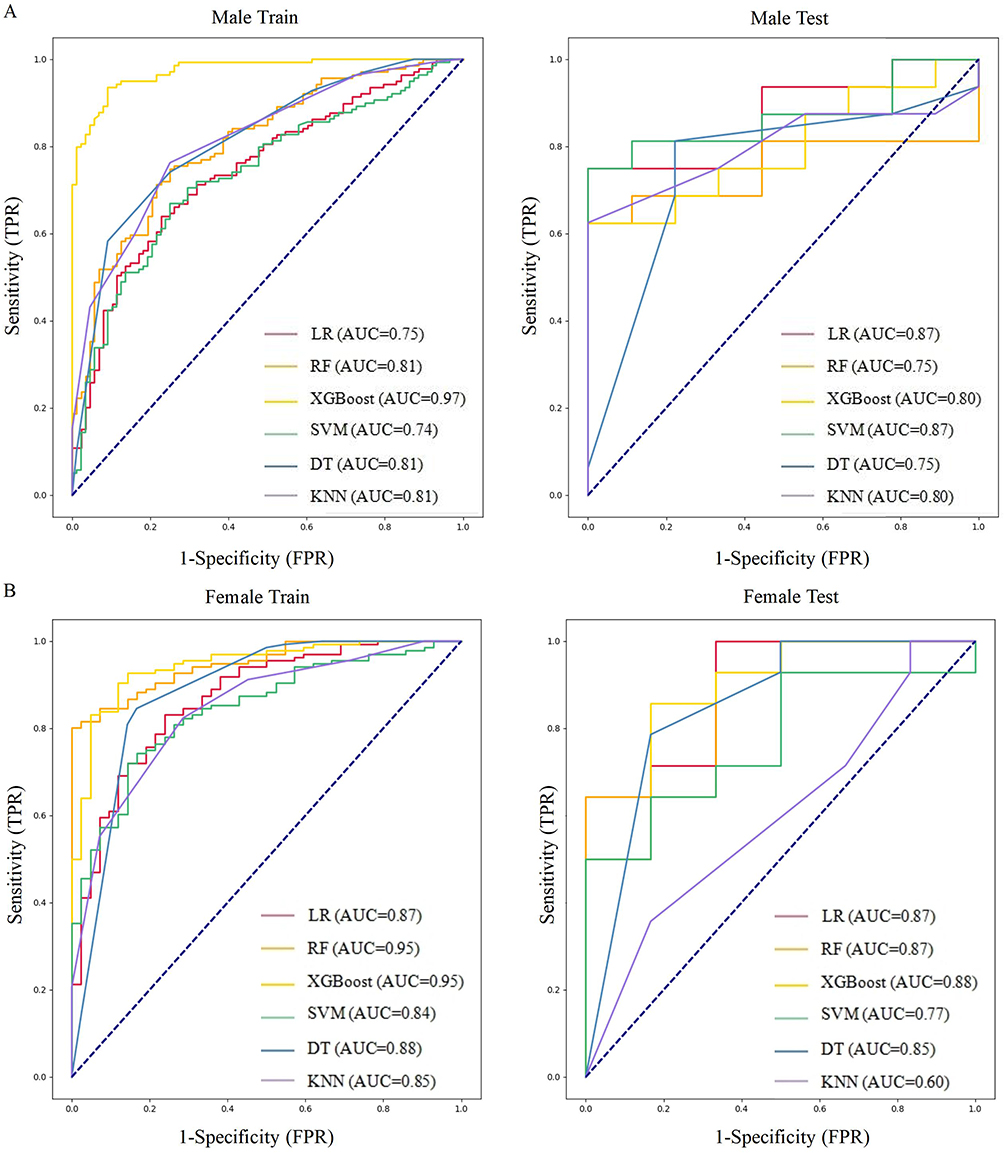 |
Figure 2 Comparison of ROC curves among different machine learning models. Abbreviations: ROC, receiver operating characteristic; BMD, bone mineral density; AUC, area under the curve; LR, logistic regression; RF, random forest; XGBoost, extreme gradient boost; SVM, support vector machine; DT, decision tree; KNN, k-nearest neighbors. Notes: (A) Comparison of ROC curves among different machine learning models for the prediction of BMD decreases in male patients. (B) Comparison of ROC curves among different machine learning models for the prediction of BMD decreases in female patients. |
The XGBoost Models Were Superior to the Traditional Multivariate Analysis Models
Two risk nomograms were established to predict BMD decreases based on independent predictors from the traditional multivariate analysis in males and females (Figure 3). The calibration curves of nomograms indicated moderate prediction accuracy in the training and testing datasets (Figure S6). The receiver operating characteristic (ROC) curves of the nomograms in the training and testing datasets in both sexes are presented in Figure 4. The AUCs were used to evaluate the discrimination performance between the nomograms and XGBoost models. The AUCs of the nomogram model were 0.784 and 0.722 in the male training and testing datasets, respectively (Figure 4A). Meanwhile, the AUCs of the XGBoost model were 0.970 and 0.800 in the male training and testing datasets, respectively. The AUCs of the nomogram model were 0.899 and 0.876 in the female training and testing datasets, respectively (Figure 4B). Meanwhile, the AUCs of the XGBoost model were 0.950 and 0.880 in the female training and testing datasets, respectively. Due to the small scale of our study population, direct comparisons between models should be interpreted cautiously. Consequently, a preliminary result is that the XGBoost models are superior to the nomogram models with respect to the discrimination capability. The decision curve analysis (DCA) was used to evaluate the clinical value of the nomograms and XGBoost models. The results of DCA revealed that the XGBoost models to predict the risk of BMD decreases obtained more net benefits over the all-treatment or no-treatment strategy within a wide range of threshold probabilities compared to the nomograms (Figure S7). These findings preliminarily revealed that the XGBoost model could appropriately predict the probability of BMD decreases in middle-aged and elderly T2DM patients and might be of excellent value for practical application.
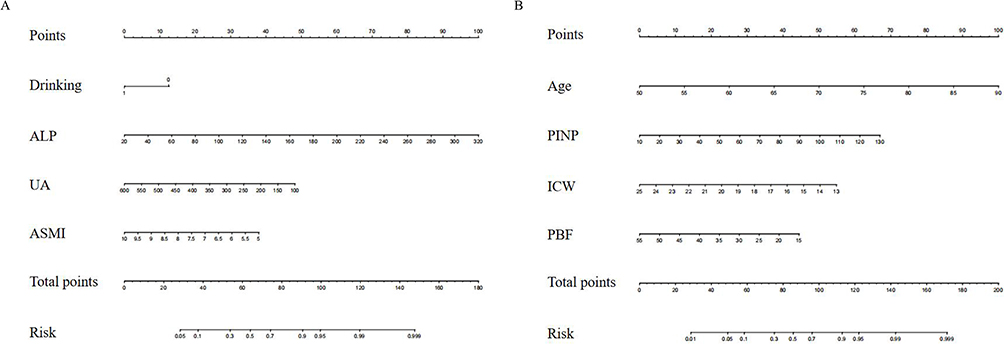 |
Figure 3 Nomograms to predict the incidence of BMD decreases. Abbreviations: BMD, bone mineral density; T2DM, type 2 diabetes mellitus; ALP, alkaline phosphatase; UA, uric acid; ASMI, appendicular skeletal muscle mass index; PINP, N-terminal propeptide of type I procollagen; ICW, intracellular water; PBF, percentage of body fat. Notes: (A) The nomogram was constructed for male T2DM patients, with drinking, ALP, UA, and ASMI incorporated. (B) The nomogram was constructed for female T2DM patients, with age, PINP, ICW, and PBF incorporated. In the drinking section of the figure, 0 represents non-drinking, and 1 represents drinking. |
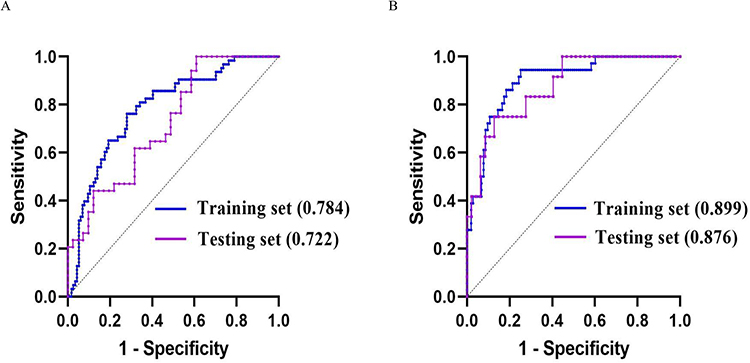 |
Figure 4 The ROC curves of the nomograms. Abbreviations: ROC, receiver operating characteristic; AUC, area under the curve; CI, confidence interval. Notes: (A) In male patients, the AUCs of the nomogram are 0.784 (95% CI: 0.715–0.854) in the training dataset and 0.722 (95% CI: 0.608–0.835) in the testing dataset, respectively. (B) In female patients, the AUCs of the nomogram are 0.899 (95% CI: 0.842–0.955) in the training dataset and 0.876 (95% CI: 0.774–0.978) in the testing dataset, respectively. |
Discussion
In recent years, OP and BMD decreases have been worldwide public health problems within the aging population, especially in T2DM patients. The coexistence of T2DM and a decrease in BMD increases the risk of fragility fractures, frequency of falls, and post-fracture mortality in the elderly. In previous studies, age, sex, smoking, diabetes duration,27 and hypocalcemia were recognized as risk factors for the occurrence of OP. In our findings, body composition parameters were proven to be closely related to BMD decreases. Additionally, drinking, ALP, UA, and ASMI were independent determinants of BMD decreases in males, whereas age, PINP, ICW, and PBF were independent determinants of BMD decreases in females. In addition, two nomograms of BMD decrease risk were constructed based on independent predictors. The XGBoost models showed better predictive ability than the traditional models in both sexes. Moreover, to our knowledge, this is the first study to use ML techniques to explore the relationship between body composition and BMD and, for the first time, we found a positive correlation between ICW and BMD in female T2DM patients.
Our results suggested that, compared with the participants in the normal BMD group from our total study population, and similar to most previous studies, those in the BMD decrease group were older and the BMD decrease group had a higher proportion of women. Age, ALP, UA, Ca, CTX, CVD, ASMI, and WHR were independent predictors of a BMD decrease in the total population. However, owing to the difference in baseline characteristics between men and women, we performed a subgroup analysis of sex and we found that drinking, ALP, UA, and ASMI were independent predictors of BMD decreases in males. In contrast to the findings of some previous studies,28,29 drinking was identified as a protective factor for BMD decreases in our study. One explanation could be that the residents in our study drank small amounts. The effect of minimal drinking on BMD remains controversial. Godos et al demonstrated that the BMD of light-drinkers was even higher than that of non-drinkers.30 The predictive effects of ALP, UA, and ASMI on BMD were consistent with those previous studies.31–33 As a representative index of relative muscle mass, ASMI can promote and interact with bone through mechanical action and endocrine or paracrine systems.34 Age, PINP, ICW, and PBF were independent predictors of BMD decreases in females. As previously reported, age, PINP, and PBF were confirmed to be predictive factors of BMD in our study.27,35,36 The predictive effect of ICW on BMD decreases has rarely been reported and this topic will be discussed later. Regarding the difference in predictive factors between males and females, the following reasons may contribute to these results. On the one hand, the proportion of male drinkers (32.5%) was substantially higher than that of female drinkers (1.5%), which might contribute to changes in the biochemical markers associated with drinking, such as ALP and UA. Because alcohol is mostly metabolized by the liver, some male participants’ excessive alcohol intake may result in elevated hepatogenic ALP and UA levels.37,38 As a result, in males rather than females, ALP and UA were more likely to show their significant effects on BMD. On the other hand, most women reach menopause around 50 years, which can lead to estrogen insufficiency, accelerate bone loss, and increase the risk of OP in women during this period. Additionally, postmenopausal bone loss is associated with a high rate of bone remodeling, increasing the number and activity of osteoclasts and osteoblasts, which finally leads to an elevated PINP level secreted by osteoblasts.39 This results in age and PINP being accurate predictors of BMD decreases in females. Previous studies have proven that ASMI and PBF are independent predictors of BMD.40–42 The difference in body composition that may determine BMD between males and females could be explained by the sex-specific effect. Older men have more muscle mass, whereas older women have more FM.43 As a result, muscle mass represented by ASMI is an independent predictor of BMD decreases in males, whereas PBF is an independent predictor of BMD decreases in females.
The most important finding in our study was that ICW was identified as an independent predictor of BMD decreases in females. To our knowledge, this is the first study to demonstrate that ICW is a protective factor against BMD decreases. ICW is considered to be a proxy for muscle cell mass because muscle cells contain large amounts of water, especially skeletal muscle.44,45 In a study completed by Yoshida et al, including 324 community-dwelling elderly Japanese people aged ≥ 75 years, ICW and muscle mass were highly positively correlated in both sexes.46 Silva et al revealed that ICW levels were significantly higher in athletes who increased their muscle strength by more than 3% than in those increasing by less than 3%. ICW was, therefore, proposed as a major predictor of strength and jump height in athletes.47 We concluded that ICW was not only related to muscle mass but also to muscle strength. As the close relationship between muscle mass and BMD,40,48 we infer that ICW may improve BMD in females through the effects of muscle cells on bone. However, in theory, men have more muscle mass and a higher level of ICW than women. Therefore, we need to explain why ICW has not been selected as a predictor of BMD in males in our study. The LASSO regression automatically removed ICW from our male models in the initial analysis due to the substantial collinearity between ICW and ASMI. Therefore, ICW was not included in subsequent statistical analyses and not selected as a predictor of BMD in males. ASMI and ICW reflected the protective effect of muscle mass on BMD from different perspectives. Further studies are needed in the future to verify our results.
To our knowledge, this is the first study incorporating body composition parameters to predict the risk of BMD decreases in T2DM patients over 50 years of age using ML algorithms. More importantly, this is the first time that ICW has been considered to be an independent predictor of BMD decreases in the female T2DM population. Our study indicated, compared with the traditional multivariate regression models, that the XGBoost models had the best performance in predicting BMD decreases in both sexes. XGBoost is an ensemble learning algorithm, which uses DT as the underlying learner to achieve gradient boost. It is an improvement of the gradient boost tree and adds a regularization term to the loss function.49
As a groundbreaking study, our research is of significant value for clinical practice. By utilizing XGBoost algorithm predictive models as screening tools in the clinic, patients and clinicians will better evaluate the risk of BMD decreases. Body composition measurement may become a reliable substitute tool to assess the risk of BMD decreases in areas where DXA scanning is not available.
Several limitations of this study should be considered. Firstly, owing to the cross-sectional nature of the study, conclusions of causality may not be determined. Secondly, although ML-based algorithms have unique advantages of the methodological approaches that ML can utilize large-scale datasets to achieve different combinations of variables and output more accurate predictive results, these models contain a variety of algorithms, require large amounts of data for training, and have a complex operation process. Finally, due to the small number of participants, the entire study should be treated as preliminary, and conclusions should be drawn carefully. Consequently, in the future, we intend to collect multicentered data with large samples and conduct prospective studies to validate the predictive ability of the proposed models.
Conclusion
We developed and evaluated six ML models and compared them with traditional multivariate logistic regression models. The XGBoost models outperformed most other ML models in identifying the risk of BMD decreases in both sexes and achieved higher accuracy than the traditional statistics in our preliminary findings. In addition, we demonstrated for the first time that ICW could be used as an important predictor of BMD decreases in the female T2DM patients. The XGBoost algorithm is recommended for widespread application in future clinical practice, which will be extremely helpful for clinicians to accurately identify T2DM patients at risk of BMD decreases. Due to the limited sample size in the study, it is necessary to validate our findings in larger prospective cohort studies.
Data Sharing Statement
The datasets used and analyzed during the current study are available from the corresponding author on reasonable request.
Ethics Statement
This research study was complied with the Declaration of Helsinki, and approved by the Ethics Committee of the Third Affiliated Hospital of Soochow University (2023#029). All individuals provided written informed consent for the study.
Acknowledgments
We would like to acknowledge the hard and dedicated work of all the participants in this study for their contributions to data gathering and quality supervision.
Author Contributions
All authors made a significant contribution to the work reported, whether that is in the conception, study design, execution, acquisition of data, analysis and interpretation, or in all these areas; took part in drafting, revising or critically reviewing the article; gave final approval of the version to be published; have agreed on the journal to which the article has been submitted; and agree to be accountable for all aspects of the work.
Funding
This work was supported by Changzhou Science and Technology Program (CJ20190103, CJ20235089).
Disclosure
All authors report no conflicts of interest in this work.
References
1. Liu H, Wang G, Wu T, Hu J, Mu Y, Gu W. Association of skin autofluorescence with low bone density/osteoporosis and osteoporotic fractures in type 2 diabetes mellitus. J Diabetes. 2022;14(9):571–585. doi:10.1111/1753-0407.13309
2. Li T, Hu L, Yin XL, Zou Y, Fu HY, Li HL. Prevalence and risk factors of osteoporosis in patients with type 2 diabetes mellitus in Nanchang (China): a retrospective cohort study. Diabetes Metab Syndr Obes. 2022;15:3039–3048. doi:10.2147/dmso.S372348
3. Alswat KA. Gender disparities in osteoporosis. J Clin Med Res. 2017;9(5):382–387. doi:10.14740/jocmr2970w
4. Ha J, Jeong C, Han KD, et al. Comparison of fracture risk between type 1 and type 2 diabetes: a comprehensive real-world data. Osteoporos Int. 2021;32(12):2543–2553. doi:10.1007/s00198-021-06032-z
5. Vestergaard P. Discrepancies in bone mineral density and fracture risk in patients with type 1 and type 2 diabetes--a meta-analysis. Osteoporos Int. 2007;18(4):427–444. doi:10.1007/s00198-006-0253-4
6. Lee HS, Yoon JS, Park KJ, Lim JS, Hwang JS. The relationship between bone mineral density and type 2 diabetes in obese children and adolescents at the time of initial diagnosis. Horm Metab Res. 2019;51(1):42–46. doi:10.1055/a-0755-2799
7. Li GH, Cheung CL, Tan KC, et al. Development and validation of sex-specific Hip fracture prediction models using electronic health records: a retrospective, population-based cohort study. EClinicalMedicine. 2023;58:101876. doi:10.1016/j.eclinm.2023.101876
8. Dorna Mde S, Costa NA, Oliveira EP, et al. Association between phase angle, anthropometric measurements, and lipid profile in HCV-infected patients. Clinics. 2013;68(12):1555–1558. doi:10.6061/clinics/2013(12)13
9. Moseley KF, Dobrosielski DA, Stewart KJ, De Beur SM, Sellmeyer DE. Lean mass and fat mass predict bone mineral density in middle-aged individuals with noninsulin-requiring type 2 diabetes mellitus. Clin Endocrinol. 2011;74(5):565–571. doi:10.1111/j.1365-2265.2010.03965.x
10. Douchi T, Kuwahata R, Matsuo T, Uto H, Oki T, Nagata Y. Relative contribution of lean and fat mass component to bone mineral density in males. J Bone Miner Metab. 2003;21(1):17–21. doi:10.1007/s007740300003
11. Kang DH, Guo LF, Guo T, et al. Association of body composition with bone mineral density in northern Chinese men by different criteria for obesity. J Endocrinol Invest. 2015;38(3):323–331. doi:10.1007/s40618-014-0167-5
12. Reid IR, Plank LD, Evans MC. Fat mass is an important determinant of whole body bone density in premenopausal women but not in men. J Clin Endocrinol Metab. 1992;75(3):779–782. doi:10.1210/jcem.75.3.1517366
13. Cui LH, Shin MH, Kweon SS, et al. Relative contribution of body composition to bone mineral density at different sites in men and women of South Korea. J Bone Miner Metab. 2007;25(3):165–171. doi:10.1007/s00774-006-0747-3
14. Mao Y, Xu L, Xue T, et al. Novel nomogram for predicting the 3-year incidence risk of osteoporosis in a Chinese male population. Endocr Connect. 2021;10(9):1111–1124. doi:10.1530/ec-21-0330
15. Shim JG, Kim DW, Ryu KH, et al. Application of machine learning approaches for osteoporosis risk prediction in postmenopausal women. Arch Osteoporos. 2020;15(1):169. doi:10.1007/s11657-020-00802-8
16. Wang C, Zhang T, Wang P, et al. Bone metabolic biomarker-based diagnosis of type 2 diabetes osteoporosis by support vector machine. Ann Transl Med. 2021;9(4):316. doi:10.21037/atm-20-3388
17. Smets J, Shevroja E, Hügle T, Leslie WD, Hans D. machine learning solutions for osteoporosis-a review. J Bone Miner Res. 2021;36(5):833–851. doi:10.1002/jbmr.4292
18. Wu X, Park S. A prediction model for osteoporosis risk using a machine-learning approach and its validation in a large cohort. J Korean Med Sci. 2023;38(21):e162. doi:10.3346/jkms.2023.38.e162
19. Yoo TK, Kim SK, Kim DW, et al. Osteoporosis risk prediction for bone mineral density assessment of postmenopausal women using machine learning. Yonsei Med J. 2013;54(6):1321–1330. doi:10.3349/ymj.2013.54.6.1321
20. Wu X, Zhai F, Chang A, Wei J, Guo Y, Zhang J. Application of machine learning algorithms to predict osteoporosis in postmenopausal women with type 2 diabetes mellitus. J Endocrinol Invest. 2023. doi:10.1007/s40618-023-02109-0
21. Yosibash Z, Trabelsi N, Buchnik I, et al. Hip fracture risk assessment in elderly and diabetic patients: combining autonomous finite element analysis and machine learning. J Bone Miner Res. 2023;38(6):876–886. doi:10.1002/jbmr.4805
22. Melton LJ. How many women have osteoporosis now? J Bone Miner Res. 1995;10(2):175–177. doi:10.1002/jbmr.5650100202
23. Court-Brown CM, Caesar B. Epidemiology of adult fractures: a review. Injury. 2006;37(8):691–697. doi:10.1016/j.injury.2006.04.130
24. American Diabetes Association. 2. Classification and diagnosis of diabetes: standards of medical care in diabetes-2020. Diabet Care. 2020;43(Suppl 1):S14–s31. doi:10.2337/dc20-S002
25. Beaudart C, Bruyère O, Geerinck A, et al. Equation models developed with bioelectric impedance analysis tools to assess muscle mass: a systematic review. Clin Nutr ESPEN. 2020;35:47–62. doi:10.1016/j.clnesp.2019.09.012
26. Kanis JA. Assessment of fracture risk and its application to screening for postmenopausal osteoporosis: synopsis of a WHO report. WHO Study Group. Osteoporos Int. 1994;4(6):368–381. doi:10.1007/bf01622200
27. Ji Y, Geng N, Niu Y, et al. Relationship between geriatric nutritional risk index and osteoporosis in type 2 diabetes in Northern China. BMC Endocr Disord. 2022;22(1):308. doi:10.1186/s12902-022-01215-z
28. Cheraghi Z, Doosti-Irani A, Almasi-Hashiani A, et al. The effect of alcohol on osteoporosis: a systematic review and meta-analysis. Drug Alcohol Depend. 2019;197:197–202. doi:10.1016/j.drugalcdep.2019.01.025
29. Seabra O, Pereira VG, Espindula AP, et al. Even without changing the bone mineral density, alcohol consumption decreases the percentage of collagen, the thickness of bone trabeculae, and increases bone fragility. An Acad Bras Cienc. 2022;94(suppl 3):e20210661. doi:10.1590/0001-3765202220210661
30. Godos J, Giampieri F, Chisari E, et al. Alcohol consumption, bone mineral density, and risk of osteoporotic fractures: a dose-response meta-analysis. Int J Environ Res Public Health. 2022;19(3):1.
31. Shu J, Tan A, Li Y, Huang H, Yang J. The correlation between serum total alkaline phosphatase and bone mineral density in young adults. BMC Musculoskelet Disord. 2022;23(1):467. doi:10.1186/s12891-022-05438-y
32. Kaushal N, Vohora D, Jalali RK, Jha S. Review of the literature examining the association of serum uric acid with osteoporosis and mechanistic insights into its effect on bone metabolism. Endocr Metab Immune Disord Drug Targets. 2019;19(3):259–273. doi:10.2174/1871530318666181102115106
33. Hyassat D, Alyan T, Jaddou H, Ajlouni KM. Prevalence and risk factors of osteoporosis among Jordanian postmenopausal women attending the national center for diabetes, endocrinology and genetics in Jordan. Biores Open Access. 2017;6(1):85–93. doi:10.1089/biores.2016.0045
34. Kirk B, Feehan J, Lombardi G, Muscle DG. Bone, and fat crosstalk: the biological role of myokines, osteokines, and adipokines. Curr Osteoporos Rep. 2020;18(4):388–400. doi:10.1007/s11914-020-00599-y
35. Scariano JK, Glew RH, Bou-Serhal CE, Clemens JD, Garry PJ, Baumgartner RN. Serum levels of cross-linked N-telopeptides and aminoterminal propeptides of type I collagen indicate low bone mineral density in elderly women. Bone. 1998;23(5):471–477. doi:10.1016/s8756-3282(98)00126-4
36. Li Y, Huang Z, Gong Y, Zheng Y, Zeng Q. Retrospective analysis of the relationship between bone mineral density and body composition in a health check-up Chinese population. Front Endocrinol. 2022;13:965758. doi:10.3389/fendo.2022.965758
37. Whitfield JB, Heath AC, Madden PA, Pergadia ML, Montgomery GW, Martin NG. Metabolic and biochemical effects of low-to-moderate alcohol consumption. Alcohol Clin Exp Res. 2013;37(4):575–586. doi:10.1111/acer.12015
38. Whitfield JB, Hensley WJ, Bryden D, Gallagher H. Some laboratory correlates of drinking habits. Ann Clin Biochem. 1978;15(6):297–303. doi:10.1177/000456327801500171
39. Manolagas SC, O’brien CA, Almeida M. The role of estrogen and androgen receptors in bone health and disease. Nat Rev Endocrinol. 2013;9(12):699–712. doi:10.1038/nrendo.2013.179
40. Pan Y, Xu J. Association between muscle mass, bone mineral density and osteoporosis in type 2 diabetes. J Diabetes Investig. 2022;13(2):351–358. doi:10.1111/jdi.13642
41. Prakash KO, Choudhary R, Singh G. Lean body mass, body fat percentage, and handgrip strength as predictors of bone mineral density in postmenopausal women. J Midlife Health. 2021;12(4):299–303. doi:10.4103/jmh.jmh_21_21
42. Casale M, von Hurst PR, Beck KL, et al. Lean mass and body fat percentage are contradictory predictors of bone mineral density in pre-menopausal pacific island women. Nutrients. 2016;8(8). doi:10.3390/nu8080470
43. Jang HC. Diabetes and muscle dysfunction in older adults. Ann Geriatr Med Res. 2019;23(4):160–164. doi:10.4235/agmr.19.0038
44. Hirata K, Iida N, Kanda A, et al. Association of age-related decrease in intracellular-to-total water ratio with that in explosive strength of the plantar flexors: a cross-sectional study. J Physiol Anthropol. 2022;41(1):10. doi:10.1186/s40101-022-00284-2
45. Yamada Y, Matsuda K, Björkman MP, Kimura M. Application of segmental bioelectrical impedance spectroscopy to the assessment of skeletal muscle cell mass in elderly men. Geriatr Gerontol Int. 2014;14 Suppl 1:129–134. doi:10.1111/ggi.12212
46. Yoshida T, Yamada Y, Tanaka F, Yamagishi T, Shibata S, Kawakami Y. Intracellular-to-total water ratio explains the variability of muscle strength dependence on the size of the lower leg in the elderly. Exp Gerontol. 2018;113:120–127. doi:10.1016/j.exger.2018.09.022
47. Silva AM, Matias CN, Santos DA, Rocha PM, Minderico CS, Sardinha LB. Increases in intracellular water explain strength and power improvements over a season. Int J Sports Med. 2014;35(13):1101–1105. doi:10.1055/s-0034-1371839
48. Xu X, Xu N, Wang Y, et al. The longitudinal associations between bone mineral density and appendicular skeletal muscle mass in Chinese community-dwelling middle aged and elderly men. PeerJ. 2021;9:e10753. doi:10.7717/peerj.10753
49. Hsieh CH, Lu RH, Lee NH, Chiu WT, Hsu MH, Li YC. Novel solutions for an old disease: diagnosis of acute appendicitis with random forest, support vector machines, and artificial neural networks. Surgery. 2011;149(1):87–93. doi:10.1016/j.surg.2010.03.023
 © 2023 The Author(s). This work is published and licensed by Dove Medical Press Limited. The
full terms of this license are available at https://www.dovepress.com/terms
and incorporate the Creative Commons Attribution
- Non Commercial (unported, 3.0) License.
By accessing the work you hereby accept the Terms. Non-commercial uses of the work are permitted
without any further permission from Dove Medical Press Limited, provided the work is properly
attributed. For permission for commercial use of this work, please see paragraphs 4.2 and 5 of our Terms.
© 2023 The Author(s). This work is published and licensed by Dove Medical Press Limited. The
full terms of this license are available at https://www.dovepress.com/terms
and incorporate the Creative Commons Attribution
- Non Commercial (unported, 3.0) License.
By accessing the work you hereby accept the Terms. Non-commercial uses of the work are permitted
without any further permission from Dove Medical Press Limited, provided the work is properly
attributed. For permission for commercial use of this work, please see paragraphs 4.2 and 5 of our Terms.
Recommended articles
Development and Validation of a Model That Predicts the Risk of Diabetic Nephropathy in Type 2 Diabetes Mellitus Patients: A Cross-Sectional Study
Yang J, Jiang S
International Journal of General Medicine 2022, 15:5089-5101
Published Date: 20 May 2022
Development of Machine Learning Models for Predicting Osteoporosis in Patients with Type 2 Diabetes Mellitus—A Preliminary Study
Wu X, Zhai F, Chang A, Wei J, Guo Y, Zhang J
Diabetes, Metabolic Syndrome and Obesity 2023, 16:1987-2003
Published Date: 30 June 2023
Development and Validation of a Machine Learning–Based Clinical Model for Predicting Rupture in Ectopic Pregnancy: A Web-Based Nomogram Approach
Zhao X, Wu T, Zeng S, Yuan X, Liang X, Yang H, Ye L
Journal of Multidisciplinary Healthcare 2025, 18:5781-5799
Published Date: 13 September 2025
Development and External Validation of a Machine Learning-Based Model for Predicting Heart Failure Risk in Type 2 Diabetes
Liu Y, Wang P, Wang M, Chen Y, Kasyanju SM, Yang Y, Yang T, Peng L, Sun M
Diabetes, Metabolic Syndrome and Obesity 2025, 18:4177-4191
Published Date: 13 November 2025
A Machine Learning and Traditional Chinese Medicine Constitution–Based Prediction Model for Mild Cognitive Impairment in Community-Dwelling Older Adults
Xu Q, Huang Z, Su W, Cai A, Chen Z, Zhou W, Li J, Chen X
Neuropsychiatric Disease and Treatment 2026, 22:608660
Published Date: 17 June 2026