Back to Journals » International Journal of General Medicine » Volume 15
ESPL1 is Elevated in Hepatocellular Carcinoma and Predicts Prognosis
Authors Song R, Huang J, Yang C, Li Y ![]() , Zhan G, Xiang B
, Zhan G, Xiang B ![]()
Received 15 July 2022
Accepted for publication 21 November 2022
Published 28 November 2022 Volume 2022:15 Pages 8381—8398
DOI https://doi.org/10.2147/IJGM.S381188
Checked for plagiarism Yes
Review by Single anonymous peer review
Peer reviewer comments 4
Editor who approved publication: Dr Scott Fraser
Rui Song,1,2,* Juntao Huang,1,2,* Chenglei Yang,1,2 Yuankuan Li,1,2 Guohua Zhan,1,2 Bangde Xiang1– 3,*
1Department of Hepatobiliary Surgery, Guangxi Medical University Cancer Hospital, Nanning, People’s Republic of China; 2Key Laboratory of Early Prevention and Treatment for Regional High-Frequency Tumors, Ministry of Education, Nanning, People’s Republic of China; 3Guangxi Liver Cancer Diagnosis and Treatment Engineering and Technology Research Center, Nanning, People’s Republic of China
*These authors contributed equally to this work
Correspondence: Bangde Xiang, Department of Hepatobiliary Surgery, Guangxi Medical University Cancer Hospital, 71 Hedi Road, Qingxiu District, Nanning, Guangxi, 530021, People’s Republic of China, Tel +86-7715301253, Email [email protected]
Purpose: The extra spindle pole bodies-like 1 (ESPL1) gene is associated with malignant biological behaviors in several tumors. Nevertheless, the correlation between hepatocellular carcinoma (HCC) and ESPL1 has not been determined. The present study analyzed the molecular function and prognostic value of ESPL1 in HCC.
Patients and Methods: Samples from 121 HCCs and 119 adjacent normal tissue specimens were subjected to next-generation sequencing. Clinicopathological and genetic data of HCC patients in The Cancer Genome Atlas (TCGA) were also collected. ESPL1 expression was assessed in 20 pairs of HCC and normal liver specimens by qRT-PCR and immunohistochemistry (IHC). The prognostic value of ESPL1 expression was determined by Cox univariate and multivariate regression analyses. ESPL1-related co-expressed genes were evaluated by weighted gene co-expression network analysis (WGCNA). Processes and pathways involving ESPL1 in HCC were determined by Gene Ontology (GO) enrichment and Kyoto Encyclopedia of Genes and Genomes (KEGG) pathway analyses. The prognostic values of hub genes were determined by joint effect survival analysis.
Results: RNA-Seq, RT-qPCR and IHC showed that ESPL1 expression was significantly higher in HCC than in normal liver tissues. Increased ESPL1 expression, greater tumor size and advanced BCLC stage were independently prognostic of poorer overall survival; and increased ESPL1 and advanced BCLC stage were independently prognostic of poorer recurrence-free survival. WGCNA showed that the top 10 co-expressed genes associated with ESPL1 were GTSE1, KIF18B, BUB1B, GINS1, PRC1, KIF23, KIF18A, TOP2A, NEK2 and FANCD2. Enrichment analysis indicated that ESPL1 and its co-expressed genes might be involved in the cell cycle and cell division of HCC. Joint effect survival analysis showed that the mortality rate was approximately 3.37 times higher in HCC patients with high than low expression of ESPL1, GTSE1, BUB1B, PRC1, KIF23, and TOP2A.
Conclusion: ESPL1 might be associated with cell cycle and might be an effective prognostic indicator in patients with HCC.
Keywords: hepatocellular carcinoma, extra spindle pole bodies-like 1, prognosis
Introduction
Hepatocellular carcinoma (HCC) is the sixth most frequent type of cancer worldwide, with the third highest mortality rate.1 Although surgery is regarded as the most effective treatment for patients with HCC, the high incidence of tumor relapse after surgery can negatively affect post-treatment outcomes and survival.2,3 Tumor recurrence within 5 years after surgery, has been observed in 70% of HCC patients worldwide.4 Furthermore, tumor heterogeneity contributes to increased tumor resistance to conventional chemotherapy and targeted therapies.5 Identification of new prognostic biomarkers and therapeutic targets may improve clinical outcomes in patients with HCC.
The extra spindle pole bodies-like 1 (ESPL1) gene encodes a protein involved in the cell cycle. The ESPL1 protein is primarily involved in the anaphase process of sister chromatid cohesion release by cleaving the mucin subunit SCC1, which initiates the final separation of sister chromatids.6 ESPL1 expression is elevated and predicts poor outcomes in patients with various types of cancer, including breast cancer,7 glioma8 and endometrial cancer.9 A Chinese case-control study found that the level of ESPL1 was higher in HBV-associated than in non-HBV-associated HCC, suggesting that serum ESPL1 can be a biomarker of HCC recurrence in HBV-associated HCC.10 To date, however, the genetic aspects and molecular function of ESPL1 in HCC have not yet been investigated.
The present study assessed whether ESPL1 can act as a prognostic marker in patients with HCC. Samples from the Guangxi cohort and The Cancer Genome Atlas (TCGA) were subjected to next-generation sequencing to determine the level of expression, prognostic value, and biological function of ESPL1 and its encoded. Total RNA was isolated from HCCs and adjacent normal tissue samples, and ESPL1 mRNA levels were evaluated by real-time quantitative-polymerase chain reaction (qRT-PCR), Protein expression detected by IHC. This study showed that high expression of ESPL1 was associated with a poorer prognosis in patients with HCC, suggesting that ESPL1 may be a promising biomarker and a treatment target in patients with HCC.
Materials and Methods
Clinical Tissue Specimens
HCC and adjacent normal liver tissue samples for next-generation sequencing were collected from 121 patients who had been pathologically diagnosed with HCC and had undergone tumor resection at the Hepatobiliary Surgery unit of Guangxi Medical University Cancer Hospital from April 2018 to July 2019. There were no restrictions with respect to age and sex. HCC patients were excluded if they had other co-occurring tumors, had very little tumor tissue, had received preoperative radiotherapy and/or chemotherapy, or refused to provide written informed consent. Twenty additional pairs of HCC and adjacent normal liver tissue samples were also collected for qRT-PCR and IHC validation. The study protocol was approved by the Ethics Committee of the Cancer Hospital of Guangxi Medical University and conformed to the principles of the Helsinki Declaration. All patients provided written informed consent for their anonymized data to be analyzed for research purposes.
RNA-seq
Frozen samples of 121 HCCs and 119 adjacent normal tissues were subjected to RNA sequencing. Each tissue sample was added to an EP tube containing 1 mL of MagZol Reagent (Trizol lysis solution) to extract total RNA. Integrity of each total RNA sample, expressed as RNA integrity number (RIN), was subsequently determined using a 2100 Bioanalyzer (Agilent) analyzer, and the absorbances of each RNA sample at 260 nm and 280 nm were measured using an Epoch 2 microplate spectrophotometer. The screening standards included an OD260/280 ratio between 1.9 and 2.0 and an RIN ≥ 4. Cytoplasmic and mitochondrial rRNA were removed from each total RNA sample using Ribo-Zero™ Magnetic Gold Kit (Human). Each RNA sample was randomly cleaved into short template fragments of 200–500 bp and reversed transcribed to yield a cDNA library. The concentration of each cDNA sequencing library was measured by Qubit 2.0 dsDNA HS Assay (Thermo Fisher Scientific). Finally, the cDNA library samples were subjected to DNA analysis using an Agilent BioAnalyzer 2100, with the distribution of cDNA fragments analyzed by agarose gel electrophoresis. Each cDNA library was sequenced on an Illumina HiSeq 2000 high-throughput sequencer using a 2×150 paired-end sequencing protocol (Illumina), with the original sequencing data obtained in FASTQ format.
RNA‑seq Data Quality Control and Analysis
Quality-controlled raw data were matched with the sequence of a human reference genome (gencode hg19) using the sequence alignment software Hisat. Exons of different genes were alternatively spliced to yield the final RNA sequence for each sample, and the measured clean reads were compared with the annotation information of the human reference genome, based on the number of reads that uniquely matched a gene and all reads that uniquely matched the reference genome sequence quantity, thus determining the levels of expression of all genes matched on all samples. Theoretically, the number of reads aligned for a single gene correlated positively with the expression of that gene. During the actual calculation process, however, quantitative gene expression was found to be closely related with sequencing depth and gene length. Therefore, the actual level of expression of each gene was determined by a normalization method using the algorithm FPKM. Differentially expressed genes (DEGs) in tumors and adjacent normal tissues were screened using the “DESeq2” package of R software, with a |log 2 fold change| (|log2FC|) ≥0.6 and adjusted P< 0.05 regarded as the threshold.
qRT-PCR
Total RNA was extracted from HCC and adjacent normal tissues using TRIzol reagent (TaKaRa, Japan), followed by reverse transcription of RNA into cDNA (Monad, China). ESPL1 mRNA was quantified using an SYBR Green Master kit (Hieff, China) and the specific primers 5’-ATCTCTGTCAGTCGGACCTGCA-3’ (forward) and 5’-CAGGTGGACCTTCTTCACAGAG-3’ (reverse); as a loading control, the same cDNA samples were subjected to qRT-PCR using primers for β-actin, 5’-GTCATTCCAAATATGAGATGCGT-3’ (forward) and 5’-GCTATCACCTCCCCTGTGTG-3’ (reverse). All PCR amplifications were performed using the AriaMx Real-time PCR System (Agilent, USA), with the amplification protocol consisting of an initial denaturation at 95°C for 5 min, followed by 40 cycles of denaturation at 95°C for 10s, annealing at 62°C for 15s, and extension at 72°C for 20s. The relative expression of ESPL1 mRNA to β-actin mRNA was determined using the 2-∆∆ Ct method.
Immunohistochemistry Analysis
We used IHC analysis to verify the expression of ESPL1 in HCC and adjacent tissues at the protein level. Collected tissue specimens were formalin fixed and embedded with paraffin. Tissue sections (4 μm thickness) were used in IHC staining analyses. The sections were deparaffinized in xylene and rehydrated by graded ethanol. Antigen retrieval was carried out using sodium citrate buffer (pH 6.0) at 95°C for 20 minutes. After quenching endogenous peroxidase activity with 3% H2O2 and blocking non-specific binding with 1% bovine serum albumin buffer. The sections were incubated with primary anti-ESPL1 antibody (Sigma-Aldrich, SAB4503690, Saint Louis, USA) at 1:100 dilution and incubation at 37 °C for 80 minutes. Sections were incubated with secondary antibody (MaxVisionTM HRP-Polymer anti-Mouse/Rabbit IHC Kit, KIT-5030, Fuzhou, China) for 25 minutes at room temperature, finally, stained with diaminobenzidine (MaxVision, DAB-1031, Fuzhou, China).11 IHC outcomes were assessed through two pathologists who were blinded to group allocation, and all differences were resolved through discussion.
Genomic Data Mining
Independent sets of genomic data and clinical parameters were collected from The Cancer Genome Atlas (TCGA, https://tcga-data.nci.nih.gov accessed February 10, 2022), a public database. Data were obtained from the Gene Expression Profiling Interactive Analysis (GEPIA) webserver (http://gepia.cancer-pku.cn/index.html; accessed February 10, 2022),12 and the correlations among gene expression patterns, tumor stages and the ability of ESPL1 expression to predict survival outcomes were analyzed in patients with HCC. In addition, data on the expression of ESPL1 protein in HCC and adjacent normal tissues were obtained from the Human Protein Atlas (HPA, https://www.proteinatlas.org/; accessed March 1, 2022).13 The mutation frequency of the ESPL1 gene was assessed in the cBioPortal database14 (http://www.cbioportal.org/, accessed March 1, 2022). Drug sensitivity associated with the ESPL1 gene was analyzed in the Genomics of Drug Sensitivity in Cancer (GDSC) database and immune cell infiltration of HCCs associated with the ESPL1 gene by Gene Set Cancer Analysis (GSCA, https://www.proteinatlas.org/, accessed March 2, 2022).15 The single-cell sequencing data of six HCCs16 were obtained from the Tumor Immune Single-cell Hub (TISCH, http://tisch.comp-genomics.org/home/).17 We entered the type of cancer and the name of the gene in the “dataset” option and the results of the single cell analysis were generated.
Weighted Gene Co‑expression Network Analysis
Based on the median expression of ESPL1 mRNA, patients with HCC were classified into high and low expression groups. Differences in gene expression between these two groups were determined using “DESeq2” to screen DEGs, with log2 fold changes | (log2FC) |>1 and adjusted P< 0.05 set as the threshold. Weighted gene co-expression network analysis (WGCNA) was performed to identify ESPL1-related co-expressed DEGs that formed the ESPL1 gene co-expression network. Briefly, a soft threshold power with a scale-free R2 > 0.9 and a slope near 1 was selected to transform the adjacency matrix to a topological overlap matrix. To establish networks and identify modules, the minimum size of the module was set at 30, the cutting height at 0.25, and the soft threshold power at 3. Highly similar modules were merged to create a compression network. The correlations of modules and clinical parameters with the ESPL1 gene were determined. In addition, the genes in each module with high connectivity in the weighted co-expression network were selected, and the Pearson correlation coefficients of gene expression with clinical parameters were calculated as gene significance (GS). Generally, modules with higher values showed more powerful correlations with ESPL1 and clinical parameters. Modules that correlated significantly with ESPL1 were considered interested modules, with modules identified as having key genes when their |MM| > 0.8 and their |GS| > 0.4. The biological processes and enrichment pathways associated with key genes in the interested modules were analyzed using GO and KEGG.
Hub Gene Identification and Prognostic Analysis
Genes of weight >0.2 in the WGCNA modules that correlated significantly with ESPL1 were entered into Cytoscape software (version 3.8.2) to further analyze PPI networks and select hub genes.18 Using the cytoHubba plugin in Cytoscape, the top 10 hub genes in the ESPL1 gene-related module were selected and visualized by the Degree method. A prognostic scoring model based on gene prognostic contribution coefficients (β) was also determined,19 and the predictive prognostic ability of these genes was validated using the TCGA dataset.
Statistical Analysis
Statistical analyses were performed using R 4.1.0 (https://www.r-project.org/) or SPSS 22.0 (IBM, Armonk, NY, USA) software, with P-values <0.05 considered statistically significant. Each clinical parameter was evaluated by univariate and multivariate Cox regression analyses. Differences between groups were analyzed by paired or unpaired Student’s t-tests. All graphics were visualized using PRISM8.3.0 (Graph Pad, San Diego, CA, USA) and R 4.1.0.
Results
ESPL1 is Frequently Upregulated in HCC and Regulates the Cell Cycle
Tissue samples were obtained from 121 patients with HCC in the Guangxi cohort, including from 121 tumors and 119 adjacent normal tissue samples. These 121 patients included 105 (86.8%) men and 16 (13.2%) women, of mean age 50.6 years, who were followed-up for a median 25 months (Table 1). For validation, 374 patients with HCC in the TCGA dataset were analyzed, with data obtained from 374 tumor tissues and 50 adjacent normal tissues. After excluding patients whose survival time was 0 or unknown, 365 patients were analyzed, with data obtained from 365 tumors and 50 adjacent normal tissue samples. These 365 patients included 246 (67.3%) men and 119 (32.7%) women, of mean age 59.6 years, who were followed-up for a median 19.8 months (Table S1).
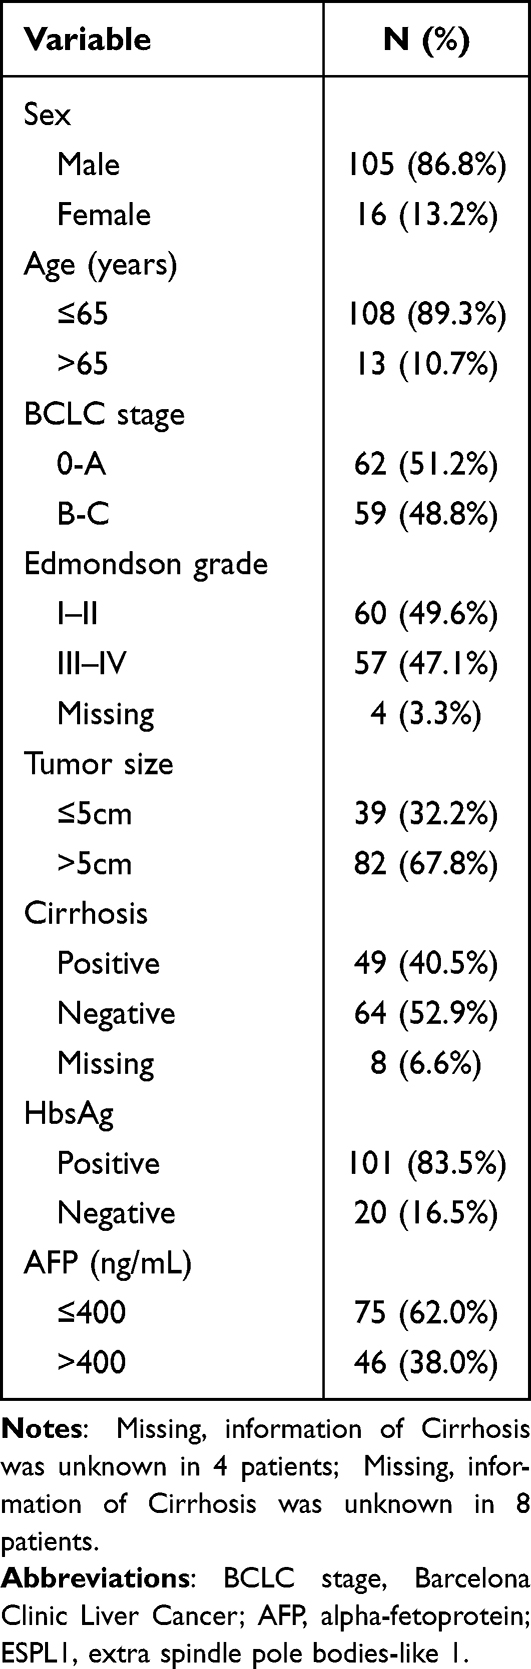 |
Table 1 Clinical Baseline Characteristics of HCC Patients in Our Cohort |
RNA-seq analysis showed that ESPL1 mRNA expression was markedly higher in HCC samples than in adjacent normal tissue and increased as differentiation worsened and BCLC stages progressed (Figures 1A–D). For validation, ESPL1 mRNA expression was assessed by qRT-PCR in 20 pairs of samples obtained from patients with HCC who underwent resection at our hospital. Consistent with the RNA-seq data, ESPL1 mRNA expression was higher in HCC samples than in adjacent normal tissue (Figure 1E). Similar results were obtained in the TCGA cohort (Figure S1).
 |
Figure 1 ESPL1 mRNA expression in HCC in the Guangxi RNA-seq database. (A and B) ESPL1 expression levels in tumors and adjacent normal tissues. (C and D) Association between ESPL1 expression and clinical characteristics. (E) qRT-PCR validation of ESPL1 expression in tumor tissues and adjacent normal tissues. ****P < 0.0001; **P < 0.01; *P < 0.05. Abbreviations: T, tumor tissues; N, normal tissues; BCLC, Barcelona-Clinic Liver Cancer; ESPL1, extra spindle pole bodies-like 1; HCC, hepatocellular carcinoma. |
Immunohistochemistry also confirmed that the expression of ESPL1 was significantly upregulated in HCC tissues compared with normal liver tissues (Figures 2A and E). ESPL1 was mainly expressed in the nucleus, cytoplasm or both. Furthermore, immunofluorescence staining showed that ESPL1 was mainly expressed in the nucleoplasm of three cell lines, the human skin squamous cell carcinoma (A-431), human osteosarcoma (U2-OS) and human glioma (U-251 MG) cell lines (Figure 2B). ESPL1 expression increased sequentially during the cell cycle, from G1 to S transition (S-tr) to the S and G2 phases, being highest in the S and G2 phases, suggesting that ESPL1 may promote tumor development by accelerating the process of DNA synthesis (Figures 2C and D).
 |
Figure 2 ESPL1 protein is greatly expressed in HCC samples. (A and E) Immunohistochemical staining of HCC tissue samples and adjacent normal tissues. (Magnification, 100× and 400×; *P < 0.05.) (B) Immunofluorescent staining of human epidermoid carcinoma (A-431), osteosarcoma (U2-OS) and glioblastoma (U-251 MG) cell lines in the HPA database. The red color represents microtubule and the green color represents ESPL1. (C and D) ESPL1 expression level and cell cycle phase in single U-2 OS cells. Abbreviations: HPA, the human protein atlas; HCC, hepatocellular carcinoma. |
ESPL1 Overexpression is Associated with Poorer Outcome
A comparison of HCC patients with high and low ESPL1 mRNA expression showed that high expression of ESPL1 in HCC was associated with poorer survival outcomes (Figure 3). Multivariate Cox regression analysis showed that high ESPL1 expression (hazard ratio [HR] =2.004, P=0.032), larger tumor size (HR=2.468, P=0.021), and more advanced BCLC stage (HR=1.956, P=0.038) were independent risk factors for poorer overall survival (Table 2). In addition, high ESPL1 expression (HR=1.653, P=0.036) and more advanced BCLC stage (HR=2.217, P=0.002) were independent risk factors for poorer recurrence-free survival (RFS). High expression of ESPL1 mRNA (HR=1.757, P=0.005) was also an independent risk factor for poorer OS in the TCGA cohort (Table S2).
 |
Table 2 Univariate and Multivariate Analysis of OS and RFS in HCC Patients Based on Our Cohort |
 |
Figure 3 Effects of ESPL1 mRNA expression level on survival in patients with HCC. Relationship of ESPL1 mRNA with OS (A and C) and RFS (B and D) in the (A and B) Guangxi cohort and (C and D) the GEPIA database. Abbreviations: ESPL1, extra spindle pole bodies-like 1; OS, overall survival; RFS, recurrence-free survival; GEPIA, gene expression profiling interactive analysis; HCC, hepatocellular carcinoma. |
ESPL1 Related Gene Co-Expression and Prognostic Analysis
The network of genes co-expressed with ESPL1 genes was assessed by WGCNA analysis. A weighted gene network was constructed, with 3 selected as the threshold β of a suitable adjacency matrix; this threshold satisfied the criterion that the network was close to scale-free (Figure 4A), Subsequently, five modules were identified via the merged dynamic (Figure 4B), The association of modules with ESPL1 was assessed using a heatmap (Figure 4D), with the results suggesting that the blue model was most positively associated with ESPL1 mRNA expression (r=0.89, P<0.001) (Figure 4C), whereas the green, brown and red modules were negatively correlated with ESPL1 mRNA expression. In the blue model, genes associated with the cell cycle and cell division pathways were significantly enriched in analyses of the GO and KEGG (Figure 5, Tables S3 and S4). This enabled the identification of the top 10 hub genes of the blue model, including GTSE1, KIF18B, BUB1B, GINS1, PRC1, KIF23, KIF18A, TOP2A, NEK2, and FANCD2 (Figure 4E).
 |
Figure 4 WGCNA analysis of: (A) network topology for various soft-thresholding powers (weighted coefficient, β). The x-axis represents different soft-thresholding powers. The y-axis represents the correlation coefficient between log (k) and log [P(k)]. The red line indicates a correlation coefficient of 0.9. (B) Clustering gene dendrogram showing five co-expressed modules (different colors) in patients with HCC. (C) Scatter plot of gene and module correlation within the blue module. (D) Heatmap showing the relationships between modules and clinical parameters; the correlation coefficient and corresponding P-value are shown in each cell. (E) Top 10 genes in the blue module. Abbreviations: WGCNA, weighted correlation network analysis; HCC, hepatocellular carcinoma. |
 |
Figure 5 Enrichment analysis of GO and KEGG ontologies and pathways among DEGs in the blue module (A) GO-BP; (B) GO-CC; (C) GO-MF; (D) KEGG. Abbreviations: GO-BP, Gene Ontology-Biological Process; GO-CC, Gene Ontology-Cellular Component; GO-MF, Gene Ontology-Molecular Function; KEGG, Kyoto Encyclopedia of Genes and Genomes. |
The prognostic value of the top 10 ESPL1-related co-expressed hub genes was also investigated in HCC samples. The multivariate survival analysis included BCLC stage, Edmondson grade, age, tumor size and AFP concentration as adjusted prognostic factors. After adjustment, poorer OS was found to be significantly associated with high levels of expression of the genes G-2 and S-phase expressed 1 (GTSE1), BUB1B mitotic checkpoint serine/threonine kinase B (BUB1B), protein regulator of cytokinesis 1 (PRC1), kinesin family member 23 (KIF23) and DNA topoisomerase II alpha (TOP2A) (Figures 6A–F Table 3). Joint effect prognostic analysis found that the mortality rate was approximately 3.376 times higher in HCC patients with high than low expression of ESPL1, GTSE1, BUB1B, PRC1, KIF23 and TOP2A (Table 4 and Figure 6G).
 |
Table 3 Prognostic Values of Top 10 ESPL1 Co-Expressed Genes in HCC Based on Our Cohort |
 |
Table 4 Joint Effect Survival Analysis |
 |
Figure 6 Kaplan–Meier analysis of OS in patients relative to the levels of expression of the genes (A) ESPL1 (B) BUB1B (C) GTSE1 (D) KIF23 (E) PRC1 (F) TOP2A. (G) Joint model based on six genes. Abbreviations: HCC, hepatocellular carcinoma;ESPL1, extra spindle pole bodies like 1;BUB1B, BUB1 mitotic checkpoint serine/threonine kinase B;GTSE1, G-2 and S-phase expressed 1;KIF23, kinesin family member 23;PRC1, protein regulator of cytokinesis 1;TOP2A, DNA topoisomerase II alpha; OS, overall survival. |
Based on the median risk score, the 121 patients with HCC were divided into high- and low-risk groups. Kaplan-Meier analysis showed that OS was significantly lower in HCC patients with high than low risk scores (Figure 7A and B). Time-dependent receiver operating characteristic (ROC) curve analysis showed that the 1-, 2-, and 3-year areas under the curve (AUCs) were 0.71, 0.72 and 0.72, respectively (Figure 7C). Validation of the prognostic model in the TCGA dataset also showed that OS was significantly lower in the high-risk than in the low-risk group (Figure 7D and E), with time-dependent ROC curve analysis showing that the 1-, 2-, and 3-year AUCs were 0.74, 0.67 and 0.64, respectively (Figure 7F).
 |
Figure 7 Prognostic risk score model and time-dependent ROC curve of the ESPL1 gene in HCC (A–C) Guangxi cohort; (D–F) TCGA cohort. |
Relationship of ESPL1 Expression with Drug Sensitivity
ESPL1 gene expression was positively correlated with sensitivity to the drugs 17-AAG, RDEA119, and Trametinib (Figures S2A and S2B). Moreover, the ESPL1 mutation rate in HCC was 7% (Figure S2C).
ESPL1 is Enriched in Proliferating T Cells
The mechanisms underlying the biological effects of ESPL1 in HCC were further evaluated in scRNA-seq data. Proliferating T cells (Tprolif) were identified by their expression of ProlifMKI67, TOP2A and TYMS20,21 (Figure S3). ESPL1 was found to be clustered in the subset of Tprolif cells (Figures 8A–D). Consistent with the results of bulk RNA-seq data, enrichment analysis based on the hallmark database suggested that ESPL1 was involved in mitotic spindle formation, the G2M checkpoint and DNA repair (Figures 8E–G).
 |
Figure 8 Single cell profiling of six HCCs from the TISCH database. (A–C) UMAP and violin plots showing the expression levels of ESPL1. (D) Proportions of immune cells in tumor tissue of six HCC patients. (E–G) Pathway enrichment of proliferating T cells based on the HALLMARK dataset. Abbreviations: TISCH, tumor immune single-cell hub; HCC, hepatocellular carcinoma. |
Discussion
HCC is one of the most prevalent malignant tumors worldwide. Various factors are involved in the development of hepatocellular carcinoma, including chronic viral infections,22 changes in the immune microenvironment23 and abnormalities in metabolism.24,25 Samples from HCC patients admitted to Guangxi Medical University Cancer Hospital were subjected to next-generation sequencing, with these findings validated by qRT-PCR, IHC and in the TCGA database. In both the Guangxi and TCGA cohorts, ESPL1 were higher in tumors than in adjacent normal tissue samples, these findings are consistent with the results studies showing that the overexpression of ESPL1 was associated with the progression of other tumor types.7–9,26 In contrast, reduced expression of ESPL1 was associated with the progression of gastric carcinoma.27 Taken together, these findings show that the expression of ESPL1 varies among tumor types, but is more highly expressed in most tumors than in adjacent normal tissues. Clinically, ESPL1 overexpression correlated with poor outcomes and advanced tumor stages in patients with HCC, suggesting that ESPL1 level may predict tumor progression. In addition, univariate and multivariate survival analyses indicated that ESPL1 may be a promising biomarker for the prognosis of patients with HCC.
Analysis of genes co-expressed with ESPL1 indicated their involvement in cell cycle pathways, mitotic sister chromatid segregation, and HCC cell division. CDKs are often upregulated in cancer cells to allow easier progression through the cell cycle,28 suggesting that treatment with drugs that inhibit CDKs may be a novel therapeutic strategy.29 The top 10 co-expressed genes were included in prognostic analyses, with the results suggesting that enhanced expression of six genes, ESPL1, GTSE1, BUB1B, PRC1, KIF23 and TOP2A, may be associated with poor prognosis in patients with HCC.
GTSE1 is expressed specifically during the G2 and S phases of the cell cycle and may be a key regulator involved in mitosis.30 High GTSE1 expression is associated with poor prognosis in patients with breast cancer and HCC, and may enhance tumor cell proliferation and metastasis by upregulating the expression of EMT markers.31–33 PRC1, a microtubule-associated protein involved in cytokinesis, is overexpressed in various cancers, including pancreatic,34 breast35 and bladder36 cancers. PRC1 exerts an oncogenic effect on HCC by promoting cancer cell proliferation, stemness, metastasis and oncogenesis. Mechanistically, PRC1 can reinforce the Wnt signaling pathway to promote early HCC recurrence.37 KIF23 is a type of nuclear protein that has been shown critical in modulating cytokinesis. Dysregulated expression of KIF23, leading to poorer outcomes, has been observed in various cancers,38–41 indicating that KIF23 overexpression is widely associated with tumor progression. TOP2A is an essential nuclear enzyme that regulates the state of DNA during transcription and participates in processes of chromatid separation.42 TOP2A is also expressed in tumor tissues, with elevated expression of TOP2A in non-muscle-invasive bladder cancer being indicative of tumor progression and a high rate of recurrence.43 TOP2A is also involved in many other important biological behaviors—such as cell proliferation and invasion—which play pivotal roles in tumor initiation and progression, including in bladder urothelial carcinoma,44 ovarian cancer45 and HCC.46 In general, the prognostic model based on the six aberrantly expressed genes identified in the present study may be predictive of OS in patients with HCC.
The cell cycle is a regular and tightly regulated biological process that consists of four phases, pre-DNA synthesis (G1), DNA replication (S), late DNA synthesis (G2), and mitosis (M). Disruption and dysregulation of the cell cycle can lead to undesirable consequences, such as unlimited cell proliferation and tumors.47 The present study found that ESPL1 expression was highest in S and G2 phases, suggesting that ESPL1 may promote mitosis and tumor proliferation by regulating these phases of the cell cycle.
The present study had several limitations. First, our study suggests that this gene is associated with the cell cycle, but lacks experimental validation. In addition, in vitro and in vivo experiments are needed to determine the molecular function of ESPL1 and its mechanism of action.
Conclusion
In conclusion, the present study showed that ESPL1 was associated with cell cycle, cell proliferation and may be an effective prognostic indicator in patients with HCC.
Funding
This work was supported by grants from the National Natural Science Foundation of China (81960450), the High-Level Innovation Team and Outstanding Scholar Program in Guangxi Colleges and Universities, the “139” Projects for Training of High-level Medical Science Talents from Guangxi, the Key Research and Development Project of Guangxi (AB20297009, AA18221001, AB18050020), the Key Laboratory of Early Prevention and Treatment for Regional High-Frequency Tumors of the Ministry of Education, the Guangxi Independent Research Project (GKE2019-ZZ07, GKE-ZZ202005, GKE-ZZ202111), and the Development and Application of Medical and Health Appropriate Technology in Guangxi (S2019039).
Disclosure
The authors report no conflicts of interest.
References
1. Sung H, Ferlay J, Siegel RL, et al. Global cancer statistics 2020: GLOBOCAN estimates of incidence and mortality worldwide for 36 cancers in 185 countries. CA Cancer J Clin. 2021;71(3):209–249. doi:10.3322/caac.21660
2. Tabrizian P, Jibara G, Shrager B, Schwartz M, Roayaie S. Recurrence of hepatocellular cancer after resection: patterns, treatments, and prognosis. Ann Surg. 2015;261(5):947–955. doi:10.1097/SLA.0000000000000710
3. Wang S, Sun H, Xie Z, et al. Improved survival of patients with hepatocellular carcinoma and disparities by age, race, and socioeconomic status by decade, 1983–2012. Oncotarget. 2016;7(37):59820–59833. doi:10.18632/oncotarget.10930
4. Zhou J, Sun H, Wang Z, et al. Guidelines for the diagnosis and treatment of hepatocellular carcinoma (2019 edition). Liver Cancer. 2020;9(6):682–720. doi:10.1159/000509424
5. Heinrich S, Craig AJ, Ma L, Heinrich B, Greten TF, Wang XW. Understanding tumour cell heterogeneity and its implication for immunotherapy in liver cancer using single-cell analysis. J Hepatol. 2021;74(3):700–715. doi:10.1016/j.jhep.2020.11.036
6. Sun Y, Kucej M, Fan HY, Yu H, Sun QY, Zou H. Separase is recruited to mitotic chromosomes to dissolve sister chromatid cohesion in a DNA-dependent manner. Cell. 2009;137(1):123–132. doi:10.1016/j.cell.2009.01.040
7. Finetti P, Guille A, Adelaide J, Birnbaum D, Chaffanet M, Bertucci F. ESPL1 is a candidate oncogene of luminal B breast cancers. Breast Cancer Res Treat. 2014;147(1):51–59. doi:10.1007/s10549-014-3070-z
8. Liu Z, Lian X, Zhang X, et al. ESPL1 is a novel prognostic biomarker associated with the malignant features of glioma. Front Genet. 2021;12:666106. doi:10.3389/fgene.2021.666106
9. Yang Q, Yu B, Sun J, Huang G. TTK, CDC25A, and ESPL1 as prognostic biomarkers for endometrial cancer. Biomed Res Int. 2020;2020:4625123. doi:10.1155/2020/4625123
10. Wang R, Zang W, Hu B, et al. Serum ESPL1 can be used as a biomarker for patients with hepatitis B virus-related liver cancer: a Chinese case-control study. Technol Cancer Res Treat. 2020;19:1533033820980785. doi:10.1177/1533033820980785
11. Nie Z, Pu T, Han Z, et al. Extra spindle pole bodies-like 1 serves as a prognostic biomarker and promotes lung adenocarcinoma metastasis. Front Oncol. 2022;12:930647. doi:10.3389/fonc.2022.930647
12. Tang Z, Li C, Kang B, Gao G, Li C, Zhang Z. GEPIA: a web server for cancer and normal gene expression profiling and interactive analyses. Nucleic Acids Res. 2017;45(W1):W98–w102. doi:10.1093/nar/gkx247
13. Ullah M, Han K, Hadi F, Xu J, Song J, Yu DJ. PScL-HDeep: image-based prediction of protein subcellular location in human tissue using ensemble learning of handcrafted and deep learned features with two-layer feature selection. Brief Bioinform. 2021;22(6). doi:10.1093/bib/bbab278
14. Gao J, Aksoy BA, Dogrusoz U, et al. Integrative analysis of complex cancer genomics and clinical profiles using the cBioPortal. Sci Signal. 2013;6(269):pl1. doi:10.1126/scisignal.2004088
15. Liu CJ, Hu FF, Xia MX, Han L, Zhang Q, Guo AY. GSCALite: a web server for gene set cancer analysis. Bioinformatics. 2018;34(21):3771–3772. doi:10.1093/bioinformatics/bty411
16. Zheng C, Zheng L, Yoo JK, et al. Landscape of infiltrating T cells in liver cancer revealed by single-cell sequencing. Cell. 2017;169(7):1342–1356.e1316. doi:10.1016/j.cell.2017.05.035
17. Sun D, Wang J, Han Y, et al. TISCH: a comprehensive web resource enabling interactive single-cell transcriptome visualization of tumor microenvironment. Nucleic Acids Res. 2021;49(D1):D1420–d1430. doi:10.1093/nar/gkaa1020
18. Doncheva NT, Morris JH, Gorodkin J, Jensen LJ. Cytoscape StringApp: network analysis and visualization of proteomics data. J Proteome Res. 2019;18(2):623–632. doi:10.1021/acs.jproteome.8b00702
19. Ruan GT, Xie HL, Zhu LC, et al. Immune ULBP1 is elevated in colon adenocarcinoma and predicts prognosis. Front Genet. 2022;13:762514. doi:10.3389/fgene.2022.762514
20. Su Y, Chen D, Yuan D, et al. Multi-omics resolves a sharp disease-state shift between mild and moderate COVID-19. Cell. 2020;183(6):1479–1495.e1420. doi:10.1016/j.cell.2020.10.037
21. Sun Y, Wu L, Zhong Y, et al. Single-cell landscape of the ecosystem in early-relapse hepatocellular carcinoma. Cell. 2021;184(2):404–421.e416. doi:10.1016/j.cell.2020.11.041
22. Hu B, Huang W, Wang R, et al. High rate of detection of human ESPL1-HBV S fusion gene in patients with HBV-related liver cancer: a Chinese case-control study. Anticancer Res. 2020;40(1):245–252. doi:10.21873/anticanres.13946
23. Deng Z, Xiao M, Du D, et al. DNASE1L3 as a prognostic biomarker associated with immune cell infiltration in cancer. Onco Targets Ther. 2021;14:2003–2017. doi:10.2147/OTT.S294332
24. Yang Y, Ren P, Liu X, et al. PPP1R26 drives hepatocellular carcinoma progression by controlling glycolysis and epithelial-mesenchymal transition. J Exp Clin Cancer Res. 2022;41(1):101. doi:10.1186/s13046-022-02302-8
25. Chen M, Zhang C, Liu W, Du X, Liu X, Xing B. Long noncoding RNA LINC01234 promotes hepatocellular carcinoma progression through orchestrating aspartate metabolic reprogramming. Mol Ther. 2022;30(6):2354–2369. doi:10.1016/j.ymthe.2022.02.020
26. Prinzhorn W, Stehle M, Kleiner H, et al. c-MYB is a transcriptional regulator of ESPL1/Separase in BCR-ABL-positive chronic myeloid leukemia. Biomark Res. 2016;4:5. doi:10.1186/s40364-016-0059-2
27. Wang D, Zhu H, Guo M, et al. Expression and prognostic value of cell-cycle-associated genes in gastric adenocarcinoma. BMC Gastroenterol. 2018;18(1):81. doi:10.1186/s12876-018-0811-1
28. Canavese M, Santo L, Raje N. Cyclin dependent kinases in cancer: potential for therapeutic intervention. Cancer Biol Ther. 2012;13(7):451–457. doi:10.4161/cbt.19589
29. Kciuk M, Gielecińska A, Mujwar S, Mojzych M, Kontek R. Cyclin-dependent kinases in DNA damage response. Biochim Biophys Acta Rev Cancer. 2022;1877(3):188716. doi:10.1016/j.bbcan.2022.188716
30. Tipton AR, Wren JD, Daum JR, Siefert JC, Gorbsky GJ. GTSE1 regulates spindle microtubule dynamics to control Aurora B kinase and Kif4A chromokinesin on chromosome arms. J Cell Biol. 2017;216(10):3117–3132. doi:10.1083/jcb.201610012
31. Lin F, Xie YJ, Zhang XK, et al. GTSE1 is involved in breast cancer progression in p53 mutation-dependent manner. J Exp Clin Cancer Res. 2019;38(1):152. doi:10.1186/s13046-019-1157-4
32. Guo L, Zhang S, Zhang B, et al. Silencing GTSE-1 expression inhibits proliferation and invasion of hepatocellular carcinoma cells. Cell Biol Toxicol. 2016;32(4):263–274. doi:10.1007/s10565-016-9327-z
33. Wu X, Wang H, Lian Y, et al. GTSE1 promotes cell migration and invasion by regulating EMT in hepatocellular carcinoma and is associated with poor prognosis. Sci Rep. 2017;7(1):5129. doi:10.1038/s41598-017-05311-2
34. Nakamura T, Furukawa Y, Nakagawa H, et al. Genome-wide cDNA microarray analysis of gene expression profiles in pancreatic cancers using populations of tumor cells and normal ductal epithelial cells selected for purity by laser microdissection. Oncogene. 2004;23(13):2385–2400. doi:10.1038/sj.onc.1207392
35. Shimo A, Nishidate T, Ohta T, Fukuda M, Nakamura Y, Katagiri T. Elevated expression of protein regulator of cytokinesis 1, involved in the growth of breast cancer cells. Cancer Sci. 2007;98(2):174–181. doi:10.1111/j.1349-7006.2006.00381.x
36. Kanehira M, Katagiri T, Shimo A, et al. Oncogenic role of MPHOSPH1, a cancer-testis antigen specific to human bladder cancer. Cancer Res. 2007;67(7):3276–3285. doi:10.1158/0008-5472.CAN-06-3748
37. Chen J, Rajasekaran M, Xia H, et al. The microtubule-associated protein PRC1 promotes early recurrence of hepatocellular carcinoma in association with the Wnt/β-catenin signalling pathway. Gut. 2016;65(9):1522–1534. doi:10.1136/gutjnl-2015-310625
38. Zhao Z, Wang Z, Bao ZS, et al. Mutation and copy number alterations analysis of KIF23 in glioma. Front Genet. 2021;12:646929. doi:10.3389/fgene.2021.646929
39. Liang WT, Liu XF, Huang HB, Gao ZM, Li K. Prognostic significance of KIF23 expression in gastric cancer. World J Gastrointest Oncol. 2020;12(10):1104–1118. doi:10.4251/wjgo.v12.i10.1104
40. Cheng C, Wu X, Shen Y, Li Q. KIF14 and KIF23 promote cell proliferation and chemoresistance in HCC cells, and predict worse prognosis of patients with HCC. Cancer Manag Res. 2020;12:13241–13257. doi:10.2147/CMAR.S285367
41. Bai X, Cao Y, Yan X, et al. Systematic pan-cancer analysis of KIF23 and a prediction model based on KIF23 in Clear Cell Renal Cell Carcinoma (ccRCC). Pharmgenomics Pers Med. 2021;14:1717–1729. doi:10.2147/PGPM.S337695
42. Jain M, Zhang L, He M, Zhang YQ, Shen M, Kebebew E. TOP2A is overexpressed and is a therapeutic target for adrenocortical carcinoma. Endocr Relat Cancer. 2013;20(3):361–370. doi:10.1530/ERC-12-0403
43. Kim EJ, Lee YS, Kim YJ, et al. Clinical implications and prognostic values of topoisomerase-II alpha expression in primary non-muscle-invasive bladder cancer. Urology. 2010;75(6):1516.e1519–1513. doi:10.1016/j.urology.2009.08.055
44. Zeng S, Liu A, Dai L, et al. Prognostic value of TOP2A in bladder urothelial carcinoma and potential molecular mechanisms. BMC Cancer. 2019;19(1):604. doi:10.1186/s12885-019-5814-y
45. Gao Y, Zhao H, Ren M, et al. TOP2A promotes tumorigenesis of high-grade serous ovarian cancer by regulating the TGF-β/Smad pathway. J Cancer. 2020;11(14):4181–4192. doi:10.7150/jca.42736
46. Wang T, Lu J, Wang R, Cao W, Xu J. TOP2A promotes proliferation and metastasis of hepatocellular carcinoma regulated by miR-144-3p. J Cancer. 2022;13(2):589–601. doi:10.7150/jca.64017
47. Massagué J. G1 cell-cycle control and cancer. Nature. 2004;432(7015):298–306. doi:10.1038/nature03094
 © 2022 The Author(s). This work is published and licensed by Dove Medical Press Limited. The
full terms of this license are available at https://www.dovepress.com/terms
and incorporate the Creative Commons Attribution
- Non Commercial (unported, 3.0) License.
By accessing the work you hereby accept the Terms. Non-commercial uses of the work are permitted
without any further permission from Dove Medical Press Limited, provided the work is properly
attributed. For permission for commercial use of this work, please see paragraphs 4.2 and 5 of our Terms.
© 2022 The Author(s). This work is published and licensed by Dove Medical Press Limited. The
full terms of this license are available at https://www.dovepress.com/terms
and incorporate the Creative Commons Attribution
- Non Commercial (unported, 3.0) License.
By accessing the work you hereby accept the Terms. Non-commercial uses of the work are permitted
without any further permission from Dove Medical Press Limited, provided the work is properly
attributed. For permission for commercial use of this work, please see paragraphs 4.2 and 5 of our Terms.
Recommended articles
Decaprenyl Diphosphate Synthase Subunit 1 (PDSS1): A Potential Prognostic Biomarker and Immunotherapy-Target for Hepatocellular Carcinoma
Yang Y, Li J, Tang M, Nie B, Huang W
Cancer Management and Research 2022, 14:1627-1639
Published Date: 3 May 2022
Identification of KRBA1 as a Potential Prognostic Biomarker Associated with Immune Infiltration and m6A Modification in Hepatocellular Carcinoma
Liu Y, Fu B, Yu Z, Song G, Zeng H, Gong Y, Ding Y, Huang D
Journal of Hepatocellular Carcinoma 2022, 9:497-516
Published Date: 31 May 2022
Low MARCO Expression is Associated with Poor Survival in Patients with Hepatocellular Carcinoma Following Liver Transplantation
Zhang Q, Wei Y, Li Y, Jiao X
Cancer Management and Research 2022, 14:1935-1944
Published Date: 11 June 2022
Histological Severity of Cirrhosis Influences Surgical Outcomes of Hepatocellular Carcinoma After Curative Hepatectomy
Liang BY, Gu J, Xiong M, Zhang EL, Zhang ZY, Lau WY, Wang SF, Guan Y, Chen XP, Huang ZY
Journal of Hepatocellular Carcinoma 2022, 9:633-647
Published Date: 23 July 2022
Nomogram for the Preoperative Prediction of the Macrotrabecular-Massive Subtype of Hepatocellular Carcinoma
Shan Y, Yu X, Yang Y, Sun J, Wu S, Mao S, Lu C
Journal of Hepatocellular Carcinoma 2022, 9:717-728
Published Date: 10 August 2022