Back to Journals » Journal of Hepatocellular Carcinoma » Volume 9
Nomogram for the Preoperative Prediction of the Macrotrabecular-Massive Subtype of Hepatocellular Carcinoma
Authors Shan Y, Yu X, Yang Y ![]() , Sun J, Wu S, Mao S
, Sun J, Wu S, Mao S ![]() , Lu C
, Lu C
Received 9 May 2022
Accepted for publication 25 July 2022
Published 10 August 2022 Volume 2022:9 Pages 717—728
DOI https://doi.org/10.2147/JHC.S373960
Checked for plagiarism Yes
Review by Single anonymous peer review
Peer reviewer comments 2
Editor who approved publication: Professor Manal Hassan
Yuying Shan, Xi Yu, Yong Yang, Jiannan Sun, Shengdong Wu, Shuqi Mao, Caide Lu
Department of Hepatopancreatobiliary Surgery, Ningbo Medical Centre Lihuili Hospital, Ningbo University, Ningbo, Zhejiang, 315041, People’s Republic of China
Correspondence: Caide Lu; Shuqi Mao, Department of Hepatopancreatobiliary Surgery, Ningbo Medical Centre Lihuili Hospital, Ningbo University, Ningbo, Zhejiang, 315041, People’s Republic of China, Email [email protected]; [email protected]
Background: The macrotrabecular-massive subtype of hepatocellular carcinoma (MTM-HCC) is an aggressive histological type and results in poor prognosis. We developed a nomogram model based on laboratory results to predict the presence of MTM-HCC.
Methods: A total of 357 HCC patients who underwent radical surgery between January 2015 and December 2020 at Ningbo Medical Center Lihuili Hospital were grouped according to histological type. After propensity score matching (PSM), 267 patients were divided into MTM-HCC (n = 76) and non-MTM-HCC (n = 191) groups. A LASSO regression analysis model was used to select predictive factors. Finally, a nomogram for predicting the presence of MTM-HCC was established. Decision curve analysis (DCA) was conducted to determine the clinical usefulness of the nomogram model by quantifying the net benefits along with the increase in threshold probabilities.
Results: The 1-, 3-, and 5-year disease-free survival (DFS) and overall survival (OS) rates for MTM-HCC were 60.0%, 36.0%, 32.4% and 92.1%, 68.7%, 52.2%, respectively. Survival analysis indicated that the probabilities of achieving DFS and OS were significantly worse in the MTM-HCC group than in the non-MTM-HCC group (P < 0.05). The nomogram model that included AST levels, PT and AFP levels achieved a better C-index of 0.723 (95% CI: 0.659– 0.787). DCA revealed that the nomogram model could lead to net benefits and exhibited a wider range of threshold probabilities in the prediction of MTM-HCC.
Conclusion: The nomogram model included AST, PT and AFP could achieve an optimal performance in the preoperative prediction of MTM-HCC.
Keywords: hepatocellular carcinoma, macrotrabecular-massive subtype, prognosis, nomogram, aggressiveness
Introduction
Primary liver cancer ranks as the sixth most commonly diagnosed cancer and the third leading cause of cancer-related death in the world. Hepatocellular carcinoma (HCC) is the most common type of primary liver tumour.1 The diagnosis and treatment of HCC have greatly improved in recent years due to the advancement of diagnostic technology and therapeutic strategies. At the pathological level, most tumours are characterized by a trabecular pattern of growth with cords of neoplastic cells that mimic normal liver trabeculae.2,3 However, HCC morphology is highly heterogeneous. Some special growth patterns are associated with aggressive features and poor prognosis. The 2019 “Digestive System Tumour Classification (Fifth Edition)” by the World Health Organization (WHO) described a macrotrabecular pattern, which is a histological structure associated with an especially worse prognosis.2 This architecture was first reported by Calderaro, who observed cases with a strikingly predominant (more than 50%) macrotrabecular architecture and designated these tumours “macrotrabecular-massive HCC” (MTM-HCC) in 2017.4 MTM-HCC mainly consists of neoplastic cells arranged in thick trabeculae coated by endothelial cells and surrounded by dilated vascular spaces. Trabeculae observed in cross-sections also appear as endothelium-coated tumour clusters. Calderaro first observed that MTM-HCC was associated with TP53 and ATM mutations as well as FGF19 amplifications and the activation of angiogenesis (upregulation of ANGPT2 expression and an almost significant trend towards VEGFA overexpression).4 According to the aberrant genetic and molecular features of MTM-HCC, Ziol further discovered that MTM-HCC was associated with higher serum α-fetoprotein (AFP) levels, poor tumour differentiation, microvascular invasion and satellite nodules. There was a pivotal discovery that the diagnosis of MTM-HCC independently predicted tumour recurrence and had a poor prognosis.5 Subsequently, several centres conducted clinical analyses of MTM-HCC, and all reported that this subtype exhibited aggressive clinical features and a poor prognosis.6–8
In 2019, Calderaro further discovered that ESM1 was a diagnostic marker for MTM-HCC, with both sensitivity and specificity values of over 90%,9 but this marker could only be assessed after the tissue was surgically removed. Mulé S suggested that preoperative MRI can help identify MTM-HCC.10 Apart from these results, there is no evidence that other methods can help diagnose MTM-HCC, especially preoperatively. Thus, a predictive model that incorporates factors associated with MTM-HCC based on preoperative clinical data is desirable. We identified the clinicopathological characteristics correlated with MTM-HCC and established the first prediction model of MTM-HCC using a nomogram.
Methods
Patients
We included HCC patients who underwent radical hepatic resection between January 2015, and December 2020 at Ningbo Medical Center Lihuili Hospital. The exclusion criteria were as follows: (1) history of preoperative anticancer intervention; (2) extrahepatic metastasis; (3) presence of other malignant tumours; (4) previous history of tumour resection; and (5) incomplete clinical or follow-up data. Propensity score matching (PSM) was performed using nearest-neighbour 1:3 matching based on age, sex and the type of anti-virus therapy. The study complied with the Declaration of Helsinki and was approved by the ethics committee of Ningbo Medical Center Lihuili Hospital (Approval number: KY2020PJ156). All methods were performed following the relevant guidelines and regulations. All HCC patients provided informed consent for their data to be used for this research.
Pathological Analysis
All histological slides were reviewed independently by two experienced pathologists (C.W. and H.F.) from the Ningbo Clinical and Pathological Diagnosis Center. All disagreements were discussed until a consensus was reached. Tumours with a predominant (>50%) macrotrabecular architectural pattern (more than six cells thick) covered by vascular endothelial cells and surrounded by dilated vessels were classified as the MTM subtype according to the standards reported by Calderaro.4 Moreover, the Edmonson-Steiner grade and presence of satellite nodules and tumour capsules were also assessed and reported.
Preoperative Examination and Follow-Up
Preoperative laboratory examinations included routine blood examinations, coagulative function tests, liver and renal function tests, immunological tests for hepatitis B and C, and measurements of serum AFP levels. The cut-off value of the biochemical factors was set according to the Health Industry Standard of the People’s Republic of China published by the National Health Commission of the People’s Republic of China. The cut-offs established for AFP levels were 20 and 400 ng/mL. The cut-off of 20 mg/mL was set according to the diagnostic standard, and 400 ng/mL was set according to previous studies and our previous work.11–14 The NLR cut-off was 1.9 according to a previous study.15 Abdominal ultrasonography (US) and contrast-enhanced CT/MRI were used to evaluate cirrhosis, tumour diameter, number of tumours and presence of portal vein (PV) invasion. All patients were followed up by abdominal examination (US/CT/MRI) and assessments of AFP levels after the operation at intervals of 3–6 months. Overall survival (OS) and disease-free survival (DFS) were calculated from the date of resection to the date of patient mortality, recurrence or the last follow-up (November 1, 2021).
Statistical Analysis
Pearson’s chi-square test or Fisher’s exact test was used to compare the frequencies of categorical variables between MTM-HCC and non–MTM-HCC patients. Independent t-tests were used to compare continuous variables. PSM was used to reduce bias in baseline characteristics. A multivariable L1 least absolute shrinkage and selection operator (LASSO)–penalized logistic regression model was used to select predictive factors. Multivariable logistic regression analysis was performed to identify independent predictors of MTM-HCC. Subsequently, a nomogram was formulated to predict MTM-HCC diagnosis based on the results of LASSO regression and multivariate logistic regression analysis. Associated odds ratios (ORs) and 95% confidence intervals (CIs) were estimated. Survival curves were evaluated using the Kaplan–Meier method and compared by the Log rank test. P<0.05 was considered to indicate a statistically significant difference. All statistical analyses were performed with SPSS 25.0 (IBM Corporation, 2020, USA) and R software, version 3.6.2 (R Foundation for Statistical Computing, Vienna, Austria, 2019).
Results
Patients
357 patients were screened in this study. A total of 80 cases of MTM-HCC were identified, representing 22.4% of the whole cohort of 357 patients. Then, the MTM-HCC and non-MTM-HCC groups were subjected to PSM, after which 267 patients (MTM-HCC, n=76; non-MTM-HCC, n=191) were enrolled in our study. The histological patterns of non-MTM-HCC and MTM-HCC tumours are shown in Figure 1. The baseline characteristics are shown in Table 1.
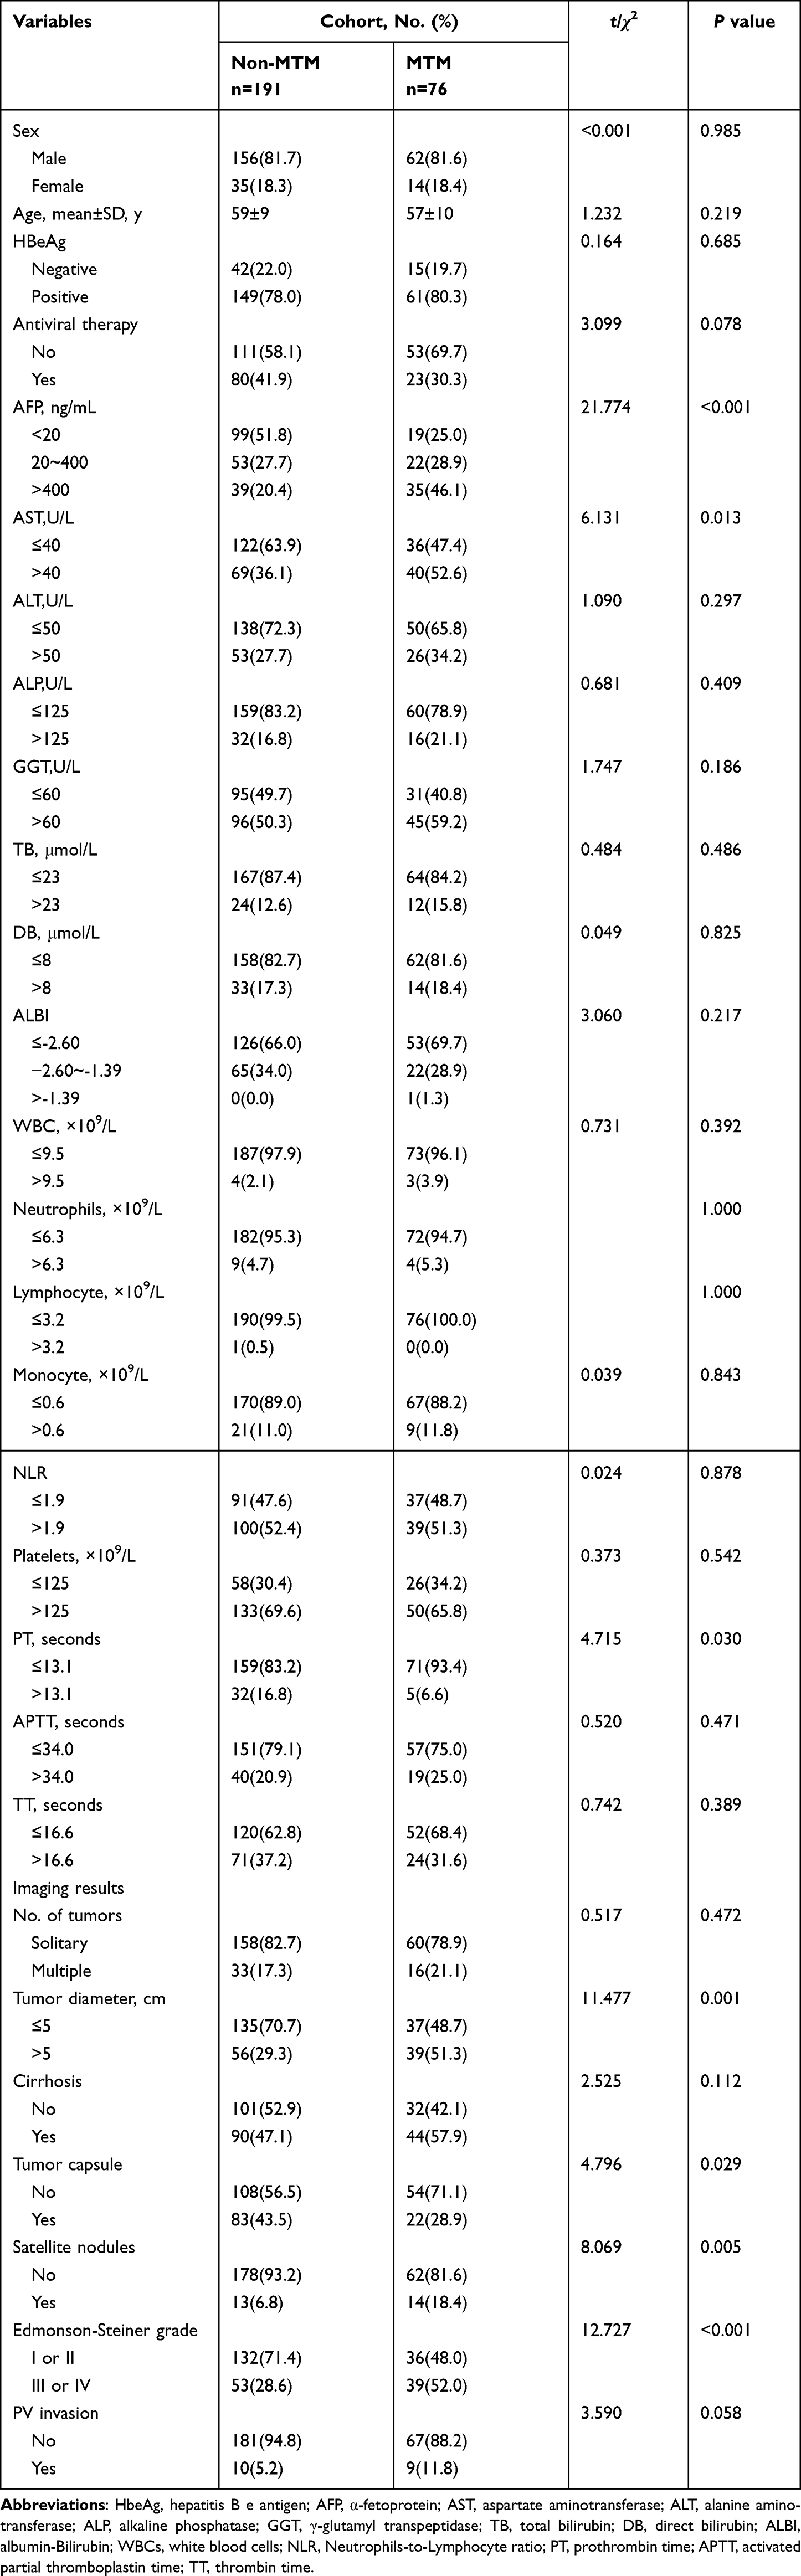 |
Table 1 Clinical and Demographic Participant Characteristics According to MTM-HCC Subtype |
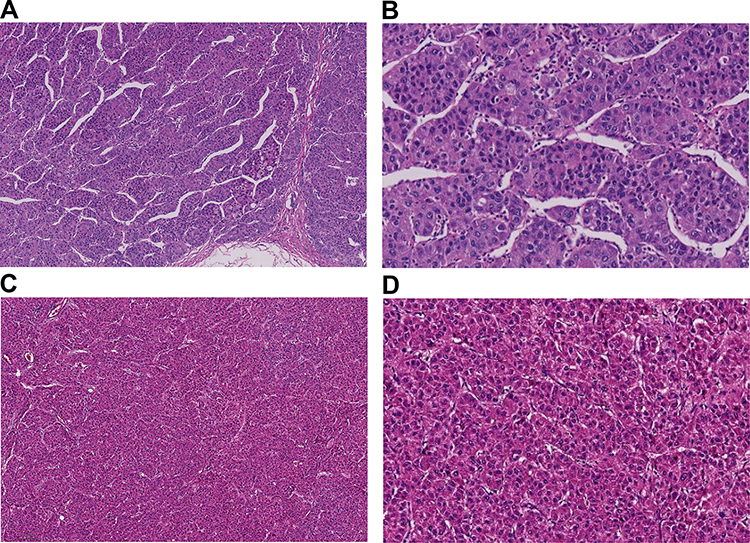 |
Figure 1 (A and B) MTM-HCC tumours exhibit a macrotrabecular pattern across over 50% of the area that is more than six cells thick and surrounded by vascular spaces. ((A), HE×20; (B), HE×400). (C and D) Architectural patterns of non-MTM-HCC tumour cells arranged tightly. ((C), HE×20; (D), HE×400). |
The study was censored on November 1, 2021. In total, 34.0% (n=65) of recurrences were observed in the non-MTM-HCC group, while 60.5% (n=46) were observed in the MTM-HCC group. The cumulative incidences of tumour-related mortality were 17.3% (n=33) and 34.2% (n=26) in the non-MTM-HCC and MTM-HCC groups, respectively. The 1-, 3-, and 5-year DFS rates for the non-MTM-HCC and MTM-HCC groups were 84.7%, 66.0%, 55.2% and 60.0%, 36.0%, 32.4%, respectively. The corresponding 1-year, 3-year and 5-year OS rates were 95.8%, 81.7%, 73.8% and 92.1%, 68.7%, 52.2%, respectively. The presence of MTM-HCC was associated with both worse DFS (P<0.001) and OS (P=0.019) than non-MTM-HCC in the Kaplan–Meier survival analysis (Figure 2A and B).
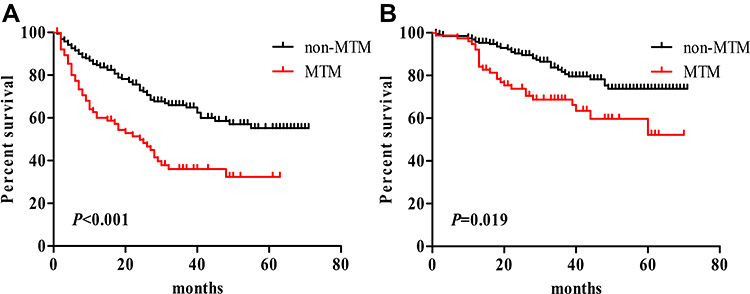 |
Figure 2 Kaplan–Meier survival curves of MTM-HCC and non-MTM-HCC patients. (A) Overall survival analysis. (B) Disease-free survival analysis. |
Clinicopathologic Characteristics
Regarding preoperative clinical and imaging features, the MTM subtype was associated with elevated AFP levels (cut-offs at 20 and 400 ng/mL, P<0.001), higher aspartate aminotransferase (AST) levels (>40 U/L, P=0.013), a shorter prothrombin time (PT) (≤13.1 s, P=0.030), larger tumour diameter (>5 cm, P=0.001), lack of tumour capsule (P=0.029), satellite nodules (P=0.005) and Edmonson-Steiner grade III–IV (P<0.001). Inflammatory factors, including white blood cell (WBC) count, neutrophils, lymphocytes, monocytes, neutrophil-to-lymphocyte ratio (NLR) and albumin-bilirubin (ALBI), showed no differences between the two groups. Logistic regression analysis of MTM-HCC was shown in Table2.
 |
Table 2 Logistic Regression Analysis of MTM Presence Based on Preoperative Data in HCC Patients |
Establishment of the Nomogram for Predicting MTM
LASSO logistic regression analysis was performed to further identify prognostic factors. Age, AST levels, NLR, PT, AFP levels, antiviral therapy, tumour capsule, cirrhosis and tumour diameter were selected as factors, and their performances are plotted in Figure 3A and B.
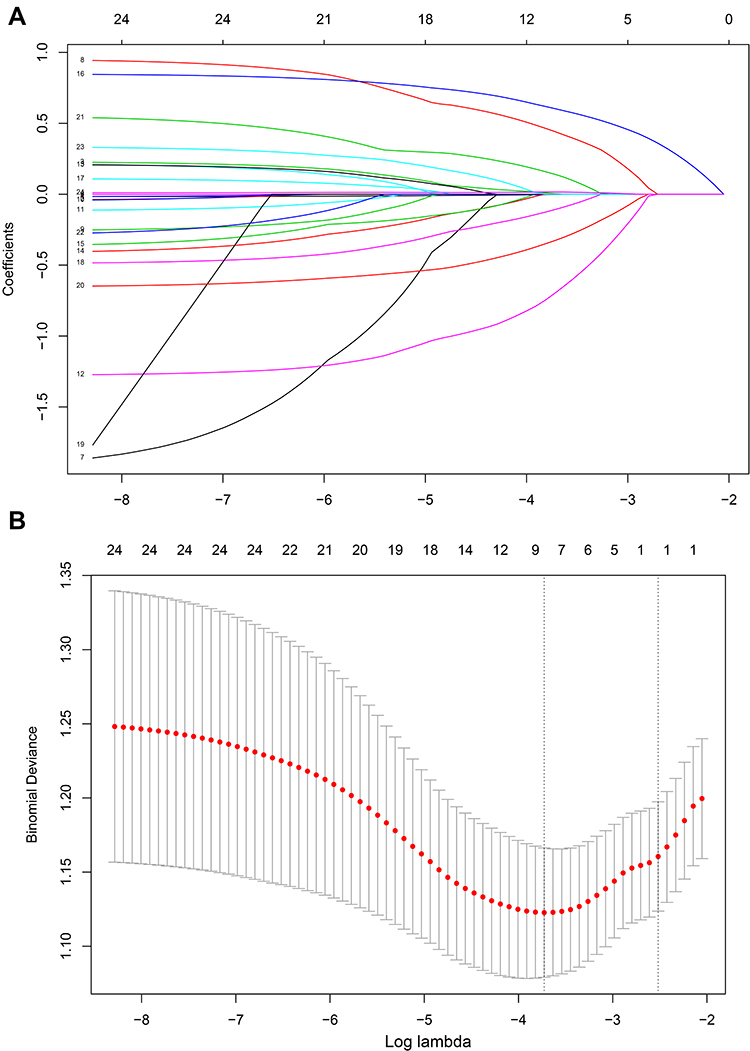 |
Figure 3 Nomogram model element selection using the LASSO binary logistic regression model. (A) The LASSO coefficient profiles of the 9 features. AST levels, AFP levels, PT and other features were selected using LASSO binary logistic regression analysis. The LASSO coefficient profiles of the features were plotted. (B) The optimum parameter (lambda) selection in the LASSO model performed tenfold cross-validation through minimum criteria. The partial likelihood deviance (binomial deviance) curve is presented versus its log value (lambda). Dotted vertical lines were shown at the optimum values by performing the lambda.min and the lambda.1 se. |
Univariate logistic analysis showed that the preoperative factors associated with MTM-HCC were a high AFP level (for 20–400 vs ≤20 ng/mL, OR=2.163, 95% CI: 1.076–4.349, P=0.030; for ≥400 vs ≤20 ng/mL, OR=4.676, 95% CI: 2.392–9.141, P<0.001), AST levels of >40 U/L (OR=1.965, 95% CI: 1.147–3.366, P=0.014), tumour diameters of >5 cm (OR=2.541, 95% CI: 1.470–4.392, P=0.001) and lack of tumour capsule (OR=1.886, 95% CI: 1.470–4.392, P=0.001). Moreover, a PT of >13.1 s was a protective factor (OR=0.350, 95% CI: 0.131–0.935, P=0.036). Multivariate analysis indicated that higher AFP levels (for 20–400 vs ≤20 ng/mL, OR=2.352, 95% CI: 1.145–4.833, P=0.020; for ≥400 vs ≤20 ng/mL, OR=5.019, 95% CI: 2.501–10.070, P<0.001), AST >40 U/L (OR=2.450, 95% CI: 1.355–4.429, P=0.003), and PT >13.1 s (OR=0.224, 95% CI: 0.078–0.643, P=0.005) were optimal predictive factors for MTM-HCC diagnosis (Table 2).
The MTM-HCC prediction model incorporated AST levels, PT and AFP levels. In the nomogram, the total factor score ranged from 0 to 280, with the corresponding risk probabilities ranging from 0.05 to 0.70 (Figure 4A). The nomogram achieved a high C-index of 0.723 (95% CI: 0.659–0.787) with 1000 bootstrap samples (Figure 4B).
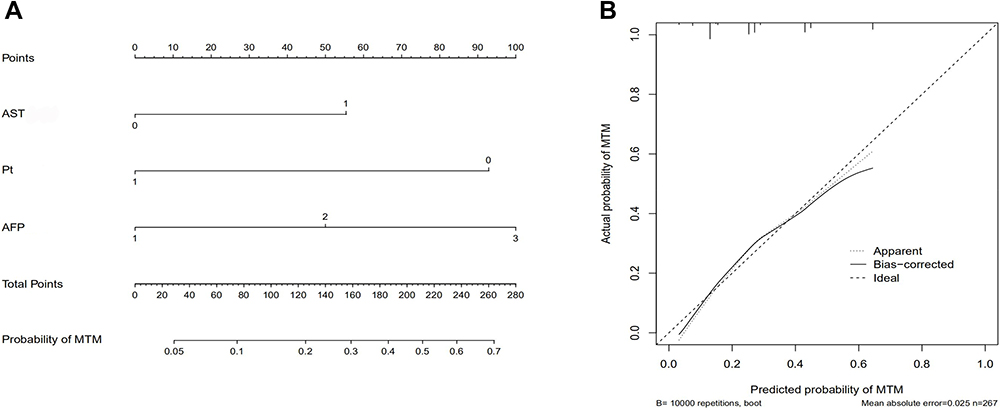 |
Figure 4 Nomogram for predicting MTM-HCC diagnosis. (A) A vertical line was drawn upwards, and lines to the points axis were drawn downwards. The points of each variable were added and total points were calculated at the lower line to evaluate the probability of MTM-HCC diagnosis. (B) The calibration curves of the nomogram model prediction in HCC patients. The X-axis and Y-axis show the predicted survival and the actual survival, respectively. The solid line indicates the performance of the developed nomogram model. |
Decision curve analysis (DCA) is a novel method for evaluating alternative prognostic strategies.16,17 DCA showed that the nomogram model could lead to net benefits and exhibited a wider range of threshold probabilities in the prediction of MTM-HCC diagnosis (Figure 5A). A receiver operating characteristic (ROC) curve was used to validate the performance of the nomogram model (Figure 5B). The area under the ROC curve (AUC) was 0.723 (95% CI: 0.659–0.787), which was consistent with the C-index. The sensitivity and specificity were 71.1% and 60.7%, respectively.
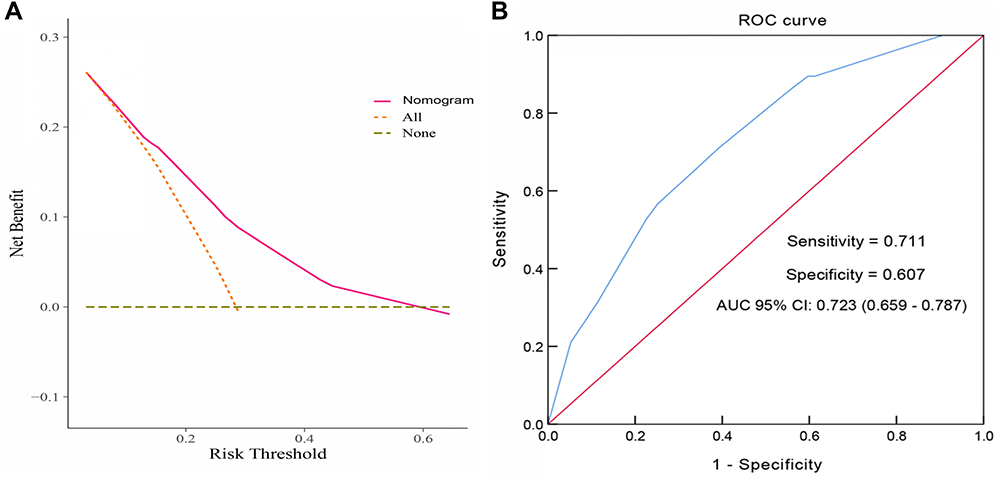 |
Figure 5 Evaluation of the discriminative ability of the nomogram. (A) Decision curve analysis for the developed nomogram model. The results show that using the nomogram for MTM-HCC prediction has more benefit than the two extreme conditions. The area under the decision curve suggested that the nomogram (purple line) received a higher net benefit. (B) The ROC curve and AUC value of the nomogram. The AUC was 0.723 (95% CI: 0.659–0.787), and the sensitivity and specificity were 71.1% and 60.7%, respectively. |
Discussion
In this study, 80 cases of MTM-HCC were identified among 357 patients, representing 22.4% of the whole series. This incidence rate was slightly higher than the 11.9% (62/521), 16.0% (53/331) and 17.1% (26/152) reported in previous studies.5,9,10
Although no large-scale studies have concentrated on MTM-HCC and MTM does not account for a significantly high proportion of HCC cases, our paper and all reported articles have suggested that MTM-HCC was associated with aggressive clinical features and had a poor prognosis. In our research, the 1-, 3-, and 5-year DFS and OS rates of MTM-HCC patients were 60.0%, 36.0%, 32.4% and 92.1%, 68.7%, 52.2%, respectively. Both the DFS and OS rates were much lower in MTM-HCC patients than in non-MTM-HCC patients, and the recurrence and death rates were significantly elevated in MTM-HCC patients. These results verified the poor prognosis of MTM-HCC. We discovered that elevated AFP levels, larger tumour diameter, lack of tumour capsule, satellite nodules, and poor differentiation were associated with MTM-HCC, which was inconsistent with the results of a study by Ziol et al.5 These results indicate that MTM-HCC correlates directly with aggressive clinical characteristics and results in earlier recurrence and more death. The best clinical diagnosis and treatment plan can be provided if MTM-HCC is diagnosed accurately before surgery,18 since liver transplantation19,20 or RFA (radiofrequency ablation)21 is not recommended for these patients. Liu et al showed that tumoral PD-L1 expression and inflammatory cell density were higher in the MTM-HCC than in the non-MTM-HCC.8 Lately, VETC/MTM pattern was reported to play the prometastatic role, resist tumor immunity and direct cytotoxic effects against tumor cells, suppressing VETC/MTM pattern formation could inhibit metastasis and recurrence after surgical resection.22 The reciprocal relationship between the antitumor immune microenvironment and the angiogenic microenvironment may also provide mechanistic insights to the therapeutic effects of combined immunotherapy (eg, ICI + bevacizumab or TKI).23,24 In particular, the high expression of FGF2 in addition to VEGFA and ANGPT2 observed in VETC/MTM-positive HCC indicated that lenvatinib, which inhibits FGFR1/2/3/4 and VEGFR1/2,25 may be a rational therapeutic strategy for these patients. So, the therapies for MTM-HCC should differ from other common types, and individualized treatment should be provided for patients with MTM-HCC. So the prediction for MTM-HCC could not only predict prognosis but also guide therapy. Thus, MTM-HCC deserves more attention.
Therefore, we attempted to establish a prediction model for MTM-HCC based on easily evaluable clinical factors. Based on LASSO and multivariate logistic regression analysis, AFP levels, AST levels and PT were included in the established nomogram prediction model. Individuals with higher total points had a greater probability of having MTM-HCC.
AFP is a readily accessible biomarker for HCC that is routinely monitored in patients under surveillance for HCC. Elevated AFP concentration has also been reported as a risk factor for recurrence after tumour resection and transplantation.26–28 High serum levels of AFP usually indicate a poor prognosis.29,30 Tyson et al stratified AFP levels using thresholds of 10, 100 and 1000 ng/mL and reported that the median survival times were significantly lower among patients with higher levels of AFP. Increased levels of AFP have been significantly associated with increased mortality.31 As we proved in this paper, MTM was closely associated with elevated AFP levels, and the nomogram showed the significant value of both mildly and highly elevated AFP levels in predicting MTM-HCC. Moreover, the higher the AFP level, the stronger the predicted probability of MTM-HCC diagnosis.
The AST level is one of the independent factors associated with poor survival.32,33 It has been reported that AST levels ≥118.5 U/L are significantly associated with distant metastasis of primary HCC with portal vein tumour thrombus (PVTT).34 An AST level of ≥2× the upper limit of normal (ULN) is an independent indicator for poor prognosis.35 These studies demonstrated that elevated AST levels are closely related to the prognosis of HCC and are an independent risk factor for poor prognosis. However, the relationship between AST levels and MTM-HCC was not discussed previously, so we attempted to explain this consequence. Mulé S reported that substantial necrosis was correlated with MTM-HCC and could be used to help identify MTM-HCC diagnosis with a sensitivity of 65% and a specificity of 93%.10 Cannella et al confirmed that MTM-HCC was associated with necrosis utilizing an imaging system (LI-RADS). Moreover, they found that the levels of AST, ALT and ALB were correlated with MTM-HCC.36 The correlation between MTM-HCC and AST levels may be due to substantial hepatocyte necrosis occurring inside the tumour, which releases AST into the serum. Therefore, MTM-HCC patients usually exhibit increased AST levels.
Usually, patients with liver cirrhosis demonstrate a prolonged PT due to insufficient synthesis of coagulation factors from liver damage. However, we noticed that most MTM-HCC patients had shorter PT values than non-MTM patients. Yugawa K also reported that a shorter PT was related to a lower lymphocyte-to-C-reactive protein (CRP) ratio, which predicted worse outcomes in patients with HCC.37 Conversely, another study indicated that a prolonged PT was an independent predictor of survival.38 It is well known that a prolonged PT can reflect cirrhosis development, although the relationship between PT and HCC has not been confirmed and deserves further exploration. Interestingly, we discovered that tumour diameter and the presence of tumour capsule and satellite nodules were correlated with MTM-HCC, which was consistent with previous studies;5,6 however, these indicators did not show significance in multivariable analysis and were not included in the nomogram model. We considered whether these indicators were applicable for predicting MTM-HCC diagnosis was still unclear.
Papers have indicated that inflammation, especially local inflammation in the tumour microenvironment, plays a role in carcinogenesis and tumour progression. It has been suggested that the ability of NLR to predict tumour recurrence is probably due to the inflammatory tumour microenvironment.39 In addition, lymphocytes are important components of the adaptive immune system that provide a cellular basis for cancer immunosurveillance and immunoediting.40 To define whether MTM-HCC correlated with inflammation, WBC and assessments of neutrophils, lymphocytes, monocytes and NLR were included in our analysis. However, in this study, none of these factors showed a relationship with MTM-HCC, indicating that MTM-HCC is not directly related to inflammation or, in other words, does not show deviance in clinical inflammatory factors. However, Calderaro declared that VEGFA and ANGPT2, which are known to promote neoangiogenesis and endothelial sprouting, accumulated in MTM-HCC. These results indicate that the poor outcome of MTM-HCC is presumably due to structural features and angiogenesis rather than inflammation.
To the best of our knowledge, this is the first nomogram established for predicting MTM-HCC diagnosis in patients before surgery. Our nomogram only contained three variables, since the three indicators of AFP levels, AST levels and PT are routine examination items for HCC patients that are easy to obtain and are widely used in medical centres; thus, this model can be widely promoted and applied. This scoring model can be used easily and quickly to predict the special histological type of MTM-HCC. Before considering treatment options, this nomogram can be used to evaluate the severity of HCC and select an appropriate treatment strategy.
There are some limitations in our study that should be noted. First, this was a single-centre retrospective study, and our results need external validation. Second, a further prospective study is required to confirm the reliability and power of the nomogram.
Conclusion
In conclusion, MTM-HCC is associated with early recurrence and poor prognosis. We are the first to establish a simple nomogram for predicting the probability of the MTM subtype of HCC. This model containing AFP levels, AST levels and PT has good clinical utility and can be a useful tool for preoperative evaluations and therapy selection.
Data Sharing Statement
All relevant data are within the paper.
Ethics Approval
This study was approved by the ethics committee of Ningbo Medical Center Lihuili Hospital (approval no: KY2020PJ156).
Acknowledgments
Our research was supported by grants from Ningbo Medical and Health Brand Discipline (PPXK2018-03) and the Science and Technology Program of Zhejiang Health (2021KY1035 to X.Y., 2019ZD047 to S.W.).
Author Contributions
All authors made a significant contribution to the work reported, whether in the conception, study design, execution, acquisition of data, analysis and interpretation, or in all these areas; took part in drafting, revising or critically reviewing the article; gave final approval of the version to be published; have agreed on the journal to which the article has been submitted; and agree to be accountable for all aspects of the work.
Disclosure
The authors declare no conflicts of interest.
References
1. Sung H, Ferlay J, Siegel RL, et al. Global Cancer Statistics 2020: GLOBOCAN estimates of incidence and mortality worldwide for 36 cancers in 185 countries. CA Cancer J Clin. 2021;71(3):209–249. doi:10.3322/caac.21660
2. Torbenson MS, Ng IOL, Park YN, Roncalli M, Sakamato M. WHO Classification of Digestive System Tumor.
3. MacSween RNM, Burt AD, Portmann B, Ferrell LD. MacSween’s Pathology of the Liver.
4. Calderaro J, Couchy G, Imbeaud S, et al. Histological subtypes of hepatocellular carcinoma are related to gene mutations and molecular tumour classification. J Hepatol. 2017;67(4):727–738. PMID: 28532995. doi:10.1016/j.jhep.2017.05.014
5. Ziol M, Pote N, Amaddeo G, et al. Macrotrabecular- massive hepatocellular carcinoma: a distinctive histological subtype with clinical relevance. Hepatology. 2018;68(1):103–112. PMID: 29281854. doi:10.1002/hep.29762
6. Jeon Y, Benedict M, Taddei T, Jain D, Zhang X. Macrotrabecular hepatocellular carcinoma: an aggressive subtype of hepatocellular carcinoma. Am J Surg Pathol. 2019;43(7):943–948. PMID: 31135484. doi:10.1097/PAS.0000000000001289
7. Renne SL, Woo HY, Allegra S, et al. Vessels encapsulating tumor clusters (VETC) is a powerful predictor of aggressive hepatocellular carcinoma. Hepatology. 2020;71(1):183–195. PMID: 31206715. doi:10.1002/hep.30814
8. Liu LL, Zhang SW, Chao X, et al. Coexpression of CMTM6 and PD-L1 as a predictor of poor prognosis in macrotrabecular-massive hepatocellular carcinoma. Cancer Immunol Immunother. 2020;70:417–429. PMID: 32770259. doi:10.1007/s00262-020-02691-9
9. Calderaro J, Meunier L, Nguyen CT, et al. ESM1 as a marker of macrotrabecular-massive hepatocellular carcinoma. Clin Cancer Res. 2019;25(19):5859–5865. doi:10.1158/1078-0432.CCR-19-0859
10. Mulé S, GallettoPregliasco A, Tenenhaus A, et al. Multiphase liver MRI for identifying the macrotrabecular-massive subtype of hepatocellular carcinoma. Radiology. 2020;295(3):562–571. PMID: 32228294. doi:10.1148/radiol.2020192230
11. Yang SL, Liu LP, Yang S, et al. Preoperative serum α-fetoprotein and prognosis after hepatectomy for hepatocellular carcinoma. Br J Surg. 2016;103(6):716–724. PMID: 26996727. doi:10.1002/bjs.10093
12. Gurakar A, Ma M, Garonzik-Wang J, et al. Clinicopathological distinction of low-AFP-secreting vs. high-AFP-secreting hepatocellular carcinomas. Ann Hepatol. 2018;17(6):1052–1066. doi:10.5604/01.3001.0012.7206
13. Mao S, Yu X, Shan Y, et al. Albumin-Bilirubin (ALBI) and Monocyte to Lymphocyte Ratio (MLR)-based nomogram model to predict tumor recurrence of AFP-negative hepatocellular carcinoma. J Hepatocell Carcinoma. 2021;8:1355–1365. doi:10.2147/JHC.S339707
14. Mao S, Yu X, Yang Y, et al. Preoperative nomogram for microvascular invasion prediction based on clinical database in hepatocellular carcinoma. Sci Rep. 2021 Jul 7;11(1):13999. doi:10.1038/s41598-021-93528-7
15. Hsiang CW, Huang WY, Yang JF, et al. Dynamic changes in neutrophil-to-lymphocyte ratio are associated with survival and liver toxicity following stereotactic body radiotherapy for hepatocellular carcinoma. J Hepatocell Carcinoma. 2021;8:1299–1309. doi:10.2147/JHC.S334933
16. Vickers AJ, Elkin EB. Decision curve analysis: a novel method for evaluating prediction models. Med Decis Making. 2006;26:565–574. doi:10.1177/0272989X0629536120
17. Fitzgerald M, Saville BR, Lewis RJ. Decision curve analysis. JAMA. 2015;313:409–410. doi:10.1001/jama.2015.37
18. Calderaro J, Ziol M, Paradis V, et al. Molecular and histological correlations in liver cancer. J Hepatol. 2019;71(3):616–630. doi:10.1016/j.jhep.2019.06.001
19. Wei J, Jiang H, Zeng M, et al. Prediction of microvascular invasion in hepatocellular carcinoma via deep learning: a multi-center and prospective validation study. Cancers. 2021;13(10):2368. doi:10.3390/cancers13102368
20. Aggarwal A, Te HS, Verna EC, et al. A national survey of hepatocellular carcinoma surveillance practices following liver transplantation. Transplant Direct. 2021;7(1):e638. doi:10.1097/TXD.0000000000001086
21. Lee S, Kang TW, Song KD, et al. Effect of microvascular invasion risk on early recurrence of hepatocellular carcinoma after surgery and radiofrequency ablation. Ann Surg. 2021;273(3):564–571. doi:10.1097/SLA.0000000000003268
22. Urebayashi Y, Matsuda K, Ueno A, et al. Immunovascular classification of HCC reflects reciprocal interaction between immune and angiogenic tumor microenvironments. Hepatology. 2022;75(5):1139–1153. doi:10.1002/hep.32201
23. Finn RS, Qin S, Ikeda M, et al. Atezolizumab plus bevacizumab in unresectable hepatocellular carcinoma. N Engl J Med. 2020;382(20):1894–1905. doi:10.1056/NEJMoa1915745
24. Finn RS, Ikeda M, Zhu AX, et al. Phase Ib study of lenvatinib plus pembrolizumab in patients with unresectable hepatocellular carcinoma. J Clin Oncol. 2020;38(26):2960–2970. doi:10.1200/JCO.20.00808
25. Morse MA, Sun W, Kim R, et al. The role of angiogenesis in hepatocellular carcinoma. Clin Cancer Res. 2019;25(3):912–920. doi:10.1158/1078-0432.CCR-18-1254
26. Imamura H, Matsuyama Y, Tanaka E, et al. Risk factors contributing to early and late phase intrahepatic recurrence of hepatocellular carcinoma after hepatectomy. J Hepatol. 2003;38:200–207. doi:10.1016/S0168-8278(02)00360-4
27. Duvoux C, Roudot-Thoraval F, Decaens T, et al. Liver transplantation for hepatocellular carcinoma: a model including alpha-fetoprotein improves the performance of Milan criteria. Gastroenterology. 2012;143:
28. Toso C, Asthana S, Bigam DL, et al. Reassessing selection criteria prior to liver transplantation for hepatocellular carcinoma utilizing the scientific registry of transplant recipients database. Hepatology. 2009;49:832–838. doi:10.1002/hep.22693
29. Bai DS, Zhang C, Chen P, Jin SJ, Jiang GQ. The prognostic correlation of AFP level at diagnosis with pathological grade, progression, and survival of patients with hepatocellular carcinoma. Sci Rep. 2017;7:12870. doi:10.1038/s41598-017-12834-1
30. Ma WJ, Wang HY, Teng LS. Correlation analysis of preoperative serum alpha-fetoprotein (AFP) level and prognosis of hepatocellular carcinoma (HCC) after hepatectomy. World J Surg Oncol. 2013;11:212. PMID: 23981851; PMCID: PMC3844510. doi:10.1186/1477-7819-11-212
31. Tyson GL, Duan Z, Kramer JR, et al. Level of α-fetoprotein predicts mortality among patients with hepatitis C-related hepatocellular carcinoma. Clin Gastroenterol Hepatol. 2011;9(11):989–994. PMID: 21820396; PMCID: PMC3200479. doi:10.1016/j.cgh.2011.07.026
32. Witjes CD, IJzermans JN, van der Eijk AA, et al. Quantitative HBV DNA and AST are strong predictors for survival after HCC detection in chronic HBV patients. Neth J Med. 2011;69(11):508–513. PMID: 22279629.
33. Zhou L, Wang SB, Chen SG, et al. Prognostic value of ALT, AST, and AAR in hepatocellular carcinoma with B-type hepatitis-associated cirrhosis after radical hepatectomy. Clin Lab. 2018;64(10):1739–1747. PMID: 30336532. doi:10.7754/Clin.Lab.2018.180532
34. Li M, Zhao Y, Liu X, et al. Early risk warning system for distant metastasis of hepatitis B virus-associated hepatocellular carcinoma with portal vein tumor thrombus. Oncol Lett. 2020;19(4):3249–3257. PMID: 32256820; PMCID: PMC7074481. doi:10.3892/ol.2020.11423
35. Sun S, Wang X, Chen J. Using pre-treatment neutrophil-to-lymphocyte ratio to predict the prognosis of young patients with hepatocellular carcinoma implemented minimally invasive treatment. J Adolesc Young Adult Oncol. 2020; (1):85–89. PMID: 31621472. doi:10.1089/jayao.2019.0046
36. Cannella R, Dioguardi Burgio M, Beaufrère A, et al. Imaging features of histological subtypes of hepatocellular carcinoma: implication for LI-RADS. JHEP Rep. 2021;3(6):100380. PMID: 34825155; PMCID: PMC8603197. doi:10.1016/j.jhepr.2021.100380
37. Yugawa K, Maeda T, Kinjo N, et al. Prognostic impact of lymphocyte-C-reactive protein ratio in patients who underwent surgical resection for hepatocellular carcinoma. J Gastrointest Surg. 2021;26:104–112. PMID: 34258673. doi:10.1007/s11605-021-05085-z
38. Schöniger-Hekele M, Müller C, Kutilek M, et al. Hepatocellular carcinoma in Central Europe: prognostic features and survival. Gut. 2001;48(1):103–109. PMID: 11115830; PMCID: PMC1728163. doi:10.1136/gut.48.1.103
39. Motomura T, Shirabe K, Mano Y, et al. Neutrophil-lymphocyte ratio reflects hepatocellular carcinoma recurrence after liver transplantation via inflammatory microenvironment. J Hepatol. 2013;58:58–64. doi:10.1016/j.jhep.2012.08.017
40. Hoffmann TK, Dworacki G, Tsukihiro T, et al. Spontaneous apoptosis of circulating T lymphocytes in patients with head and neck cancer and its clinical importance. Clin Cancer Res. 2002;8:2553–2562.
 © 2022 The Author(s). This work is published and licensed by Dove Medical Press Limited. The
full terms of this license are available at https://www.dovepress.com/terms
and incorporate the Creative Commons Attribution
- Non Commercial (unported, 3.0) License.
By accessing the work you hereby accept the Terms. Non-commercial uses of the work are permitted
without any further permission from Dove Medical Press Limited, provided the work is properly
attributed. For permission for commercial use of this work, please see paragraphs 4.2 and 5 of our Terms.
© 2022 The Author(s). This work is published and licensed by Dove Medical Press Limited. The
full terms of this license are available at https://www.dovepress.com/terms
and incorporate the Creative Commons Attribution
- Non Commercial (unported, 3.0) License.
By accessing the work you hereby accept the Terms. Non-commercial uses of the work are permitted
without any further permission from Dove Medical Press Limited, provided the work is properly
attributed. For permission for commercial use of this work, please see paragraphs 4.2 and 5 of our Terms.
Recommended articles
Identification of KRBA1 as a Potential Prognostic Biomarker Associated with Immune Infiltration and m6A Modification in Hepatocellular Carcinoma
Liu Y, Fu B, Yu Z, Song G, Zeng H, Gong Y, Ding Y, Huang D
Journal of Hepatocellular Carcinoma 2022, 9:497-516
Published Date: 31 May 2022
Histological Severity of Cirrhosis Influences Surgical Outcomes of Hepatocellular Carcinoma After Curative Hepatectomy
Liang BY, Gu J, Xiong M, Zhang EL, Zhang ZY, Lau WY, Wang SF, Guan Y, Chen XP, Huang ZY
Journal of Hepatocellular Carcinoma 2022, 9:633-647
Published Date: 23 July 2022
Beta2-Microglobulin as Predictive Biomarkers in the Prognosis of Hepatocellular Carcinoma and Development of a New Nomogram
Lin Q, Jiang Z, Mo D, Liu F, Qin Y, Liang Y, Cheng Y, Huang H, Fang M
Journal of Hepatocellular Carcinoma 2023, 10:1813-1825
Published Date: 11 October 2023
Development and Validation of a Novel Nomogram Integrated with Hypoxic and Lactate Metabolic Characteristics for Prognosis Prediction in Hepatocellular Carcinoma
Qiu X, Dong L, Wang K, Zhong X, Xu H, Xu S, Guo H, Wei X, Chen W, Xu X
Journal of Hepatocellular Carcinoma 2024, 11:241-255
Published Date: 2 February 2024
Development and Validation of a Prognostic Nomogram for Patients with AFP and DCP Double-Negative Hepatocellular Carcinoma After Local Ablation
Qiao W, Li J, Wang Q, Jin R, Zhang H
Journal of Hepatocellular Carcinoma 2024, 11:271-284
Published Date: 3 February 2024