
Back to Journals » International Journal of Nanomedicine » Volume 21
Differential Proteomic Landscape of Plasma Neuron-Derived Extracellular Vesicles in Parkinson’s Disease with and without RBD: A Pilot Investigation
Authors Zhou Y, Zhang W, Lu Y, Zhou Y, Xu X, Chen Z, Li H, Jiang C, Zhao Z
Received 10 April 2026
Accepted for publication 1 July 2026
Published 14 July 2026 Volume 2026:21 616053
DOI https://doi.org/10.2147/IJN.S616053
Checked for plagiarism Yes
Review by Single anonymous peer review
Peer reviewer comments 2
Editor who approved publication: Professor Eng San Thian
Yuhang Zhou,1,2,* Wenjing Zhang,1,2,* Yongfeng Lu,1,2,* Yi Zhou,1 Xiaotong Xu,1 Zhiting Chen,3 Hao Li,2 Cheng Jiang,2,4 Zhenhua Zhao1
1Department of Neurology, Shengli Clinical Medical College of Fujian Medical University, Fujian Provincial Hospital, Fuzhou University Affiliated Provincial Hospital, Fuzhou, People’s Republic of China; 2School of Medicine, The Chinese University of Hong Kong, Shenzhen, People’s Republic of China; 3Department of Cerebrovascular Disease, Fujian Medical University Union Hospital, Fuzhou, People’s Republic of China; 4Guangdong Basic Research Center of Excellence for Aggregate Science, School of Science and Engineering, The Chinese University of Hong Kong, Shenzhen, Guangdong, People’s Republic of China
*These authors contributed equally to this work
Correspondence: Zhenhua Zhao; Cheng Jiang, Email [email protected]; [email protected]
Background: Parkinson’s disease (PD) is clinically heterogeneous, and the presence of rapid eye movement sleep behavior disorder (RBD) defines a distinct and aggressive subtype. There is an urgent need for molecular biomarkers to understand and identify these subtypes. Neuron-derived extracellular vesicles (nEVs) provide a window into brain pathology.
Methods: In this pilot study, we isolated plasma nEVs via L1CAM immunocapture from 28 subjects (PD-RBD, PD-noRBD, and controls). Proteomic analysis was performed using data-independent acquisition mass spectrometry (DIA-MS).
Results: We quantified 1354 proteins. Comparative analysis revealed 239 differentially expressed proteins (DEPs) between PD-RBD and PD-noRBD. PD-RBD patients exhibited significantly higher levels of α-synuclein (SNCA) and showed pronounced enrichment in extracellular matrix remodeling (eg, NRGN, ELAV3) pathways. In contrast, PD-noRBD was characterized by dysregulated lipid metabolism (eg, APOE, CETP) and systemic inflammation. Specific DEPs correlated with motor severity, autonomic dysfunction, and brain iron deposition.
Conclusion: This pilot study reveals distinct proteomic profiles between the plasma nEVs of PD-RBD and PD-noRBD, suggesting divergent pathophysiological processes involving structural/extracellular matrix remodeling versus systemic metabolic-inflammatory pathways. These findings provide a prioritized panel of candidate nEV biomarkers for subtype-specific stratification in PD, which warrant further large-scale clinical and functional validation.
Keywords: Parkinson’s disease, rapid eye movement sleep behavior disorder, RBD, neuron-derived extracellular vesicle, L1CAM, proteomics
Introduction
Parkinson’s disease (PD) is the second common neurodegenerative disorder affecting approximately 13 million individuals worldwide and has emerged as one of the fastest-progressing neurological diseases, posing a substantial and growing public health burden.1–6 Over the years, our measurements against PD have made substantial progress; however, our treatments against which are still stranded on symptomatic level.7–10 While symptomatic treatments for motor symptoms offer clinical relief, preventing disease progression remains an unmet challenge due to the elusive etiology of PD and the ongoing lack of objective measures for early diagnosis and clinical stratification.
Notably, PD is a highly heterogeneous disease, characterized by distinct clinical manifestation, especially non-motor symptoms.11,12 Many of non-motor symptoms appear years before the onset of motor manifestations.13–15 Among these, rapid eye movement sleep behavior disorder (RBD) is considered a predominant prodromal feature of PD and is sometimes regarded as a “preclinical” subtype.16,17 While 46% to 77% of RBD patients eventually transition to PD, up to 54% of confirmed PD patients never manifest RBD.18–22 Clinically and biologically, the PD-RBD subtype often demonstrates an accelerated disease course, more pervasive cognitive decline and distinct peripheral symptoms compared to the PD-noRBD subtype.22–25 This clinical divergence is associated to the “body-first” hypothesis, which posits that RBD originates from peripheral α-Synuclein seeding events, then ascend via autonomic pathways to the brainstem, contrasting with the “brain-first” origin of non-RBD cases.26 We speculate that investigating this prodromal feature at the molecular level may contribute to elucidating PD pathogenesis, on the other hand, discovering a group of biomarker candidates that distinguishes the two may provide potential diagnostic tools. Although several body fluid biomarkers related to PD and RBD history have been proposed, these candidates are largely deduced from canonical hypotheses rather than being grounded in an unbiased, comprehensive proteomic landscape.27,28
To depict dynamic molecular features during the course of PD, it is essential to obtain molecular materials from the affected neurons. Given the complete inaccessibility of living brain tissue from patients, extracellular vesicles (EVs) have emerged as a powerful, non-invasive “liquid biopsy” source for neurodegenerative diseases.29–31 EVs actively travel cross the blood–brain barrier (BBB) while carrying disease-relevant cargo, which endowed them considerable potential in early diagnosis and molecular classification of diseases such as PD and Alzheimer’s disease (AD).32,33 Previous studies have demonstrated that the protein profiles of circulating EVs closely correlate with PD severity, staging, and specific clinical manifestations.28,34–36 However, how the RBD subtype influences the proteomic profile in these EVs remains a critical, unaddressed challenge.37,38 Thus, analyzing neuron-derived EV samples (nEVs) from PD patients with or without a history of RBD using omics technologies would be of great importance for advancing our pathophysiological understanding and biomarker discovery.19
These nEVs can be immuno-enriched from peripheral blood using the neuronal markers on the vesicle surface.39,40 Among the markers, neuronal cell adhesion molecule L1 (L1CAM, CD171) is the most widely recognized. In studies of PD, L1CAM-enriched EV are believed to carry disease-relevant proteins such as α-synuclein.31,34,41 We thus adopt this method to identify subtype-relevant molecular features in PD populations.
Given unresolved mechanistic questions, we propose an innovative hypothesis: L1CAM positive EVs from PD patients may carry subtype-specific protein signatures that reflect pathological progression. In this study, we collected peripheral blood samples from three groups: healthy controls (HC), PD patients with RBD history (PD-RBD), and PD patients without RBD history (PD-noRBD). nEVs were isolated using L1CAM-based immunoprecipitation. Quantitative proteomic analysis was performed using mass spectrometry to identify differentially expressed proteins (DEPs) among the three groups. Functional enrichment analyses and correlation analysis were then conducted to explore the potential molecular mechanisms underlying PD subtypes and to identify candidate biomarkers for early diagnosis or disease stratification.
Materials and Methods
Study Design
Eleven PD patients without a RBD history, and nine PD patients with a confirmed history of RBD were recruited, along with eight gender- and age-matched controls from Fuzhou University Affiliated Provincial Hospital, China. PD diagnosis was made according to the Movement Disorder Society (MDS) Clinical Diagnostic Criteria (2015), and PD-RBD patients were evaluated by the gold-standard method of video polysomnography (vPSG). The experiments were carried out with the written consent of the patients, in accordance with the hospital’s guidelines. The study protocol was approved by the Fuzhou University Affiliated Provincial Hospital (No. 2024–079-01). Demography characteristics were presented in supplementary materials Table S1.
Plasma Samples Collection
The overall experimental design is illustrated in the Graphical abstract. Five milliliters of morning fasting venous blood was collected in an ethylenediaminetetraacetic acid (EDTA)-coated anticoagulation tube, and centrifuged at 3000× g at 4°C for 10 min. The supernatants (plasma) were collected, then separated into 1.5 mL centrifuge tubes and immediately stored at −80 °C until EV isolation analysis.
To eliminate interference from excessive lipid particles, all plasma samples underwent rigorous visual inspection, and those exhibiting apparent turbidity were excluded, only clear, transparent plasma samples were utilized.
Plasma L1CAM+ EV Isolation
L1CAM+ EV isolation was performed by previously reported immunocapture method.42 In short, mouse anti-human CD171 (L1CAM) antibody (Clone 5G3; eBioscience, San Diego, CA) were conjugated onto the magnetic beads (70109–5, BeaverBeadsTM Mag COOH), to prepare immunomagnetic beads.
To isolate EVs from plasma, a three-step sequential centrifugation protocol was performed (300 × g for 10 min; 2000 × g for 20 min; 10,000 × g for 30 min) to remove cellular debris, protein aggregates chunks, and lipid particles. The resulting supernatant (pre-cleared plasma) was transferred to protein low-binding tubes (Eppendorf, Cat# 0030108450) for subsequent isolation of L1CAM+ EV. 360 μL of pre-cleared plasma was incubated with 1 mg prepared immunomagnetic beads overnight at 4°C to allow the EVs to bind with the beads. After incubation, implement magnetic separation to remove supernatant. After supernatant removal, the bead-bound complex (pellet) was aliquoted, the majority (90%) was then subjected to proteomics analysis, the left 10% was then used for EV characterization analysis.
To ensure binding specificity, parallel negative control experiments were routinely performed using an identical dosage of non-conjugated isotype control magnetic beads incubated with pooled quality control plasma from leftover samples. The complete absence of non-specific EV carryover in these controls was verified via Western blot analysis.
Elution of Immunocaptured L1CAM+ EV
Following the immunocapture incubation, the supernatant containing unbound components was carefully removed. The bead-bound complexes were resuspended in 50 µL of 0.05 mol/L glycine-HCl (pH 3.0) to dissociate the antibody–antigen interaction and elute the captured EVs. The mixture was incubated for 10 minutes under gentle agitation. Subsequently, the sample was placed on a magnetic rack to separate the magnetic beads from the eluent. The final supernatant, which contained the eluted EVs, was immediately transferred to a new protein low-binding tube and neutralized with 5 µL of 1 M Tris-HCl (pH 8.0) to ensure pH stability for downstream analyses.
Nanoparticle Tracking Analysis (NTA)
The size distribution and concentration of the isolated EVs were determined using Nanoparticle Tracking Analysis (NanoSight NS300, Malvern Panalytical). The eluted EV samples were diluted with sterile, particle-free phosphate-buffered saline (PBS) at ratios ranging from 1:10 to 1:100 to achieve an optimal concentration for analysis (20–100 particles per frame). For each sample, three videos of 60 seconds duration were captured under constant flow conditions at room temperature. The built-in NTA software (NTA 3.4) was used to analyze the videos, which tracks the Brownian motion of individual particles and calculates their hydrodynamic diameter and concentration based on the Stokes-Einstein equation.
Transmission Electron Microscopy (TEM)
The morphology of the isolated L1CAM+ EVs was visualized by TEM. Briefly, 10 µL of the L1CAM+ EV sample was applied to a formvar/carbon-coated copper grid and allowed to adsorb for 10 minutes. Excess liquid was blotted away with filter paper. The grid was then negatively stained with 2% (w/v) uranyl acetate solution for 1 minute, and the excess stain was removed. After air-drying, the grids were imaged using FEI Tecnai G2 transmission electron microscope operating at 100 kV at a magnification of 30,000×.
Western Blotting
To confirm the enrichment of L1CAM+ EVs and assess the presence of specific protein markers, Western blotting was performed. The protein content of the eluted L1CAM+ EVs was quantified using a BCA assay. An equal amount of protein from each sample was mixed with Laemmli sample buffer, denatured at 95°C for 5 minutes, and separated by SDS-PAGE on a 10% gel. The separated proteins were then transferred onto a PVDF membrane. The membrane was blocked with 5% non-fat milk in TBST (Tris-buffered saline with 0.1% Tween-20) for 1 hour at room temperature and subsequently incubated overnight at 4°C with the following primary antibodies: mouse anti-human L1CAM (1:1000, Invitrogen MA5-14140), rabbit anti-human CD9 (1:1000, abcam, ab263019), rabbit anti-human TSG101 (1:1000, abcam, ab125011), mouse anti-HSP90 (1:1000, Santa Cruz, sc-69703) and rabbit anti-human Calnexin (1:1000, abcam, ab133615) as a negative control for cellular contamination. After washing, the membrane was incubated with secondary antibodies (1:5000, Sangon Biotech, D110087 for mouse derived primary antibody, D110056 for rabbit derived primary antibody) for 1 hour at room temperature. Protein bands were visualized using an enhanced chemiluminescence (ECL) substrate and imaged with a chemiluminescence imaging system.
Protein Extraction and Digestion
The immunocaptured L1CAM+ EV-bead complexes were thawed, placed on a magnetic rack, and the supernatant was discarded. To directly lyse the EVs and extract proteins, 100 µL of 8 M urea was added to the bead pellet. For disulfide bond reduction, 10 µL of 100 mM dithiothreitol (DTT) was added, and the mixture was incubated at 37 °C for 2 h. Subsequently, proteins were alkylated with 10 µL of 500 mM iodoacetamide (IAA) in the dark for 15 min at room temperature. Residual IAA was then quenched by adding an additional 10 µL of 100 mM DTT and incubating for 15 min at room temperature.
Following extraction, protein cleanup and digestion were performed using the Single-Pot Solid-Phase-enhanced Sample Preparation (SP3) protocol (Hughes et al, 2019). Pre-washed SP3 magnetic beads were added to the lysate (at a 1:10 ratio), followed immediately by the addition of an equal volume of pure acetonitrile (ACN). The mixture was vortexed at 1200 rpm for 30 min at room temperature to facilitate protein binding to the SP3 beads. After brief centrifugation (2 s) and magnetic separation for 2 min, the supernatant was discarded. The bead-bound proteins were washed three times: for each wash, 180 µL of 80% ACN was added, vortexed for 1 min, and magnetically separated. The SP3 beads were subsequently air-dried in a fume hood for 5 min.
For digestion, 1 µg of sequencing-grade trypsin dissolved in 200 µL of 25 mM ammonium bicarbonate was added to the SP3 beads. The suspension was sonicated for 5 min and incubated overnight at 37 °C with agitation (600 rpm). Post-digestion, the sample was centrifuged at 20,000 rpm for 2 min and placed on a magnetic rack for 2 min to collect the peptide-containing supernatant. To maximize peptide recovery, the beads were eluted a second time with 200 µL of 2% DMSO, sonicated for 5 min, vortexed for 5 min, and magnetically separated. Both supernatants were combined and dried in a vacuum centrifuge prior to desalting.
Peptide Desalting
Peptide mixtures were desalted using ZipTip C18 Pipette Tips (Merck Millipore, USA) according to the manufacturer’s instructions with minor modifications. Briefly, the vacuum-dried peptide samples were resuspended in Nano-HPLC Buffer A. The C18 columns were first activated with 40 µL of methanol (twice) and equilibrated with 40 µL of Nano-HPLC Buffer A (twice) by centrifugation. The resuspended sample was loaded onto the column, and the flow-through was re-passed through the column to ensure maximal binding. After washing the column twice with 40 µL of Nano-HPLC Buffer A, the bound peptides were eluted with 40 µL of Elution Buffer B. The elution step was repeated once to yield a total volume of 80 µL. The final eluate was evaporated to dryness in a vacuum centrifuge prior to LC-MS/MS analysis.
Liquid Chromatography–Tandem Mass Spectrometry (LC–MS/MS)
Peptide separation was performed on an Ultimate 3000 nanoLC system (Thermo Scientific) using a 75 μm × 15 cm C18 column (Aurora Ultimate). Mobile phases consisted of 0.1% formic acid in water (A) and 0.1% formic acid in 80% acetonitrile (B). Peptides were eluted with the following gradient at a flow rate of 600 nL/min: 8–35% B over 9.5 min, 35–90% B from 9.5–10.5 min, 90% B from 10.5–11.5 min, and 90–2% B from 11.5–12 min.
Eluted peptides were analyzed on a timsTOF HT mass spectrometer (Bruker) operating in data-independent acquisition (DIA) mode with parallel accumulation–serial fragmentation (PASEF). The scan range was 100–1700 m/z with ion mobility separation between 0.6 and 1.6 1/K0 (V·s/cm2). Accumulation time was set to 50 ms with a 100% duty cycle. Isolation windows were 2 m/z below 700 m/z and 3 m/z above 800 m/z. Default collision energies (20–59 eV) were applied.
Database Search and Protein Identification
Raw data were processed with DIA-NN (v1.8.1) using the UniProt Homo sapiens reference proteome (UP000005640; 20,597 entries) supplemented with iRT peptides. The following parameters were applied: enzyme specificity for trypsin with up to one missed cleavage; carbamidomethylation (C) as a fixed modification; and methionine oxidation and protein N-terminal acetylation as variable modifications. MS1 and MS2 tolerances were set to automatic adjustment. A false discovery rate (FDR) of 1% was applied at precursor and protein levels, and quantification was based on identified peptide intensities.
Protein quantification was based on MaxLFQ intensities generated by DIA-NN, which normalizes and integrates the intensity profiles of all quantifiable unique peptides for each protein. For downstream statistical interpretation, the protein abundance matrix was initially filtered to control missing data. The remaining missing values were systematically imputed utilizing the GSimp (Gibbs sampler-based left-truncated imputation) algorithm. Subsequently, Variance Stabilizing Normalization (vsn) was performed on the data matrix to minimize systematic technical variation and stabilize variance across samples. Characterized protein and the corresponding peptide number in each sample was presented in Table S2.
Bioinformatics Analysis
Subcellular localization was predicted using DeepLoc 2.1. Following log2-transformation and missing value imputation, data quality was evaluated via Principal Component Analysis (PCA), Pearson correlation, and hierarchical clustering. Differential expression analysis was performed using the limma package, identifying significantly differentially expressed proteins (DEPs) with a threshold of p < 0.01 and |log2FC| > 1. Functional enrichment, including Over-Representation Analysis (ORA) and Gene Set Enrichment Analysis (GSEA), was conducted using the DEP2 package based on Gene Ontology (GO), KEGG, and Reactome databases, complemented by Protein–Protein Interaction (PPI) network analysis.
Statistics
Statistical analyses and data visualization were performed using Origin. For comparisons of protein expression levels across the three groups, Welch’s one-way ANOVA was employed. Associations between the abundance of DEPs, QSM metrics, and clinical characteristics were evaluated using Spearman’s rank correlation analysis. A p-value of <0.05 was considered statistically significant. Candidate biomarker selection was performed using the iterative feature selection algorithm described by Feng et al.43 Briefly, this wrapper-based approach employs recursive feature elimination to identify optimal biomarker combinations for binary classification. Starting from the top-ranked DEPs (ranked by fold-change and statistical significance), the algorithm iteratively evaluates all possible combinations of biomarkers using logistic regression. For each combination, classification performance is assessed through leave-one-out cross-validation. The objective function aims to maximize the area under the curve (AUC) while minimizing the number of features. Combinations that achieve predefined performance thresholds (AUC > 0.85) are retained as candidate biomarker panels. This approach systematically identifies parsimonious biomarker sets (such as COL3A1+NRGN and CSE1L) that provide high discriminatory power between PD subtypes.
Results
Extracellular Vesicle Characterization
To verify the successful isolation of L1CAM+ EVs from plasma, we employed Western blotting, transmission electron microscopy (TEM), and nanoparticle tracking analysis (NTA). The eluted EV solution showed a unimodal size distribution (peak at 103 nm) centered around the previously reported diameter range for L1CAM+ EVs (Figure 1A). TEM further confirmed the presence of EVs in the eluted fraction, with morphology consistent with previously described EV structures (Figure 1B). The presence of characteristic bands for CD9, CD81, HSP90, and L1CAM (CD171) indicates successful enrichment of L1CAM+ EVs (Figure 1C). Collectively, these results confirm the successful isolation of neuron-derived EVs via L1CAM immunocapture.
 |
Figure 1 Validation of plasma extracellular vesicles. (A) NTA shows that the size distribution of EVs centered on ~103 nm. (B) Representative TEM image of isolated L1CAM+ EV (magnification: 30,000×). Scale bar = 200 nm. (C) WB analysis showed the expression of L1CAM+ EV marker proteins. |
Tims TOF HT-DIA Analysis L1CAM+ EV Proteins and Identified Differentially Expressed Proteins (DEPs) Between Groups
Using TimsTOF HT-DIA-based proteomic profiling, we identified a total of 1354 reliable proteins from L1CAM+ EV across all subjects. Hierarchical clustering and principal component analysis (PCA) revealed a clear group-level separation among the PD-RBD, PD-noRBD, and HC groups. Differential expression analysis revealed 239 DEPs between PD-noRBD and PD-RBD (141 up-regulated, 98 down-regulated), 363 DEPs between PD-noRBD and HC (191 up, 172 down), and 196 DEPs between PD-RBD and HC (88 up, 108 down) (|log2 fold change| > 1 and adjusted p-value <0.01, Figure 2A). These DEPs are visualized in volcano plots and hierarchical clustering heatmaps (Figure 2A and B), and are detailed in Figures S1–S4. Moreover, subcellular localization prediction using DeepLoc 2.1 showed that the identified proteins were predominantly distributed in the extracellular space (47%), cytoplasm (20%), and nucleus (8%), with smaller fractions assigned to cell membrane, endoplasmic reticulum, mitochondrion, and other compartments (Figure 2C).
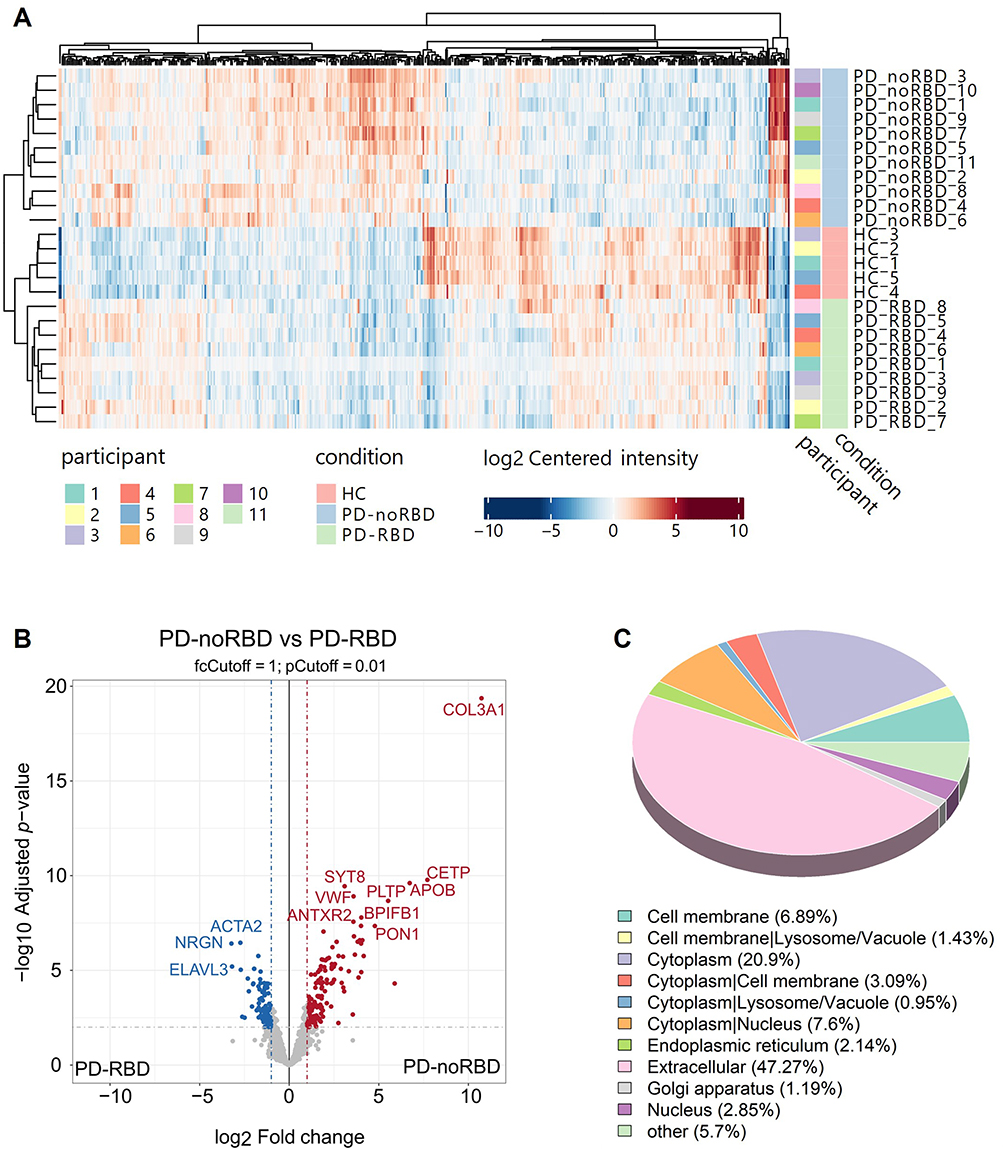 |
Figure 2 Screening for differentially expressed proteins in plasma extracellular vesicles. (A) Cluster analysis and PCA plot of plasma L1CAM+ EV proteins between healthy controls, PD-RBD and PD-no RBD. (B) In the volcano plot, where the blue dots represent downregulated proteins and the red dots represent up-regulated proteins. (C) Subcellular localization pie chart of the identified proteins. The figure shows the proportion of proteins assigned to each subcellular category. |
Pathway Enrichment Analysis by Over-Representation Analysis (ORA)
We then performed pathway enrichment by ORA in GO/KEGG/REACTOME databases. Significant enrichment groups were identified (p-adj. <0.05 was considered significant).
GO enrichment analysis revealed several immune- and metabolism-related processes significantly altered in PD-noRBD compared to PD-RBD. “Blood microparticle”, “collagen-containing extracellular matrix”, and “humoral immune response” were among the top enriched terms (Figure 3A). Additional ORA categories included peptidase regulatory activity and multiple lipoprotein-related processes, such as “lipoprotein particle”, “Humoral Immune Response” and “Peptidase Regulator Activity”. Functional network analysis further demonstrated that these enriched terms were interconnected by key proteins, including SERPING1, APOE, CETP, and PON1 in lipid metabolism, and TF, TFRC in iron metabolism, as well as C3, IGHG4, in immune regulation (Figure 3B). In PD-noRBD, metabolic and blood microparticle-related pathways were more prominent, whereas ECM remodeling predominates in PD-RBD. These findings suggest that extracellular matrix remodeling, lipid metabolism and iron metabolism pathways contribute to the pathophysiological differences between PD-noRBD and PD-RBD.
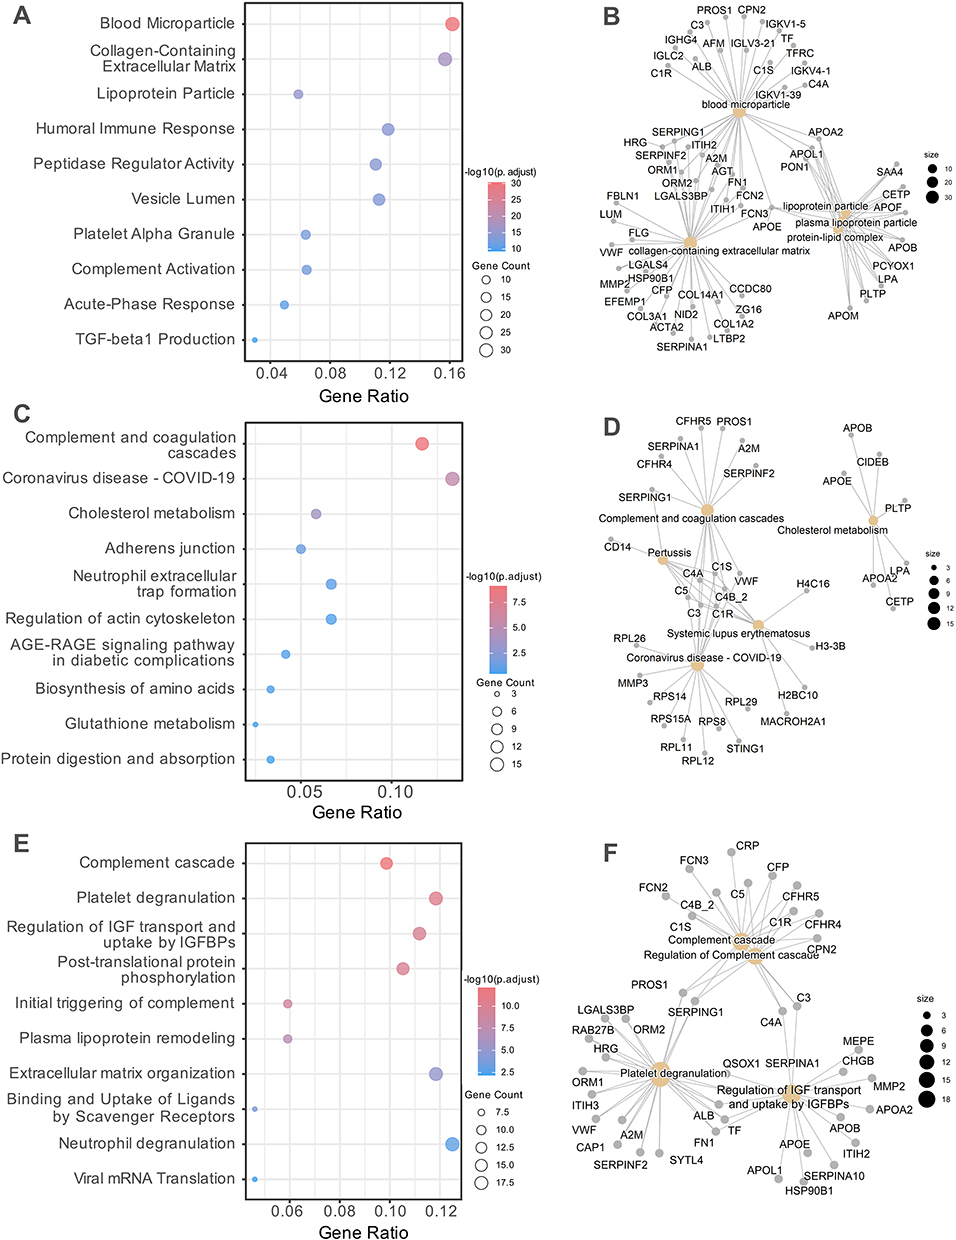 |
Figure 3 ORA pathway enrichment map for L1CAM+ EV proteins in PD-RBD vs PD-noRBD. ORA was performed using the clusterProfiler package to identify significantly enriched biological processes and pathways. (A and B), GO enrichment analysis of DEPs, shown as dot plots (A) and Gene-Concept Network (GCN) (B). (C and D), KEGG pathway enrichment analysis of DEPs, shown as dot plots (C) and GCN (D). (E and F), Reactome pathway enrichment analysis of DEPs, shown as dot plots (E) and GCN (F). In dot plots, circle size represents the number of proteins enriched in each term, and color indicates the adjusted p-value. In GCN maps, node size reflects the number of proteins associated with each pathway, and edges denote overlap between pathways. |
KEGG pathway enrichment further highlighted alterations in immune- and lipid-related pathways between PD-noRBD and PD-RBD. “Complement and coagulation cascades” emerged as the most significantly enriched category among the upregulated signatures in the PD-noRBD group. Other significantly enriched pathways included, cholesterol metabolism, adherens junction, and immune reaction processes (Figure 3C). Network analysis demonstrated two major reliable functional clusters: a complement coagulation module driven by key proteins such as CFHR5, SERPING1, and several Complement Components. A lipid metabolism module enriched for APOE, APOB, CETP, PLTP, and APOA1. Notably, a module related to COVID-19 emerged, driven by STING1, MMP3 and several Ribosomal Proteins (RPL/RPS series), while it shares several Complement Components with other modules (Figure 3D). Together, these findings suggest that dysregulation of complement activation, immune response, and lipid metabolism represent different pathophysiological features distinguishing PD-noRBD and PD-RBD.
Metabolic, platelet and complement-related processes were reiterated in Reactome enrichment. Significant enrichment was observed in pathways associated with complement cascade, platelet degranulation, and regulation of insulin-like growth factor (IGF) transport and uptake by IGFBPs (Figure 3E). In addition, processes related to post-translational protein phosphorylation, as well as plasma lipoprotein assembly and remodeling, were also identified. Notably, as the pathway of regulation of IGF transport and uptake was significantly enriched, suggesting potential links to metabolic and neuroprotective mechanisms. The Reactome protein-term interaction network further highlighted key nodes such as APOE, APOB, and HSP90B1 in IGF transport and uptake, and FN1, ALB, and A2M in platelet degranulation, alongside C3, C4A, C1R, and CFP within the complement cascade. (Figure 3F).
Together, these findings indicate that both immune-coagulation dysregulation and metabolic pathways may underlie the phenotypic divergence between PD patients with and without RBD. Importantly, this aligns with the long-standing hypothesis that a substantial proportion of sporadic PD is closely linked to systemic metabolic dysfunction, whereas PD with RBD may be more directly rooted in brain-origin mechanisms. Furthermore, comparisons of each PD subgroup with healthy controls yielded consistent patterns supporting the above observations, as detailed in the Figures S5–S7.
Pathway Enrichment Analysis by Gene Set Enrichment Analysis (GSEA)
GSEA based on KEGG pathways indicated prominent enrichment of lipid metabolism and immune-coagulation processes, which was generally in line with ORA results. Key pathways significantly enriched with positive enrichment scores in PD-noRBD compared with PD-RBD included cholesterol metabolism, complement and coagulation cascades, regulation of actin cytoskeleton, and global metabolic pathways (Figure 4A). Broader metabolic pathways were also significantly represented. Conversely, significant negative enrichment was exclusively observed in the ribosome pathway, which also manifested the highest statistical significance, suggesting a profound divergence in active protein translation machinery between the two clinical subtypes. The enrichment profile underscores that lipid dysregulation and immune-coagulation abnormalities are central biological features distinguishing PD patients with and without RBD.
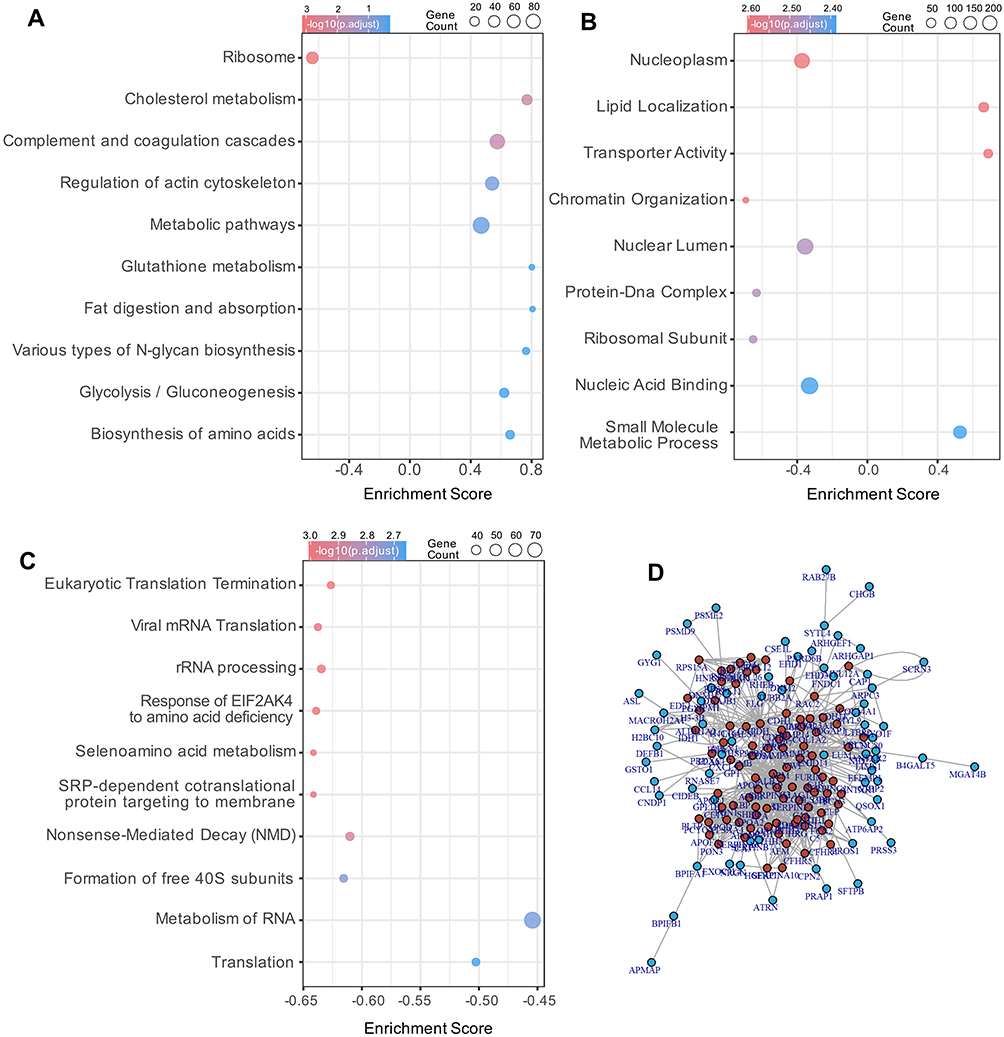 |
Figure 4 Gene set enrichment and protein–protein interaction analysis of L1CAM+ EV proteins in PD-RBD vs PD-noRBD. (A-C), Gene Set Enrichment Analysis (GSEA) of DEPs across KEGG (A), GO (B), and Reactome (C) databases. Dot plots display significantly enriched gene sets, where circle size corresponds to the number of proteins enriched and color represents the adjusted p-value. The enrichment score indicates the degree and direction of pathway regulation. (D) Protein–protein interaction (PPI) network constructed from DEPs enriched in key pathways. Nodes represent proteins, edges indicate protein–protein interactions. |
GSEA based on GO terms highlights nuclear and chromatin-associated processes between PD-noRBD and PD-RBD. Specifically, functions including transporter activity, lipid localization, and small molecule metabolic process were enriched in PD-noRBD (Figure 4B). In contrast, pathways related to nucleoplasm, nuclear lumen, nucleic acid binding, chromatin organization, protein-DNA complex, and ribosomal subunit were enriched in the PD-RBD group, while terms associated with chromatin remodeling and organization were also significant. Slightly different from ORA, GSEA enrichment profile suggests that alterations in chromatin dynamics and nuclear function, together with lipid transport mechanisms, underpins the divergent molecular pathogenesis in PD patients with or without a history of RBD.
Reactome GSEA analysis exclusively revealed negative enrichment of translation and RNA processing pathways in PD-noRBD compared with PD-RBD (Figure 4C). Key suppressed terms included Eukaryotic Translation Termination, Viral mRNA Translation, rRNA processing, Nonsense-Mediated Decay, and SRP-dependent cotranslational protein targeting to membrane. Additionally, significant downregulation was observed in the Response of EIF2AK4 to amino acid deficiency, Selenoamino acid metabolism, Formation of free 40S subunits, as well as overarching clusters of Translation and Metabolism of RNA. This profile suggests that the PD-noRBD phenotype is characterized by a coordinated suppression of protein synthesis, ribosomal assembly, and RNA metabolic machinery compared with PD-RBD.
Taken together, GSEA results across GO, KEGG, and Reactome consistently point to coordinated alterations in lipid metabolism, immune-coagulation processes, importantly, nuclear/translational functions. These findings suggest that both metabolic-immune dysregulation and impaired nuclear/chromatin dynamics underline the phenotypic divergence between PD patients with and without RBD. Additional comparisons with healthy controls, presented in Supplementary Materials, further support these observations (Figures S8 and S9).
Protein–Protein Interaction (PPI) Analysis
To further explore the biological significance of DEPs between groups, PPI network was constructed. Network analysis revealed densely interconnected modules between PD-noRBD vs PD-RBD, and PD vs HC.
In comparison between PD-noRBD and PD-RBD, the PPI network was dominated by lipid metabolism and inflammatory proteins. Hub nodes included CETP, APOF, APOE, and APOA2, which were highly interconnected and involved in lipoprotein remodeling and cholesterol transport. Acute-phase proteins such as CRP and SAA4, together with BPIFA1 and PCYOX1, further connected the network, indicating systemic inflammatory and oxidative stress–related processes. (Figure 4D) These findings suggest that lipid transport dysregulation and inflammatory responses play a major role in differentiating PD patients with and without RBD.
When comparing PD patients (both PD-noRBD and PD-RBD) to healthy controls, the networks consistently highlighted ECM and proteoglycan-related clusters, with XYLT2, BGN, VCAN, DCN, and SRGN forming the central modules. These proteins are closely linked to glycosaminoglycan biosynthesis and ECM organization, suggesting profound structural remodeling of the extracellular microenvironment in PD. Complement pathway components such as SERPING1 were also represented, reinforcing the involvement of immune activation in PD pathology. (Figure S10) Taken together, the PPI analysis indicates that while lipid and inflammatory pathways drive the differences between PD-noRBD and PD-RBD, both PD subgroups share common ECM remodeling and complement activation signatures compared with HCs.
Overall, integrated PPI results highlight a dual pattern: PD-noRBD is characterized by enhanced lipid metabolism and inflammatory activity, whereas PD-RBD shows a stronger ECM and complement activation signature. Both subgroups, however, share a common PD-related core of extracellular matrix remodeling and immune dysregulation, suggesting converging but distinct pathogenic mechanisms underlying PD phenotypes with and without RBD.
Correlation Analyses of Prominent DEPs with Quantitative Susceptibility Mapping (QSM) Metrics and Clinical Features
Quantitative Susceptibility Mapping (QSM) is a magnetic resonance imaging technique that quantifies tissue magnetic susceptibility, enabling non-invasive assessment of brain iron deposition. Representative QSM images and region-of-interest delineation are shown in Figure S11. Given that dysregulation of iron metabolism has been long considered to play a central role in PD pathogenesis, and iron-related proteins were identified as hub proteins in our enrichment analysis, prominent DEPs were correlated with QSM metrics in major PD lesion sites (Figure 5A). The strongest associations emerged in the pallidum: COL3A1 correlated positively with QSM in both globus pallidus externus and internus, whereas MMP7 showed inverse correlations. Lipid transport proteins PLTP and regulator protein IQGAP1 also showed positive associations with pallidal QSM. Moreover, iron-handling protein LTF correlated negatively. In contrast, fibrinogen chains (FGG, FGB) were most strongly linked to striatal susceptibility, whereas no robust protein–QSM associations were found in the red nucleus, substantia nigra, or subthalamic nucleus. These data indicate that pallidal iron deposition is linked to ECM remodeling, metabolism, and iron transport, while striatal susceptibility aligns with neuroinflammation-related pathways.
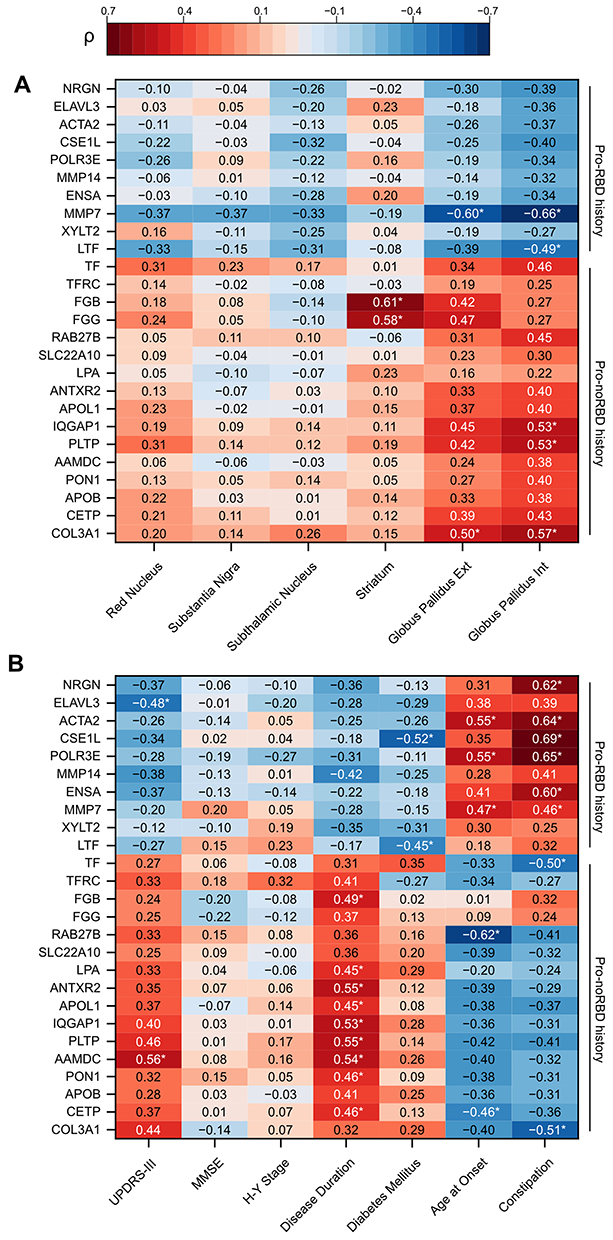 |
Figure 5 Correlation heatmaps of prominent DEPs with QSM metrics and clinical features in PD. Heatmaps display Spearman correlation coefficients (ρ) between DEPs and (A) QSM values in major PD lesion sites, or (B) clinical parameters including UPDRS-III scores, age at onset, disease duration, and symptoms. Color scale indicates the strength and direction of correlations (red = positive, blue = negative). Asterisks mark statistically significant correlations (*p < 0.05). |
Beyond imaging markers, several DEPs correlated with clinical features. (Figure 5B) AAMDC and PLTP showed positive correlations with UPDRS-III motor scores, whereas ELAVL3 correlated negatively, implicating lipid metabolism and neurodegeneration in motor impairment. Disease duration was positively associated with proteins involved in metabolism, cytoskeletal dynamics, and extracellular matrix remodeling (eg, AAMDC, PLTP, IQGAP1, APOL1, FGB). Age at onset showed opposite correlations with CETP and RAB27B (negative) versus MMP7, POLR3E, and ACTA2 (positive), suggesting nuanced effects of lipid metabolism and matrix remodeling on disease initiation. Interestingly, constipation correlated positively with MMP7, ENSA, POLR3E, CSE1L, ACTA2 and negatively with COL3A1 and TF, indicating multifactorial mechanisms involving neuronal excitability, extracellular matrix changes, and iron homeostasis in autonomic neuron dysfunction. Finally, diabetes mellitus was negatively associated with CSE1L and LTF, pointing to mechanisms of nucleocytoplasmic trafficking and iron regulation.
Differentiating PD Subtypes with L1CAM+ EV-Based Proteins
The hallmark pathological protein SNCA (ɑ-synuclein) was noticed to be significantly upregulated in RBD patients’ and PD patients’ plasma EVs.44,45 Nevertheless, scenario in targeted neuron-derived EVs is promising but remains highly controversial.42,43,46 In our case, we noticed that SNCA level in PD-RBD was significantly higher than PD-noRBD. (Figure 6A) Such a difference implies the distinct pathogenesis regarding PD subtypes with or without a RBD history. Furthermore, a panel of biomarkers can be discovered to distinguish these subtypes, to provide reference for patients’ prognosis and treatment in the future (Figure S12).
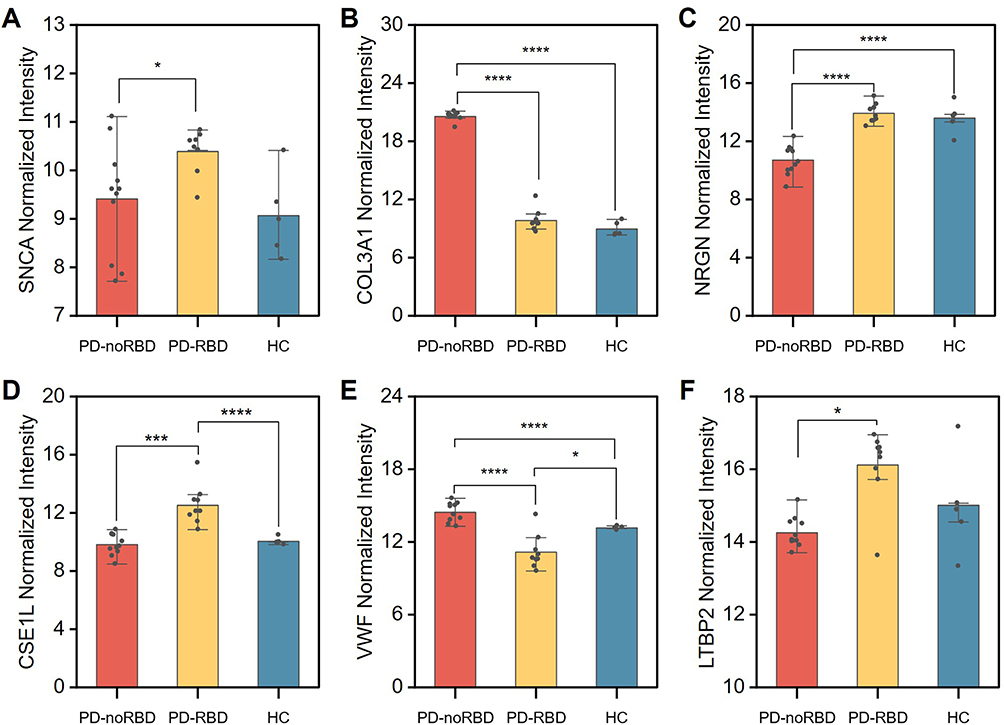 |
Figure 6 Differential expression and biomarker validation of L1CAM+ EV proteins in PD subtypes. (A) Distribution of the core pathological protein SNCA across PD-noRBD, PD-RBD, and HC groups. B-E, Multiple comparisons of selected marker proteins: (B) COL3A1, (C) NRGN, (D) CSE1L, (E) VWF and (F) LTBP2 in plasma L1CAM+ EVs. Welch’s ANOVA for multiple comparisons, Asterisks indicate statistical significance: *p < 0.05, ***p < 0.001, ****p < 0.0001. |
Using a multi-biomarker subset selection algorithm, we screened plasma L1CAM+ EV proteins to identify potential biomarkers for differentiating these two PD subtypes out of three classes.47 Two strategies were proposed, the first one is to combine two markers that solely highlight one class from three classes. There are quite a few combinations fit for this strategy, and we hereby demonstrate an example. (Figure 6B and C) Another one is to select a single marker that has distinct levels in each of three classes, which makes it possible to discern the condition by a single measurement. (Figure 6D–F) However, the number of proteins that met this criterion was limited in our proteomics data, while their diagnostic value needs further larger multicenter validations.
Discussion
In this study, we performed an exploratory proteomic analysis of plasma neuron-derived EV to delineate the molecular landscapes of PD subtypes in patients with and without a history of RBD. Our findings reveal intriguing and subtype-specific alterations in the L1CAM+ EV proteome, highlighting divergent pathophysiological profiles underlying PD-RBD and PD-noRBD, and identifying a panel of potential biomarkers.
A notable observation is the distinct molecular signatures separating the two subtypes. Although both subtypes exhibit significant alterations compared to healthy controls, the PD-noRBD group was characterized by a pronounced upregulation of proteins involved in lipid metabolism and inflammatory responses. Key hub proteins central to lipoprotein remodeling and cholesterol transport (such as APOE, CETP, and PLTP) formed a interconnected network, supporting the relevance of systemic metabolic dysfunction, in subtype-specific PD pathogenesis. The enrichment of immune-coagulation pathways suggests a state of chronic systemic inflammation component in PD-noRBD. This is supported by our correlation analysis, where fibrinogen chains (FGG, FGB) showed a positive association with iron deposition in the striatum. This finding potentially links peripheral inflammatory-coagulative activity to regional subcortical neurodegeneration.
In contrast, the PD-RBD group exhibited a signature dominated by ECM remodeling, localized neurodegeneration, active RNA translational regulation. We observed an upregulation of critical proteins such as neuronal integrity marker NRGN and RNA-binding protein ELAVL3, alongside the matrix-modulating components COL1A2 or MMP14. This proteomic profile is reinforced by pathway enrichment analysis, which demonstrates that eukaryotic translation, and ribosomal RNA processing machinery are prominently associated with the PD-RBD cases. Collectively, these findings imply that the pathological trajectory of PD-RBD may be more closely linked to a “neurodegeneration-centric” framework.
Our analysis also highlighted several candidate proteins with distinct correlation patterns tied to clinical metrics.28,48,49 DEPs preferential to the PD-noRBD status generally associated positively with clinical severity scales, disease duration, and metabolic co-morbidities like diabetes. Conversely, DEPs unique to the PD-RBD profile displayed inverse trends with these metrics but showed positive correlations with onset age and autonomic features such as constipation. PD-noRBD-enriched DEPs were generally positively associated with QSM values, whereas PD-RBD-enriched DEPs were negatively associated. These heterogeneous association profiles reinforce the distinct systemic involvement characterizing individual PD subphenotypes, which conceptually aligns with emerging “body-first” versus “brain-first” models of disease progression.50
It was also noticed that several interesting correlation were presented in this work. The significant positive correlation between PD-noRBD pronounced proteins (eg COL3A1) and iron deposition in the globus pallidus, and the inverse correlation with PD-RBD pronounced proteins (eg MMP7 and COL1A2), suggest a dynamic interplay between ECM turnover and iron dyshomeostasis in this specific brain region. This is particularly intriguing as COL3A1 is considered a collagen component in ECM but was pronounced in PD-noRBD cases, which was in an opposite direction as its paralog COL1A2. We further deduce that it might be related to their different roles in material architecture, which further links to different pathophysiology. On the other hand, we noticed a “COVID-19” pathway was repeatedly and significantly enriched in both PD-noRBD and PD-RBD groups, whereas its potency in PD-noRBD exceed that in PD-RBD. We backdated the clinical record, and noticed that all participants underwent at least once COVID infection during year 2023–2024. We have raised two hypothesis: first, it may represent a coincidental enrichment driven by overlapping inflammatory or immune-related gene annotations; second, COVID-19 infection does participate in PD pathogenesis, exerting differential weights across distinct clinical subtypes. Either way, these results warrant further large-scale clinical and functional validation.
This study also identifies several proteins with biomarker potential. Although several pioneers have made substantial contributions in distinguishing RBD related subtypes. Our own team previously demonstrated that serum L1CAM+ nEV α-synuclein accurately identifies prodromal iRBD cohorts, and reliably differentiates clinical PD from atypical parkinsonism.41,50 In parallel, targeted proteomic and targeted immunosorbent platforms were also used in nEV assessment.28,51 Several biomarkers, or biomarker panels were highlighted, some of which were consistent with our data (eg MMP7 and SLC family). While these valuable prior studies have largely focused on pre-defined or targeted biomarker panels, our work complements them by offering an untargeted, exploratory global proteomic overview in this specific context.
Taken together, these insights support the hypothesis that PD comprises heterogeneous subtypes with unique molecular characteristics rather than representing a monolithic entity.
Despite these compelling findings, several limitations must be acknowledged. The relatively small sample size is the most significant limitation, which may affect the statistical power and generalizability of our results. Independent validation in a larger, prospective, multi-center cohort is an absolute prerequisite for clinical translation. Second, while we used L1CAM immunoprecipitation to scavenge neuron-derived EVs, the specificity of this method remains a topic of debate, and our findings could be influenced by non-neuronal contaminants.52 Third, our study is cross-sectional, precluding any conclusions about the causal relationships or the temporal evolution of the observed proteomic changes. Furthermore, it must be acknowledged that the present study lacks direct cell- or animal-based experimental evidence to validate the detailed downstream functional importance of the identified candidate biomarkers. Longitudinal studies are needed to determine if these signatures can predict phenotypic conversion from RBD to PD or track disease progression.
Conclusions
In conclusion, this exploratory study maps plasma neuron-derived EV profiles in PD subtypes. The data indicate that PD-noRBD subtype inclines to demonstrate alterations in lipid metabolism and systemic inflammation, whereas PD-RBD displays a signature associated with localized translational regulation, neurodegeneration, and ECM remodeling. These distinct molecular profiles also provided a pool of candidate biomarkers that may assist in patient stratification and help clarify the clinical heterogeneity of PD.
Data Sharing Statement
The datasets used and/or analysed during the current study are available from the corresponding author on reasonable request. The raw mass spectrometry data has been deposited in PRIDE database (Project accession: PXD076025, Reviewer Token: vhwcRRC9OZP8). The dataset will be released publicly upon publication of the manuscript.
Ethics Approval and Consent to Participate
Ethical approval for the plasma samples in the cohort was granted through the Fuzhou University Affiliated Provincial Hospital Research Ethics Committee (code: 2024-079-01), and the study was conducted in accordance with the Declaration of Helsinki. Data relating to supplied samples was released on an anonymized basis. Written informed consent was obtained from all participants prior to sample collection.
Author Contributions
All authors made a significant contribution to the work reported, whether that is in the conception, study design, execution, acquisition of data, analysis and interpretation, or in all these areas; took part in drafting, revising or critically reviewing the article; gave final approval of the version to be published; have agreed on the journal to which the article has been submitted; and agreed to be accountable for all aspects of the work.
Funding
This work was supported by the Natural Science Foundation of Fujian Province (No.2024J011018), Fujian provincial health technology project (No.2024CXA001), the National Natural Science Foundation of China (No. 82471256, 82471500). Dr Cheng Jiang acknowledges fundings from General program of Guangdong Basic and Applied Basic Research Foundation (2024A515012060, 2022A1515110206), Shenzhen Science and Technology Program (2023SC0005, KJZD20230923115228056), Shenzhen Peacock Team (KQTD20240729102029016), Shenzhen International Science and Technology Cooperation Project (GJHZ20220913144002005), Pengcheng Peacok Research Fund (2024TC0150, KQ002573). Joint Funds for the innovation of science and Technology, Fujian province(Grant number: 2025Y9048), Guangdong Basic Research Center of Excellence for Aggregate Science.
Disclosure
The authors declare that they have no competing interests.
References
1. Ben-Shlomo Y, Darweesh S, Llibre-Guerra J, Marras C, Luciano MS, Tanner C. The epidemiology of Parkinson’s disease. Lancet. 2024;403(10423):283–18. doi:10.1016/S0140-6736(23)01419-8
2. Rodriguez M, Rodriguez-Sabate C, Morales I, Sanchez A, Sabate M. Parkinson’s disease as a result of aging. Aging Cell. 2015;14(3):293–308. doi:10.1111/acel.12312
3. Rocca WA. The burden of Parkinson’s disease: a worldwide perspective. Lancet Neurol. 2018;17(11):928–929. doi:10.1016/S1474-4422(18)30355-7
4. Jankovic J. Parkinson’s disease: clinical features and diagnosis. J Neurol Neurosurg Psychiatry. 2008;79(4):368–376. doi:10.1136/jnnp.2007.131045
5. Kumar S, Goyal L, Singh S. Tremor and rigidity in patients with Parkinson’s disease: emphasis on epidemiology, pathophysiology and contributing factors. CNS Neurol Disord Drug Targets. 2022;21(7):596–609. doi:10.2174/1871527320666211006142100
6. Herz DM, Brown P. Moving, fast and slow: behavioural insights into bradykinesia in Parkinson’s disease. Brain. 2023;146(9):3576–3586. doi:10.1093/brain/awad069
7. Balestrino R, Schapira AH. Parkinson disease. Eur J Neurol. 2020;27(1):27–42. doi:10.1111/ene.14108
8. Hess CW, Hallett M. The phenomenology of Parkinson’s disease. Semin Neurol. 2017;37(2):109–117. doi:10.1055/s-0037-1601869
9. Safiri S, Noori M, Nejadghaderi SA, et al. The burden of Parkinson’s disease in the Middle East and north Africa region, 1990–2019: results from the global burden of disease study 2019. BMC Public Health. 2023;23(1):107. doi:10.1186/s12889-023-15018-x
10. Braak H, Ghebremedhin E, Rüb U, Bratzke H, Del Tredici K. Stages in the development of Parkinson’s disease-related pathology. Cell Tissue Res. 2004;318(1):121–134. doi:10.1007/s00441-004-0956-9
11. Jagadeesan AJ, Murugesan R, Vimala Devi S, et al. Current trends in etiology, prognosis and therapeutic aspects of Parkinson’s disease: a review. Acta Bio Med. 2017;88(3):249–262. doi:10.23750/abm.v/vi/i.6063
12. Schapira AHV, Chaudhuri KR, Jenner P. Non-motor features of Parkinson disease. Nat Rev Neurosci. 2017;18(7):435–450. doi:10.1038/nrn.2017.62
13. Postuma RB, Iranzo A, Hu M, et al. Risk and predictors of dementia and parkinsonism in idiopathic REM sleep behaviour disorder: a multicentre study. Brain. 2019;142(3):744–759. doi:10.1093/brain/awz030
14. Lacy B, Piotrowski HJ, Dewey RB, Husain MM. Severity of depressive and motor symptoms impacts quality of life in Parkinson’s disease patients at an academic movement clinic: a cross-sectional study. Clin Park Relat Disord. 2023;8:100180. doi:10.1016/j.prdoa.2022.100180
15. Röttgen S, Lindner MS, Seger A, et al. Non-motor symptoms in prodromal Parkinson’s disease are linked to reduced quality of life. J Parkinson’s Dis. 2025;15(2):434–439. doi:10.1177/1877718X241310726
16. Suzuki K, Miyamoto M, Miyamoto T, Iwanami M, Hirata K. Sleep disturbances associated with Parkinson′s disease. Parkinson’s Dis. 2011;2011(1):219056. doi:10.4061/2011/219056
17. Nomura T, Inoue Y, Mitani H, Kawahara R, Miyake M, Nakashima K. Visual hallucinations as REM sleep behavior disorders in patients with Parkinson’s disease. Mov Disord. 2003;18(7):812–817. doi:10.1002/mds.10439
18. Cesari M, Heidbreder A, St. Louis EK, et al. Video-polysomnography procedures for diagnosis of rapid eye movement sleep behavior disorder (RBD) and the identification of its prodromal stages: guidelines from the international RBD study group. Sleep. 2022;45(3):zsab257. doi:10.1093/sleep/zsab257
19. Bruschi G, Bortolin E, Mazzeo S, et al. Tracking prodromal α-synucleinopathies: novel fluid- and tissue-based biomarker approaches for iRBD phenoconversion. Sleep. 2025;48:zsaf174. doi:10.1093/sleep/zsaf174
20. Pérez-Carbonell L, Simonet C, Chohan H, et al. The views of patients with isolated rapid eye movement sleep behavior disorder on risk disclosure. Mov Disord. 2023;38(6):1089–1093. doi:10.1002/mds.29403
21. Figorilli M, Meloni M, Lanza G, et al. Considering REM sleep behavior disorder in the management of Parkinson’s disease. Nat Sci Sleep. 2023;15:333–352. doi:10.2147/NSS.S266071
22. Joza S, Hu MT, Jung KY, et al. Progression of clinical markers in prodromal Parkinson’s disease and dementia with Lewy bodies: a multicentre study. Brain. 2023;146(8):3258–3272. doi:10.1093/brain/awad072
23. Postuma RB, Gagnon JF, Bertrand JA, Génier Marchand D, Montplaisir JY. Parkinson risk in idiopathic REM sleep behavior disorder. Neurology. 2015;84(11):1104–1113. doi:10.1212/WNL.0000000000001364
24. Liu H, Ou R, Wei Q, et al. Rapid eye movement behavior disorder in drug-naïve patients with Parkinson’s disease. J Clin Neurosci. 2019;59:254–258. doi:10.1016/j.jocn.2018.07.007
25. Long K, Wan C, Xiang Y, et al. Study on the clinical features of Parkinson’s disease with probable rapid eye movement sleep behavior disorder. Front Neurol. 2020;11:11. doi:10.3389/fneur.2020.00979
26. Horsager J, Andersen KB, Knudsen K, et al. Brain-first versus body-first Parkinson’s disease: a multimodal imaging case-control study. Brain. 2020;143(10):3077–3088. doi:10.1093/brain/awaa238
27. Concha-Marambio L, Weber S, Farris CM, et al. Accurate detection of α-synuclein seeds in cerebrospinal fluid from isolated rapid eye movement sleep behavior disorder and patients with Parkinson’s disease in the DeNovo parkinson (DeNoPa) cohort. Mov Disord. 2023;38(4):567–578. doi:10.1002/mds.29329
28. Leng B, Sun H, Li M, et al. Blood neuroexosomal excitatory amino acid transporter-2 is associated with cognitive decline in Parkinson’s disease with RBD. Front Aging Neurosci. 2022:14. doi:10.3389/fnagi.2022.952368
29. Jiang C, Fu Y, Liu G, Shu B, Davis J, Tofaris GK. Multiplexed profiling of extracellular vesicles for biomarker development. Nano Micro Lett. 2021;14(1):3. doi:10.1007/s40820-021-00753-w
30. van NielG, D’Angelo G, Raposo G, van Niel G. Shedding light on the cell biology of extracellular vesicles. Nat Rev Mol Cell Biol. 2018;19(4):213–228. doi:10.1038/nrm.2017.125
31. Jiang C, Hopfner F, Hu MT, et al. Validation of α-synuclein in L1CAM-immunocaptured exosomes as a biomarker for the stratification of parkinsonian syndromes. Mov Disord. 2021;36(11):2663–2669. doi:10.1002/mds.28591
32. Del Bravo-Miana RC, Arizaga-Echebarria JK, Otaegui D. Central nervous system-derived extracellular vesicles: the next generation of neural circulating biomarkers? Transl Neurodegener. 2024;13(1):32. doi:10.1186/s40035-024-00418-9
33. Lim CZJ, Zhang Y, Chen Y, et al. Subtyping of circulating exosome-bound amyloid β reflects brain plaque deposition. Nat Commun. 2019;10(1):1144. doi:10.1038/s41467-019-09030-2
34. Yan S, Zhang W, Li X, et al. Single extracellular vesicle detection assay identifies membrane-associated α-synuclein as an early-stage biomarker in Parkinson’s disease. Cell Rep Med. 2025;6(3):101999. doi:10.1016/j.xcrm.2025.101999
35. Vacchi E, Burrello J, Di Silvestre D, et al. Immune profiling of plasma-derived extracellular vesicles identifies Parkinson disease. Neurol Neuroimmunol Neuroinflammation. 2020;7(6):e866. doi:10.1212/NXI.0000000000000866
36. Chung CC, Chan L, Chen JH, Hung YC, Hong CT. Plasma extracellular vesicle α-synuclein level in patients with Parkinson’s disease. Biomolecules. 2021;11(5):744. doi:10.3390/biom11050744
37. Carney RP, Mizenko RR, Bozkurt BT, et al. Harnessing extracellular vesicle heterogeneity for diagnostic and therapeutic applications. Nat Nanotechnol. 2025;20(1):14–25. doi:10.1038/s41565-024-01774-3
38. Chan L, Chung CC, Yu RC, Hong CT. Cytokine profiles of plasma extracellular vesicles as progression biomarkers in Parkinson’s disease. Aging. 2023;15(5):1603–1614. doi:10.18632/aging.204575
39. Hornung S, Dutta S, Bitan G. CNS-derived blood exosomes as a promising source of biomarkers: opportunities and challenges. Front Mol Neurosci. 2020;13. doi:10.3389/fnmol.2020.00038
40. Dutta S, Hornung S, Kruayatidee A, et al. α-synuclein in blood exosomes immunoprecipitated using neuronal and oligodendroglial markers distinguishes Parkinson’s disease from multiple system atrophy. Acta Neuropathol. 2021;142(3):495–511. doi:10.1007/s00401-021-02324-0
41. Jiang C, Hopfner F, Katsikoudi A, et al. Serum neuronal exosomes predict and differentiate Parkinson’s disease from atypical parkinsonism. J Neurol Neurosurg Psychiatry. 2020;91(7):720–729. doi:10.1136/jnnp-2019-322588
42. Sharafeldin M, Yan S, Jiang C, Tofaris GK, Davis JJ. Alternating magnetic field-promoted nanoparticle mixing: the on-chip immunocapture of serum neuronal exosomes for Parkinson’s disease diagnostics. Anal Chem. 2023;95(20):7906–7913. doi:10.1021/acs.analchem.3c00357
43. Zhang W, Zhang T, Ding J, et al. The PRIDE system: a photo-responsive platform for high-efficiency isolation of extracellular vesicles for Parkinson’s disease diagnostics. Chem Eng J. 2025;521:167006. doi:10.1016/j.cej.2025.167006
44. Zhao A, Li Y, Niu M, et al. SNCA hypomethylation in rapid eye movement sleep behavior disorder is a potential biomarker for Parkinson’s disease. J Parkinson’s Dis. 2020;10(3):1023–1031. doi:10.3233/JPD-201912
45. de NataleER, Wilson H, Politis M, de Natale ER. Predictors of RBD progression and conversion to synucleinopathies. Curr Neurol Neurosci Rep. 2022;22(2):93–104. doi:10.1007/s11910-022-01171-0
46. Lu Y, Liu Y, Liu C, et al. Digital dual-dimensional α-synuclein aggregate decoding sensor for Parkinson’s disease diagnostics. Adv Funct Mater. 2025:e19715. doi:10.1002/adfm.202519715
47. Feng X, Wang S, Liu Q, et al. Selecting multiple biomarker subsets with similarly effective binary classification performances. J Visualized Exp. 2018;(140):57738. doi:10.3791/57738
48. Yang R, He C, Rong S, et al. PANDA study: subtyping of Parkinson’s disease – cohort study protocol. BMJ Open. 2025;15(7):e102417. doi:10.1136/bmjopen-2025-102417
49. Zhou C, Wang L, Cheng W, et al. Two distinct trajectories of clinical and neurodegeneration events in Parkinson’s disease. Npj Parkinson’s Dis. 2023;9(1):111. doi:10.1038/s41531-023-00556-3
50. Yan S, Jiang C, Janzen A, et al. Neuronally derived extracellular vesicle α-synuclein as a serum biomarker for individuals at risk of developing Parkinson disease. JAMA Neurol. 2023. doi:10.1001/jamaneurol.2023.4398
51. Xylaki M, Chopra A, Kyriachenko Y, et al. Proteomic exploration of L1CAM+-extracellular vesicles from plasma of manifest and prodromal Parkinson’s disease. Int J Mol Sci. 2025;26(23):11564. doi:10.3390/ijms262311564
52. Yan S, Jiang C, Davis JJ, Tofaris GK. Methodological considerations in neuronal extracellular vesicle isolation for α-synuclein biomarkers. Brain. 2023;146(11):e95–e97. doi:10.1093/brain/awad169
 © 2026 The Author(s). This work is published and licensed by Dove Medical Press Limited. The
full terms of this license are available at https://www.dovepress.com/terms
and incorporate the Creative Commons Attribution
- Non Commercial (unported, 4.0) License.
By accessing the work you hereby accept the Terms. Non-commercial uses of the work are permitted
without any further permission from Dove Medical Press Limited, provided the work is properly
attributed. For permission for commercial use of this work, please see paragraphs 4.2 and 5 of our Terms.
© 2026 The Author(s). This work is published and licensed by Dove Medical Press Limited. The
full terms of this license are available at https://www.dovepress.com/terms
and incorporate the Creative Commons Attribution
- Non Commercial (unported, 4.0) License.
By accessing the work you hereby accept the Terms. Non-commercial uses of the work are permitted
without any further permission from Dove Medical Press Limited, provided the work is properly
attributed. For permission for commercial use of this work, please see paragraphs 4.2 and 5 of our Terms.
Recommended articles

Towards Personalized Medicine in Psoriasis: Current Progress
Camela E, Potestio L, Ruggiero A, Ocampo-Garza SS, Fabbrocini G, Megna M
Psoriasis: Targets and Therapy 2022, 12:231-250
Published Date: 1 September 2022
Awareness and Predictors of the Use of Bioinformatics in Genome Research in Saudi Arabia
Alomair L, Abolfotouh MA
International Journal of General Medicine 2023, 16:3413-3425
Published Date: 11 August 2023
Towards Personalized Medicine in Rheumatoid Arthritis
Sharma SD, Bluett J
Open Access Rheumatology: Research and Reviews 2024, 16:89-114
Published Date: 18 May 2024
Updates on Parkinson’s Disease
Bai H, Ma W, Zhu L, Lu Y, Fan J, Chen M, Huang C
Neuropsychiatric Disease and Treatment 2025, 21:1945-1953
Published Date: 4 September 2025
Precision Medicine in Asthma: The Role of Biomarkers
Quek E, Horn N, Siddiqui S
ImmunoTargets and Therapy 2025, 14:1479-1513
Published Date: 28 December 2025