Back to Journals » Diabetes, Metabolic Syndrome and Obesity » Volume 19
Diabetes-Related Alterations in Vectorcardiographic Repolarization Geometry: Insights from Physiological and Machine-Learning Analysis
Received 10 December 2025
Accepted for publication 20 April 2026
Published 13 May 2026 Volume 2026:19 586572
DOI https://doi.org/10.2147/DMSO.S586572
Checked for plagiarism Yes
Review by Single anonymous peer review
Peer reviewer comments 2
Editor who approved publication: Dr Rebecca Baqiyyah Conway
Qiong Lv,1 Huashan Zhao2
1Department of Electrocardiogram, The First Affiliated Hospital, and College of Clinical Medicine of Henan University of Science and Technology, Luoyang, Henan, 471003, People’s Republic of China; 2Department of General Medicine, The First Affiliated Hospital, and College of Clinical Medicine of Henan University of Science and Technology, Luoyang, Henan, 471003, People’s Republic of China
Correspondence: Qiong Lv, Email [email protected]
Background: Diabetes is associated with alterations in cardiac electrophysiology, yet the extent to which metabolic dysfunction influences spatial ventricular repolarization geometry remains unclear. Vectorcardiographic (VCG) analysis provides a spatial representation of cardiac electrical activity and may reveal subtle electrophysiological changes associated with metabolic disease.
Methods: This study analyzed VCG features in 200 adults to characterize the relationship between diabetes and depolarization–repolarization dynamics. Spatial parameters including QRS–T angle, T-wave and QRS magnitudes, loop morphology indices, and interval-based features were extracted from reconstructed orthogonal leads derived from standard electrocardiograms. Associations between clinical variables and VCG parameters were evaluated using Pearson correlation analysis and principal component analysis. A Random Forest classifier was used to assess whether VCG features capture metabolic influences, with model performance evaluated on a holdout dataset. Permutation testing assessed statistical significance, and SHAP (Shapley Additive Explanations) analysis was used to quantify feature contributions to model predictions.
Results: The Random Forest classifier demonstrated moderate discrimination between participants with and without diabetes (ROC AUC = 0.878; PR AUC = 0.631) with acceptable calibration (Brier score = 0.127), and statistical significance confirmed by permutation testing (p = 0.010). SHAP analysis identified spatial QRS–T angle as the most influential predictor, followed by T-wave magnitude, systolic blood pressure, T-loop area, and body mass index. Repolarization-related VCG features consistently contributed the greatest influence on model predictions.
Conclusion: Diabetes is associated with measurable alterations in ventricular repolarization geometry, with spatial QRS–T angle and related VCG parameters emerging as key electrophysiological signatures. These findings suggest that metabolic dysregulation contributes to early electrical remodeling and highlight vectorcardiographic phenotyping as a potential noninvasive approach for investigating cardiometabolic influences on myocardial electrical function.
Keywords: vectorcardiography, QRS–T angle, diabetes, machine learning, SHAP, depolarization–repolarization coupling
A Letter to the Editor has been published for this article.
Introduction
Electrocardiography (ECG) is the standard noninvasive tool for assessing cardiac electrical activity and provides essential information on myocardial depolarization and repolarization.1,2 Traditional ECG measurements such as QRS duration, QT interval, and segment amplitudes are widely used in clinical practice, yet they capture only a portion of the heart’s electrical behavior.3,4 Vectorcardiography (VCG) extends ECG analysis by reconstructing the three-dimensional orientation and magnitude of cardiac electrical forces, offering a more physiologically intuitive representation of ventricular activation and recovery.5,6 Through quantification of loop morphology and spatial electrical axes, VCG provides additional geometric information that is not readily visible in scalar ECG leads.7 Because VCG captures the spatial geometry of ventricular depolarization and repolarization, it offers the potential to detect subtle electrophysiological remodeling that may not be apparent on conventional ECG measurements.8 This capability may be particularly relevant in cardiometabolic disorders, where diffuse structural and autonomic changes alter ventricular recovery patterns before overt electrical abnormalities become clinically evident.9
Among VCG-derived parameters, the spatial QRS-T angle is one of the most robust markers of electrical heterogeneity and has been associated with arrhythmic events, cardiovascular mortality, and sudden cardiac death.10–12 A wider QRS-T angle reflects greater discordance between depolarization and repolarization pathways and is linked to structural remodeling, ischemia, inflammation, and metabolic stress.13–15 VCG parameters reflecting repolarization geometry including spatial QRS–T angle, T-vector magnitude, and T-loop morphology have been proposed as sensitive indicators of electrophysiological heterogeneity and ventricular recovery dynamics.8,16 Previous studies have also reported that sex, age, and cardiovascular risk factors influence VCG measurements, although the magnitude and physiological meaning of these associations remain incompletely understood.17–20 Age-related myocardial structural changes, sex-related differences in cardiac size and hormonal influences, and variations in autonomic regulation are known to modify ventricular conduction and repolarization patterns, potentially influencing vectorcardiographic geometry.21–24 Metabolic disorders, particularly diabetes mellitus, exert significant effects on cardiac electrophysiology. Diabetes is associated with autonomic imbalance, myocardial fibrosis, and repolarization abnormalities, all of which may contribute to widening of the QRS-T angle and alterations in T-wave morphology.25–27 These mechanisms may influence vectorcardiographic features by altering the spatial alignment between depolarization and repolarization vectors, leading to widening of the QRS–T angle, changes in T-vector magnitude, and modifications in loop morphology.16,28 However, the combined influence of metabolic dysfunction and demographic characteristics on the spatial geometry of ventricular electrical activity remains poorly characterized. Despite these observations, the broader pattern of VCG changes associated with diabetes in relation to demographic factors such as age and sex has not been systematically assessed. In particular, it is unclear which VCG features best capture metabolic alterations in repolarization geometry and how these features relate to clinical variables such as blood pressure and body mass index.29–31
The present study aimed to characterize how demographic factors (age and sex) and metabolic status (diabetes) relate to detailed vectorcardiographic geometry in adults. Using principal component analysis, correlation structure mapping, and an interpretable machine learning model, we evaluated the contribution of individual VCG features and clinical variables to repolarization and depolarization patterns. A secondary aim was to identify the VCG features that most strongly differentiate individuals with diabetes, providing physiologic insight into the electrical phenotype associated with metabolic dysfunction. This integrated analytical approach seeks to clarify how metabolic health shapes cardiac vector geometry and to support the development of physiologically informed, vector-based biomarkers for clinical research.
Methods
Study Design and Population
This cross-sectional study analyzed vectorcardiographic (VCG) features derived from standard 12-lead ECG recordings in 200 adult participants (111 males and 89 females; 52 with diabetes and 148 without diabetes). Comorbidities, including diabetes and hypertension, were confirmed using contemporaneous clinical records and medication history. Participants with prior myocardial infarction, bundle branch block, pacemaker rhythm, or documented severe arrhythmias were excluded. Lipid profiles and medication data were variably available and were therefore not included in the analysis. All participants were required to have high-quality digital ECGs and complete demographic information.
ECG Acquisition and Vectorcardiographic Reconstruction
Standard 12-lead ECGs were obtained using the Mindray BeneHeart R12 digital system at a sampling rate of 500 Hz over 10-second recordings. ECG data were exported in XML format and processed in Python for signal transformation and feature extraction. VCG signals were reconstructed using the inverse Dower transformation to generate orthogonal X, Y, and Z leads. Prior to transformation, signals were band-pass filtered (0.5–150 Hz) to preserve orthogonality; repeating the filter after transformation resulted in <1.5° deviation in spatial QRS-T angle, indicating negligible impact. From the orthogonal leads, the following VCG variables were computed: i) QRS-vector magnitude: peak three-dimensional Euclidean norm during depolarization, ii) T-vector magnitude: peak Euclidean norm during repolarization, iii) Spatial QRS-T angle: three-dimensional angle between mean QRS and T vectors, calculated using the peak-vector method, iv) QRS-loop and T-loop areas: spatial loop areas representing geometric dispersion of depolarization and repolarization and, v) Loop morphology: categorized as compact/symmetric or distorted based on smoothness, lobe count, and rotational continuity. Loop morphology (compact vs distorted) was assessed descriptively but was not incorporated into statistical or machine learning models and is presented only for qualitative context. VCG-based normal or abnormal patterns were determined from loop morphology and spatial QRS-T angle (<75° vs ≥75°). Two independent observers reviewed all VCGs with consensus adjudication (κ = 0.92). Continuous QRS-T angle values were used for physiologic analysis but not as predictors in machine learning models. All extracted scalar features were standardized using z-score transformation.
Clinical Variables
Demographic and clinical variables included age, sex, diabetes status, heart rate (HR), systolic blood pressure (SBP), and diastolic blood pressure (DBP). Diabetes was defined by fasting glucose ≥126 mg/dL or use of antidiabetic medication. Heart rate and blood pressure values corresponded to measurements acquired during the same clinical encounter as the ECG. Categorical variables were encoded as binary indicators.
Data Preprocessing
Data completeness exceeded 98%, and missing values were imputed using feature-specific means. Outliers were winsorized at the 1st and 99th percentiles to reduce disproportionate influence on multivariate analyses. Continuous variables were standardized prior to PCA, correlation analysis, and machine learning. The final cleaned dataset contained 200 participants with complete VCG and clinical data.
Statistical and Multivariate Analysis
All analyses were performed using Python 3.12.12 with NumPy 2.0.2, Pandas 2.2.2, SciPy 1.16.3, Statsmodels 0.14.5, Scikit-learn 1.6.1, Matplotlib 3.10.0, Seaborn 0.13.2 and SHAP 0.50.0. QT intervals were corrected for heart rate using Fridericia’s formula (QTc = QT/RR1ᐟ3) to minimize rate-related bias in repolarization assessment and ensure consistency across participants. A fixed random seed (np.random.seed(42)) was used for reproducibility. Continuous variables were expressed as mean ± standard deviation (SD), and categorical variables as frequencies (%). Group comparisons were performed using independent-sample t-tests for continuous variables and χ2-tests for categorical variables. Correlations between VCG and clinical parameters were calculated using Pearson’s r.
Principal Component and Correlation Structure
Principal component analysis (PCA) was performed on standardized VCG features to identify major axes of electrophysiological variability. The first five principal components were used to characterize variance structure, and the first two components were visualized to illustrate participant distribution in reduced-dimensional space. Pearson correlation coefficients were computed to examine associations between VCG variables and clinical measures, and results were rendered as a clustered heatmap to highlight physiologically coherent variable groupings.
Machine Learning Classification and Validation
A Random Forest classifier was trained to identify diabetes status using VCG features and clinical variables (age, sex, BMI, HR, SBP, DBP, QRS loop area, T loop area, QRS magnitude, T magnitude, QRS interval, QT interval, and PR interval). The dataset was partitioned using five-fold cross-validation. Class weights were balanced within each fold. Model performance was quantified using the area under the receiver operating characteristic curve (ROC-AUC) and area under the precision-recall curve (PR-AUC).
Model calibration was assessed using reliability curves and the Brier score. A permutation test with 100 label permutations was used to evaluate whether classifier performance exceeded that expected by chance. Feature contributions were quantified using SHAP (Shapley Additive Explanations) values, which provided global and local interpretability of model predictions.
Visualization
All figures were generated using Python libraries. Figure 1 illustrates demographic and clinical distributions. Figures 2 and 3 presents PCA results, including the scree plot and participant scores. Figures 4 and 5 shows ROC and PR curves. Figure 6 displays the clustered correlation heatmap while Figure 7 shows SHAP explainability plot. Supplementary Figures 1–4 contain calibration curves, permutation testing results and SHAP interaction values.
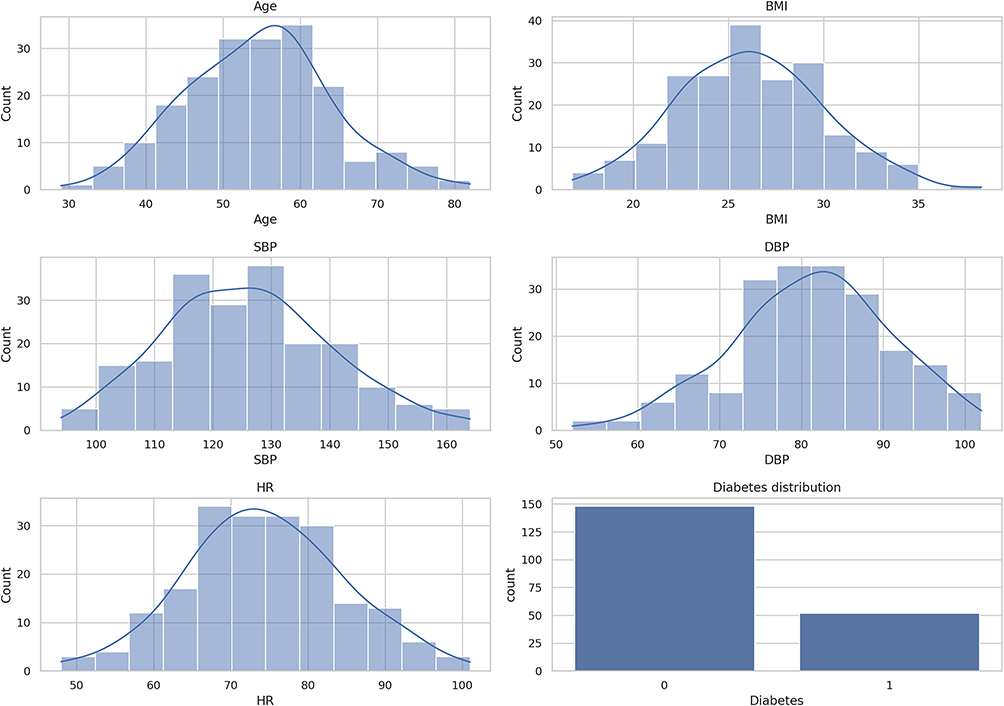 |
Figure 1 Distribution of demographic and clinical variables in the study cohort. Histograms with overlaid density curves illustrate the distributions of age, BMI, systolic blood pressure (SBP), diastolic blood pressure (DBP), and heart rate (HR) among all participants. The diabetes panel shows the proportion of individuals with and without diabetes. Together, these plots summarize the baseline characteristics of the study population prior to vectorcardiographic and machine-learning analyses. |
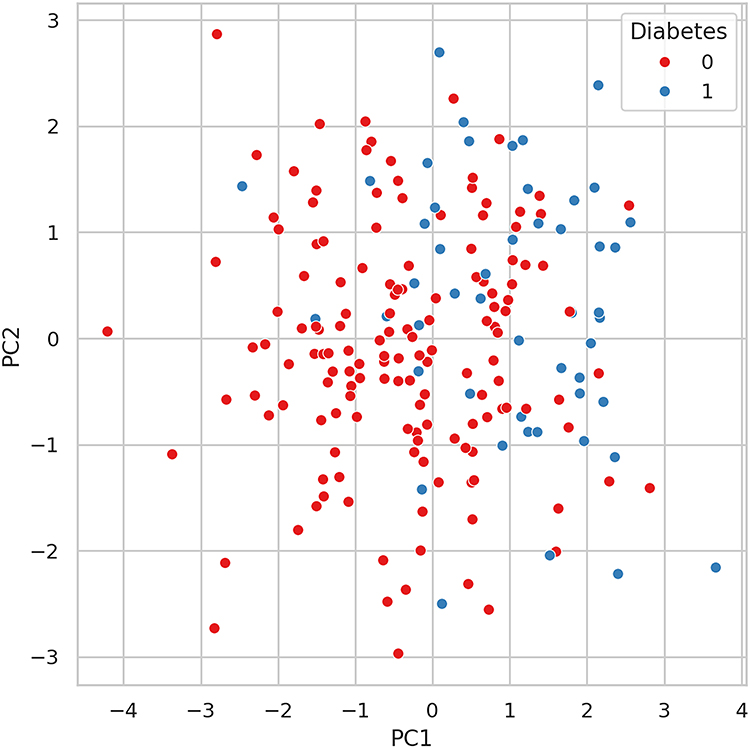 |
Figure 2 Principal component scatter plot of vectorcardiographic features by diabetes status. Scatter plot showing participants projected onto the first two principal components (PC1 and PC2), derived from 14 vectorcardiographic measurements. Each point represents one participant, colored according to diabetes status. The distribution illustrates overall variability in VCG feature space and shows substantial overlap between diabetes and non-diabetes groups. |
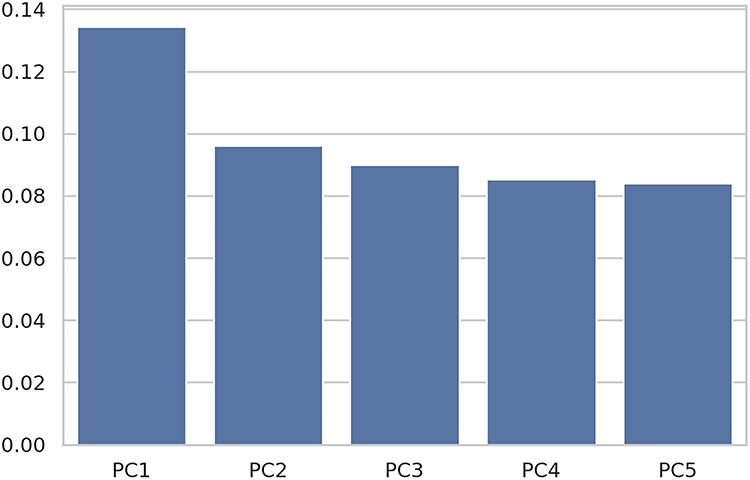 |
Figure 3 Scree plot showing variance explained by the first five principal components. Bar plot depicting the proportion of total variance explained by the first five principal components derived from the vectorcardiographic feature set. PC1 explains the largest share of variance, followed by smaller but comparable contributions from PC2 through PC5. The pattern indicates that no single component dominates the feature structure. |
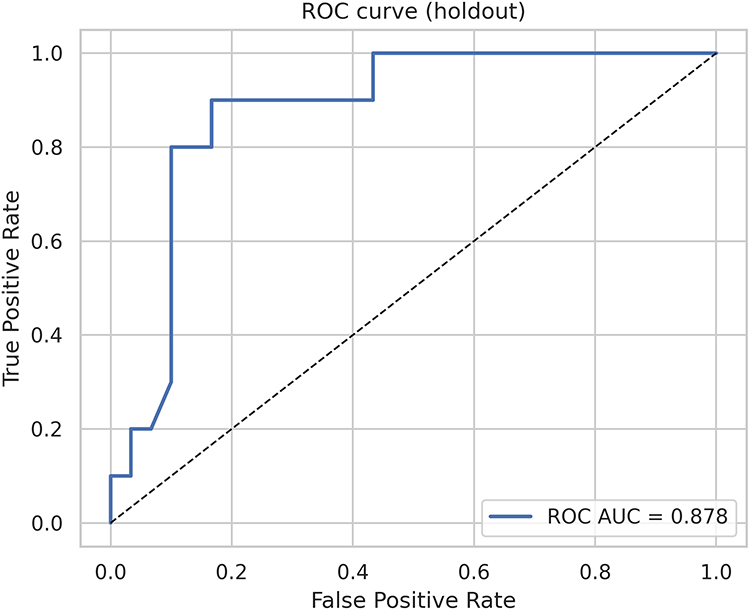 |
Figure 4 Receiver operating characteristic (ROC) curve for the holdout dataset. ROC curve showing the classifier’s performance in the independent holdout set. The area under the ROC curve (AUC = 0.878) reflects strong discrimination between participants with and without diabetes. The dashed diagonal line represents the performance of a non-informative classifier. |
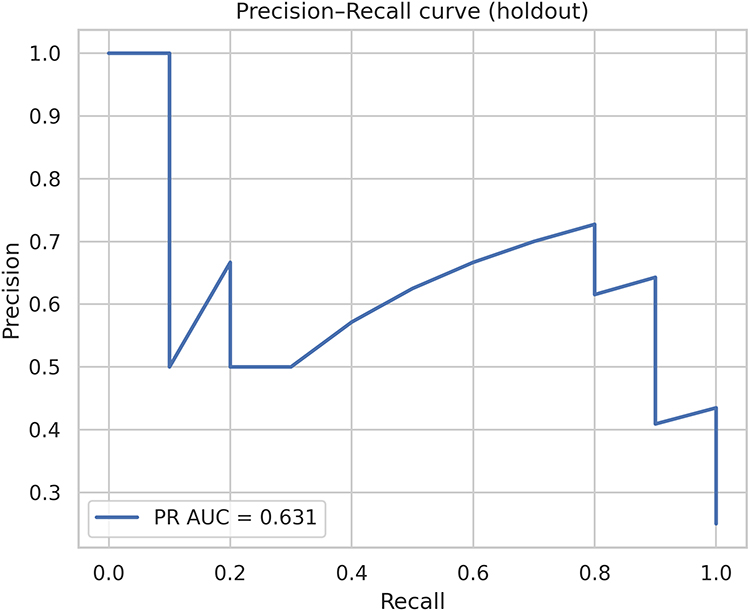 |
Figure 5 Precision-Recall (PR) curve for the holdout dataset. Precision-Recall curve evaluating classifier performance on the independent holdout set. The area under the PR curve (PR AUC = 0.631) reflects performance under class imbalance and indicates moderate precision across varying recall thresholds. This metric complements ROC-based assessment by emphasizing behavior on the positive (diabetes) class. |
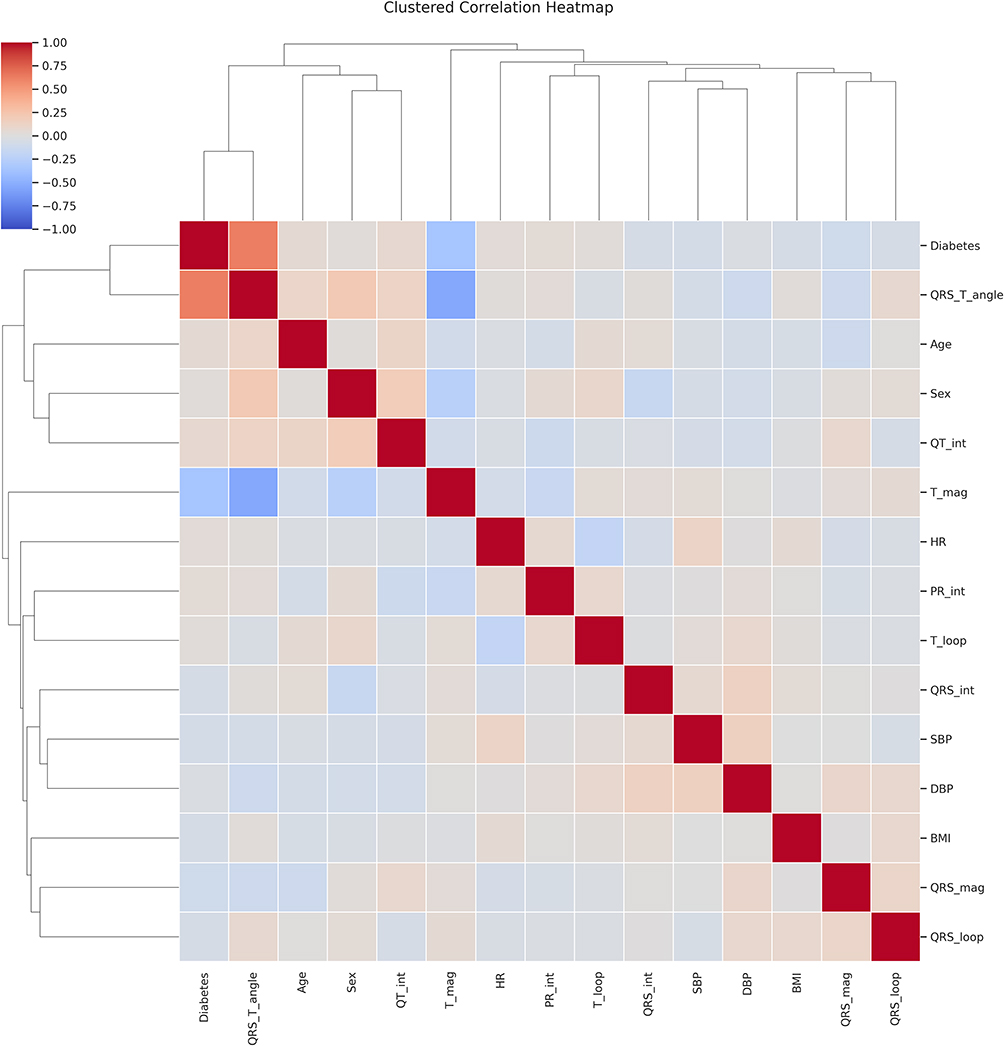 |
Figure 6 Clustered correlation heatmap of clinical and vectorcardiographic variables. Hierarchically clustered correlation matrix showing relationships among clinical variables (age, sex, BMI, blood pressure, heart rate) and vectorcardiographic (VCG) features, including QRS-T angle, loop morphology, and vector magnitudes. Positive correlations are shown in red and negative correlations in blue, with clustering dendrograms highlighting groups of variables with similar correlation patterns. The heatmap summarizes the interdependence of VCG and clinical measures within the study cohort. |
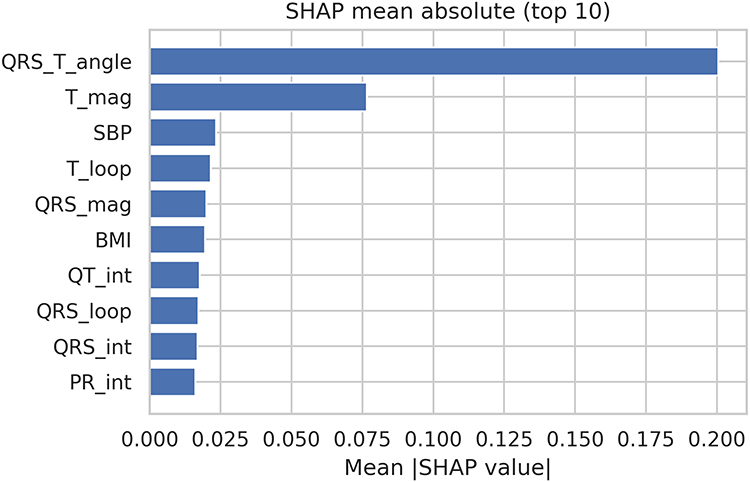 |
Figure 7 SHAP feature importance for the diabetes classification model. Bar plot showing the ten most influential predictors contributing to the Random Forest model, ranked by mean absolute SHAP values. The spatial QRS–T angle was the strongest contributor to model predictions, followed by T-wave magnitude and systolic blood pressure (SBP). Additional vectorcardiographic features including T-loop area, QRS magnitude, QT interval, PR interval, QRS-loop area, and QRS duration also contributed to classification performance, alongside BMI. Higher mean absolute SHAP values indicate greater influence on the model’s predicted probability of diabetes. |
Results
Demographic and Clinical Characteristics
The study included 200 adults, of whom 52 had diabetes. Figure 1 presents the distributions of age, body mass index (BMI), systolic and diastolic blood pressure (SBP, DBP), and heart rate (HR). BMI distribution is relevant because BMI showed modest correlations with the QRS-T angle and contributed to model performance (SHAP ranking). The cohort demonstrated broad variability across metabolic and hemodynamic variables, with no major skewness or clustering patterns. Diabetes prevalence was approximately 26% of the study population. Age and sex distributions were similar across the dataset, supporting balanced representation of demographic subgroups. Age and sex associations with VCG parameters were also quantified. Males exhibited larger QRS- and T-vector magnitudes (mean difference ≈ 0.13–0.18 mV), while older participants demonstrated greater dispersion in loop orientation, reflected in higher QRS- and T-loop area variance. In contrast, these demographic factors showed minimal influence on spatial QRS-T angle compared with diabetes. The demographics data is presented in Table 1.
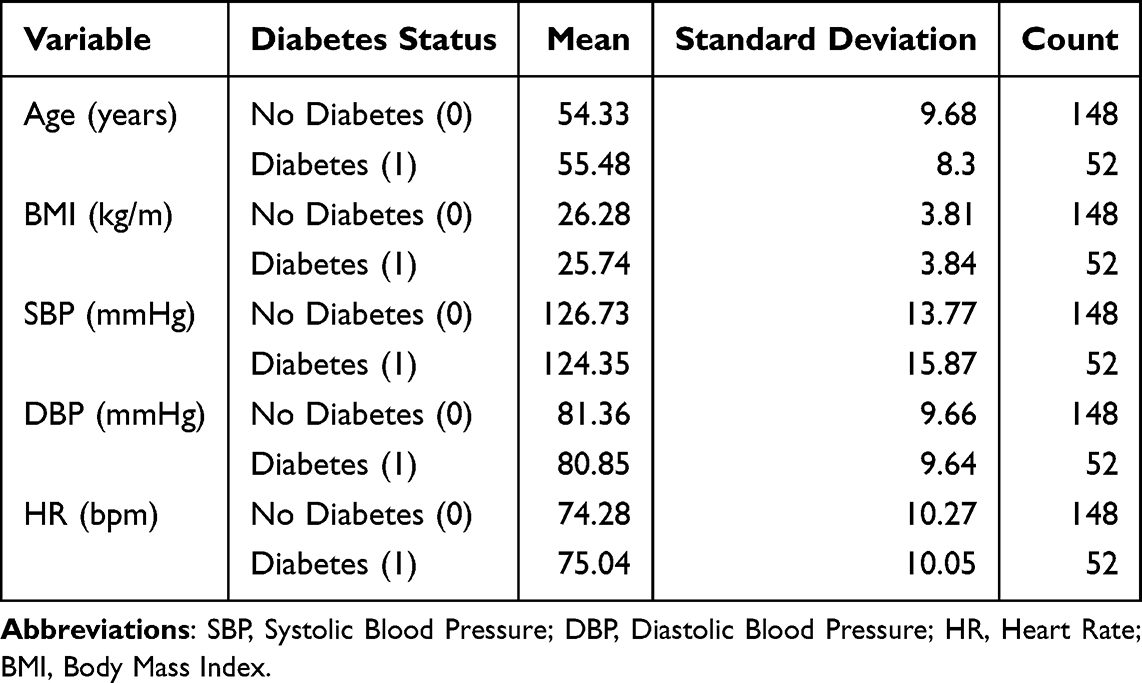 |
Table 1 Demographics by Diabetes Status |
Principal Component Analysis of Vectorcardiographic Features
Principal component analysis (PCA) on standardized VCG features revealed that repolarization-related measurements accounted for a substantial portion of total variance (Figures 2 and 3). PC1 was primarily influenced by T-wave magnitude and T-loop area, while PC2 reflected variation in depolarization-repolarization alignment and loop dispersion. Participants with diabetes tended to occupy regions of the PCA space associated with altered repolarization geometry, although without forming discrete clusters. The scree plot (Figure 3) showed that the first two components captured the largest share of VCG variability. PC1 and PC2 loadings are provided in Supplementary Table 1, confirming that T-magnitude and T-loop area were the dominant contributors to PC1, while QRS-loop area and repolarization directionality contributed to PC2. Because the principal components represent weighted combinations of the original variables, variation along PC1 primarily reflects differences in repolarization-related VCG features, whereas PC2 captures broader electrophysiological variability. The PCA projection was therefore used to visualize the variance structure of the VCG feature space rather than to identify discrete clustering between diabetes and non-diabetes groups.
PCA was used to visualize the variance structure of the vectorcardiographic feature space rather than to demonstrate group separation. Examination of the component loadings indicated that repolarization-related variables contributed substantially to the principal components, highlighting the importance of repolarization geometry in overall VCG variability.
Machine Learning Model Performance
A Random Forest classifier trained to identify diabetes using clinical and VCG features showed moderate discriminative performance. In the independent holdout set, the model achieved a ROC AUC of 0.878 (Figure 4) and a PR AUC of 0.631 (Figure 5). These values indicate that VCG- and clinical variable-based features provide meaningful, although not definitive, information for diabetes classification. Model calibration demonstrated close agreement between predicted and observed probabilities, with a Brier score of 0.127 (Supplementary Figure 1). Comparison of uncalibrated and Platt-scaled calibration curves showed minimal differences (Supplementary Figure 2). Detailed cross-validated performance metrics are provided in Supplementary Table 2. A 100-permutation test confirmed that classifier performance exceeded what would be expected by chance: the permutation distribution centered near an AUC of 0.50, while the observed AUC of 0.861 lay far outside the null range (p = 0.010; Supplementary Figure 3). Complete permutation statistics are summarized in Supplementary Table 3.
Correlation Structure of Clinical and Vectorcardiographic Variables
Pearson correlation coefficients among clinical and VCG parameters are shown in Figure 6. The numerical correlation matrix corresponding to Figure 6 is available in Supplementary Table 4. Several physiologically patterns of weak-to-moderate correlation were observed. Most correlations were small (r < 0.20), indicating subtle rather than strong linear relationships. Diabetes status showed modest correlations with several vectorcardiographic parameters, including a positive association with spatial QRS–T angle and an inverse association with T-vector magnitude, consistent with the broader repolarization alterations observed in individuals with diabetes. The spatial QRS-T angle correlated positively, although modestly, with BMI and SBP. T-loop area and T-magnitude demonstrated inverse associations with heart rate, consistent with rate-dependent repolarization dynamics. QRS- and T-loop variables formed a distinct electrophysiological cluster, while clinical variables grouped separately, indicating complementary rather than redundant information. These relationships support an integrated physiological influence of metabolic and hemodynamic factors on vectorcardiographic geometry.
Model Explainability Using SHAP Values
SHAP analysis identified repolarization-related VCG markers as the strongest contributors to the diabetes classification model. The spatial QRS–T angle showed the highest mean absolute SHAP value, followed by T-wave magnitude, systolic blood pressure (SBP), and T-loop area, with additional contributions from QRS magnitude, BMI, and interval-based ECG metrics (Figure 7). SHAP interaction values (Supplementary Figure 4) demonstrated minimal interaction between age and sex, supporting their largely independent contributions. Overall, SHAP results indicate that altered repolarization geometry forms the primary VCG signature associated with diabetes in this cohort. The full permutation importance rankings and top 20 subset are presented in Supplementary Tables 5 and 6. Also mean absolute SHAP values are presented in Supplementary Table 7. These findings are consistent with the PCA and correlation analyses, which also highlighted repolarization-related features.
Summary of Physiological Findings
Across PCA, correlation mapping, and explainability analyses, diabetes was consistently associated with VCG markers indicative of repolarization alteration. Participants with diabetes demonstrated larger spatial QRS-T angles and greater dispersion of repolarization vectors, while age showed a more modest association with loop rotational variability. Sex differences were primarily amplitude-related, with males exhibiting larger QRS and T magnitudes. These findings demonstrate that metabolic status, especially diabetes, is an important modulator of cardiac vectorcardiographic geometry. Repolarization abnormalities emerged as the dominant electrophysiological feature associated with metabolic dysfunction, whereas demographic factors exerted subtler influences. The loading coefficients for PC1-PC5 are provided in Supplementary Table 1. The cleaned dataset used for all analyses is also provided as Supplementary Table 8.
Discussion
This study examined how demographic and metabolic factors relate to vectorcardiographic geometry using an integrated approach combining descriptive statistics, principal component analysis, correlation mapping, and an interpretable machine learning model. Across these methods, repolarization-related vectorcardiographic features emerged as the strongest indicators of metabolic status, particularly diabetes. These findings demonstrate that subtle modulation of cardiac electrical geometry is detectable using conventional 12-lead ECG derived VCG and that metabolic influences are primarily reflected in repolarization rather than depolarization measurements. These observations directly address the study objective of characterizing how demographic and metabolic factors shape vectorcardiographic geometry and demonstrate that repolarization-related VCG features capture physiologically meaningful aspects of metabolic status.
Diabetes showed the most consistent association with altered VCG morphology. Repolarization-related variables such as T-wave magnitude, T-loop area, and spatial QRS-T angle contributed strongly to the principal components, suggesting that variation in repolarization geometry is an important contributor to overall VCG variability. Importantly, the machine learning and SHAP analyses provided stronger quantitative evidence linking diabetes to repolarization-related VCG features. In particular, features reflecting repolarization geometry such as T-wave magnitude, T-loop area, and spatial QRS-T angle emerged consistently across multiple analytical approaches, suggesting that these parameters provide sensitive indicators of metabolic influences on ventricular electrical recovery. These observations align with prior reports that diabetes is associated with prolongation and increased dispersion of repolarization32 and that widened QRS-T angles correlate with metabolic stress, impaired autonomic regulation, and higher cardiac risk.15,33 Although our analysis is observational, these repolarization abnormalities are consistent with known mechanisms including reduced repolarizing potassium currents, impaired calcium cycling, and diffuse myocardial fibrosis in diabetes.34,35
The correlation matrix supported a physiologically coherent structure. Repolarization features such as T-loop area and T-magnitude showed modest inverse associations with heart rate, consistent with rate-dependent modulation of action potential duration. Spatial QRS-T angle demonstrated small but persistent correlations with BMI and systolic blood pressure, suggesting a contribution from metabolic loading and low-grade hemodynamic stress. These relationships did not form strong univariate effects but showed coordinated patterns consistent with prior population studies linking metabolic health to repolarization geometry.33,36,37
Sex and age effects were present but more subtle. Males exhibited higher QRS and T-wave magnitudes, consistent with known differences in myocardial mass and thoracic impedance.38 Increasing age showed a tendency toward greater dispersion of spatial loop orientation, in line with evidence that conduction heterogeneity increases with myocardial aging and fibrosis.39,40 These demographic influences were smaller in magnitude than the metabolic effects but contribute to the variability of vectorcardiographic geometry observed in healthy and at-risk populations.
The machine learning model provided an additional perspective on the electrophysiologic signatures of diabetes. Using VCG and clinical features, the Random Forest classifier achieved a ROC AUC of 0.878 and a PR AUC of 0.631, indicating moderate discriminative capacity. The permutation testing confirmed that this performance was unlikely to arise from chance (p = 0.010). Calibration analysis further demonstrated close agreement between predicted and observed probabilities. SHAP interpretation revealed that T-wave magnitude, T-loop area, QRS magnitude, systolic blood pressure, and BMI were the most influential predictors, underscoring that metabolic status is reflected most strongly in repolarization geometry. Although repolarization features dominated model contributions, several additional VCG and interval-based predictors provided physiologic value. QRS-loop area and QRS magnitude capture depolarization dispersion and myocardial mass effects. QT and PR intervals reflect conduction timing and autonomic tone, which may vary across metabolic states. Although these features contributed less strongly than T-wave and loop-based measures, they form part of the broader electrical phenotype associated with diabetes. These findings emphasize interpretability rather than diagnostic application; the model is descriptive and hypothesis-generating, and its predictive performance should not be extrapolated to clinical decision making without prospective validation.
From a physiological standpoint, these results reinforce the relevance of repolarization geometry as a marker of metabolic and electrophysiological health. The spatial QRS-T angle, although not used as a predictor in the model, remained closely associated with the pattern of repolarization-related features captured by PCA and SHAP analyses. The QRS-T angle, although the strongest SHAP feature, should be interpreted physiologically and not as a diagnostic biomarker. This supports previous work identifying the QRS-T angle as an integrative measure of electrical heterogeneity and a potential marker of subclinical myocardial stress.41 For clinical research, these findings suggest that vectorcardiographic analysis may complement traditional ECG indices by identifying metabolic influences on repolarization that are not apparent in standard interval measurements.
Although diabetes emerged as the strongest metabolic contributor to repolarization geometry, age and sex also demonstrated physiologically meaningful associations. Sex differences in vector magnitudes likely reflect myocardial mass and thoracic impedance differences, while age-related increases in loop dispersion are consistent with conduction heterogeneity linked to myocardial aging. These effects were smaller than those of diabetes but reinforce the importance of demographic context in VCG interpretation.
Several limitations warrant consideration. The study was cross-sectional and cannot establish causal relationships between metabolic status and VCG geometry. The sample size was modest (n=200) and derived from a single center, limiting generalizability. Given the modest sample size and lack of external validation, the machine learning results should be interpreted as exploratory rather than diagnostic, and the model is not intended for clinical application. Participants with prior myocardial infarction were excluded, the presence of subclinical coronary artery disease could not be fully assessed and may contribute to electrophysiological variability. Lipid profiles, medication use, and autonomic indices were not available for all participants and may influence repolarization patterns. In addition, diabetes status was determined from contemporaneous clinical records and laboratory data; as with all retrospective chart-based definitions, some degree of misclassification cannot be entirely excluded, particularly given that certain antidiabetic medications may be prescribed for non-diabetic indications. Fasting status for glucose measurements relied on available clinical documentation and could not be independently verified in all cases. Data on diabetes duration and longitudinal glycemic burden were not consistently available and therefore could not be assessed. Finally, although quantitative vectorcardiographic features were algorithmically derived, qualitative loop morphology assessment required observer interpretation; while interobserver agreement was high, some subjectivity is inherent to this process. External validation in larger and more diverse cohorts is necessary to determine the reproducibility and clinical utility of the observed associations. VCG reconstruction was performed using the inverse Dower transform, which is known to underestimate absolute vector amplitudes and differs from Frank-lead recordings in spatial fidelity.42,43 While this does not materially affect angular measurements or geometric orientation,43 magnitude-based features such as T-vector amplitude and loop areas may be influenced by transformation matrix characteristics.42 Results should therefore be interpreted within the context of Dower-derived VCG rather than Frank-lead gold standards. Future work integrating VCG with cardiac imaging, metabolic biomarkers, and computational modeling could further elucidate the mechanistic pathways linking metabolic health and ventricular repolarization.
This study shows that diabetes, and to a lesser extent age and sex, is associated with distinct alterations in vectorcardiographic repolarization geometry. Repolarization-dominant VCG features, including T-magnitude and T-loop area, were the most informative markers of metabolic status. These findings highlight the potential value of incorporating vectorcardiographic analysis into physiological and metabolic research and suggest that repolarization geometry may serve as a sensitive indicator of early electrophysiological remodeling in individuals with metabolic dysfunction.
Conclusion
In this cross-sectional study of 200 adults, vectorcardiographic geometry showed clear associations with both demographic and metabolic factors. Sex-related differences were reflected primarily in vector magnitudes, with men exhibiting higher QRS and T-wave amplitudes, likely related to myocardial mass and thoracic conduction properties. Age was associated with greater dispersion of spatial loop orientation, consistent with increasing conduction heterogeneity and structural remodeling during myocardial aging. Diabetes demonstrated the strongest and most consistent relationship with vectorcardiographic patterns, particularly through widening of the spatial QRS–T angle and increased repolarization dispersion. These findings indicate that metabolic dysfunction alters the spatial organization of ventricular recovery even in the absence of overt structural heart disease. Across principal component analysis, correlation structure mapping, and interpretable machine learning, repolarization-dominant VCG features including T-wave magnitude, T-loop area, and spatial repolarization geometry emerged as the most informative markers of metabolic status. The machine learning model demonstrated moderate discriminative performance and highlighted several physiologically meaningful predictors, including T-wave magnitude, T-loop area, QRS magnitude, systolic blood pressure, and body mass index. These results suggest that vectorcardiographic phenotyping provides a physiologically informative framework for understanding how metabolic and demographic factors shape cardiac electrical geometry. By capturing spatial features of ventricular repolarization that are not fully represented in conventional ECG metrics, VCG analysis may offer a valuable noninvasive tool for investigating early electrophysiological remodeling associated with cardiometabolic dysfunction. Future multi-center and longitudinal studies are needed to validate these associations and determine how vectorcardiographic phenotyping may contribute to research on cardiometabolic cardiovascular risk and electrical remodeling.
Data Sharing Statement
The data supporting the findings of this study are available from the corresponding author upon reasonable request.
Ethics Approval and Consent to Participate
This study was approved by the Ethics Committee of The First Affiliated Hospital of Henan University of Science and Technology (Approval No. K-2024-B041, dated May 16, 2024). This study was conducted between 17th May 2024 and 15th May 2025 following institutional ethics approval. Written informed consent was obtained from all participants before inclusion. The study adhered to the principles of the Declaration of Helsinki and relevant national and institutional research guidelines.
Acknowledgments
The authors gratefully acknowledge the staff and participants of The First Affiliated Hospital of Henan University of Science and Technology for their cooperation and contribution to data collection. The authors also thank the developers of the open-source Python libraries (NumPy, Pandas, SciPy, Statsmodels, Scikit-learn, Matplotlib, Seaborn and SHAP) used for analysis and visualization.
Author Contributions
Qiong Lv: Conceptualization; Methodology; Data curation; Software; Formal analysis; Validation; Visualization; Investigation; Project administration; Supervision; Writing - original draft; Writing - review & editing. Huashan Zhao: Methodology; Resources; Data curation; Validation; Investigation; Writing - review & editing. All authors gave final approval of the version to be published; have agreed on the journal to which the article has been submitted; and agree to be accountable for all aspects of the work.
Funding
This research did not receive any specific grant from funding agencies in the public, commercial, or not-for-profit sectors.
Disclosure
The authors declare that they have no known competing financial interests or personal relationships that could have appeared to influence the work reported in this paper.
References
1. Yang H, Bukkapatnam ST, Komanduri R. Spatiotemporal representation of cardiac vectorcardiogram (VCG) signals. Biomed Eng Online. 2012;11(1):1–14. doi:10.1186/1475-925X-11-16
2. Le TQ, Chandra V, Afrin K, Srivatsa S, Bukkapatnam S. A dynamic systems approach for detecting and localizing of infarct-related artery in acute myocardial infarction using compressed paper-based electrocardiogram (ecg). Sensors. 2020;20:3975. doi:10.3390/s20143975
3. Ravelli F, Antolini R. Complex dynamics underlying the human electrocardiogram. Biol Cybern. 1992;67:57–65. doi:10.1007/BF00201802
4. Nayak SK, Bit A, Dey A, Mohapatra B, Pal K. A review on the nonlinear dynamical system analysis of electrocardiogram signal. J Healthc Eng. 2018;2018:6920420. doi:10.1155/2018/6920420
5. Yang H. Multiscale recurrence quantification analysis of spatial cardiac vectorcardiogram signals. IEEE Trans Biomed Eng. 2010;58:339–347. doi:10.1109/TBME.2010.2063704
6. Le TQ, Bukkapatnam ST, Sangasoongsong A, Komanduri R. Towards virtual instruments for cardiovascular healthcare: real-time modeling of cardiovascular dynamics using ECG signals. In:
7. Sedaghat G, Ghafoori E, Waks JW, et al. Quantitative assessment of vectorcardiographic loop morphology. J electrocardiol. 2016;49:154–163. doi:10.1016/j.jelectrocard.2015.12.014
8. Vondrak J, Penhaker M. Review of processing pathological vectorcardiographic records for the detection of heart disease. Front Physiol. 2022;13:856590. doi:10.3389/fphys.2022.856590
9. De la Garza-Salazar F, Egenriether B. Clinically interpretable electrovectorcardiographic machine learning criteria for the detection of echocardiographic left ventricular hypertrophy. PLoS One. 2025;20:e0334829. doi:10.1371/journal.pone.0334829
10. Man S, Maan AC, Schalij MJ, Swenne CA. Vectorcardiographic diagnostic & prognostic information derived from the 12-lead electrocardiogram: historical review and clinical perspective. J Electrocardiol. 2015;48:463–475. doi:10.1016/j.jelectrocard.2015.05.002
11. Zhao X, Zhang J, Gong Y, et al. Reliable detection of myocardial ischemia using machine learning based on temporal-spatial characteristics of electrocardiogram and vectorcardiogram. Front Physiol. 2022;13:854191. doi:10.3389/fphys.2022.854191
12. Sansone M, Fusco R, Pepino A, Sansone C. Electrocardiogram pattern recognition and analysis based on artificial neural networks and support vector machines: a review. J Healthc Eng. 2013;4:465–504. doi:10.1260/2040-2295.4.4.465
13. Kardys I, Kors JA, van der Meer IM, Hofman A, van der Kuip DA, Witteman JC. Spatial QRS-T angle predicts cardiac death in a general population. Eur Heart J. 2003;24:1357–1364. doi:10.1016/S0195-668X(03)00203-3
14. Fathieh F, Paak M, Khosousi A, et al. Predicting cardiac disease from interactions of simultaneously-acquired hemodynamic and cardiac signals. Comput Methods Programs Biomed. 2021;202:105970. doi:10.1016/j.cmpb.2021.105970
15. Sandstedt M, Bergfeldt L, Sandstedt J, et al. Wide QRS-T angles are associated with markers of increased inflammatory activity independently of hypertension and diabetes. Ann Noninvasive Electrocardiol. 2020;25:e12781. doi:10.1111/anec.12781
16. Voulgari C, Tentolouris N. Assessment of the spatial QRS-T angle by vectorcardiography: current data and perspectives. Curr Cardiol Rev. 2009;5:251–262. doi:10.2174/157340309789317850
17. Deng M, Huang X, Liang Z, et al. Classification of cardiac electrical signals between patients with myocardial infarction and normal subjects by using nonlinear dynamics features and different classification models. Biomed Signal Process Control. 2023;79:104105. doi:10.1016/j.bspc.2022.104105
18. Ingabire HN, Wu K, Toluwani Amos J, et al. Analysis of ECG signals by dynamic mode decomposition. IEEE J Biomed Health Inform. 2021;26:2124–2135. doi:10.1109/JBHI.2021.3130275
19. Cappiello G, Das S, Mazomenos EB, et al. A statistical index for early diagnosis of ventricular arrhythmia from the trend analysis of ECG phase-portraits. Physiol Meas. 2014;36:107. doi:10.1088/0967-3334/36/1/107
20. Choudhuri S, Ghosal T, Goswami DP, Sengupta A. Planarity of the spatial QRS loop of vectorcardiogram is a crucial diagnostic and prognostic parameter in acute myocardial infarction. Med Hypotheses. 2019;130:109251. doi:10.1016/j.mehy.2019.109251
21. Singam NSV, Fine C, Fleg JL. Cardiac changes associated with vascular aging. Clin Cardiol. 2020;43:92–98. doi:10.1002/clc.23313
22. Prabhavathi K, Selvi KT, Poornima KN, Sarvanan A. Role of biological sex in normal cardiac function and in its disease outcome - a review. J Clin Diagn Res. 2014;8:Be01–04. doi:10.7860/jcdr/2014/9635.4771
23. Fajemiroye JO, Cunha LCD, Saavedra-Rodríguez R, et al. Aging-induced biological changes and cardiovascular diseases. Biomed Res Int. 2018;2018:7156435. doi:10.1155/2018/7156435
24. Buitrago-Ricaurte N, Riveros-Rivera A, Riveros AJ. Age and sex affect circadian patterns of cardiac autonomic function. Sci Rep. 2025;15:33677. doi:10.1038/s41598-025-18525-6
25. Xie L, Li Z, Zhou Y, He Y, Zhu J. Computational diagnostic techniques for electrocardiogram signal analysis. Sensors. 2020;20:6318. doi:10.3390/s20216318
26. Cruces PD, Arini PD. A novel method for cardiac vector velocity measurement: evaluation in myocardial infarction. Biomed Signal Process Control. 2016;28:58–62. doi:10.1016/j.bspc.2016.04.003
27. Okin PM, Roman MJ, Devereux RB, Kligfield P. Gender differences and the electrocardiogram in left ventricular hypertrophy. Hypertension. 1995;25:242–249. doi:10.1161/01.hyp.25.2.242
28. Jaroszyński A, Furmaga J, Zapolski T, et al. The improvement of QRS-T angle as a manifestation of reverse electrical remodeling following renal transplantation in end-stage kidney disease patients on haemodialysis. BMC Nephrol. 2019;20:441. doi:10.1186/s12882-019-1624-3
29. Ahmadi P, Afzalian A, Jalali A, et al. Age and gender differences of basic electrocardiographic values and abnormalities in the general adult population; Tehran Cohort Study. BMC Cardiovasc Disord. 2023;23:303. doi:10.1186/s12872-023-03339-z
30. Nardelli M, Greco A, Danzi OP, et al. Cardiovascular assessment of supportive doctor-patient communication using multi-scale and multi-lag analysis of heartbeat dynamics. Med Biol Eng Comput. 2019;57:123–134. doi:10.1007/s11517-018-1869-1
31. Jafari Tadi M, Lehtonen E, Saraste A, et al. Gyrocardiography: a new non-invasive monitoring method for the assessment of cardiac mechanics and the estimation of hemodynamic variables. Sci Rep. 2017;7:6823. doi:10.1038/s41598-017-07248-y
32. Clemente D, Pereira T, Ribeiro S. Ventricular repolarization in diabetic patients: characterization and clinical implications. Arq Bras Cardiol. 2012;99:1015–1022. doi:10.1590/s0066-782x2012005000095
33. Whang W, Shimbo D, Levitan EB, et al. Relations between QRS|T angle, cardiac risk factors, and mortality in the third National Health and Nutrition Examination Survey (NHANES III). Am J Cardiol. 2012;109:981–987. doi:10.1016/j.amjcard.2011.11.027
34. Sun J, Zhou R, Liu M, Zhang D. The role of myocardial fibrosis in the diabetic cardiomyopathy. Diabetol Metab Syndr. 2025;17:242. doi:10.1186/s13098-025-01783-9
35. Tse G, Lai ET, Tse V, Yeo JM. Molecular and electrophysiological mechanisms underlying cardiac arrhythmogenesis in diabetes mellitus. J Diabetes Res. 2016;2016:2848759. doi:10.1155/2016/2848759
36. Kiciński P, Schlegel T, Dybała A, et al. Spatial QRS-T angle in patients with newly diagnosed obstructive sleep apnea syndrome. Adv Med Sci. 2017;62:240–245. doi:10.1016/j.advms.2016.11.008
37. Delhey L, Jin J, Thapa S, Delongchamp R, Faramawi MF. The association of metabolic syndrome and QRS|T angle in US adults (NHANES III). Ann Noninvasive Electrocardiol. 2020;25:e12678. doi:10.1111/anec.12678
38. Surawicz B, Parikh SR. Differences between ventricular repolarization in men and women: description, mechanism and implications. Ann Noninvasive Electrocardiol. 2003;8:333–340. doi:10.1046/j.1542-474x.2003.08411.x
39. Oehler A, Feldman T, Henrikson CA, Tereshchenko LG. QRS-T angle: a review. Ann Noninvasive Electrocardiol. 2014;19:534–542. doi:10.1111/anec.12206
40. Boyle AJ, Shih H, Hwang J, et al. Cardiomyopathy of aging in the mammalian heart is characterized by myocardial hypertrophy, fibrosis and a predisposition towards cardiomyocyte apoptosis and autophagy. Exp Gerontol. 2011;46:549–559. doi:10.1016/j.exger.2011.02.010
41. Voulgari C, Pagoni S, Tesfaye S, Tentolouris N. The spatial QRS-T angle: implications in clinical practice. Curr Cardiol Rev. 2013;9:197–210. doi:10.2174/1573403x113099990031
42. Guillem MS, Climent AM, Bollmann A, et al. Limitations of Dower’s inverse transform for the study of atrial loops during atrial fibrillation. Pacing Clin Electrophysiol. 2009;32:972–980. doi:10.1111/j.1540-8159.2009.02426.x
43. Cortez D, Schlegel T. When deriving the spatial QRS-T angle from the 12-lead electrocardiogram, which transform is more Frank: regression or inverse Dower? J Electrocardiol. 2010;43:302–309. doi:10.1016/j.jelectrocard.2010.03.010
 © 2026 The Author(s). This work is published and licensed by Dove Medical Press Limited. The
full terms of this license are available at https://www.dovepress.com/terms
and incorporate the Creative Commons Attribution
- Non Commercial (unported, 4.0) License.
By accessing the work you hereby accept the Terms. Non-commercial uses of the work are permitted
without any further permission from Dove Medical Press Limited, provided the work is properly
attributed. For permission for commercial use of this work, please see paragraphs 4.2 and 5 of our Terms.
© 2026 The Author(s). This work is published and licensed by Dove Medical Press Limited. The
full terms of this license are available at https://www.dovepress.com/terms
and incorporate the Creative Commons Attribution
- Non Commercial (unported, 4.0) License.
By accessing the work you hereby accept the Terms. Non-commercial uses of the work are permitted
without any further permission from Dove Medical Press Limited, provided the work is properly
attributed. For permission for commercial use of this work, please see paragraphs 4.2 and 5 of our Terms.
Recommended articles
The Interaction Between Age and Risk Factors for Diabetes and Prediabetes: A Community-Based Cross-Sectional Study
Yan Z, Cai M, Han X, Chen Q, Lu H
Diabetes, Metabolic Syndrome and Obesity 2023, 16:85-93
Published Date: 11 January 2023
Common Variables That Influence Sepsis Mortality in Mice
Garcia LF, Singh V, Mireles B, Dwivedi AK, Walker WE
Journal of Inflammation Research 2023, 16:1121-1134
Published Date: 14 March 2023
Relationships Between Body Composition and Cognitive Impairment in Hospitalised Middle-Aged Type 2 Diabetic Patients
Li YS, Liu YL, Wang JJ, Haghbin N, Wang XH, Jiang WR, Qiu HN, Xia LF, Wu F, Lin CY, Li JB, Lin JN
Diabetes, Metabolic Syndrome and Obesity 2023, 16:2389-2400
Published Date: 9 August 2023
An Explainable Machine Learning Model to Predict Acute Kidney Injury After Cardiac Surgery: A Retrospective Cohort Study
Gao Y, Wang C, Dong W, Li B, Wang J, Li J, Tian Y, Liu J, Wang Y
Clinical Epidemiology 2023, 15:1145-1157
Published Date: 4 December 2023
Analysis of Health-Related Quality of Life in Elderly Patients with Stroke Complicated by Hypertension in China Using the EQ-5D-3L Scale
Wang S, Shen C, Yang S
Journal of Multidisciplinary Healthcare 2024, 17:1981-1997
Published Date: 30 April 2024