Back to Journals » Diabetes, Metabolic Syndrome and Obesity » Volume 16
Relationships Between Body Composition and Cognitive Impairment in Hospitalised Middle-Aged Type 2 Diabetic Patients
Authors Li YS, Liu YL, Wang JJ, Haghbin N, Wang XH, Jiang WR, Qiu HN, Xia LF, Wu F, Lin CY, Li JB, Lin JN ![]()
Received 10 May 2023
Accepted for publication 29 July 2023
Published 9 August 2023 Volume 2023:16 Pages 2389—2400
DOI https://doi.org/10.2147/DMSO.S418111
Checked for plagiarism Yes
Review by Single anonymous peer review
Peer reviewer comments 3
Editor who approved publication: Professor Gian Paolo Fadini
Yao-Shuang Li,1,2,* Yan-Lan Liu,2,* Jun-Jia Wang,2,3 Nahal Haghbin,4 Xiao-He Wang,5 Wei-Ran Jiang,6 Hui-Na Qiu,2 Long-Fei Xia,1,2 Fan Wu,2,7 Chen-Ying Lin,1,2 Jing-Bo Li,2 Jing-Na Lin2
1Tianjin Union Medical Center, Tianjin Medical University, Tianjin, People’s Republic of China; 2Department of Endocrinology, Tianjin Union Medical Center, Nankai University Affiliated Hospital, Tianjin, People’s Republic of China; 3Tianjin Union Medical Center, Tianjin University of Traditional Chinese Medicine, Tianjin, People’s Republic of China; 4School of Global Health, Chinese Center for Tropical Diseases Research, Shanghai Jiao Tong University School of Medicine, Shanghai, People’s Republic of China; 5Institute of Non-Communicable Diseases Control and Prevention, Tianjin Center for Disease Control and Prevention, Tianjin, People’s Republic of China; 6Eastman Institute for Oral Health, University of Rochester Medical Center, Rochester, NY, USA; 7Tianjin Union Medical Center, School of Medicine, Nankai University, Tianjin, People’s Republic of China
*These authors contributed equally to this work
Correspondence: Jing-Na Lin; Jing-Bo Li, Email [email protected]; [email protected]
Objective: The aim of this study was to elucidate the relationship between specific body composition and the risk of Cognitive Impairment (CI) in middle-aged Type 2 Diabetes Mellitus (T2DM) patients.
Methods: This cross-sectional study included 504 hospitalized patients with T2DM from the Department of Endocrinology and Metabolism of the Tianjin Union Medical Center. Subjects were grouped by sex, and cognitive status was assessed using the Montreal Cognitive Assessment (MoCA). The relationship between body composition and cognitive ability was investigated with the use of linear regression analysis. The association between body composition and CI risk was determined by logistic regression analysis.
Results: The prevalence of CI was 39.3% in middle-aged T2DM patients. After adjusting for age, education, marriage status, carotid atherosclerosis, cerebrovascular disease and hemoglobin, multiple linear regression analysis showed that lean mass index (LMI), body mass index (BMI) and appendicular skeletal muscle index (SMI) were significant predictors for the MoCA scores in men (p < 0.05). In addition, BMI (OR 0.913, 95% CI 0.840– 0.992) and LMI (OR 0.820, 95% CI 0.682– 0.916) were independent protective factors for CI in males. After adjusted for age, education, marriage status, dietary control of diabetes and cerebrovascular disease, visceral obesity (VO, OR 1.950, 95% CI 1.033– 3.684) and abdominal obesity (AO, OR 2.537, 95% CI 1.191– 5.403) were risk factors for CI in female patients.
Conclusion: The results suggest that there may be different mechanisms underlying the relationship of body compositions and cognitive performance between middle-aged male and female patients with T2DM. In addition, our finding of potential determinants of cognitive impairment may facilitate the development of intervention programs for middle-aged type 2 diabetic patients. Nevertheless, more large prospective studies looking at cognition and changes in body composition over time are needed in the future to further support their association.
Keywords: cognitive impairment, diabetes, middle age, body composition, sex
Introduction
The number of people with diabetes is currently increasing due to significant lifestyle shifts in diet and physical activity. The International Diabetes Federation estimates that by 2045, the global prevalence of diabetes will reach 12.2%, affecting over 783.2 million people.1 China is one of the countries with the fastest growing incidence of diabetes, and the number of diabetic patients has exceeded 110 million.2 Although people of all ages are likely to develop diabetes, the age groups with the highest prevalence ranging from 12% to 25% are those younger than 65 years of age.3 Cognitive impairment (CI) and dementia are now thought to be common complications of T2DM. Patients with mild CI often experience declines in memory, language, execution, attention and other cognitive areas, but they hardly affect patients’ basic daily activities.4 Evidence from meta-analyses suggests that T2DM not only contributes to the development of CI but also accelerates its progression to dementia.5 The specific causes of cognitive decline in T2DM are complex. The anaerobic metabolism caused by long-term chronic hyperglycemia aggravates acidosis and damages hypoxic brain cells and central nervous system.6 Severe and repeated hypoglycemia also disrupts the energy metabolism of the brain, particularly the cerebral cortex and hippocampus, directly leading to neuronal cell death.7 In addition, insulin resistance in diabetic patients not only affects the energy supply of neurons by glucose metabolism but also impairs the regulation of synaptic plasticity and neuronal growth and repair.8 Given the lack of effective treatments for dementia, potentially modifiable factors of CI must be identified and promptly addressed.
Due to poor dietary habits and a physically inactive lifestyle, people with T2DM often face obesity, especially in relatively young patients.9 Obesity has been linked to cognitive performance, but current research on the effects of obesity on cognitive performance is conflicting. A large retrospective cohort study reports lower risk for dementia with higher body mass index (BMI).10 In another prospective study with more than 20 years of follow-up, people with a BMI over 30 kg/m2 had an increased risk of dementia.11 Indeed, as an obesity parameter used in most studies, BMI is not reliable, because it can neither distinguish between fat and lean mass nor show the distribution of fat, which are important indicators for many diseases, including hypertension, diabetes, cardiovascular and cerebrovascular diseases. Furthermore, the body composition of patients with diabetes is altered compared with the general population, with lower muscle mass and higher body fat mass.12 Therefore, BMI may not accurately and objectively reflect the degree of obesity in patients with T2DM.
Body composition measurement can more accurately reflect the content of muscle and fat, as well as the local accumulation of fat. Most studies on detailed measures of body composition and cognition have been conducted in the elderly, with relatively few in younger populations. However, it is worth noting that changes in body composition are not limited to old age, as the body starts to lose muscle mass at a rate of 0.8% per year around the age of 40.13 Studies in healthy young and middle-aged people have shown that body fat percentage is associated with poorer function in visual areas in men14 and that visceral fat was significantly negatively associated with language learning and memory in women,15 while lean body mass or muscle mass shows no clear association with cognitive function. However, the sample sizes of these two studies were small, and the subjects were healthy people from a general population.
There are no studies on a comprehensive wide range of measures of body composition parameters and CI in middle-aged people with T2DM. However, given the high prevalence of CI (33–59%) in middle-aged patients with T2DM and the high likelihood of progressive cognitive decline in patients with diabetes, there are potentially modifiable risk factors of CI that need to be specified in this population and to intervene early to delay the progression of cognitive decline. Therefore, the aim of this cross-sectional study was to investigate the association between specific body composition and CI risk in middle-aged patients with T2DM and to provide strategic support for early prevention and treatment of CI.
Methods
Study Population
We recruited 504 consecutive eligible patients with T2DM from hospitalized patients at the Department of Endocrinology and Metabolism of the Tianjin Union Medical Center, between July 2018 and September 2021. Their median age was 58 years old, including 279 males (55.4%) and 225 females (44.6%). T2DM was diagnosed using American Diabetes Association (ADA) criteria:16 fasting plasma glucose (FPG) ≥7.0 mmol/L and/or postprandial plasma glucose (PPG) ≥11.1 mmol/L or typical symptoms of hyperglycemia, event blood glucose level ≥11.1 mmol/L or glycosylated hemoglobin (HbA1c) ≥6.5% of patients. All patients were diagnosed with T2DM by Oral Glucose Tolerance Test (OGTT), so that transient elevated blood glucose could be excluded.
Inclusion criteria for this study were as follows: age 40–64 years, diagnosis of T2DM, capability to complete neuropsychological tests independently. The midlife period is now commonly considered to begin at ages 35 to 45 and end at age 64, while those aged 65 and older are classified as elderly.17 Thus, we selected T2DM patients aged from 40 to 64 years as the study population. The exclusion criteria were as follows:1 Inability to complete neuropsychological tests due to communication difficulties, physical disability, severe limitation of movement, or severe vision, hearing, reading, language impairment, or for any other reasons.2 Anemia (hemoglobin [Hb] <90 g/L), cachexia, liver insufficiency (alanine transaminase [ALT] ≥120 U/L), renal insufficiency (creatinine [Cr] ≥265 µmol/L), severe cardiopulmonary insufficiency, thyroid dysfunction, and severe infection.3 Parkinson’s disease, epilepsy, brain trauma, encephalitis, brain tumors, schizophrenia, severe depression, diagnosed dementia, alcohol or drug addiction and long-term use of drugs affecting cognitive function.
Screening Evaluation for CI
The Montreal Cognitive Assessment (MoCA) is an effective mild CI screening tool with a sensitivity of up to 90% and a specificity of 87%.18 It has been widely used in clinical practice. In this study, the Chinese version of MoCA was used to evaluate the cognitive function of middle-aged subjects with T2DM.19 In a quiet environment, the MoCA was conducted face-to-face by trained professionals in strict accordance with the guidelines. This cognitive test has a total score of 30, with a range of <26 for MCI and a range of ≥26 for normal cognitive function (NCF).20 Higher patient scores represent better cognitive function. 1 point is added to the total MoCA score if the subject has been studied for less than 12 years.20 As a result, 504 participants were categorized as NCF group (n = 306 [60.7%]) and CI group (n = 198 [39.3%]).
Data Collection
Demographic characteristics and diabetes-related information were obtained through the hospitalization medical records. The data collected included sex, age, marital status, education, history of smoking and drinking, a sedentary lifestyle, diet control, duration of diabetes, hypoglycemic episodes in the recent 3 months, diabetic peripheral neuropathy (DPN), diabetic microangiopathy, carotid atherosclerosis (CAS), low extremity atherosclerosis disease (LEASD), hypertension, coronary heart disease (CHD), and cerebrovascular disease (CVD). It is important to note that the dietary restrictions refer to the patients’ adherence to the diabetic dietary protocol for at least the past 3 months.21 A sedentary lifestyle is defined as less than 150 minutes per week of moderate-intensity aerobic activity (50–70% of maximum heart rate).21 Diabetic microangiopathy included diabetic nephropathy and/or diabetic retinopathy. Cerebrovascular diseases included hemorrhagic and/or ischemic strokes. Hypertension is defined as blood pressure ≥140/90 mmHg or use of antihypertensive drugs.22
After an overnight fast, a registered nurse drew blood from the vein in the early morning and analyzed the sample by the central laboratory for the following indicators: white blood cell count (WBC), hemoglobin (Hb), fasting plasma glucose (FPG), fasting plasma insulin (FINS), albumin (Alb), alanine transaminase (ALT), creatinine (Cr), urinary albumin-to-creatinine ratio (ACR), uric acid (UA), total cholesterol (TC), triglyceride (TG), high-density lipoprotein cholesterol (HDL-C), low-density lipoprotein cholesterol (LDL-C), homocysteine (HCY), and HbA1c. Insulin resistance was assessed by homeostatic model assessment for insulin resistance (HOMA-IR), which can be calculated as follows: HOMA-IR = FPG*FINS/22.5.23
Body composition data were obtained by professional physicians using an InBody 720 quadrupole bioelectrical impedance vector analysis (BIA). In the fasting state, the subjects wore light clothes and stood barefoot on the instrument to ensure that the soles of both feet and palms were in full contact with the metal plate of the instrument. The patient’s body remained stationary and upright during the test, and there was no contact between the limbs or between the limbs and the trunk. Through this examination, we were able to obtain the following data: bone mineral density (BMD), extracellular water (ECW), total body water (TBW), height, body mass index (BMI), body fat mass (BFM), percentage of body fat (PBF), visceral fat area (VFA), waist-to-hip ratio (WHR), appendicular skeletal muscle (ASM), skeletal muscle (SM), lean mass (LM), fat free mass (FFM). Fat mass index (FMI) is obtained by dividing BFM (kg) by height squared (m2). Appendicular skeletal muscle index (SMI) was obtained by dividing ASM (kg) by height squared (m2). Lean mass index (LMI) was obtained by dividing LM (kg) by height squared (m2). According to the Asia-Pacific criteria, the BMI ranges for normal weight, overweight and obesity are 18.5 kg/m2 ≤ BMI < 24 kg/m2, 24 kg/m2 ≤ BMI < 28 kg/m2 and BMI ≥ 28 kg/m2, respectively.24
At the end of the patient’s breath expiration, use a graduated tape to measure waist circumference (WC [cm]) horizontally between the last rib and the hip bone. Abdominal obesity (AO) is defined as a WC ≥90 cm for men and ≥85 cm for women. Visceral obesity (VO) is defined as a VFA ≥100 cm.25
Statistical Analysis
In this study, statistical data were analyzed using SPSS software (version 25.0; IBM Inc., Armonk, NY, USA). The Kolmogorov–Smirnov test is used to check whether the measured data follow a normal distribution. For descriptive statistics, normally distributed measurements are presented as mean ± standard deviation (SD), and non-normally distributed measurements are presented as median and interquartile range (P25, P75). Counting data are represented as number (percentage). In the statistical analysis, the comparison of normally distributed data between two groups was performed by Student’s t-test, and the comparison of non-normally distributed data was conducted by nonparametric Mann–Whitney U-test. Use the chi-square test to compare counting data. Linear regression analysis was used to investigate the correlations between body composition measures and cognitive scores of the MoCA. Logistic regression analysis was used to determine the relationships between body composition and the CI risk. Interaction analysis was used to examine the moderating effect of gender on the association between body composition and cognitive function. All tests were two-tailed p < 0.05 meant the difference was statistically significant.
Results
Table 1 shows the sociodemographic and general clinical data of the subjects grouped by gender and cognitive ability. Compared to individuals with NCF, age (p = 0.038 in males, p = 0.043 in females) and the proportions of participants with cerebrovascular disease (p = 0.013 in males, p < 0.001 in females) were higher in patients with CI. In contrast, education attainment (p < 0.001) and the MoCA scores (p < 0.001) in males and females and the proportions of participants who were married (p = 0.001 in males, p = 0.017 in females) were lower in patients with CI. Men with CI had a higher prevalence of carotid atherosclerosis than those with NCF (p = 0.032), while women with CI have a lower proportion of individuals who used dietary control of diabetes (p = 0.010). In terms of the laboratory test results, men with CI had a higher level of hemoglobin than those with NCF (p = 0.004). Other laboratory parameters did not show any significant differences between groups (p > 0.05).
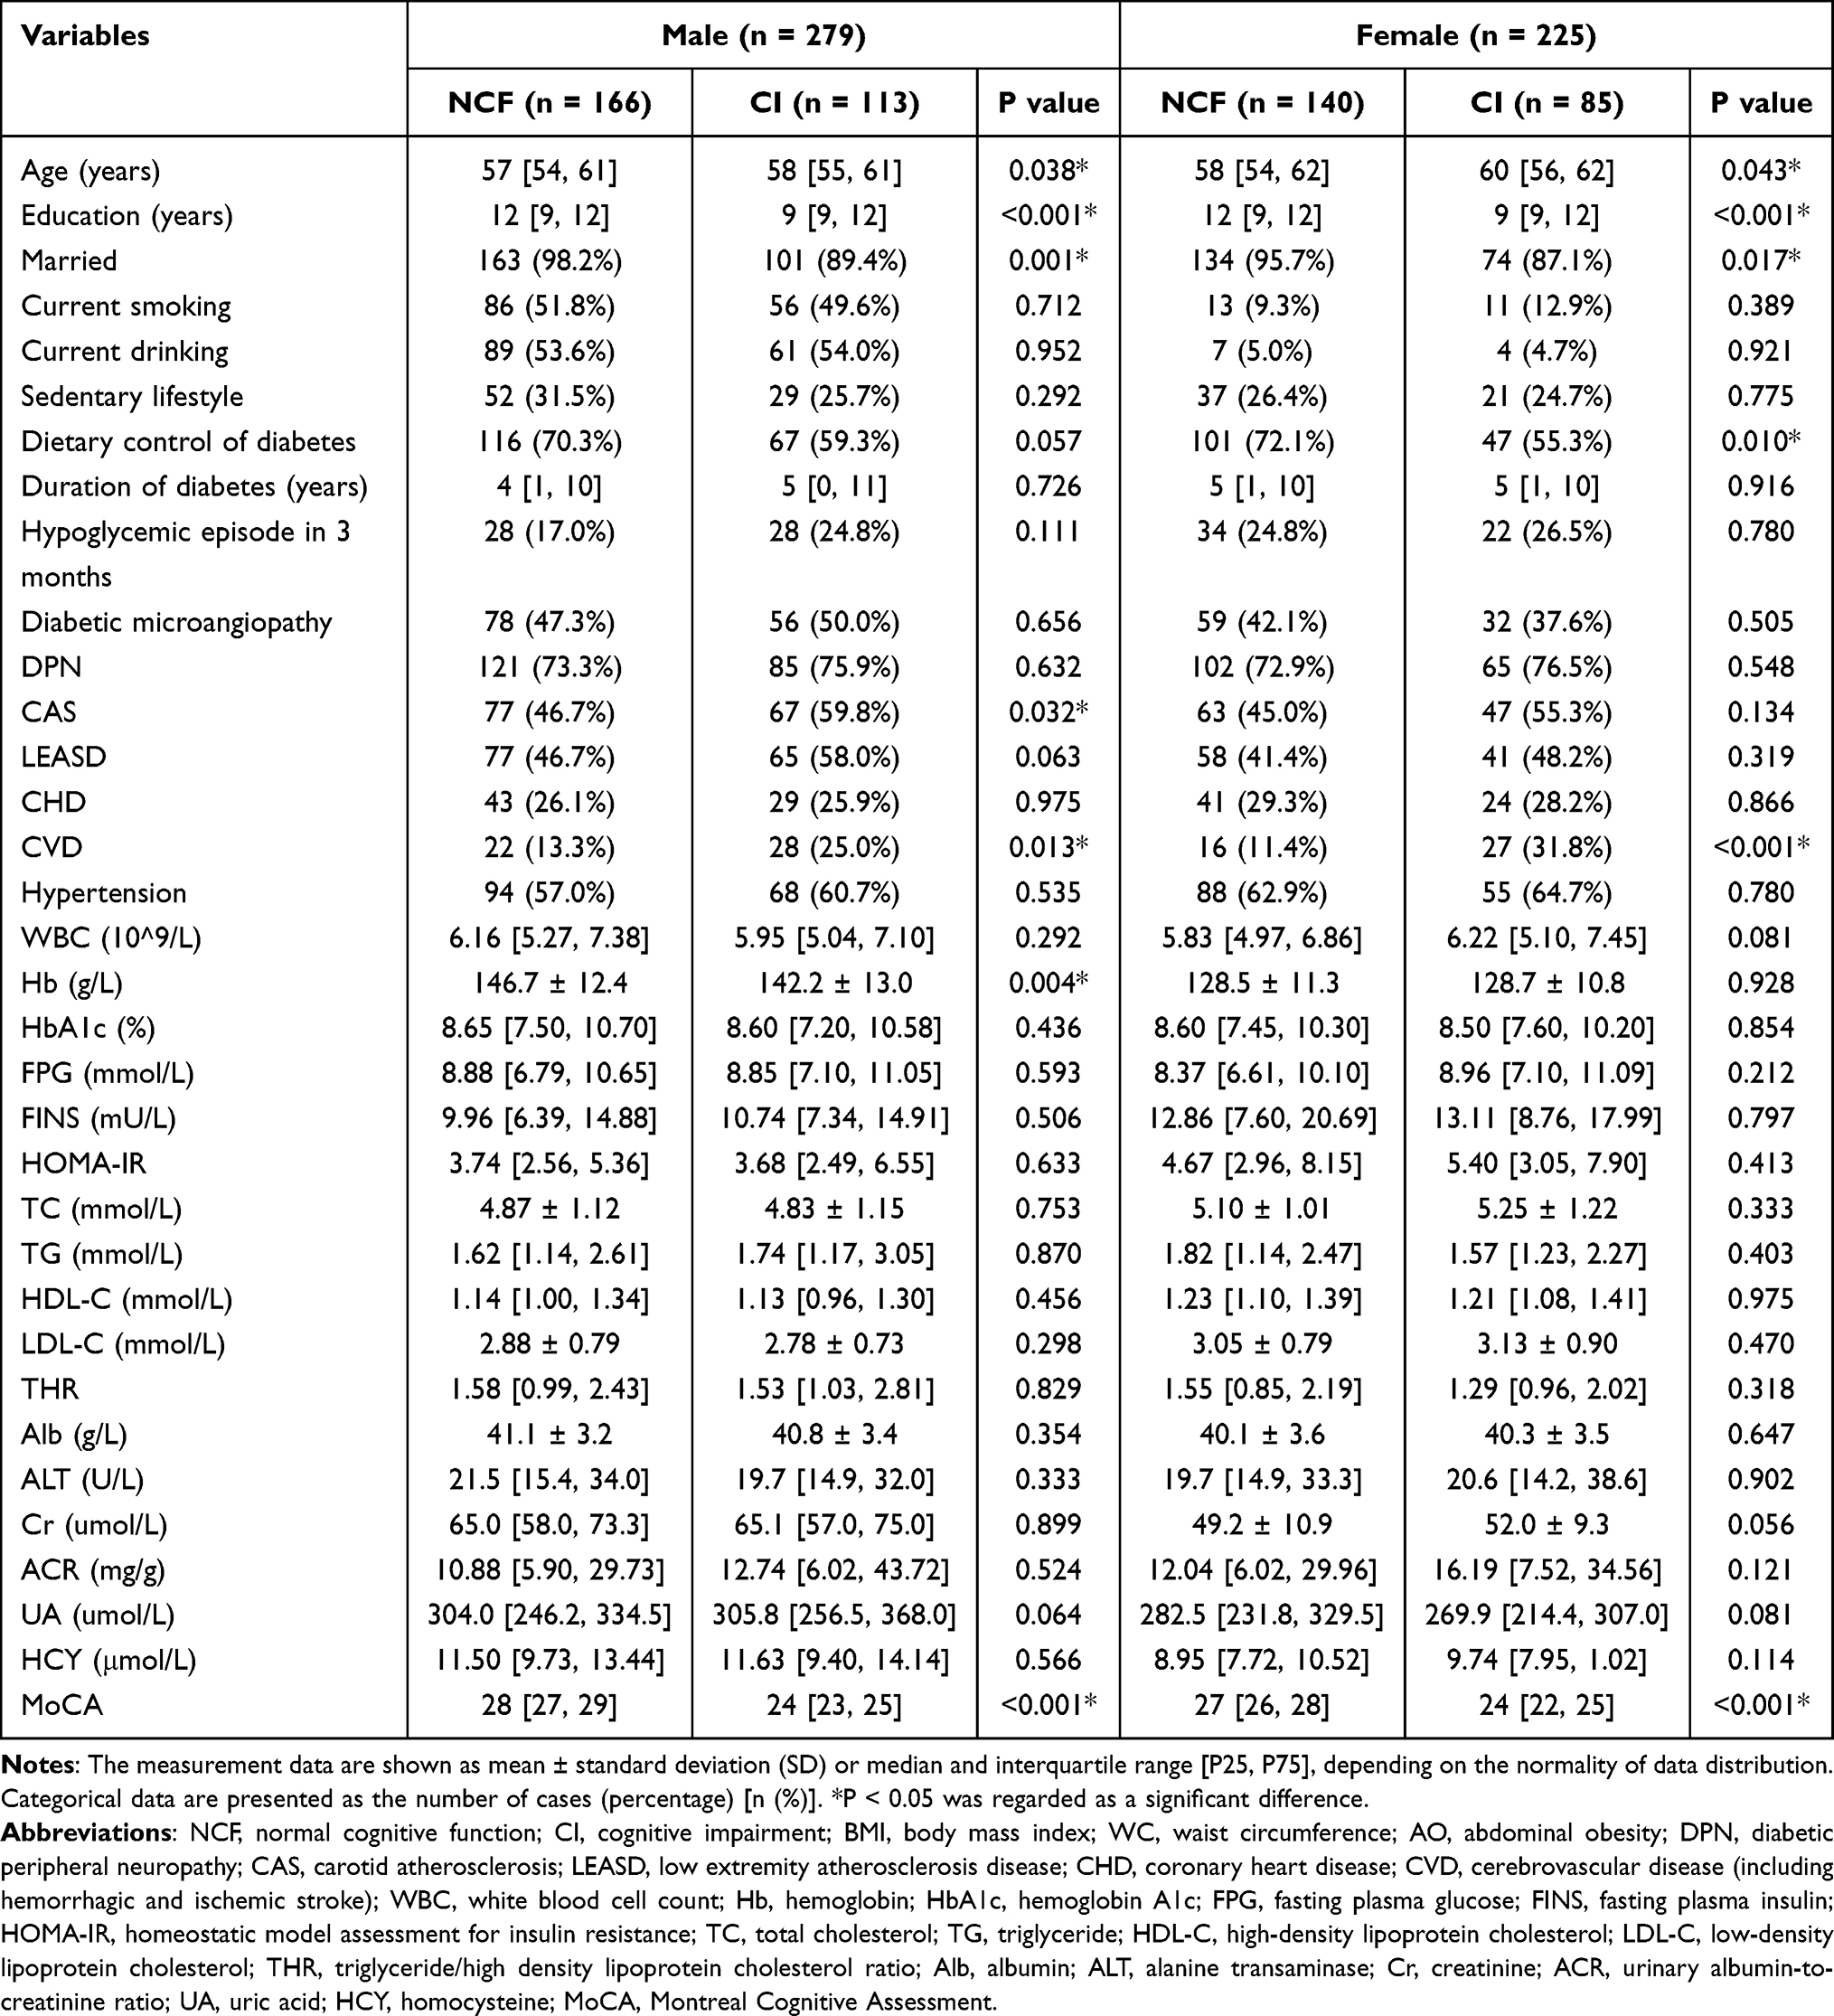 |
Table 1 General Clinical Data of Subjects According to Gender and Cognition |
The body composition data are exhibited in Table 2. In males, patients with CI had lower BMI (p = 0.004), SMI (p = 0.021) and LMI (p = 0.012) than those with NCF. In female patients, CI group had a larger VFA than NCF group (p = 0.006). Women with CI have higher proportions of individuals who had AO (p = 0.005) and VO (p = 0.002), while no differences were discovered in BFM, PBF, FMI, VFA, VO, WC, AO, WHR, ASM, SM, LM, FFM, BMD, ECW, TBW and ETR across the participants with and without CI in males. No relationships were seen in BMI, BFM, PBF, FMI, WC, WHR, ASM, SMI, SM, LM, LMI, FFM, BMD, ECW, TBW and ETR between two groups in females.
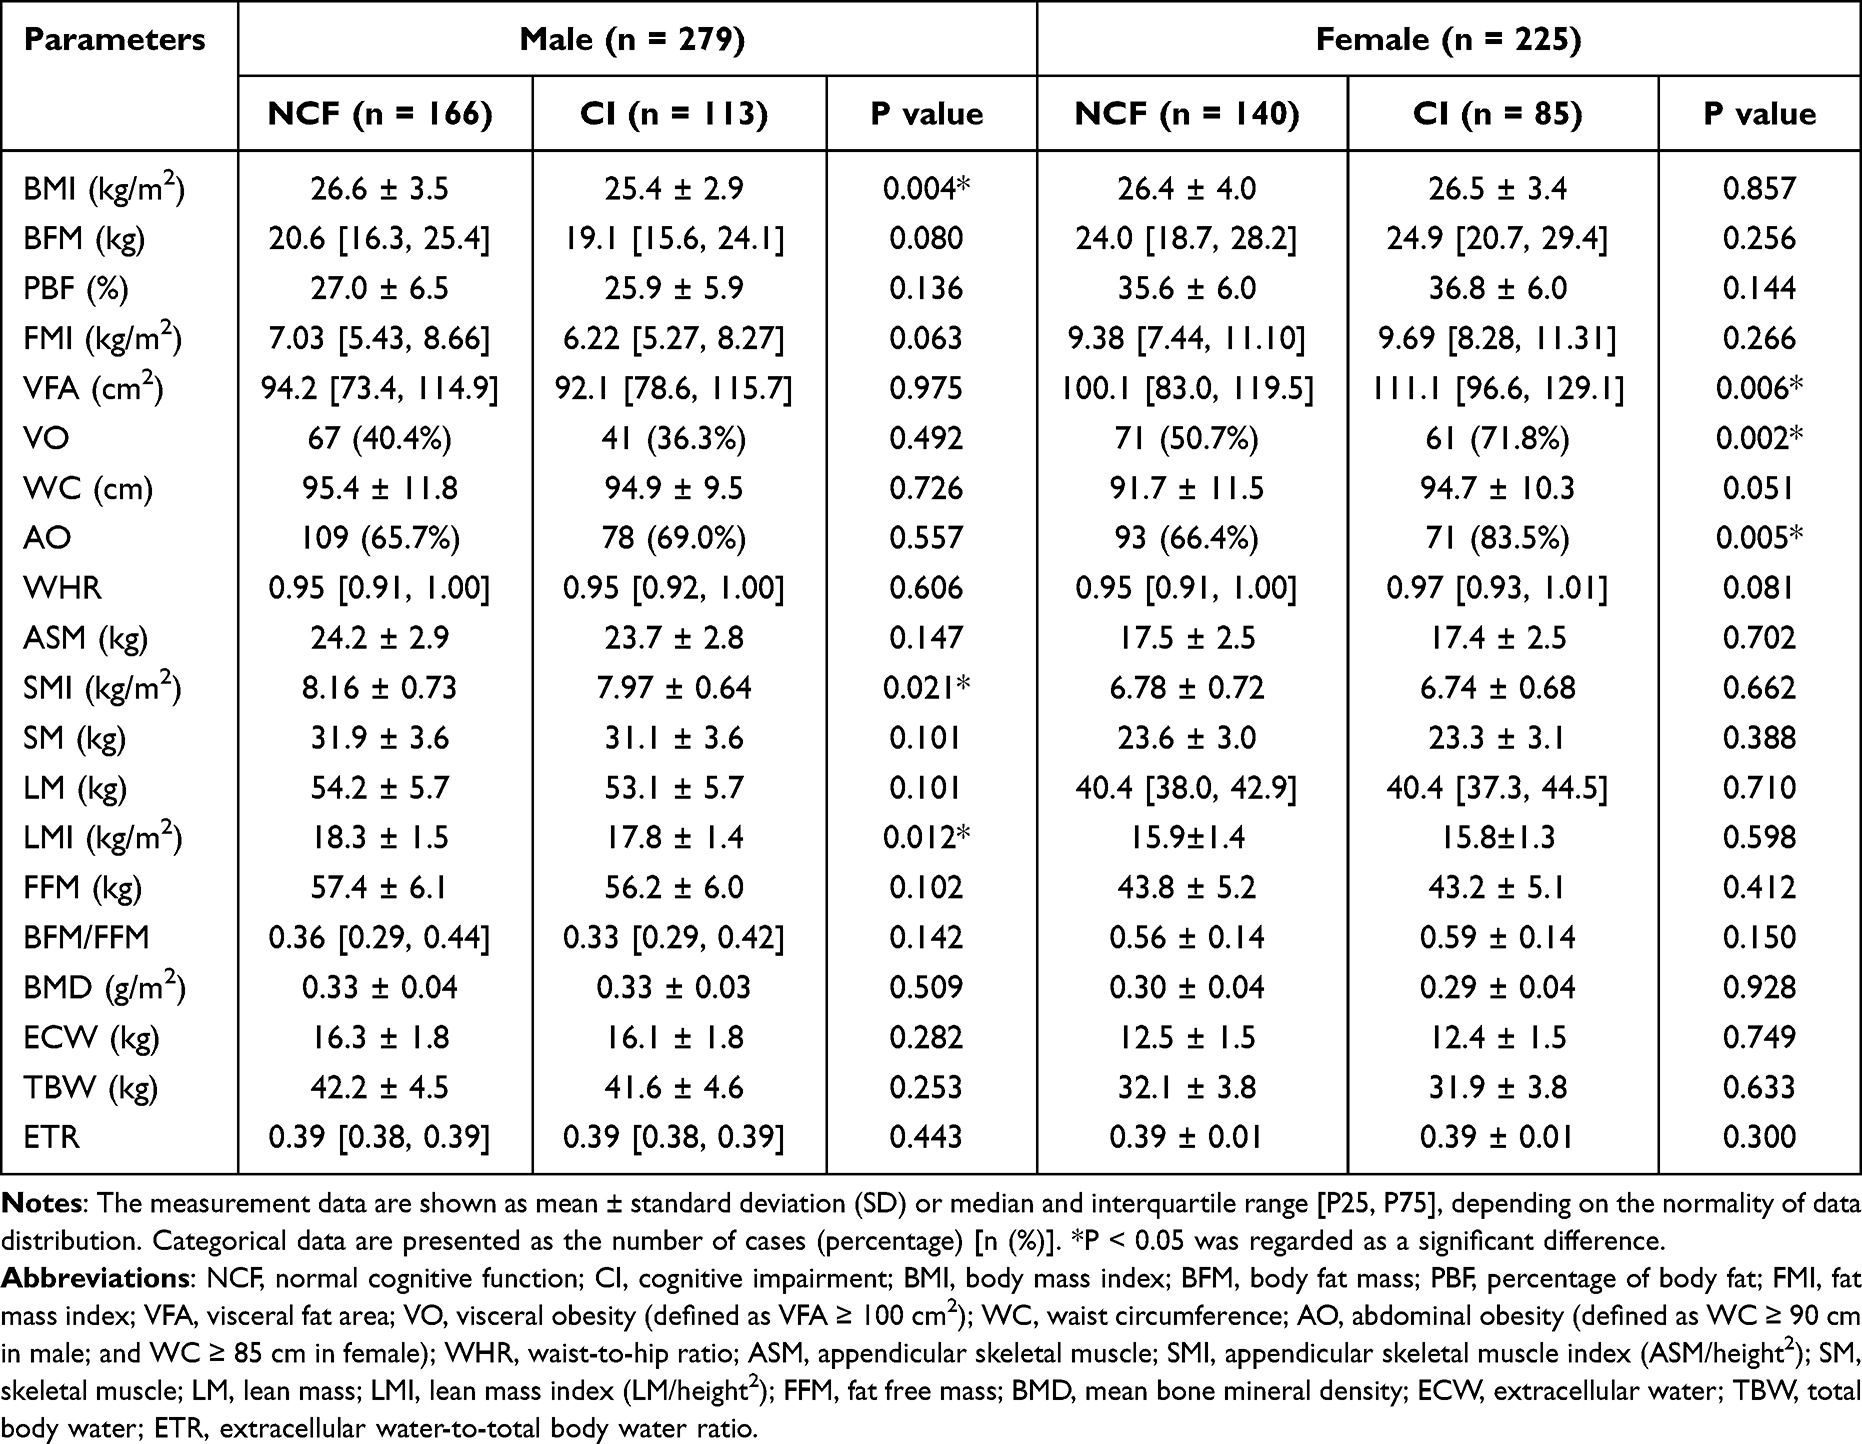 |
Table 2 Body Composition Parameters of Subjects According to Gender and Cognition |
To further explore the association between body composition and cognition, we selected body composition indicators with p < 0.05 in univariate analysis to enter the regression models. After adjusted for age, education, marriage status, carotid atherosclerosis, cerebrovascular disease and hemoglobin, the results of multiple linear regression analysis showed that LMI, BMI and SMI were significant predictors for the MoCA test in men (p < 0.05) (Table 3). On the other hand, VFA was not a predictor of the MoCA scores in women after adjusted for age, education, marriage status, dietary control of diabetes and cerebrovascular disease (p > 0.05).
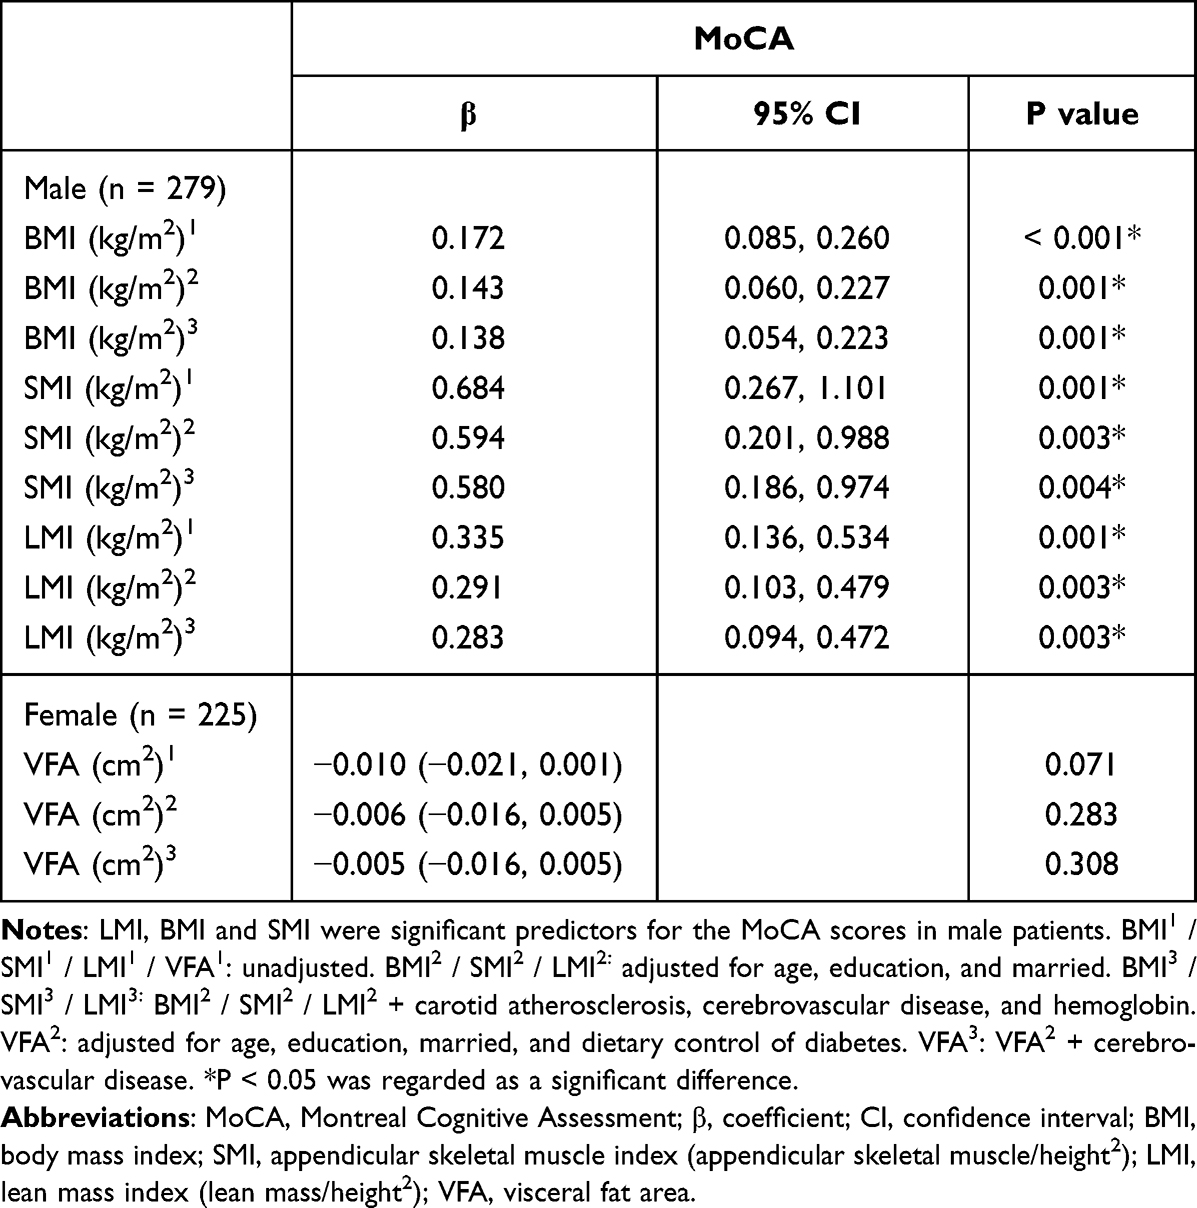 |
Table 3 Linear Regression Analysis of Body Composition and Cognitive Scores in Different Genders |
We also found that BMI (OR 0.913, 95% CI 0.840–0.992) and LMI (OR 0.820, 95% CI 0.682–0.916) were independent protective factors for CI in male patients by using the adjusted logistic regression models (Figure 1A), but the association between SMI and CI disappeared after adjusting for several confounders (OR 0.685, 95% CI 0.467–1.004). On the other hand, logistic regression analysis after adjusting for confounders showed that VO (OR 1.950, 95% CI 1.033–3.684) and AO (OR 2.537, 95% CI 1.191–5.403) were independent risk factors for CI in female patients (Figure 1B). Meanwhile, the association between VFA and CI was not relevant after adjustments (OR 1.007, 95% CI 0.996–1.018).
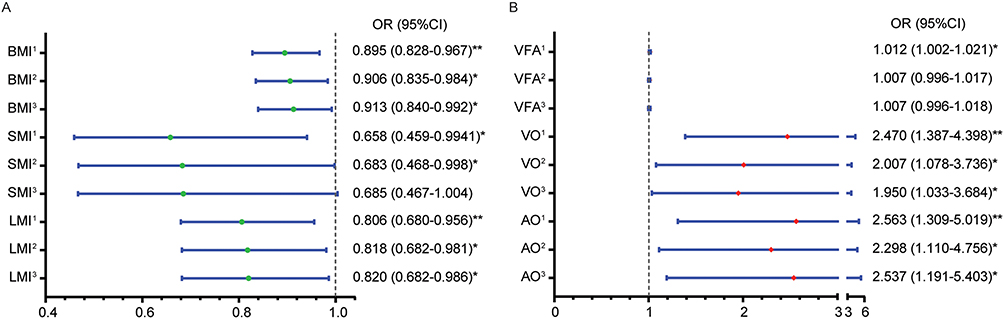 |
Figure 1 Odds ratios of body composition for cognitive impairment. BMI and LMI were independent protective factors for cognitive impairment in men (A), while VO and AO were independent risk factors for cognitive impairment in women (B). BMI1 / SMI1 / LMI1 / VFA1 / VO1 / AO1: unadjusted. BMI2 / SMI2 / LMI2: adjusted for age, education, and married. BMI3 / SMI3 / LMI3: BMI2 / SMI2 / LMI2 + carotid atherosclerosis, cerebrovascular disease, and hemoglobin. VFA2 / VO2 / AO2: adjusted for age, education, married, and dietary control of diabetes. VFA3 / VO3 / AO3: VFA2 / VO2 / AO2 + cerebrovascular disease. *, **Represented P < 0.05, 0.01 respectively, and were regarded as significant differences. Abbreviations: OR, odds ratio; CI, confidence interval; BMI, body mass index; SMI, appendicular skeletal muscle index (appendicular skeletal muscle/height2); LMI, lean mass index (lean mass/height2); VFA, visceral fat area; VO, visceral obesity (defined as VFA ≥ 100 cm2); AO, abdominal obesity (defined as WC ≥ 90 cm in male; and WC ≥ 85 cm in female). |
In addition, the interaction analysis indicated moderating effects of gender on the relationship between body composition and cognition after adjusting for confounders (age, education, marriage status, carotid atherosclerosis, dietary control of diabetes and cerebrovascular disease). Figure 2A shows that the relationship between BMI and cognitive function differed between genders. Overweight women had worse cognitive function than normal-weight and obese women, whereas higher BMI was associated with better cognitive function in men. Similar results were present in the analysis of muscle metrics versus the MoCA score. Women with moderate SMI and LMI had the worst MoCA score, while men’s muscle indexes were positively correlated with the MoCA score (Figure 2B and C). On the other hand, abdominal adiposity indexes had diametrical opposite relationships with cognitive function in men and women. Females with AO and VO had lower cognitive abilities, whereas males with AO and VO had higher cognitive abilities (Figure 2D and E).
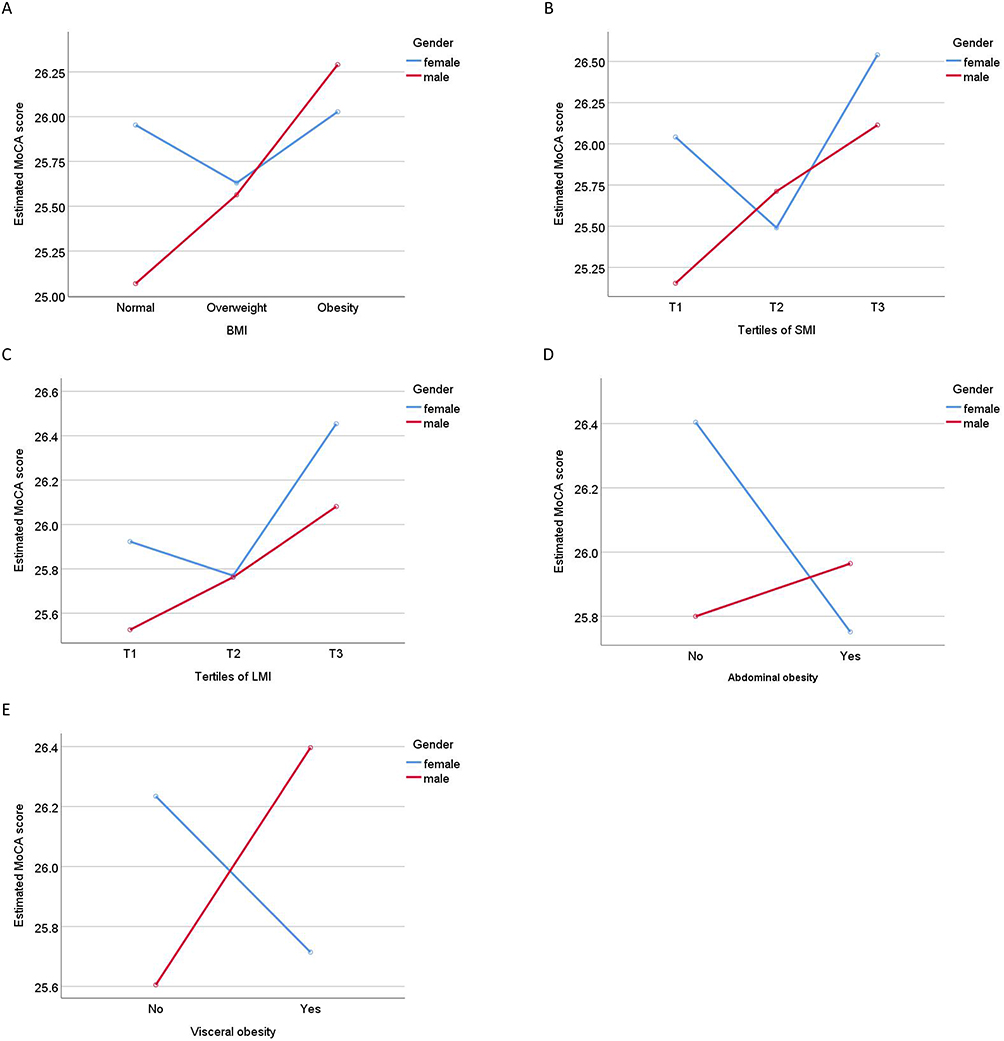 |
Figure 2 The interactions of gender and body compositions on cognitive function. There were interactions between gender and BMI (A), SMI (B), LMI (C), abdominal obesity (D) and visceral obesity (E) on the MoCA score. Abbreviations: MoCA, Montreal Cognitive Assessment; BMI, body mass index; SMI, appendicular skeletal muscle index (appendicular skeletal muscle/height2); LMI, lean mass index (lean mass/height2), abdominal obesity: defined as WC ≥ 90 cm in male, and WC ≥ 85 cm in female, visceral obesity: defined as VFA ≥ 100 cm2. |
Discussion
This cross-sectional study included 504 middle-aged T2DM inpatients, with a median age of 58 years, from a large tertiary hospital in northern China. After adjusting for possible confounders, we found that the relationship between body composition and cognitive function varied by sex in middle-aged patients with T2DM. BMI, SMI and LMI were independent protective factors for cognitive function (measured by the MoCA) in men, and BMI and LMI were related to a lower risk of CI. VO and AO were independent risk factors for CI in female subjects. In our study, the prevalence of CI in middle-aged T2DM inpatients was 39.3%, which was consistent with a meta-analysis (33% to 59%).26 This prevalence of CI was much higher than that in the general population (3% to 22%).27 Therefore, our study explored the correlation between body composition and CI in middle-aged inpatients with T2DM and provided strategic support for early prevention and treatment of CI.
Our findings suggest that BMI and LMI are independent protective factors for CI in middle-aged male inpatients with T2DM. Although BMI is currently the most used index to measure obesity, due to its inherent limitations and the changes in body composition in people with diabetes, including muscle loss and increased body fat,12 BMI may not accurately reflect obesity in this specific population. In turn, we used BIA to obtain a wide range of body composition parameters and demonstrated that SMI and LMI are independent protective factors of cognitive function in men. From this, we analyzed that this negative correlation between the nonspecific obesity parameter BMI and CI was mainly driven by LMI and SMI. This is because only these two measurements were related to CI, but not fat mass. Our results illustrate that reduced lean mass may underlie the previously reported relationship between BMI and cognitive decline and highlight the importance of assessing specific body composition measures.
We found independent protective effects of SMI and LMI on cognitive ability in middle-aged men with T2DM. In line with this, a Japanese cross-sectional study reported that a higher percentage of muscle mass predicted better cognitive function.28 Another study also reported that lean body mass was positively correlated with cognitive performance in older Canadian men.29 Since the univariate analysis suggested that neither BMD nor level of body water was significantly associated with CI and SMI was an independent protective factor of cognitive function (measured by MoCA), it can be speculated that the correlation between LMI and cognitive ability may be mainly driven by muscle. In fact, skeletal muscle has not only a motor function but it is also an endocrine organ. Previous studies have shown that various myokines produced by skeletal muscle during contraction might affect the function of brain. Moon found that exercise increased the expression level of the myokine cathepsin B in mice. Cathepsin B crossing the blood–brain barrier promoted neuronal production by enhancing the expression of brain-derived neurotrophic factor.30 On the other hand, brain-derived neurotrophic factor can also protect cognitive ability by exerting its anti-inflammatory effects.31 Moreover, the upregulation of PGC1α in skeletal muscle cells after exercise has been shown to reduce neurotoxic kynurenine entry into the brain, thereby protecting individuals from stress-induced brain damage.32 Thus, working muscles exert beneficial effects on the brain in several ways. Our study also showed that the association between body composition and cognitive status in men was mainly dependent on SMI and LMI rather than fat mass. A previous study yielded similar results, showing that reduced LM, but not fat mass, was related to brain atrophy involved in cognitive deficits in early Alzheimer’s Disease patients.33 This may indicate that LM is a more sensitive body composition parameter than fat mass in predicting cognitive function. In addition, Abellan found that fat mass was relevant to moderate or severe CI but not mild CI.34 In summary, different stages of cognitive decline seem to involve different changes in body composition, with early cognitive deficits often associated with muscle mass and LM, while middle and late cognitive deficits are more closely associated with fat mass.
Unlike men, we found that AO and VO were risk factors for CI in middle-aged female T2DM inpatients. Many studies have demonstrated the positive relationship between central obesity and CI risk. Waist circumference is related to cognitive decline and dementia risk in subjects with T2DM in a large longitudinal study with a mean follow-up of 5 years.35 Evidence from meta-analyses has also shown that AO, defined by waist circumference, is a risk factor for CI.36 An epidemiological study in Singapore involving 8769 general community members showed that VO independently predicted cognitive decline, and the results of Mendelian randomization analysis supported the causal association.37 Existing research evidence shows that VO may affect cognitive performance through the following pathways. First, elevated visceral adiposity tissue can significantly reduce insulin sensitivity of T2DM patients.38 Insulin has an important impact on regulating neurometabolism and triggering glucose uptake in the hippocampus and medial temporal lobe; therefore, hippocampal insulin resistance impairs memory processing and learning.39 A low-grade systemic inflammatory state in patients with central obesity, characterized by increasing inflammatory markers (interleukin-6, C-reactive protein and so on), may be another reason.40 These inflammatory factors lead to hypoperfusion and hypoxia in the brain by gradually promoting stiffening of cerebral vessels, which ultimately cause deterioration of cognitive function.41 Finally, excess visceral fat affects circulating fatty acid levels and adipocytokines of human body. Dysregulated fatty acids and adipocytokines crossing the blood–brain barrier could disrupt brain cell signaling, synaptic plasticity and memory homeostasis.42
In addition, the interaction analysis suggested moderating effects of gender on the association between body composition and cognitive function in middle-aged inpatients with T2DM. BMI, LMI and SMI were positively correlated with cognitive scores in men, but not in women. Unlike men, AO and VO were associated with lower cognitive scores in women. We analyzed that this may be caused in part by inconsistent changes in body composition with increasing age in the two sexes. Although men have more muscle mass than women, men’s skeletal muscle begins to decline steadily after the age of 30. However, skeletal muscle mass of women increases slowly until the age of 40 years, then remains largely unchanged, and then slowly declines after the age of 60 years.43 Thus, the apparent decrease in total body muscle mass in men compared with women may highlight its protective role in cognitive function. On the other hand, most women in this study experienced a significant decline in estrogen levels after menopause (89.3% of women over 50 years old), and because estradiol can mitigate the negative effects of visceral fat on cognition,44 the significantly reduced estrogen in women may lose its protective effect on cognitive function. Therefore, the adverse effect of VO on cognition in women appears.
Our univariate analysis showed that there was no statistical difference in insulin resistance (IR) between middle-aged T2DM patients in the CI and NCF groups. This negative result may seem surprising, given that IR in midlife has been linked to decreased cognitive performance.45,46 One caveat, however, is that these studies involved people without diabetes. On the other hand, evidence from a large cross-sectional study showed that IR index was not associated with cognitive function in late-midlife type 2 diabetes.47 Therefore, we hypothesized that the relationship between peripheral IR and cognitive performance might differ depending on the presence of diabetes. This has been supported by another study in which higher HOMA levels were associated with worse cognitive performance in people without diabetes but not in people with diabetes.48 Such inconsistent results may be due to the fact that peripheral and central insulin changes are not synchronized in patients with diabetes, because it has been proven that with the increase of IR, the amount of insulin crossing the blood–brain barrier into the brain is reduced.49 In addition, HOMA-IR is not the gold standard for assessing IR, so the IR estimated by HOMA-IR has potential inaccuracy, which may also be one of the reasons for the inconsistent results.
Given that most of the previous studies have focused on older or relatively healthy younger adults, one of the strengths of this study is that it addresses the gap in middle-aged patients with T2DM. In addition, BIA was used to obtain detailed and comprehensive body composition data, including body fat, visceral fat, muscle mass, lean mass, bone mineral density, water content and so on. Nonetheless, this study has some limitations. First, it was a cross-sectional study. Due to the restriction of the research design, a causal relationship between CI and the identified factors could not be established. Second, although we adjusted for some traditional demographic and health-related characteristics, we failed to adjust for other unmeasured potential confounding factors, such as β-Amyloid, hyper-phosphorylated Tau, apolipoprotein ε4 gene genotype and depression. Third, it should be noted that our study population was middle-aged hospitalized patients with T2DM who had high overall blood glucose levels and a mean HbA1c level of 9.05%. Therefore, our results may not be generalizable to all middle-aged persons with T2DM, including those with good glycemic control. Finally, due to the limitations of experimental data, we were unable to determine the specific mechanism of the correlation between certain body composition and cognition, so more in-depth studies are required for more evidence.
In conclusion, we discovered that body composition affecting cognitive ability in middle-aged people with T2DM differed by gender after adjustments. BMI and LMI were independent protective factors for CI in men, while AO and VO were independent risk factors for CI in women. Also, higher LMI in men was associated with better cognitive performance in the MoCA. These results suggest that there may be different mechanisms underlying the relationship of lean mass and abdominal obesity with cognitive performance between middle-aged male and female inpatients with T2DM. Our findings also contribute to a deeper understanding of the potential determinants of CI in middle-aged type 2 diabetic inpatients, which may facilitate the design of appropriate intervention programs. Despite this, more large prospective studies looking at cognition and changes in body composition over time are needed in the future to further support their association.
Data Sharing Statement
The raw data used in this study are available from the corresponding authors: JNL and JBL.
Ethics Approval and Consent to Participate
According to the principles of the Declaration of Helsinki, the study protocol was approved by the Medical Ethics Committee of Tianjin United Medical University Medical Center. Written informed consent was obtained from each participant.
Acknowledgments
The authors are grateful for the clinical data provided by the Department of Endocrinology of the Tianjin Union Medical Center.
Author Contributions
All authors made a significant contribution to the work reported, whether that is in the conception, study design, execution, acquisition of data, analysis and interpretation, or in all these areas; took part in drafting, revising or critically reviewing the article; gave final approval of the version to be published; have agreed on the journal to which the article has been submitted; and agree to be accountable for all aspects of the work.
Funding
This work was supported by the Tianjin Science and Technology Committee (J.N.L, Grant Number 18ZXDBSY00120) and the Science and Technology Project of the Tianjin Municipal Health Commission (J.N.L, Grant Number ZD20006).
Disclosure
The research was conducted in the absence of any commercial or financial relationships that could be construed as a potential conflict of interest.
References
1. Sun H, Saeedi P, Karuranga S, et al. IDF Diabetes Atlas: global, regional and country-level diabetes prevalence estimates for 2021 and projections for 2045. Diabetes Res Clin Pract. 2022;183:109119. doi:10.1016/j.diabres.2021.109119
2. Bai A, Tao J, Tao L, Liu J. Prevalence and risk factors of diabetes among adults aged 45 years or older in China: a national cross-sectional study. Endocrinol Diabetes Metab. 2021;4(3):e00265. doi:10.1002/edm2.265
3. Ortiz GG, Huerta M, González-Usigli HA, et al. Cognitive disorder and dementia in type 2 diabetes mellitus. World J Diabetes. 2022;13(4):319–337. doi:10.4239/wjd.v13.i4.319
4. Biessels GJ, Nobili F, Teunissen CE, Simó R, Scheltens P. Understanding multifactorial brain changes in type 2 diabetes: a biomarker perspective. Lancet Neurol. 2020;19(8):699–710. doi:10.1016/S1474-4422(20)30139-3
5. Xue M, Xu W, Ou YN, et al. Diabetes mellitus and risks of cognitive impairment and dementia: a systematic review and meta-analysis of 144 prospective studies. Ageing Res Rev. 2019;55:100944. doi:10.1016/j.arr.2019.100944
6. Valente T, Gella A, Fernàndez-Busquets X, Unzeta M, Durany N. Immunohistochemical analysis of human brain suggests pathological synergism of Alzheimer’s disease and diabetes mellitus. Neurobiol Dis. 2010;37(1):67–76. doi:10.1016/j.nbd.2009.09.008
7. Ryan JP, Fine DF, Rosano C. Type 2 diabetes and cognitive impairment: contributions from neuroimaging. J Geriatr Psychiatry Neurol. 2014;27(1):47–55. doi:10.1177/0891988713516543
8. Vieira MNN, Lima-Filho RAS, De Felice FG. Connecting Alzheimer’s disease to diabetes: underlying mechanisms and potential therapeutic targets. Neuropharmacology. 2018;136(Pt B):160–171. doi:10.1016/j.neuropharm.2017.11.014
9. Caprio S, Perry R, Kursawe R. adolescent obesity and insulin resistance: roles of ectopic fat accumulation and adipose inflammation. Gastroenterology. 2017;152(7):1638–1646. doi:10.1053/j.gastro.2016.12.051
10. Qizilbash N, Gregson J, Johnson ME, et al. BMI and risk of dementia in two million people over two decades: a retrospective cohort study. Lancet Diabetes Endocrinol. 2015;3(6):431–436. doi:10.1016/S2213-8587(15)00033-9
11. Kivipelto M, Ngandu T, Fratiglioni L, et al. Obesity and vascular risk factors at midlife and the risk of dementia and Alzheimer disease. Arch Neurol. 2005;62(10):1556–1560. doi:10.1001/archneur.62.10.1556
12. Park SW, Goodpaster BH, Lee JS, et al. Health, aging, and body composition study. Excessive loss of skeletal muscle mass in older adults with type 2 diabetes. Diabetes Care. 2009;32(11):1993–1997. doi:10.2337/dc09-0264
13. Nair KS. Aging muscle. Am J Clin Nutr. 2005;81(5):953–963. doi:10.1093/ajcn/81.5.953
14. Bove RM, Gerweck AV, Mancuso SM, Bredella MA, Sherman JC, Miller KK. Association between adiposity and cognitive function in young men: hormonal mechanisms. Obesity. 2016;24(4):954–961. doi:10.1002/oby.21415
15. Bove RM, Brick DJ, Healy BC, et al. Metabolic and endocrine correlates of cognitive function in healthy young women. Obesity. 2013;21(7):1343–1349. doi:10.1002/oby.20212
16. American Diabetes Association. Standards of medical care in diabetes--2010. Diabetes Care. 2010;33(1):S11–61. doi:10.2337/dc10-S011
17. Shinan-Altman S, Werner P. Subjective age and its correlates among middle-aged and older adults. Int J Aging Hum Dev. 2019;88(1):3–21. doi:10.1177/0091415017752941
18. Nasreddine ZS, Phillips NA, Bédirian V, et al. The Montreal cognitive assessment, MoCA: a brief screening tool for mild cognitive impairment. J Am Geriatr Soc. 2005;53(4):695–699. doi:10.1111/j.1532-5415.2005.53221.x
19. Alagiakrishnan K, Zhao N, Mereu L, Senior P, Senthilselvan A. Montreal cognitive assessment is superior to standardized mini-mental status exam in detecting mild cognitive impairment in the middle-aged and elderly patients with type 2 diabetes mellitus. Biomed Res Int. 2013;2013:186106. doi:10.1155/2013/186106
20. Tsoi KK, Chan JY, Hirai HW, Wong SY, Kwok TC. Cognitive tests to detect dementia: a systematic review and meta-analysis. JAMA Intern Med. 2015;175(9):1450–1458. doi:10.1001/jamainternmed.2015.2152
21. Weng J, Ji L, Jia W, et al. Chinese diabetes society. Standards of care for type 2 diabetes in China. Diabetes Metab Res Rev. 2016;32(5):442–458. doi:10.1002/dmrr.2827
22. Tuligenga RH, Dugravot A, Tabák AG, et al. Midlife type 2 diabetes and poor glycaemic control as risk factors for cognitive decline in early old age: a post-hoc analysis of the Whitehall II cohort study. Lancet Diabetes Endocrinol. 2014;2(3):228–235. doi:10.1016/S2213-8587(13)70192-X
23. Ghasemi A, Tohidi M, Derakhshan A, Hasheminia M, Azizi F, Hadaegh F. Cut-off points of homeostasis model assessment of insulin resistance, beta-cell function, and fasting serum insulin to identify future type 2 diabetes: Tehran Lipid and Glucose Study. Acta Diabetol. 2015;52(5):905–915. doi:10.1007/s00592-015-0730-3
24. Zhou B. Predictive values of body mass index and waist circumference for risk factors of certain related diseases in Chinese adults: study on optimal cut-off points of body mass index and waist circumference in Chinese adults. Biomed Environ Sci. 2002;15(1):83–96.
25. Ma S, Xi B, Yang L, Sun J, Zhao M, Bovet P. Trends in the prevalence of overweight, obesity, and abdominal obesity among Chinese adults between 1993 and 2015. Int J Obes. 2021;45(2):427–437. doi:10.1038/s41366-020-00698-x
26. You Y, Liu Z, Chen Y, et al. The prevalence of mild cognitive impairment in type 2 diabetes mellitus patients: a systematic review and meta-analysis. Acta Diabetol. 2021;58(6):671–685. doi:10.1007/s00592-020-01648-9
27. Sanford AM. Mild Cognitive Impairment. Clin Geriatr Med. 2017;33(3):325–337. doi:10.1016/j.cger.2017.02.005
28. Crespillo-Jurado M, Delgado-Giralt J, Reigal RE, et al. Body composition and cognitive functioning in a sample of active elders. Front Psychol. 2019;10:1569. doi:10.3389/fpsyg.2019.01569
29. Langeard A, Fakrahnak Z, Vrinceanu T, et al. Sex-moderated association between body composition and cognition in older adults. Exp Gerontol. 2020;138:111002. doi:10.1016/j.exger.2020.111002
30. Moon HY, Becke A, Berron D, et al. Running-induced systemic cathepsin B secretion is associated with memory function. Cell Metab. 2016;24(2):332–340. doi:10.1016/j.cmet.2016.05.025
31. Pasco JA, Williams LJ, Jacka FN, et al. Sarcopenia and the common mental disorders: a potential regulatory role of skeletal muscle on brain function? Curr Osteoporos Rep. 2015;13(5):351–357. doi:10.1007/s11914-015-0279-7
32. Agudelo LZ, Femenía T, Orhan F, et al. Skeletal muscle PGC-1α1 modulates kynurenine metabolism and mediates resilience to stress-induced depression. Cell. 2014;159(1):33–45. doi:10.1016/j.cell.2014.07.051
33. Burns JM, Johnson DK, Watts A, Swerdlow RH, Brooks WM. Reduced lean mass in early Alzheimer disease and its association with brain atrophy. Arch Neurol. 2010;67(4):428–433. doi:10.1001/archneurol.2010.38
34. Abellan van Kan G, Cesari M, Gillette-Guyonnet S, et al. Sarcopenia and cognitive impairment in elderly women: results from the EPIDOS cohort. Age Ageing. 2013;42(2):196–202. doi:10.1093/ageing/afs173
35. Gong J, Harris K, Hackett M, et al. Sex differences in risk factors for cognitive decline and dementia, including death as a competing risk, in individuals with diabetes: results from the ADVANCE trial. Diabetes Obes Metab. 2021;23(8):1775–1785. doi:10.1111/dom.14391
36. Tang X, Zhao W, Lu M, et al. Relationship between central obesity and the incidence of cognitive impairment and dementia from cohort studies involving 5,060,687 participants. Neurosci Biobehav Rev. 2021;130:301–313. doi:10.1016/j.neubiorev.2021.08.028
37. Mina T, Yew YW, Ng HK, et al. Adiposity impacts cognitive function in Asian populations: an epidemiological and Mendelian Randomization study. Lancet Reg Health West Pac. 2023;33:100710. doi:10.1016/j.lanwpc.2023.100710
38. Gastaldelli A, Miyazaki Y, Pettiti M, et al. Metabolic effects of visceral fat accumulation in type 2 diabetes. J Clin Endocrinol Metab. 2002;87(11):5098–5103. doi:10.1210/jc.2002-020696
39. Grillo CA, Piroli GG, Lawrence RC, et al. Hippocampal insulin resistance impairs spatial learning and synaptic plasticity. Diabetes. 2015;64(11):3927–3936. doi:10.2337/db15-0596
40. Monteiro R, Azevedo I. Chronic inflammation in obesity and the metabolic syndrome. Mediators Inflamm. 2010;2010:289645. doi:10.1155/2010/289645
41. Yaffe K, Kanaya A, Lindquist K, et al. The metabolic syndrome, inflammation, and risk of cognitive decline. JAMA. 2004;292(18):2237–2242. doi:10.1001/jama.292.18.2237
42. Morys F, Dadar M, Dagher A. Association between midlife obesity and its metabolic consequences, cerebrovascular disease, and cognitive decline. J Clin Endocrinol Metab. 2021;106(10):e4260–e4274. doi:10.1210/clinem/dgab135
43. Kim KM, Jang HC, Lim S. Differences among skeletal muscle mass indices derived from height-, weight-, and body mass index-adjusted models in assessing sarcopenia. Korean J Intern Med. 2016;31(4):643–650. doi:10.3904/kjim.2016.015
44. Zsido RG, Heinrich M, Slavich GM, et al. Association of estradiol and visceral fat with structural brain networks and memory performance in adults. JAMA Netw Open. 2019;2(6):e196126. doi:10.1001/jamanetworkopen.2019.6126
45. Young SE, Mainous AG, Carnemolla M. Hyperinsulinemia and cognitive decline in a middle-aged cohort. Diabetes Care. 2006;29(12):2688–2693. doi:10.2337/dc06-0915
46. Okereke OI, Kurth T, Pollak MN, Gaziano JM, Grodstein F. Fasting plasma insulin, C-peptide and cognitive change in older men without diabetes: results from the Physicians’ Health Study II. Neuroepidemiology. 2010;34(4):200–207. doi:10.1159/000289351
47. Geijselaers SLC, Sep SJS, Schram MT, et al. Insulin resistance and cognitive performance in type 2 diabetes - The Maastricht study. J Diabetes Complications. 2017;31(5):824–830. doi:10.1016/j.jdiacomp.2017.01.020
48. Benedict C, Brooks SJ, Kullberg J, et al. Impaired insulin sensitivity as indexed by the HOMA score is associated with deficits in verbal fluency and temporal lobe gray matter volume in the elderly. Diabetes Care. 2012;35(3):488–494. doi:10.2337/dc11-2075
49. Kern W, Benedict C, Schultes B, et al. Low cerebrospinal fluid insulin levels in obese humans. Diabetologia. 2006;49(11):2790–2792. doi:10.1007/s00125-006-0409-y
 © 2023 The Author(s). This work is published and licensed by Dove Medical Press Limited. The
full terms of this license are available at https://www.dovepress.com/terms
and incorporate the Creative Commons Attribution
- Non Commercial (unported, 3.0) License.
By accessing the work you hereby accept the Terms. Non-commercial uses of the work are permitted
without any further permission from Dove Medical Press Limited, provided the work is properly
attributed. For permission for commercial use of this work, please see paragraphs 4.2 and 5 of our Terms.
© 2023 The Author(s). This work is published and licensed by Dove Medical Press Limited. The
full terms of this license are available at https://www.dovepress.com/terms
and incorporate the Creative Commons Attribution
- Non Commercial (unported, 3.0) License.
By accessing the work you hereby accept the Terms. Non-commercial uses of the work are permitted
without any further permission from Dove Medical Press Limited, provided the work is properly
attributed. For permission for commercial use of this work, please see paragraphs 4.2 and 5 of our Terms.
Recommended articles
Gender Differences in Relation to Body Composition, Insulin Resistance, and Islet Beta Cell Function in Newly Diagnosed Diabetic or Pre-Diabetic Patients
Ma M, Jiang T, Wen Z, Zhang D, Xiu L
Diabetes, Metabolic Syndrome and Obesity 2023, 16:723-732
Published Date: 10 March 2023