Back to Journals » Diabetes, Metabolic Syndrome and Obesity » Volume 16
The Interaction Between Age and Risk Factors for Diabetes and Prediabetes: A Community-Based Cross-Sectional Study
Authors Yan Z ![]() , Cai M, Han X, Chen Q, Lu H
, Cai M, Han X, Chen Q, Lu H
Received 28 September 2022
Accepted for publication 15 December 2022
Published 11 January 2023 Volume 2023:16 Pages 85—93
DOI https://doi.org/10.2147/DMSO.S390857
Checked for plagiarism Yes
Review by Single anonymous peer review
Peer reviewer comments 3
Editor who approved publication: Professor Gian Paolo Fadini
Zihui Yan,1 Mengjie Cai,1 Xu Han,2 Qingguang Chen,2 Hao Lu1,2
1Department of Endocrinology, Shuguang Hospital Affiliated to Shanghai University of Traditional Chinese Medicine, Shanghai, 201203, People’s Republic of China; 2Diabetes Research Institute, Shuguang Hospital Affiliated to Shanghai University of Traditional Chinese Medicine, Shanghai, 201203, People’s Republic of China
Correspondence: Qingguang Chen; Hao Lu, Email [email protected]; [email protected]
Objective: This study aimed to investigate the interaction between age groups and risk factors for diabetes and prediabetes in Shanghai communities and to identify the effect of age on other risk factors for diabetes and prediabetes.
Methods: This study recruited 3540 participants with undiagnosed diabetes or prediabetes in 14 communities in Shanghai from February to August 2019. All participants underwent a comprehensive examination, including filling out a detailed questionnaire, physical examination, 75 g oral glucose tolerance test, and blood sample collection. In addition, logistic regression was used to analyze the interaction between age and risk factors for prediabetes and diabetes.
Results: The statistical analysis included 2776 people. In this study, the prevalence of diabetes and prediabetes were 15.1% and 52.3%, respectively. The prevalence of diabetes and prediabetes is higher in the elderly than in the middle-aged group. Among the risk factors for diabetes, overweight was associated with higher age (P-interaction 0.028). In addition, among the risk factors for prediabetes, a high level of education was associated with higher age (P-interaction 0.039) and elevated serum cholesterol level was associated with lower age (P-interaction 0.019).
Conclusion: This study confirmed an interaction between age and other influencing factors, which may be important in explaining differences in risk factors for diabetes and prediabetes in the middle-aged and elderly populations. Community health facilities can provide health guidance to people of different age groups to prevent and control prediabetes and diabetes.
Keywords: diabetes, prediabetes, risk factors, age, interaction
Introduction
Diabetes, a chronic disease with a high prevalence, has attracted worldwide attention. Surveys indicate that the global prevalence of diabetes in the adult population was 10.5% in 2021, with approximately 6.7 million adult deaths attributed to diabetes and its complications.1 According to the statistics, the prevalence of diabetes in China increased from 10.9% in 2013 to 12.4% in 2018, making China the country with the highest number of people with diabetes worldwide because of its large population.2 The latest epidemiological survey revealed a 38.1% prevalence of prediabetes among Chinese adults, with much more patients having prediabetes than diabetes.2 Prediabetes development is bidirectional, worsening into diabetes or returning to normal glucose metabolism. Therefore, early detection and appropriate intervention are key measures to prevent the deterioration of prediabetes.3
As society improves by leaps and bounds, population aging has become an obvious problem affecting public health. In China, most people with diabetes and prediabetes are over 40 years. According to a survey, the prevalence of diabetes and prediabetes among people aged 40–49 is 11.1% and 40.3%, respectively, while the prevalence of diabetes and prediabetes among people aged 60–69 has increased to 23.9% and 47.6%, respectively.2 Advanced age is a major risk factor for diabetes and prediabetes.4,5 Therefore, the elderly has a higher prevalence of diabetes and prediabetes than the young and middle-aged and are more likely to develop complications in the cardiovascular, retinal, and renal systems.6,7 Age differences cause changes in socio-demographic features and clinical characteristics; therefore, age may be an important variable influencing the role of risk factors for diabetes and prediabetes. Hence, clarifying the interaction between age and factors influencing the abnormal state of glucose metabolism is essential for healthcare organizations to develop precise prevention and control programs for diabetes. Given that few studies have examined the interaction between age and other risk factors, this study focused on analyzing differences in risk factors for diabetes and prediabetes between age groups, exploring the interaction between age and the main risk factors for the disease, and identifying differential factors. With the data, community health workers can make more targeted management and prevention of diabetes and prediabetes, achieving better tertiary prevention of diabetes.
Methods
Participants and Research Design
A cluster random sampling method was used to survey residents aged 40 and above in 14 communities in four administrative districts of Shanghai. We recruited 3540 participants with undiagnosed diabetes or prediabetes from February to August 2019. All participants underwent a comprehensive examination, including filling out a detailed questionnaire, physical examination, 75 g oral glucose tolerance test (OGTT), and blood sample collection. After excluding participants whose questionnaires were incomplete or who did not meet the age requirements, the data from 2776 participants were eventually included in the statistical analysis. All participants were divided into two groups according to the following criteria: middle-aged (40–59 years old) and elderly (60–80 years old) (Figure 1).
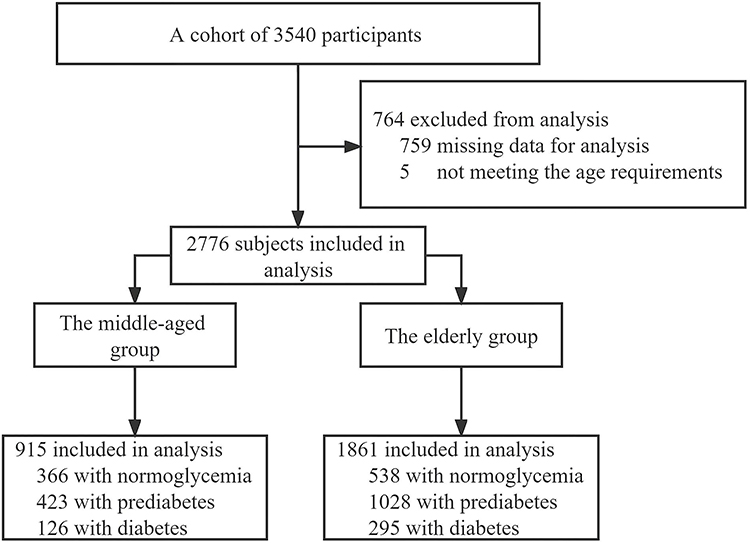 |
Figure 1 Participants selection flow diagram. |
The Ethics Committee of Shuguang Hospital, affiliated with the Shanghai University of Traditional Chinese Medicine, approved this study, and all participants signed written informed consent. The entire procedure adopted in this study was in accordance with the World Medical Association Declaration of Helsinki.
Procedures and Measurements
The questionnaires were used to collect information on socio-demographic characteristics (age, sex, and education level), lifestyle characteristics (smoking and alcohol consumption), personal medical history (hypertension and dyslipidemia), and family history of diabetes. In physical examinations, systolic blood pressure (SBP), diastolic blood pressure (DBP), weight, and height were measured according to standard protocols.8 Body mass index (BMI) was calculated as weight in kilograms divided by height in meters squared (kg/m2).
The laboratory indexes comprise fasting plasma glucose (FPG), 2-h postprandial plasma glucose (2-h PG), glycated hemoglobin A1c (HbA1c), fasting insulin (FINS), triglycerides (TG), total cholesterol (TC), high-density lipoprotein cholesterol (HDL-C), low-density lipoprotein cholesterol (LDL-C), serum creatinine (SCr), and serum uric acid (SUA). HbA1c was measured using high-performance liquid chromatography performed on an automatic analyzer (Tosoh HLC-723 G8, Japan). The remaining items were measured using an automatic biochemistry analyzer (Roche Cobas E602/E702, Switzerland). The homeostasis model assessment of insulin resistance was used to determine the insulin resistance, which could be defined as [fasting insulin (mIU/l) * fasting glucose (mmol/l)]/22.5.
Diagnostic Criteria
Diagnosis of diabetes mellitus: The diagnostic criteria issued by the American Diabetes Association (ADA) were used to identify:9 FPG ≥ 7.0 mmol/l, OGTT 2-h PG ≥ 11.1 mmol/l, and HbA1c ≥ 6.5%.
Diagnosis of prediabetes mellitus: Based on the definition of prediabetes of the ADA,10 any of these three aspects could be used to judge: either impaired fasting glucose (IFG) (FPG ≥ 5.6 and ≤ 6.9 mmol/l and glucose tolerance test 2-h PG < 7.8 mmol/l) or impaired glucose tolerance (IGT) (glucose tolerance test 2-h PG ≥ 7.8 and < 11.1 mmol/l and FPG < 5.6 mmol/l) or HbA1c 5.7%–6.4%. Hypertension was defined11 as SBP ≥ 140 mmHg and DBP ≥ 90 mmHg, both of which should be measured repeatedly and the average calculated separately. Reference range of FINS: 17.80–173.00 pmol/l and SCr: 57–97 µmol/l. According to the Chinese national standard, overweight was defined as 24 ≤ BMI < 28, and obesity, BMI ≥ 28 for statistical analysis.2 Dyslipidemia: TC > 5.18 mmol/L, TG > 1.70 mmol/L, HDL-C < 1.04 mmol/L, and LDL-C > 3.37 mmol/L.12 Hyperuricemia was defined as a uric acid level of > 420 µmol/L.13
Statistical Analysis
SPSS 25.0 was used to process and analyze all statistics. Measurement data for normally distributed continuous variables were expressed as means ± standard deviations, and the Student’s t-test method was used for inter-group comparison. Data for other continuous variables were indicated as medians with interquartile ranges in parentheses, and comparisons between groups were made non-parametrically. In addition, categorical variables were expressed as frequencies and composition ratios, and intergroup comparison was conducted using a chi-square test. Considering the possible confounding factors in the sample, we used propensity score analysis to control the interference of confounding factors on the study’s results and reduce bias. Multivariate logistic regression analysis was used to assess the risk factors for diabetes and prediabetes in middle-aged and elderly groups separately. Variables with P-values < 0.05 in the baseline analysis were first diagnosed for multicollinearity, and those with strong covariance with other variables were excluded. Then, the rest were included in the regression model using the stepwise regression method. In addition, when performing logistic regression analysis, the continuous variables TG, TC, HDL-C, LDL-C, and SUA were stratified and converted into categorical variables for analysis. Finally, the interaction between age and other risk factors was analyzed to identify differences in risk factors between age groups. Statistical significance was set at P-values < 0.05.
Results
Analysis of Baseline Data
This study recruited 3540 participants. After eliminating participants without complete information or meeting the age requirement, 2776 participants were finally analyzed statistically (Table 1). This study included 915 (33.0%) middle-aged and 1861 (67.0%) elderly people. Distributional differences were observed in the normoglycemic, prediabetic, and diabetic groups in socio-demographic factors and clinical characteristics (P < 0.05).
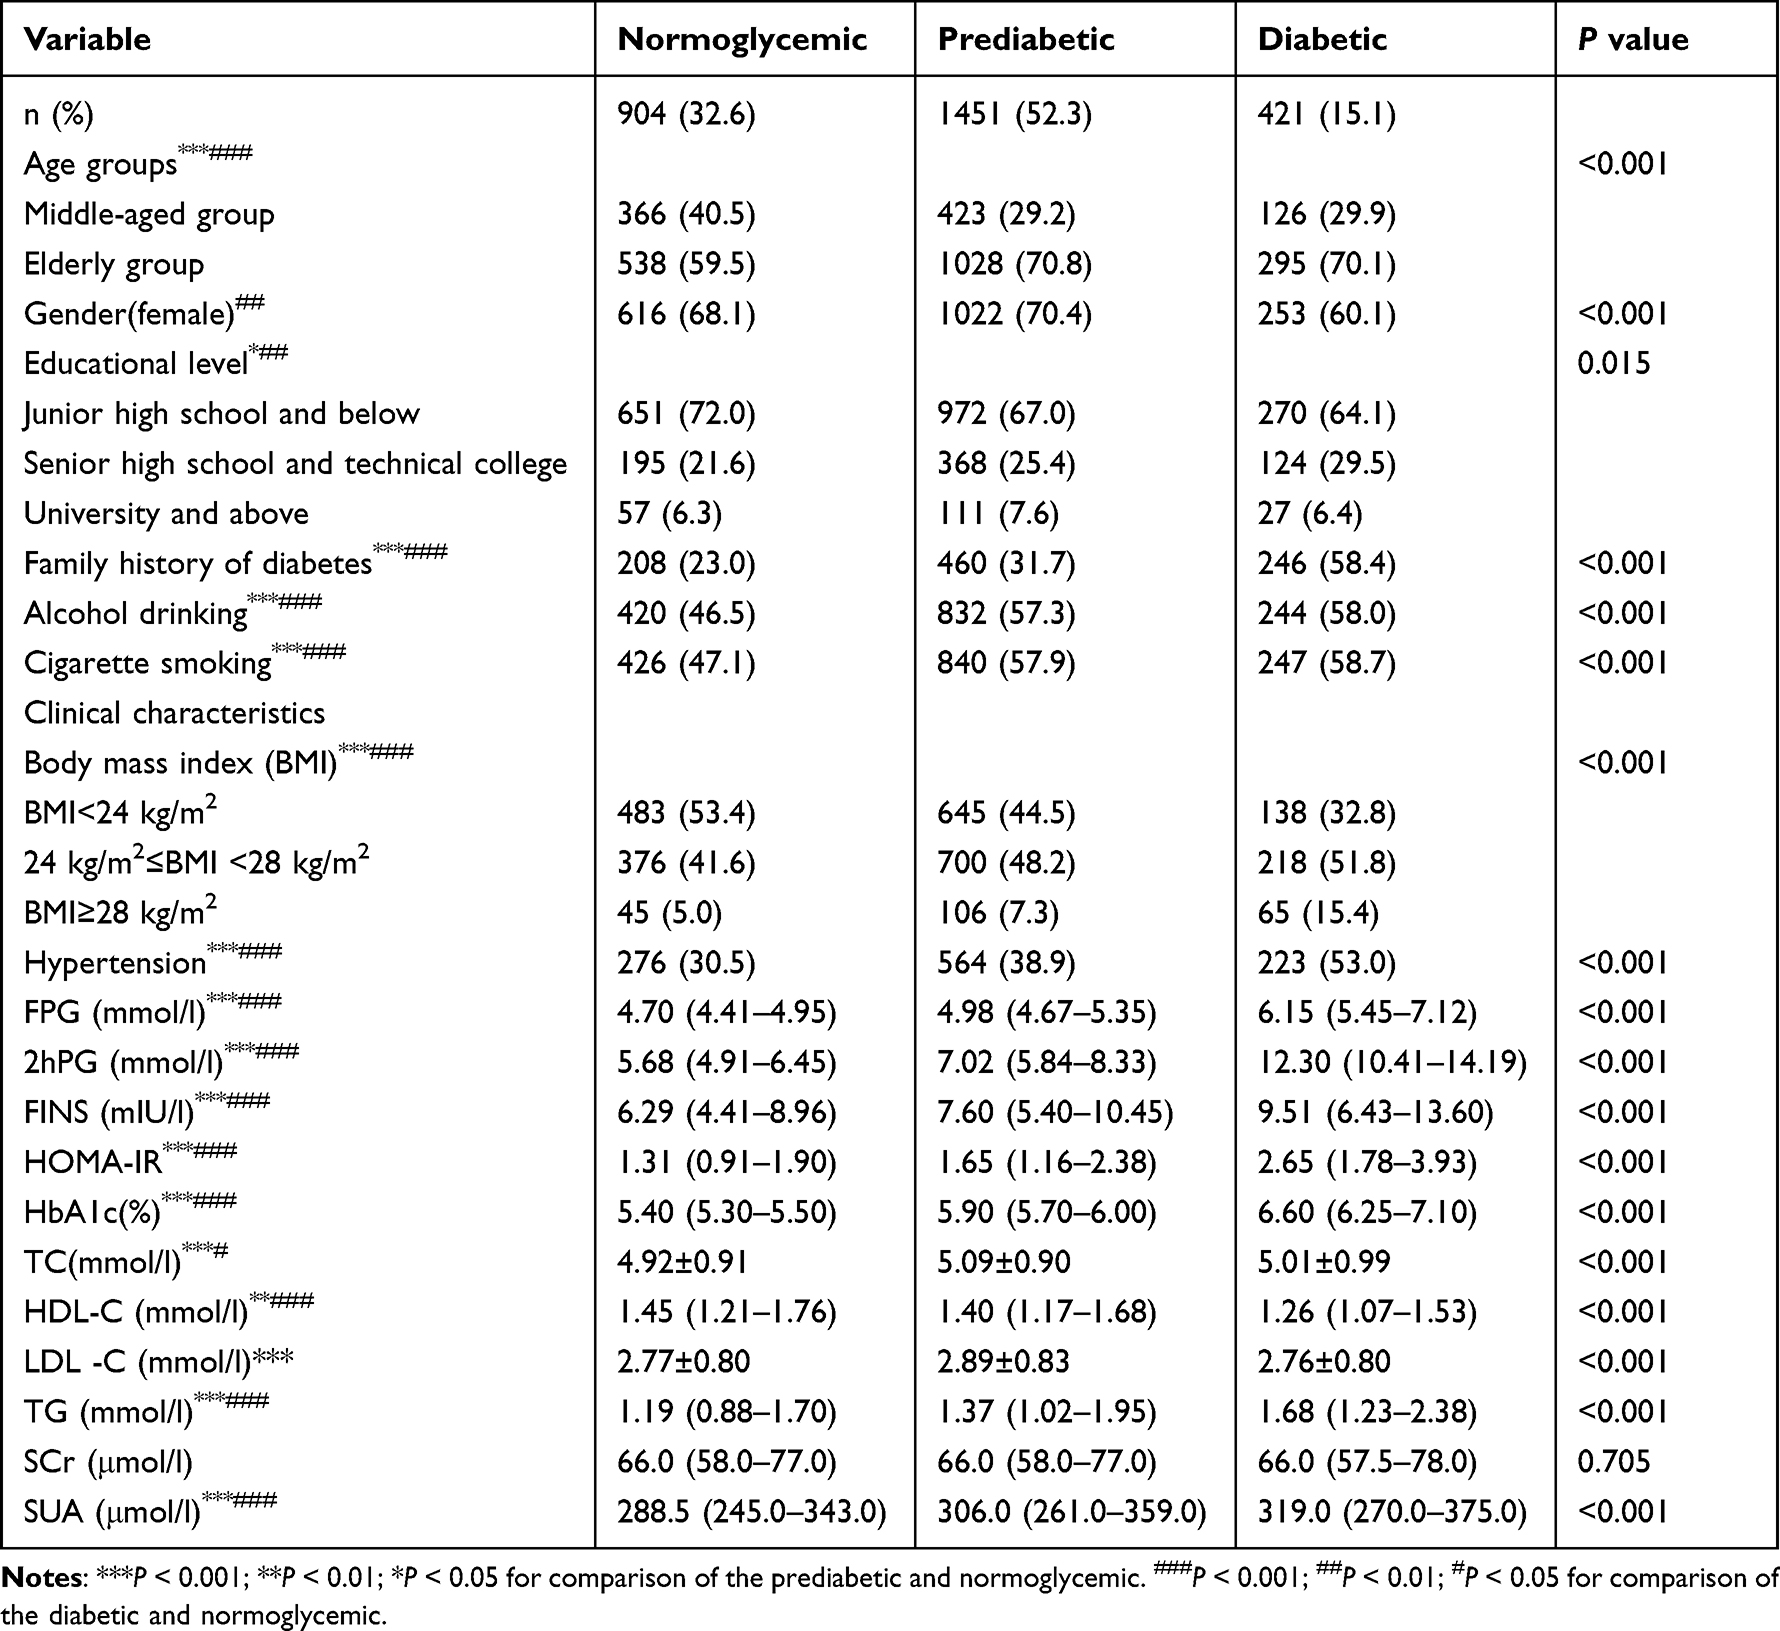 |
Table 1 General Characteristics of Study Participants |
The Effect of Age on the Prevalence of Diabetes and Prediabetes
We used propensity score matching to reduce confounding interference from random sampling (Table 2). In the unmatched state, there were differences between the elderly and middle-aged groups in terms of sexual composition, education levels, hypertension, dyslipidemia, and SCr levels. Univariate logistic regression suggested that the risk of diabetes and prediabetes was significantly higher in the elderly than in the middle-aged group (P <0.001). After matching other influencing factors, the risk of prediabetes in the elderly group dramatically increased than the middle-aged group (Odds ratio = 2.537; 95% confidence interval, 2.015–3.194, P < 0.001). However, the risk of diabetes was not different between the two groups after matching (P > 0.05) (Table 3).
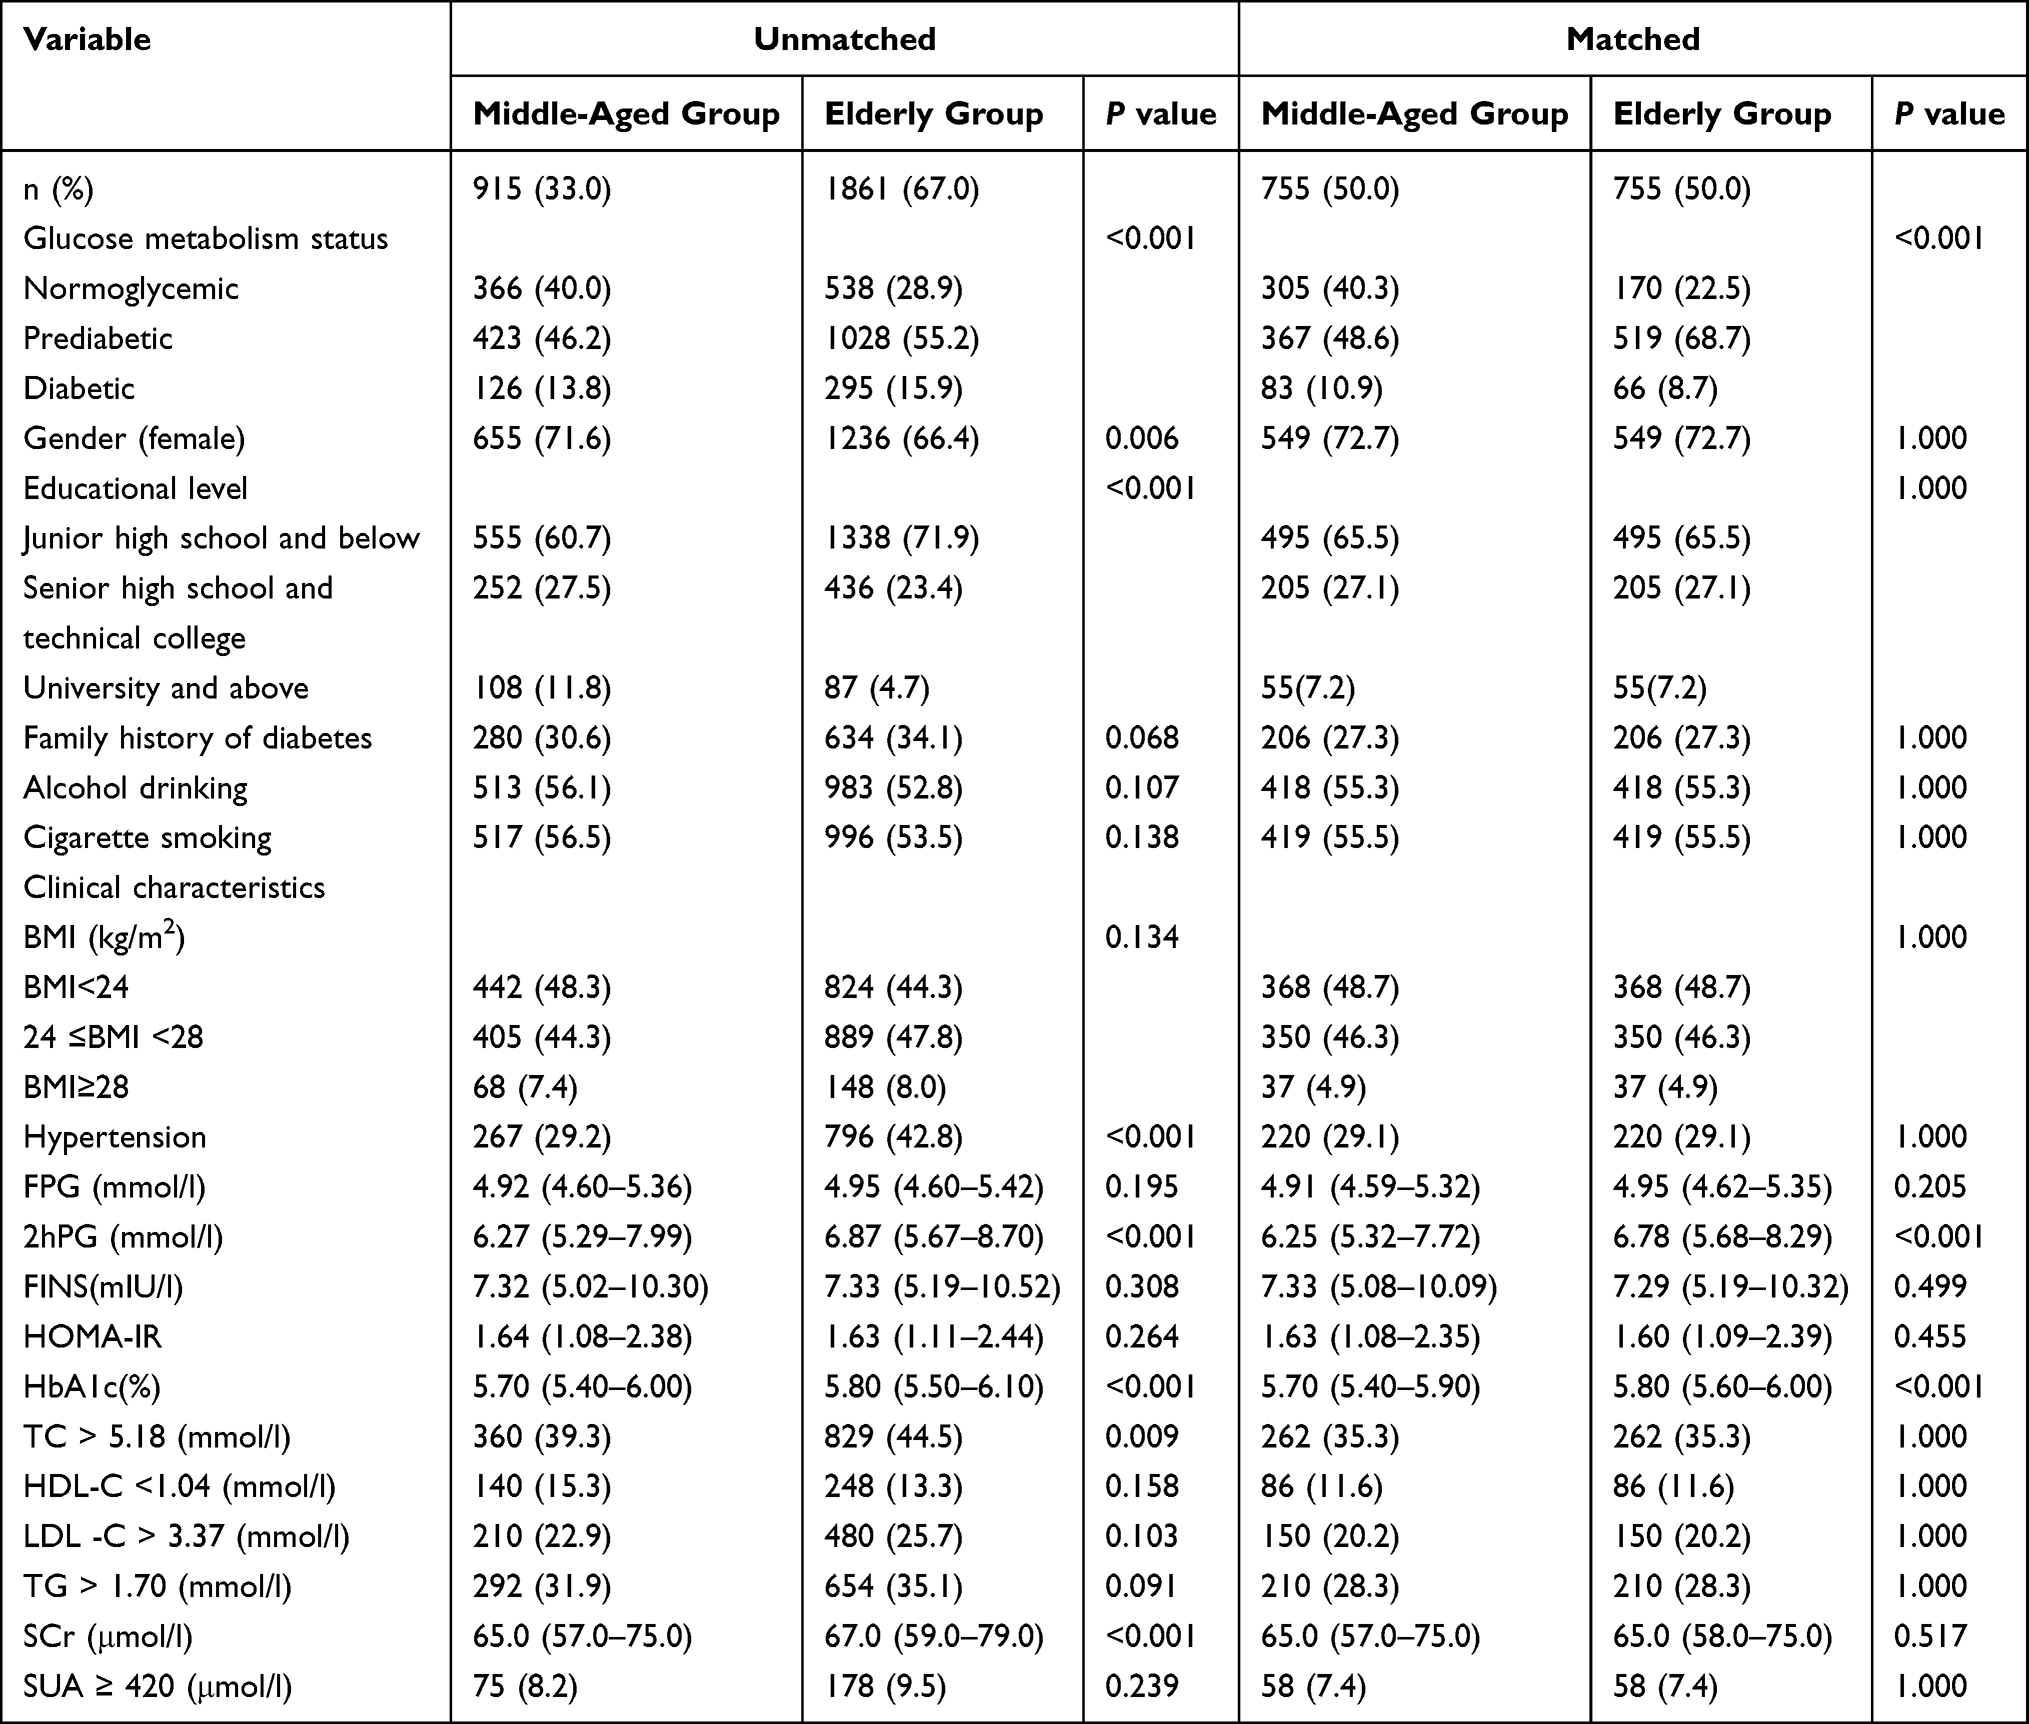 |
Table 2 Characteristics of Participants in Middle-Aged and Elderly Groups |
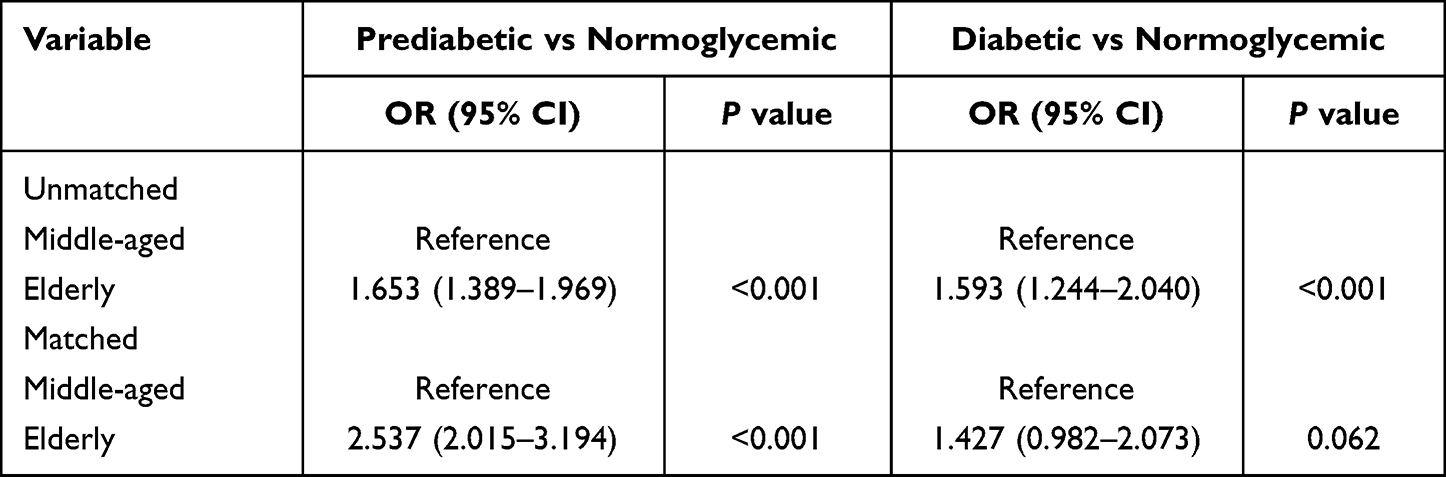 |
Table 3 The Effect of Age on the Risk of Prediabetes and Diabetes |
The Interaction Between Age and Risk Factors for Diabetes and Prediabetes
Logistic regression analysis indicated that females, a higher level of education, overweight and obesity, and a family history of diabetes significantly increased the risk of prediabetes in the elderly group. In contrast, hypertension, a higher level of education, and TC correlated with a greater risk of prediabetes in the middle-aged group (Table 4). In addition, the analysis demonstrated that hypertension, overweight and obesity, a family history of diabetes, a higher level of education, and TG significantly increased the risk of diabetes in the elderly group. Alcohol drinking, hypertension, and a family history of diabetes were associated with a higher risk of diabetes in the middle-aged group (Table 5).
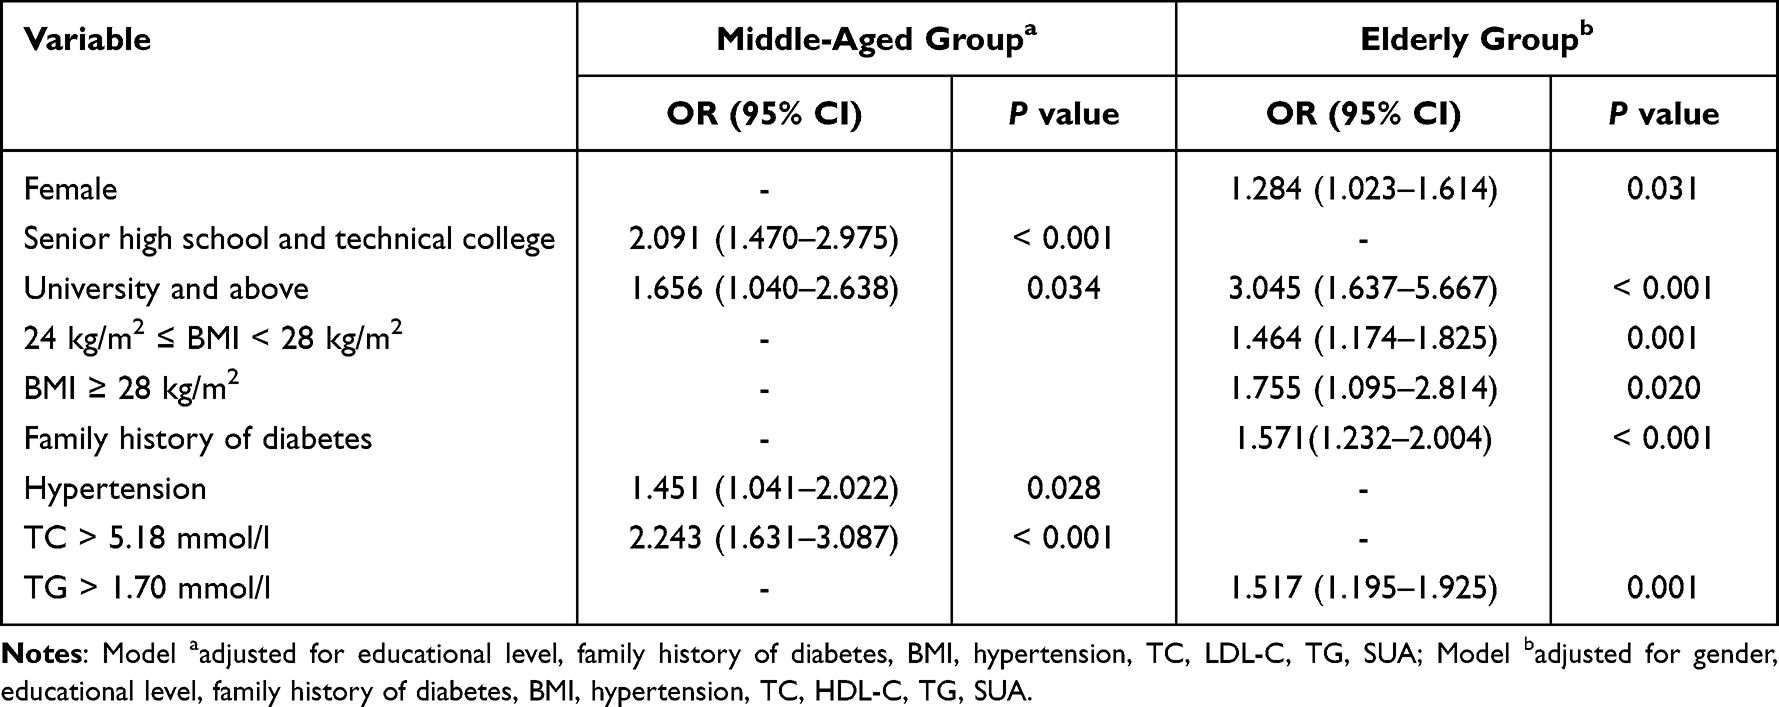 |
Table 4 Risk Factors for Prediabetes in Different Age Groups |
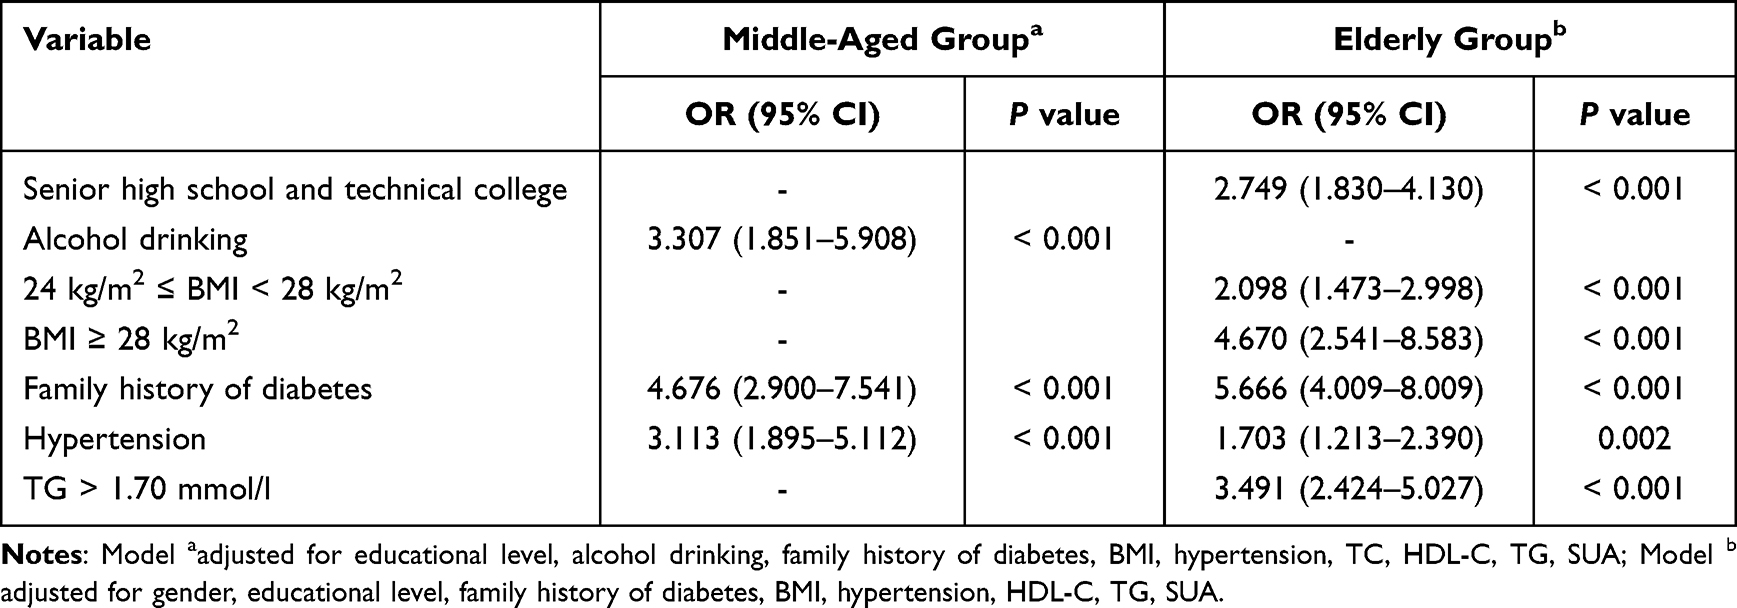 |
Table 5 Risk Factors for Diabetes in Different Age Groups |
We analyzed the interaction between age and other risk factors to illustrate further the effect of age on prediabetes and diabetes risk factors. The results revealed that a high level of education and being overweight influenced the increased risk of diabetes and prediabetes in the elderly group compared to the middle-aged group, respectively (P-interaction 0.039; P-interaction 0.028). In addition, elevated serum cholesterol level was an important factor influencing the increased risk of prediabetes in the middle-aged group compared to the elderly group (P-interaction 0.019) (Table 6).
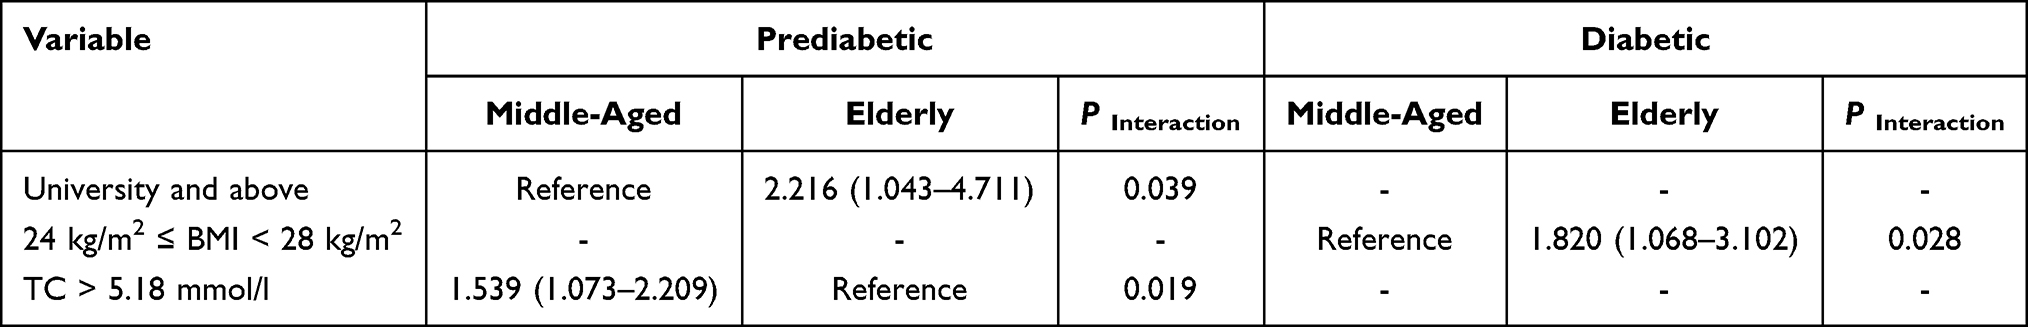 |
Table 6 Interaction of Age with Other Risk Factors |
Discussion
This study was based on a cross-sectional community survey to analyze the interaction between age and risk factors for diabetes and prediabetes and identify differences in risk factors for diabetes in different age groups. The findings suggested that in Shanghai communities, the prevalence of prediabetes (55.2%) and diabetes (15.9%) was higher in the elderly than in the middle-aged group, which was consistent with previous studies.2 Age is an important factor that affects the increased risk of prediabetes and diabetes, based on previous national and international studies.14 After excluding other confounders, age significantly affected the risk of prediabetes.
Similar to previous studies,15,16 our study results revealed that a higher level of education in the elderly group increases the risk of prediabetes and diabetes. However, some studies have presented the opposite conclusion: lower education level as a risk factor for prediabetes and diabetes.17,18 People with high levels of education mostly had a better understanding of the disease and could control their blood glucose adequately. Moreover, the various education level also influenced patients’ jobs and income, so these socioeconomic factors affected the participant’s health.19,20 Therefore, different results might occur when variables interfere with each other.
Being overweight and obese, defined by BMI, are risk factors for prediabetes and diabetes.21 Previous studies have reported that high BMI increases the risk of developing type 2 diabetes in the elderly,22,23 consistent with our study results. In addition, due to increased age, hormonal changes, and a sedentary lifestyle, the elderly population are more prone to sarcopenic obesity and increased insulin resistance than the middle-aged group, increasing the risk of diabetes.24
Diabetes is closely related to dyslipidemia; hence, patients with type 2 diabetes usually present with low HDL, increased TG, and elevated levels of small, dense LDL.25 As a serum indicator, TG could be used to predict the risk of diabetes;26 hence, elevated TG levels increase the risk of prediabetes.27 In our study, elevated TG levels only increased the risk of prediabetes and diabetes in the elderly group because aging caused elevated serum TG levels and changed TG metabolism in the body. This made the elderly more likely to develop metabolic-related diseases than younger people, including diabetes, metabolic syndrome, and non-alcoholic fatty liver disease.28 In addition, our study discovered that abnormally elevated TC levels in the blood are a risk factor for increased risk of prediabetes in the middle-aged group. However, the related association was not observed in the elderly group. A longitudinal analysis revealed that TC increased with age, peaking around middle age and then declining.29 Therefore, we speculated that abnormal TC levels had a negligible effect on diabetes in the elderly because their TC levels presented an overall downward trend with age in physiological conditions.
In conclusion, this study demonstrated the relationship between age and risk factors for diabetes and prediabetes, comparing differences in the characteristics of middle-aged and elderly groups, unlike most previous epidemiological investigations on diabetes and prediabetes in Shanghai. However, this study had some limitations. First, this study was a cross-sectional survey; therefore, it could not assess the causal relationship between risk factors and diabetes. Second, there were some omissions in the socio-demographic information and clinical characteristics of the participants, and there was still room to improve the analytical model for risk factors. Finally, the models relating to interaction studies could be further deepened and improved. Therefore, we will conduct a community-based prospective cohort study to determine the effect of different exposure factors on different age groups with prediabetes and diabetes.
Conclusion
We confirmed an interaction between age and other influencing factors, which may be important in explaining the differences in risk factors for diabetes and prediabetes in the middle-aged and elderly populations. Based on our findings, community health facilities can provide health guidance for different age groups to achieve precise prevention and control of prediabetes and diabetes.
Data Sharing Statement
The data that support the findings of this study are available within the article.
Acknowledgments
The author gratefully acknowledges the Shuguang Hospital Affiliated to Shanghai University of Traditional Chinese Medicine.
Author Contributions
All authors made a significant contribution to the work reported, whether that is in the conception, study design, execution, acquisition of data, analysis and interpretation, or in all these areas; took part in drafting, revising or critically reviewing the article; gave final approval of the version to be published; have agreed on the journal to which the article has been submitted; and agree to be accountable for all aspects of the work.
Funding
This research was supported by the Scientific Research Project of Shanghai Science and Technology Committee (No.17401970100, No.21S21900700), Shanghai Key Laboratory of Traditional Chinese Clinical Medicine (No.20DZ2272200), Shanghai Key Clinical Departments-Chinese Medicine Endocrinology (No.shslczdzk05401).
Disclosure
The authors declare that they have no conflicts of interest.
References
1. Sun H, Saeedi P, Karuranga S., et al. IDF Diabetes Atlas: global, regional and country-level diabetes prevalence estimates for 2021 and projections for 2045. Diabetes Res Clin Pract. 2022;183:109–119. doi:10.1016/j.diabres.2021.109119
2. Wang L, Peng W, Zhao Z, et al. Prevalence and Treatment of Diabetes in China, 2013–2018. JAMA. 2021;326(24):2498–2506. doi:10.1001/jama.2021.22208
3. Echouffo-Tcheugui JB, Selvin E. Prediabetes and what it means: the epidemiological evidence. Annu Rev Public Health. 2021;42:59–77. doi:10.1146/annurev-publhealth-090419-102644
4. Junker K, Buckley CM, Millar SR, et al. The prevalence and correlates of pre-diabetes in middle- to older-aged Irish adults using three diagnostic methods. PLoS One. 2021;16(6):e0253537. doi:10.1371/journal.pone.0253537
5. Xia M, Liu K, Feng J, et al. Prevalence and Risk Factors of Type 2 Diabetes and Prediabetes Among 53,288 Middle-Aged and Elderly Adults in China: a Cross-Sectional Study. Diabetes Metab Syndr Obes. 2021;14:1975–1985. doi:10.2147/DMSO.S305919
6. Fong HK, Desai R, Faisaluddin M, et al. Sex disparities in cardiovascular disease outcomes among geriatric patients with prediabetes. Prim Care Diabetes. 2021;15(1):95–100. doi:10.1016/j.pcd.2020.06.005
7. Amir R, Suhl S, Alexander CM. Renal Evaluation and Protection. Clin Geriatr Med. 2020;36(3):431–445. doi:10.1016/j.cger.2020.04.004
8. Muntner P, Shimbo D, Carey RM, et al. Measurement of blood pressure in humans: a scientific statement from the American heart association. Hypertension. 2019;73(5):e35–e66. doi:10.1161/HYP.0000000000000087
9. Alberti KG, Zimmet PZ. Definition, diagnosis and classification of diabetes mellitus and its complications. Part 1: diagnosis and classification of diabetes mellitus provisional report of a WHO consultation. Diabet Med. 1998;15(7):539–553. doi:10.1002/(SICI)1096-9136(199807)15:7<539::aid-dia668>3.0.CO;2-S
10. American Diabetes Association. 2. Classification and Diagnosis of Diabetes: standards of Medical Care in Diabetes-2021. Diabetes Care. 2021;44(Suppl 1):S15–S33. doi:10.2337/dc21-S002
11. Unger T, Borghi C, Charchar F, et al. 2020 International Society of Hypertension global hypertension practice guidelines. J Hypertens. 2020;38(6):982–1004. doi:10.1097/HJH.0000000000002453
12. Wang R, Zhang P, Li Z, et al. The prevalence of pre-diabetes and diabetes and their associated factors in Northeast China: a cross-sectional study. Sci Rep. 2019;9(1):2513. doi:10.1038/s41598-019-39221-2
13. Qu J, Dou J, Wang A, et al. Fatty liver index for hyperuricemia diagnosis: a community-based cohort study. BMC Endocr Disord. 2022;22(1):114. doi:10.1186/s12902-022-01030-6
14. Shi M, Zhang X, Wang H. The Prevalence of Diabetes, Prediabetes and Associated Risk Factors in Hangzhou, Zhejiang Province: a Community-Based Cross-Sectional Study. Diabetes Metab Syndr Obes. 2022;15:713–721. doi:10.2147/DMSO.S351218
15. Wang R, Zhang P, Li Z, et al. The prevalence of pre-diabetes and diabetes and their associated factors in Northeast China: a cross-sectional study. Sci Rep. 2019;9(1):2513. doi:10.1038/s41598-019-39221-2
16. Akter S, Rahman MM, Abe SK, et al. Prevalence of diabetes and prediabetes and their risk factors among Bangladeshi adults: a nationwide survey. Bull World Health Organ. 2014;92(3):204–213A. doi:10.2471/BLT.13.128371
17. Song Y, Zhang X, Zhang H, et al. Prevalence of Diabetes and Prediabetes in Adults from a Third-Tier City in Eastern China: a Cross-Sectional Study. Diabetes Ther. 2019;10(4):1473–1485. doi:10.1007/s13300-019-0655-x
18. Yu X, Duan F, Lin D, et al. Prevalence of Diabetes, Prediabetes, and Associated Factors in an Adult Chinese Population: baseline of a Prediabetes Cohort Study. Int J Endocrinol. 2020;2020:8892176. doi:10.1155/2020/8892176
19. Wu H, Bragg F, Yang L, et al. Sex differences in the association between socioeconomic status and diabetes prevalence and incidence in China: cross-sectional and prospective studies of 0.5 million adults. Diabetologia. 2019;62(8):1420–1429. doi:10.1007/s00125-019-4896-z
20. Wu H, Meng X, Wild SH, et al. Socioeconomic status and prevalence of type 2 diabetes in mainland China, Hong Kong and Taiwan: a systematic review. J Glob Health. 2017;7(1):011103. doi:10.7189/jogh.07.011103
21. Wang C, Li J, Xue H, et al. Type 2 diabetes mellitus incidence in Chinese: contributions of overweight and obesity. Diabetes Res Clin Pract. 2015;107(3):424–432. doi:10.1016/j.diabres.2014.09.059
22. Ge Q, Li M, Xu Z, et al. Comparison of different obesity indices associated with type 2 diabetes mellitus among different sex and age groups in Nantong, China: a cross-section study. BMC Geriatr. 2022;22(1):20. doi:10.1186/s12877-021-02713-w
23. Tang ML, Zhou YQ, Song AQ, et al. The Relationship between Body Mass Index and Incident Diabetes Mellitus in Chinese Aged Population: a Cohort Study. J Diabetes Res. 2021;2021:5581349. doi:10.1155/2021/5581349
24. Maliszewska K, Adamska-Patruno E, Krętowski A. The interplay between muscle mass decline, obesity, and type 2 diabetes. Pol Arch Intern Med. 2019;129(11):809–816. doi:10.20452/pamw.15025
25. Bahiru E, Hsiao R, Phillipson D, et al. Mechanisms and Treatment of Dyslipidemia in Diabetes. Curr Cardiol Rep. 2021;23(4):26. doi:10.1007/s11886-021-01455-w
26. Hu H, Wang J, Han X, et al. Prediction of 5-year risk of diabetes mellitus in relatively low risk middle-aged and elderly adults. Acta Diabetol. 2020;57(1):63–70. doi:10.1007/s00592-019-01375-w
27. Zhao M, Lin H, Yuan Y, et al. Prevalence of Pre-Diabetes and Its Associated Risk Factors in Rural Areas of Ningbo, China. Int J Environ Res Public Health. 2016;13(8):808. doi:10.3390/ijerph13080808
28. Spitler KM, Davies BSJ. Aging and plasma triglyceride metabolism. J Lipid Res. 2020;61(8):1161–1167. doi:10.1194/jlr.R120000922
29. Hopstock LA, Bønaa KH, Eggen AE, et al. Longitudinal and secular trends in total cholesterol levels and impact of lipid-lowering drug use among Norwegian women and men born in 1905–1977 in the population-based Tromsø Study 1979–2016. BMJ Open. 2017;7(8):e015001. doi:10.1136/bmjopen-2016-015001
 © 2023 The Author(s). This work is published and licensed by Dove Medical Press Limited. The
full terms of this license are available at https://www.dovepress.com/terms
and incorporate the Creative Commons Attribution
- Non Commercial (unported, 3.0) License.
By accessing the work you hereby accept the Terms. Non-commercial uses of the work are permitted
without any further permission from Dove Medical Press Limited, provided the work is properly
attributed. For permission for commercial use of this work, please see paragraphs 4.2 and 5 of our Terms.
© 2023 The Author(s). This work is published and licensed by Dove Medical Press Limited. The
full terms of this license are available at https://www.dovepress.com/terms
and incorporate the Creative Commons Attribution
- Non Commercial (unported, 3.0) License.
By accessing the work you hereby accept the Terms. Non-commercial uses of the work are permitted
without any further permission from Dove Medical Press Limited, provided the work is properly
attributed. For permission for commercial use of this work, please see paragraphs 4.2 and 5 of our Terms.
Recommended articles
Depression and Associated Risk Factors Among Type 2 Diabetic Patients: A Cross Sectional Study on a Convenience Sample from the Diabetic Center, Khamis Mushait; Saudi Arabia
Abuhegazy H, Mujairi A, Banah F, Agdi Y, Elkeshishi H, Kamel A, Abdullah A, Elsheikh M
Neuropsychiatric Disease and Treatment 2022, 18:1975-1984
Published Date: 31 August 2022
Relationship Between the Triglyceride-Glucose Index and Type 2 Diabetic Macroangiopathy: A Single-Center Retrospective Analysis
Yao H, Sun Z, Yuan W, Shao C, Cai H, Li L, Qian Y, Wang Z
Diabetes, Metabolic Syndrome and Obesity 2022, 15:3483-3497
Published Date: 9 November 2022
Risk Factors and Prediction Nomogram of Cognitive Frailty with Diabetes in the Elderly
Deng Y, Li N, Wang Y, Xiong C, Zou X
Diabetes, Metabolic Syndrome and Obesity 2023, 16:3175-3185
Published Date: 16 October 2023
Knowledge of Cardiovascular Disease Risk Factors and Its Primary Prevention Practices Among the Saudi Public – A Questionnaire-Based Cross-Sectional Study
Bashatah A, Syed W, Al-Rawi MBA
International Journal of General Medicine 2023, 16:4745-4756
Published Date: 20 October 2023
Prevalence and Risk Factors of Diabetes in Patients with Active Pulmonary Tuberculosis: A Cross-Sectional Study in Two Financially Affluent China Cities
Li J, Zhao Y, Jiang Y, Zhang Y, Zhang P, Shen L, Chen Z
Diabetes, Metabolic Syndrome and Obesity 2024, 17:1105-1114
Published Date: 2 March 2024