
Back to Journals » Journal of Multidisciplinary Healthcare » Volume 19
Development and Interpretation of Machine Learning Models for Short-Term Functional Recovery and 90-Day Readmission in Patients with Cardiovascular Disease
Authors Tian J, Tian L, Xie Q  , Zhang S, Li X, Liu S, Zhang H, Feng Y, Shen J
Received 16 May 2026
Accepted for publication 2 July 2026
Published 14 July 2026 Volume 2026:19 625142
DOI https://doi.org/10.2147/JMDH.S625142
Checked for plagiarism Yes
Review by Single anonymous peer review
Peer reviewer comments 2
Editor who approved publication: Professor Charles V Pollack
Jianzhou Tian,1,* Li Tian,1,2,* Qianqian Xie,3 Siru Zhang,3 Xiang Li,3 Shuxin Liu,3 Hualin Zhang,3 Yi Feng,1 Jun Shen1
1Department of Cardiology, Arteriosclerosis Cardiovascular Disease Clinical Medical Research Center of Hubei Province, Renmin Hospital, Hubei University of Medicine, Shiyan, Hubei, 442000, People’s Republic of China; 2School of Nursing, Wuhan University, Wuhan, Hubei, 430071, People’s Republic of China; 3The Third Clinical College, Hubei University of Medicine, Shiyan, Hubei, 442000, People’s Republic of China
*These authors contributed equally to this work
Correspondence: Jun Shen, Email [email protected] Yi Feng, Email [email protected]
Background: Early prediction of functional recovery and post-discharge readmission may support multidisciplinary rehabilitation planning, follow-up stratification, and individualized management in patients with cardiovascular disease (CVD). This study aimed to develop and interpret machine learning (ML) models for predicting 1-week functional recovery and 90-day readmission.
Methods: A total of 553 CVD patients were randomly assigned to a training cohort (n=388) and a test cohort (n=165). Candidate clinical, functional, and laboratory variables were selected using least absolute shrinkage and selection operator regression. Ten ML algorithms were trained and compared: logistic regression, support vector machine, neural network, k-nearest neighbors, decision tree, random forest (RF), gradient boosting machine, light gradient boosting machine, extreme gradient boosting (XGBoost), and naïve Bayes. Model performance was evaluated using area under the receiver operating characteristic curve (AUC), precision–recall curves, calibration curves, decision curve analysis, and confusion matrices. Shapley additive explanations values were used for interpretation, and final models were implemented in a Shiny web application.
Results: Overall, 361 of 553 patients (65.3%) achieved 1-week functional recovery, and 60 patients (10.8%) experienced 90-day readmission. For 1-week functional recovery, XGBoost achieved test-set AUC 0.856, accuracy 77.0%, sensitivity 76.9%, and specificity 77.2%. Key predictors were Barthel Index, New York Heart Association class, creatinine, serum chloride, and serum sodium. For 90-day readmission, RF achieved test-set AUC 0.662, accuracy 90.9%, sensitivity 22.2%, and specificity 99.3%, with creatinine, low-density lipoprotein cholesterol, total cholesterol, C-reactive protein, and creatinine clearance as top predictors.
Conclusion: ML models showed promise for predicting short-term functional recovery in patients with CVD, while prediction of 90-day readmission remained challenging. The Shiny-based dual-outcome tool may serve as a research prototype to support individualized risk estimation, model interpretation, and multidisciplinary post-discharge management, but external validation and prospective evaluation are required before clinical application.
Keywords: cardiovascular disease, machine learning, functional recovery, readmission, multidisciplinary healthcare, SHapley Additive exPlanations
Introduction
Cardiovascular disease (CVD) remains the leading cause of death worldwide and imposes a substantial burden on disability, health-care utilization, and long-term disease management.1–3 According to the World Health Organization, an estimated 19.8 million people died from CVD in 2022, accounting for approximately 32% of all global deaths.1 Beyond mortality, many patients with CVD experience impaired physical function, reduced independence in daily activities, and repeated hospital encounters after discharge. Therefore, early identification of patients at risk for poor functional recovery or subsequent readmission is important to optimize discharge planning, rehabilitation strategies, intensity of follow-up and individualized care.
Functional status is increasingly recognized as an important dimension of prognosis in cardiovascular care. Activity of daily living measures, such as the Barthel Index, reflect a patient’s ability to perform basic self-care tasks and may capture frailty, disease severity and rehabilitation potential beyond traditional biochemical or imaging measures.4–6 Previous studies in patients with heart failure have shown that impairment in activities of daily living is associated with adverse post-discharge outcomes, including readmission and mortality.7–9 We selected 1-week post-discharge functional recovery as an early, clinically actionable endpoint because this period coincides with discharge transition, early rehabilitation planning, nursing follow-up, patient education, and adjustment of home-based support. Patients who remain functionally dependent at this early time point may require intensified rehabilitation, telehealth follow-up, or caregiver support before longer-term deterioration occurs. However, most existing prediction studies have focused on mortality, disease-specific adverse events, or readmission, and short-term functional recovery remains less frequently addressed as a clinically meaningful outcome.
Hospital readmission is another key endpoint in CVD management. Readmissions after discharge place substantial burdens on patients, families, and health-care systems and may reflect disease progression, comorbidity burden, incomplete recovery, and gaps in transitional care. In patients with heart failure, 90-day readmission has been investigated as a clinically relevant outcome, and both conventional statistical models and machine learning (ML) approaches have been applied to predict readmission risk.10–12 Accurate prediction of readmission may assist clinicians in identifying patients who need closer monitoring, medication optimization, rehabilitation support or early outpatient follow-up.
Traditional regression-based models have contributed substantially to cardiovascular risk prediction, but they may be limited in capturing nonlinear relationships, high-dimensional clinical features, and complex interactions among functional, laboratory, and disease-severity indicators. ML provides a flexible framework for integrating heterogeneous clinical data and developing individualized prediction models.10–12 Nevertheless, the clinical use of ML is often constrained by limited interpretability. Explainable artificial intelligence methods, such as SHapley Additive exPlanations (SHAP), can help quantify the contribution of individual predictors to model outputs and improve the transparency of model predictions.13
Despite increasing interest in ML-based cardiovascular risk prediction, limited evidence is available on models that simultaneously address short-term functional recovery and 90-day readmission within an interpretable dual-outcome framework. Existing ML-based cardiovascular prediction studies have most commonly emphasized heart failure readmission, mortality, or disease-specific adverse outcomes, and fewer have linked early functional recovery with post-discharge readmission in a single explainable workflow.10–12,14–18 In addition, explainable artificial intelligence methods such as SHAP may help clinicians understand model outputs at the patient level, thereby improving transparency, acceptance, and communication in multidisciplinary care.13 Prediction models may be more clinically useful when they are not only accurate and interpretable but also accessible through practical decision-support tools.
Therefore, this study aimed to develop, compare, and interpret ML models for predicting 1-week functional recovery and 90-day readmission in patients with CVD. We further used SHAP analysis to identify key predictors and integrated the final models into a Shiny-based web application to support individualized risk estimation, model interpretation, and multidisciplinary post-discharge management.
Methods
Study Design and Data Source
Clinical data were extracted from the hospital electronic medical record system and follow-up records. The cohort included patients hospitalized with CVD rather than a single diagnostic entity. Available disease-related descriptors included arrhythmia type and main admission presentation; their distribution is provided in Supplementary Method S1. Because the source dataset did not contain consistently structured major diagnostic categories with adequate event counts for each subgroup, diagnosis-specific subgroup modelling was not performed.
The study aimed to develop and interpret ML models for predicting two clinically relevant outcomes in patients with CVD: 1-week functional recovery and 90-day readmission. The full dataset was randomly divided into a training cohort and an independent test cohort at a ratio of 7:3 using a fixed random seed. The training cohort was used for variable selection, model development, and hyperparameter tuning. The test cohort was used only for internal independent evaluation after random data splitting.19,20
Study Population
A total of 553 patients with CVD were included in the final analysis, including 388 patients in the training cohort and 165 patients in the test cohort.
Patients were eligible for inclusion if they were hospitalized with a diagnosis of CVD, were aged ≥18 years, and had available baseline demographic, clinical, and laboratory data, admission functional assessment using the Barthel Index, 1-week post-discharge functional assessment, and discharge and follow-up information required to determine 90-day readmission. Patients were excluded if they had missing outcome information for 1-week functional recovery or 90-day readmission, missing essential baseline clinical or laboratory variables, unavailable or invalid discharge or readmission date records, repeated hospitalizations during the study period without a clearly defined index hospitalization, or severe data inconsistency or obvious recording errors after data verification.
Study Outcomes
Two binary outcomes were defined before model development. The first outcome was 1-week functional recovery. Functional status was assessed using the Barthel Index 1 week after discharge. The Barthel Index is a common measure of independence in activities of daily living, ranging from 0 to 100, with higher scores indicating higher levels of functional independence. In this study, patients with a Barthel Index score of 85 or higher at 1 week after discharge were considered to have reached functional recovery and those with a score below 85 were considered not to have reached functional recovery. This threshold was prespecified to represent recovery to a high level of independence in basic activities of daily living while retaining sufficient outcome events for model development; it was supported by the established use of the Barthel Index for grading functional independence.4–6 The second outcome was 90-day readmission. Readmission was defined as any documented rehospitalization within 90 days after discharge. The time from discharge to readmission was calculated based on the discharge date and readmission date. Patients with a readmission interval of 0 to 90 days were classified as having 90-day readmission, and patients with no readmission during this period were classified as not having 90-day readmission.
Candidate Predictors and Data Preprocessing
Candidate predictors were limited to baseline or admission-related variables to minimize the risk of information leakage. Demographic characteristics, comorbidities, cardiac function indicators, laboratory measurements, and functional assessment at admission were taken as candidate predictors. Variables directly related to outcome definition or post-discharge information, including discharge date, readmission date, time to readmission, discharge Barthel Index score, 1-week post-discharge Barthel Index score, and outcome variables, were excluded from the predictor set.19,20
The candidate predictors included sex, age, body mass index (BMI), New York Heart Association (NYHA) functional class, left ventricular ejection fraction (LVEF), N-terminal pro-B-type natriuretic peptide (NT-proBNP), troponin, creatinine, haemoglobin, total protein, creatinine clearance, uric acid, C-reactive protein (CRP), serum sodium, serum potassium, admission Barthel Index score, hypertension, diabetes mellitus, smoking, drinking, disease duration, thyroxine, glycated albumin, serum chloride, blood glucose, triglycerides, total cholesterol, low-density lipoprotein cholesterol (LDL-C), and high-density lipoprotein cholesterol (HDL-C).
All preprocessing procedures were performed using the training cohort and then applied to the test cohort. Missing-data patterns before imputation were summarized for each candidate predictor and are provided in Supplementary Method S2. Continuous variables with missing values were imputed using the median value derived from the training cohort, and categorical variables were imputed using the most frequent category in the training cohort. The categorical variables were recoded into dummy variables according to the training cohort, and the same dummy variable structure was applied to the test cohort. Near-zero variance predictors were removed before model fitting.
Variable selection was performed using least absolute shrinkage and selection operator (LASSO) regression.21 The penalty parameter was selected by 10-fold cross-validation, and the lambda.1se criterion was used to obtain a more parsimonious predictor set. Variables retained by LASSO regression were used for subsequent ML model development. If no variable was retained, the full baseline predictor set was used for modelling.
Model Development
For each outcome, 10 candidate ML algorithms were trained and compared: logistic regression, support vector machine, neural network, k-nearest neighbours, decision tree, random forest (RF), gradient boosting machine, light gradient boosting machine (LightGBM), extreme gradient boosting (XGBoost), and naïve Bayes.22–24
For caret-based models, repeated cross-validation was performed using 5-fold cross-validation repeated 5 times.25 Hyperparameter tuning was conducted within the training-cohort resampling procedure, and the test cohort was not used during tuning or model selection. A fully nested outer cross-validation procedure was not performed; therefore, possible optimism from model-selection procedures was considered when interpreting the results. The area under the receiver operating characteristic curve (AUC) was used as the primary optimization metric. XGBoost and LightGBM were trained using binary classification objectives with AUC as the evaluation metric. Predicted probabilities for the positive outcome class were generated for both the training and test cohorts.
For the imbalanced 90-day readmission endpoint, synthetic oversampling methods such as SMOTE were not applied because the number of readmission events was small and oversampling could generate artificial clinical profiles that may not reflect the observed cohort. Instead, model performance was evaluated with PR-AUC, sensitivity, specificity, confusion matrices, calibration, and decision curve analysis, and the limited sensitivity of the readmission model was interpreted cautiously.
The candidate models were compared according to discrimination, calibration, decision curve analysis, classification performance, and interpretability. Final model selection was based on comprehensive performance rather than test-set AUC alone. Specifically, discrimination, sensitivity, specificity, positive predictive value, precision–recall performance, Brier score, calibration, clinical utility, interpretability, and feasibility for web-based implementation were considered.
Development of the Web-Based Risk Calculator
To facilitate individualized risk prediction, the final models were integrated into a Shiny-based web application. The calculator was designed to estimate the predicted probabilities of 1-week functional recovery and 90-day readmission based on patient-level clinical variables.
For each outcome, users can enter the required predictor values through an interactive interface. The web application applies the same preprocessing workflow used during model development, including missing-value handling, dummy-variable transformation, and alignment of predictor variables with the model input structure. The fitted models then generate individualized predicted probabilities for the positive outcome class.
In addition to risk prediction, the application provides model interpretation outputs based on SHAP. These outputs include global predictor importance plots, SHAP beeswarm plots, and SHAP dependence plots. The calculator was developed to improve the accessibility, transparency, and practical usability of the prediction models.
Statistical Analysis
All statistical analyses and model development procedures were performed using R software. Baseline characteristics were summarized separately for the training and test cohorts. Continuous variables were summarized as mean with standard deviation, and categorical variables were summarized as frequencies and percentages. Between-group comparisons were performed to assess baseline balance between the training and test cohorts.
For model evaluation, discrimination, calibration, classification performance, clinical usefulness, and interpretability were assessed as described above. The 95% confidence intervals (CIs) for AUC were calculated using the DeLong method.26 All statistical tests were two-sided where applicable, and a P value less than 0.05 was considered statistically significant. Detailed preprocessing procedures, model development workflow, hyperparameter settings, and R packages used for analysis are provided in Supplementary File S1.
Ethics Approval and Consent to Participate
This study was approved by the Medical Ethics Committee of Renmin Hospital, Hubei University of Medicine (approval number: SYSRMYY-KYXS-2022-073). The study site was Shiyan Renmin Hospital. The study was conducted in accordance with the Declaration of Helsinki. Because this was a retrospective study using routinely collected clinical data, the requirement for written informed consent was waived by the ethics committee.
Results
Study Population and Baseline Characteristics
As shown in Figure 1, a total of 553 eligible patients were included in this study and randomly assigned to the training cohort (n = 388, 70.2%) and the independent testing cohort (n = 165, 29.8%). For the 1-week functional recovery endpoint, 253 patients (65.2%) in the training cohort and 108 patients (65.5%) in the testing cohort achieved functional recovery. For the 90-day readmission endpoint, 42 patients (10.8%) in the training cohort and 18 patients (10.9%) in the testing cohort experienced readmission, indicating a relatively low event rate and class imbalance for this outcome.
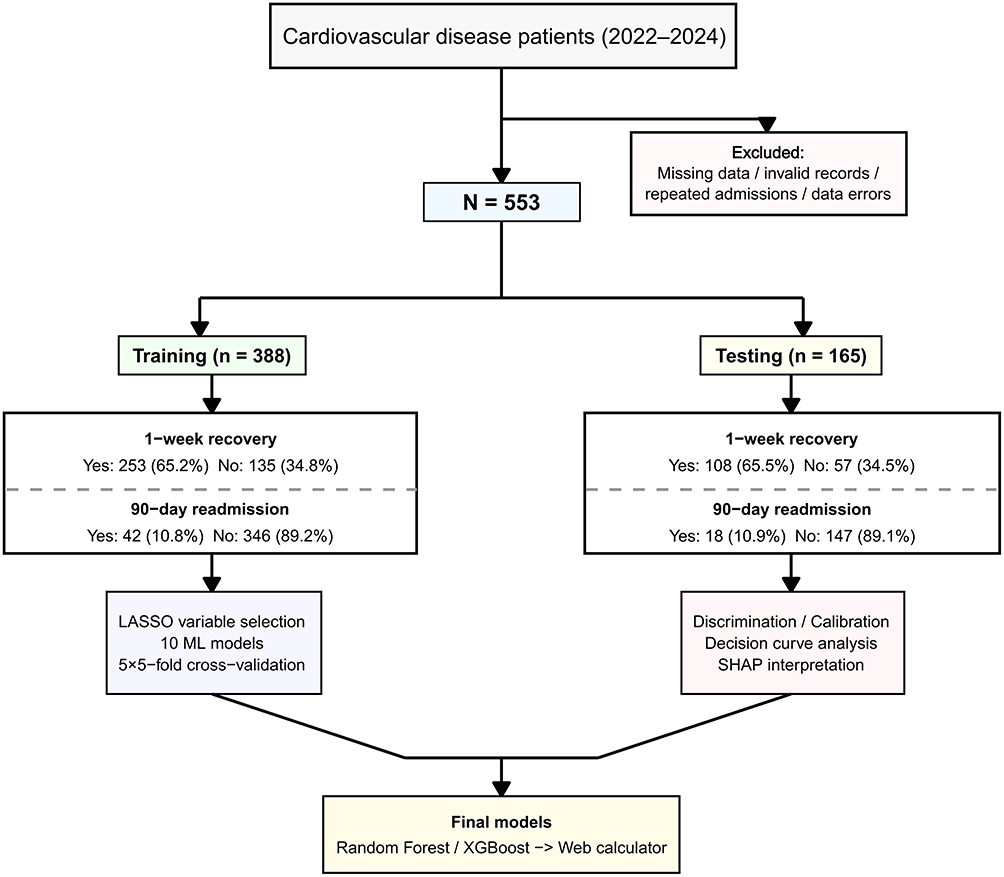 |
Figure 1 Study flow diagram. Flowchart of patient inclusion, cohort allocation, model development, and model evaluation. A total of 553 patients with cardiovascular disease hospitalized between 2022 and 2024 were included after excluding records with missing data, invalid information, repeated admissions, or data errors. Patients were randomly divided into a training cohort of 388 patients and an independent testing cohort of 165 patients. The distributions of 1-week functional recovery and 90-day readmission are shown separately for the training and testing cohorts. The workflow also summarizes LASSO-based variable selection, training of 10 machine learning models with repeated cross-validation, model evaluation using discrimination, calibration, decision curve analysis, SHAP interpretation, and final deployment of the selected Random Forest and XGBoost models in a web calculator. |
Baseline demographic characteristics, clinical features, comorbidities, cardiac function indicators, laboratory indices, and admission Barthel Index scores were comparable between the training and testing cohorts for both endpoints. No statistically significant between-cohort differences were observed across the examined variables (all P > 0.05). Standardized mean differences were also small for the examined baseline characteristics, with all key variables below 0.20, supporting acceptable balance between the development and testing cohorts (Table 1).
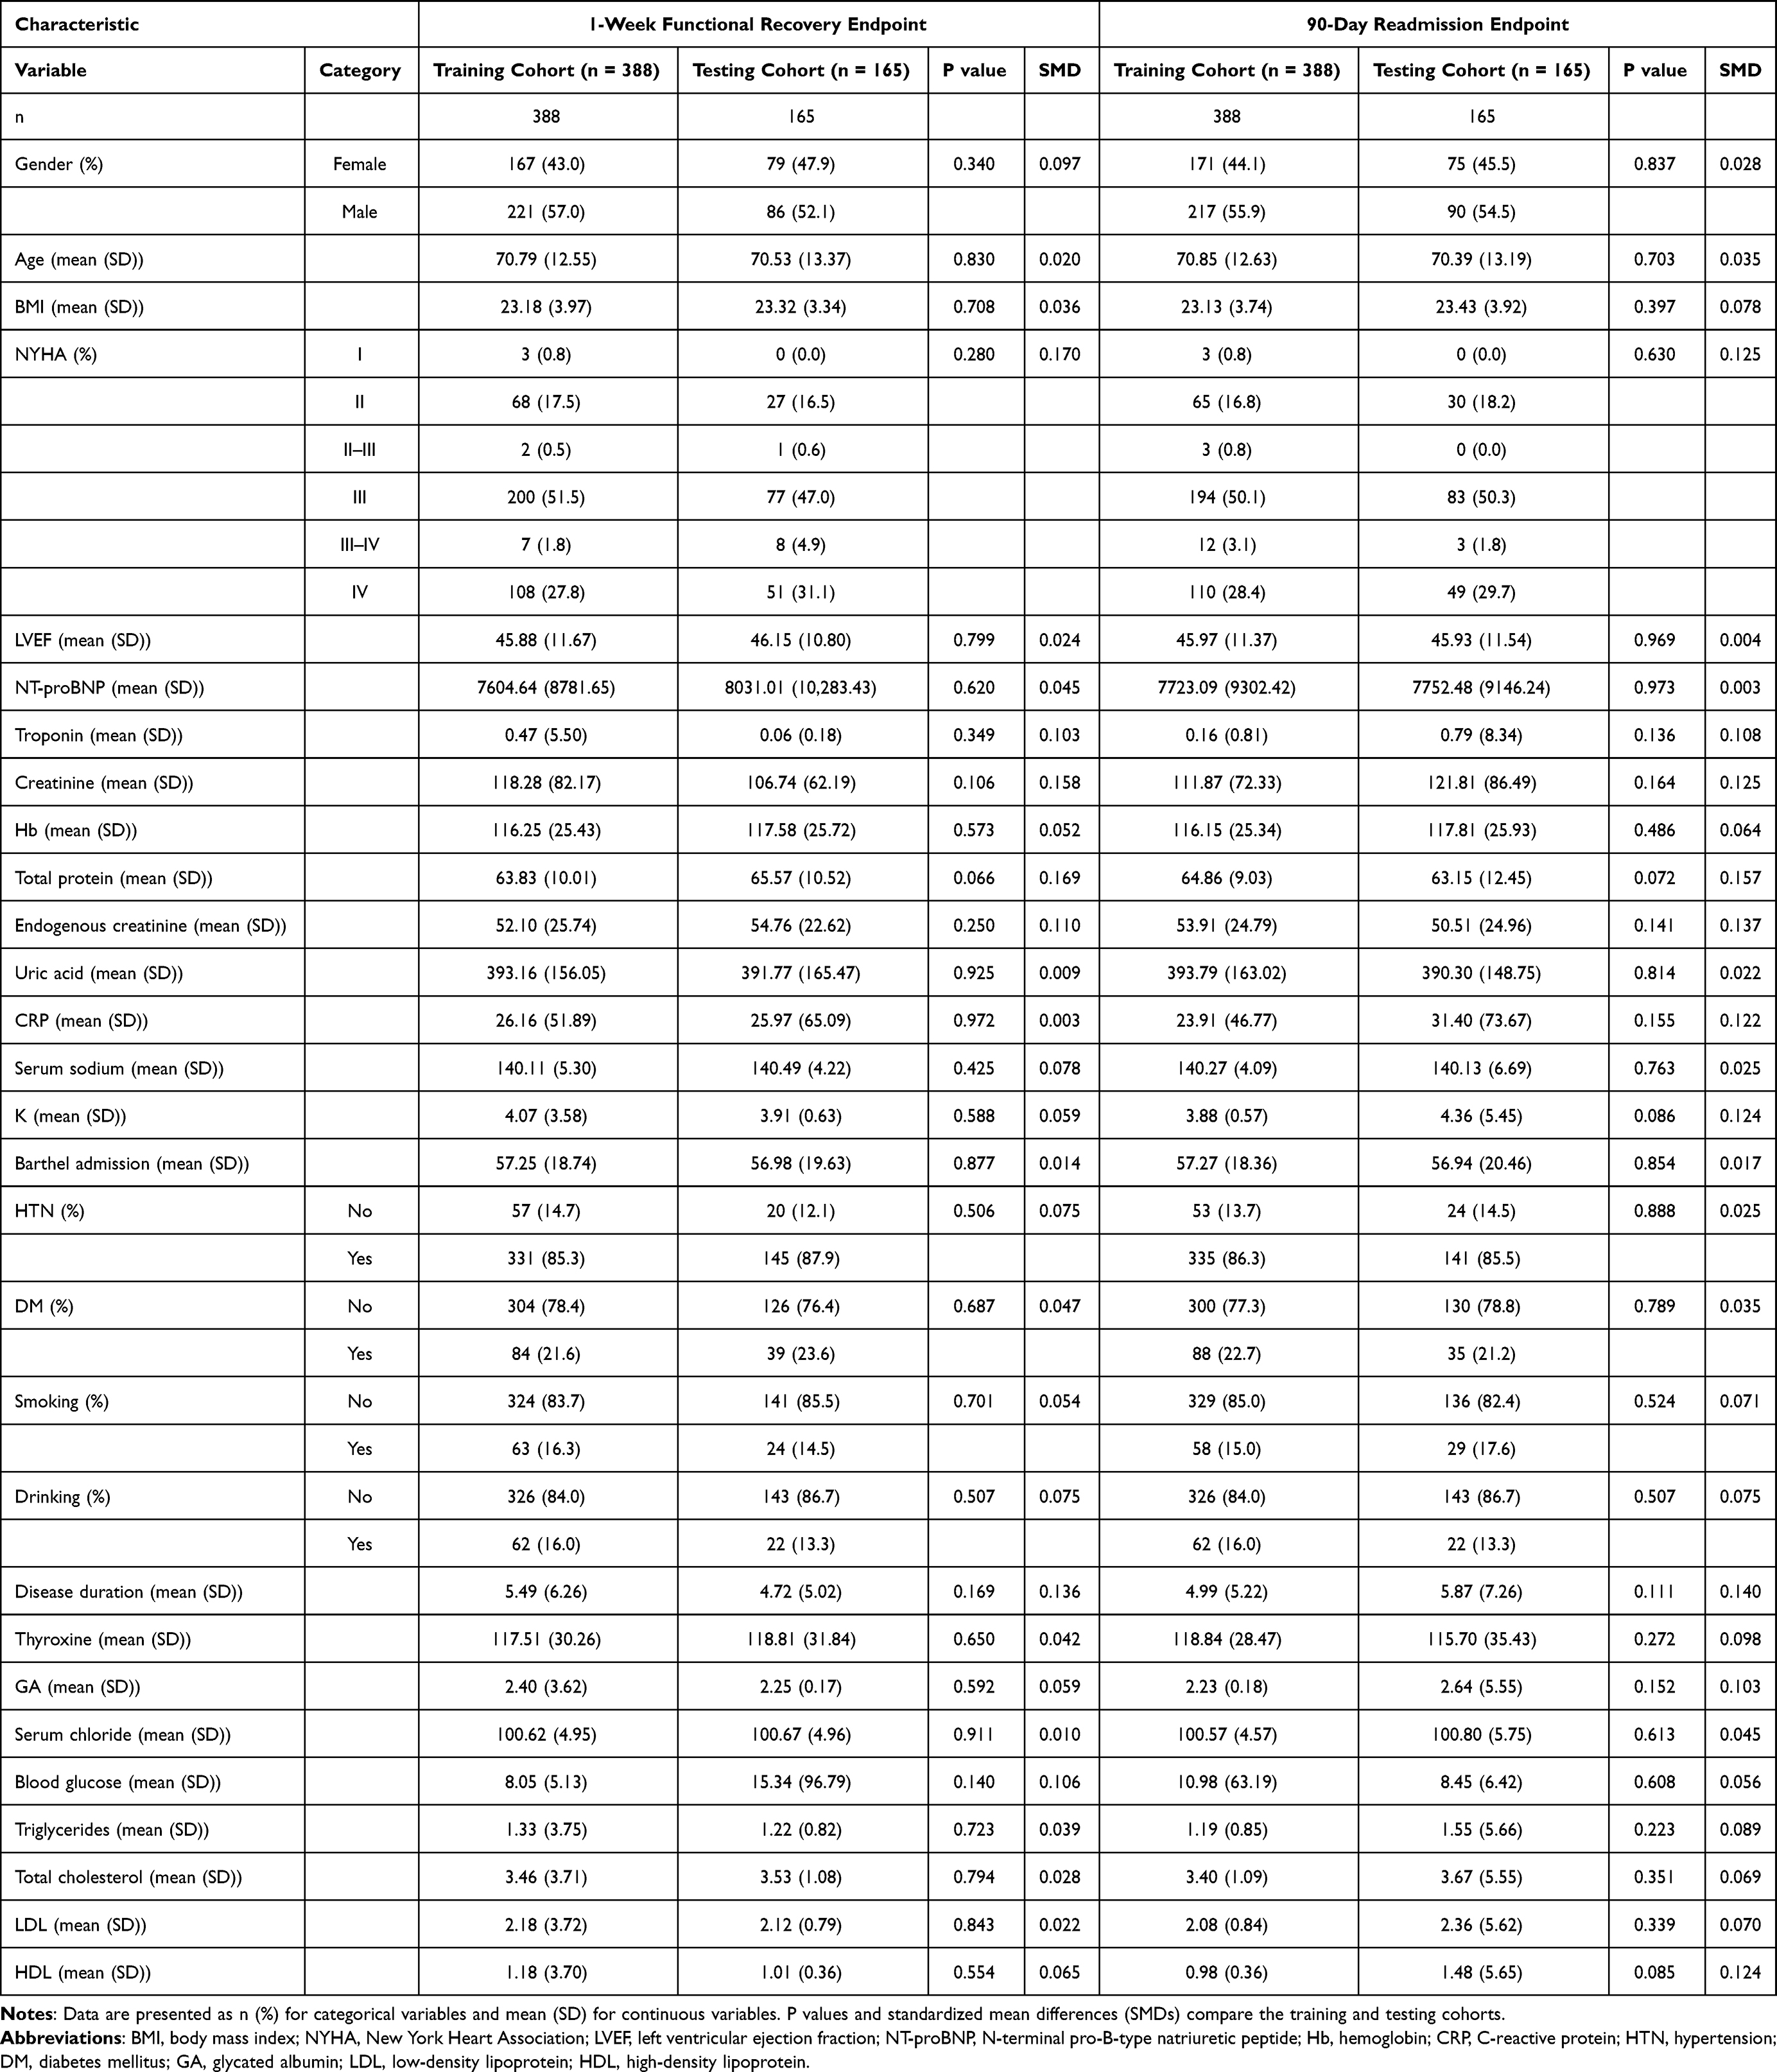 |
Table 1 Baseline Characteristics of the Training and Testing Cohorts |
Feature Selection and Candidate Predictors
For prediction of 1-week functional recovery, LASSO regression retained five predictors: NYHA functional class, serum creatinine, serum sodium, admission Barthel Index score, and serum chloride (Figure 2 and Supplementary Table S1). These variables reflected baseline cardiac functional status, renal function, electrolyte balance, and functional dependency at admission.
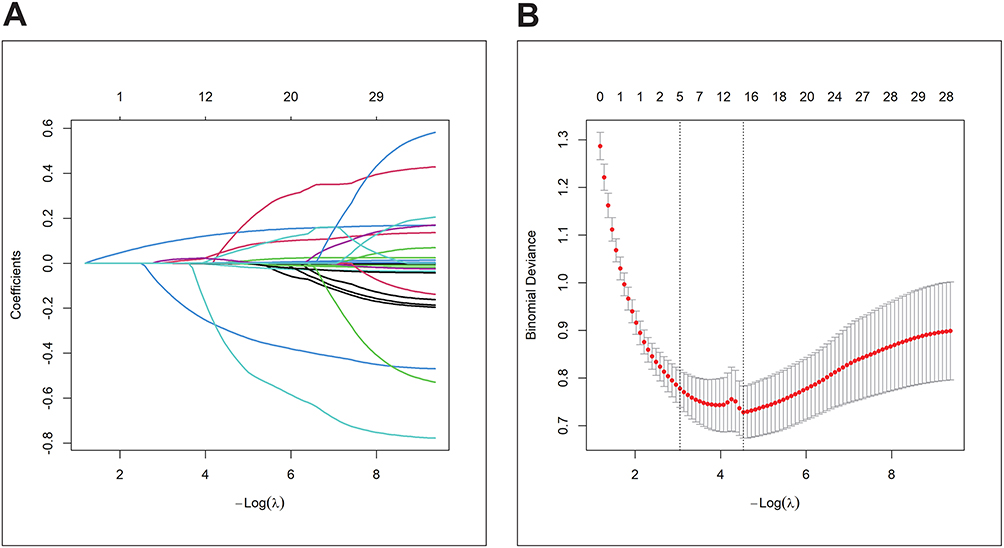 |
Figure 2 LASSO regression for feature selection. LASSO regression was used to select candidate predictors for model development. (A) Coefficient profiles of candidate variables across different values of the regularization parameter λ. As the penalty increased, less informative coefficients were gradually shrunk toward zero. (B) Cross-validation curve showing binomial deviance according to log(λ). The vertical dotted lines indicate the selected λ values based on cross-validation criteria. Variables retained under the selected penalty were used as the final candidate predictors for subsequent machine learning model construction. |
For prediction of 90-day readmission, the modelling feature set included sex, age, BMI, NYHA functional class, LVEF, NT-proBNP, troponin, serum creatinine, hemoglobin, total protein, creatinine clearance, uric acid, CRP, serum sodium, serum potassium, admission Barthel Index score, hypertension, diabetes mellitus, smoking status, drinking status, disease duration, thyroxine, glycated albumin, serum chloride, blood glucose, triglycerides, total cholesterol, LDL-C, and HDL-C. In the penalized coefficient output for the readmission endpoint, only the intercept was retained, suggesting limited linear penalized signal under the selected regularization setting. Therefore, subsequent model development for this endpoint was performed using the full baseline predictor set, and model interpretation was based on the final RF model and SHAP analysis (Supplementary Table S2).
Performance of Machine Learning Models for 1-Week Functional Recovery
The discrimination performance of all ML models for predicting 1-week functional recovery in the independent testing cohort is shown in Figure 3 and Table 2. Training-cohort performance, optimal-threshold results, and detailed supplementary curves are provided in Supplementary Tables S3 and S4 and Supplementary Figure S1.
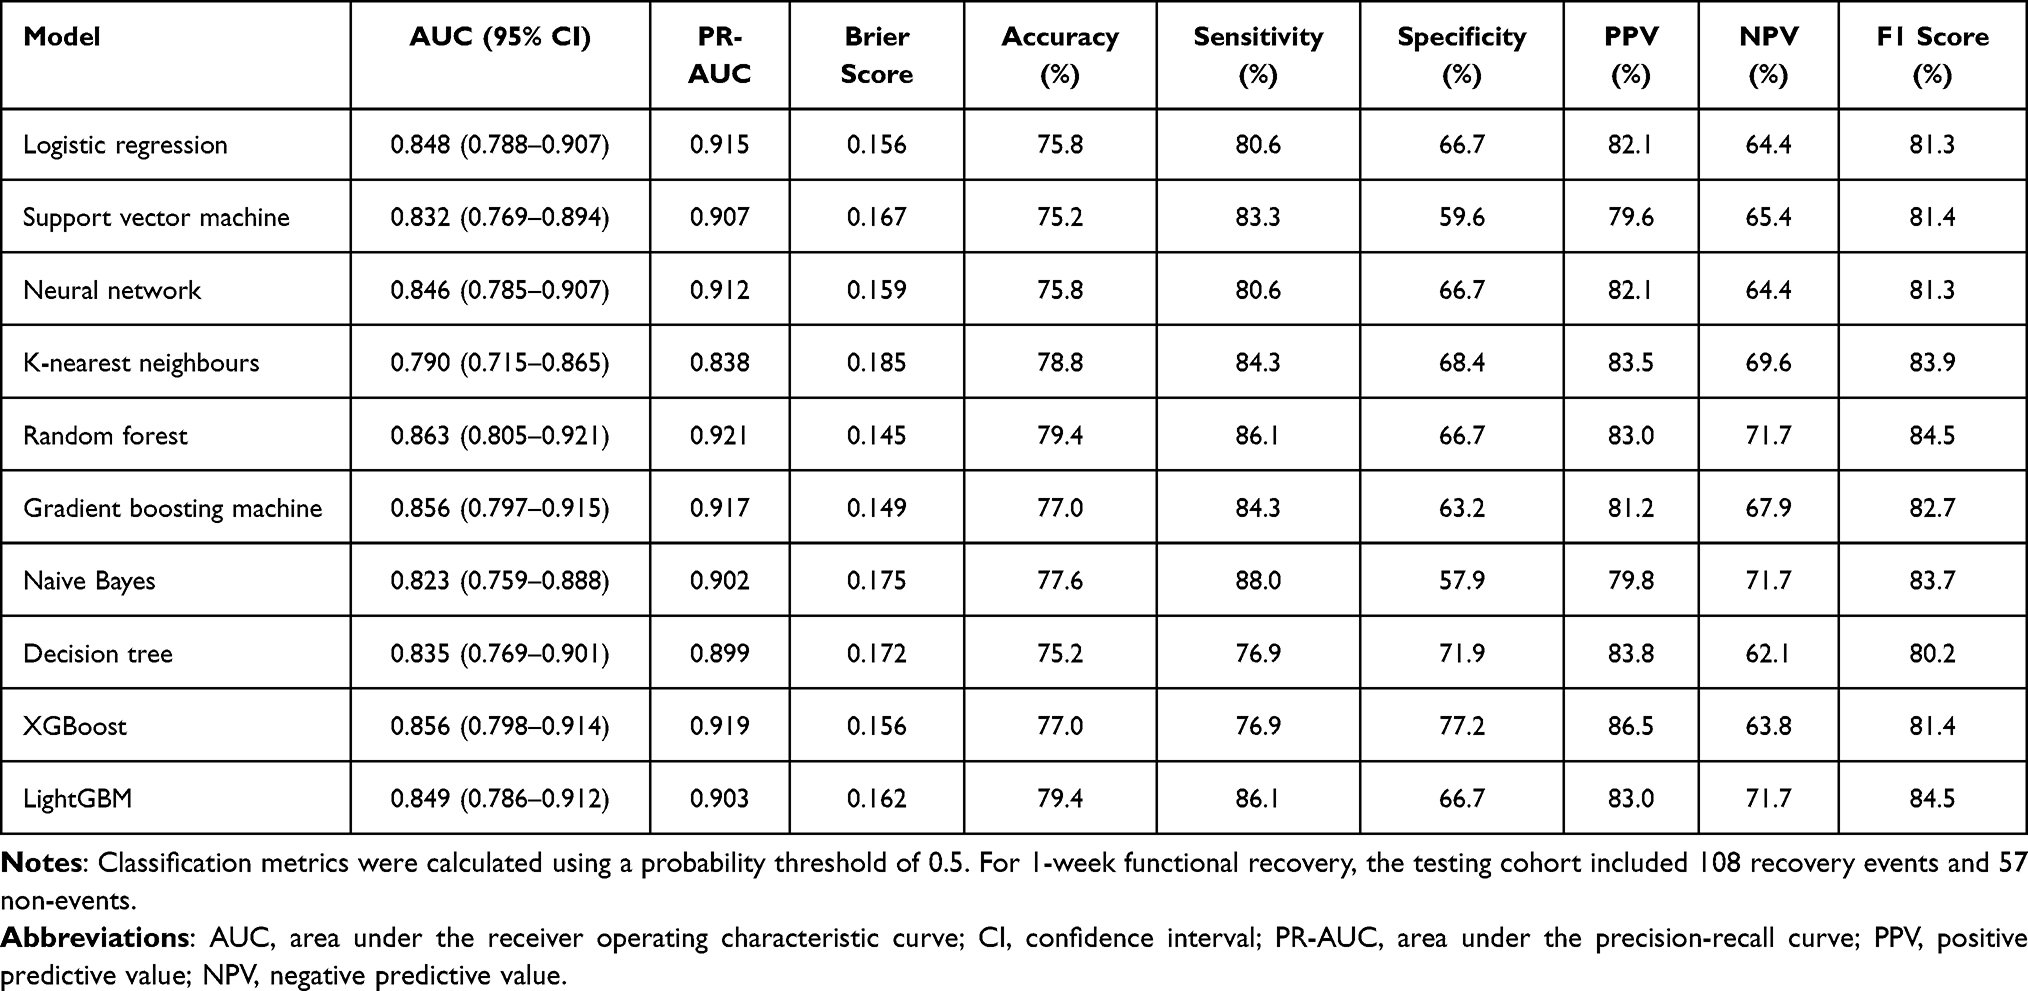 |
Table 2 Performance of Machine Learning Models for Predicting 1-Week Functional Recovery in the Independent Testing Cohort |
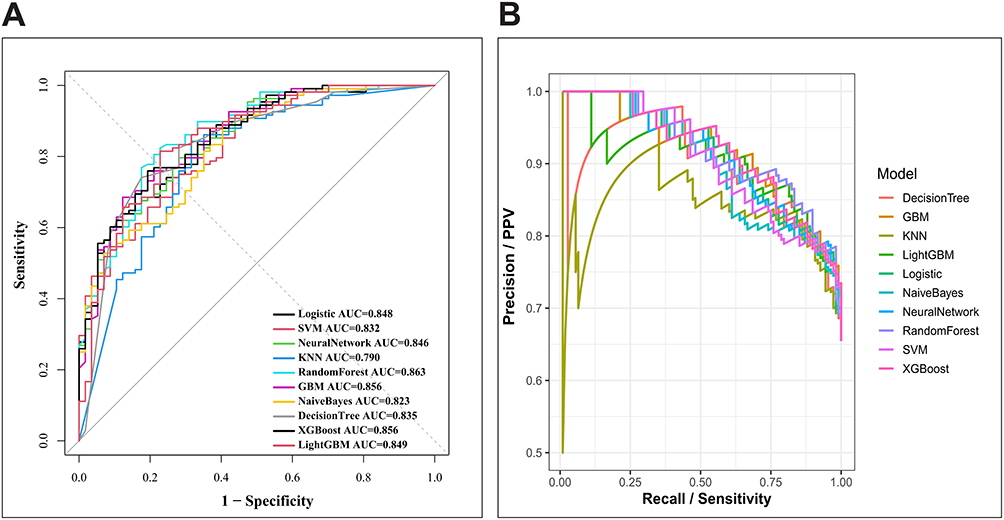 |
Figure 3 Discrimination performance of machine learning models for 1-week functional recovery in the testing cohort. Receiver operating characteristic and precision–recall curves were used to compare the test-set performance of 10 machine learning algorithms for predicting 1-week functional recovery. (A) ROC curves showing the relationship between sensitivity and 1-specificity across probability thresholds. The Random Forest model achieved the highest test-set AUC, while XGBoost showed comparable discrimination. (B) Precision–recall curves showing the trade-off between precision and recall, providing additional evaluation of model performance for the binary recovery outcome. Together, these curves supported the selection of XGBoost as the final functional recovery model based on overall discrimination, precision–recall performance, and interpretability considerations. |
In the testing cohort, RF and LightGBM had the best overall accuracy and F1 score. XGBoost showed the best specificity and positive predictive value, suggesting better rule-in performance. At the default probability threshold of 0.5, the final XGBoost model correctly identified 83 of 108 patients who achieved 1-week functional recovery and 44 of 57 patients who did not recover (true positives = 83, false negatives = 25, true negatives = 44, false positives = 13). Testing-cohort confusion matrices for all models are shown in Supplementary Figure S2.
Although RF achieved the numerically highest test-set AUC, XGBoost was selected as the final model for predicting 1-week functional recovery because it showed comparable discrimination, higher specificity and positive predictive value, favorable PR-AUC and Brier score, and suitability for SHAP-based interpretation and web-based implementation.
Performance of Machine Learning Models for 90-Day Readmission
The 90-day readmission endpoint was more difficult to predict because of the low event rate and pronounced class imbalance. Model discrimination in the independent testing cohort is presented in Figure 4 and Table 3. Training-cohort performance, optimal-threshold results, and detailed supplementary curves are provided in Supplementary Tables S5 and S6 and Supplementary Figure S3.
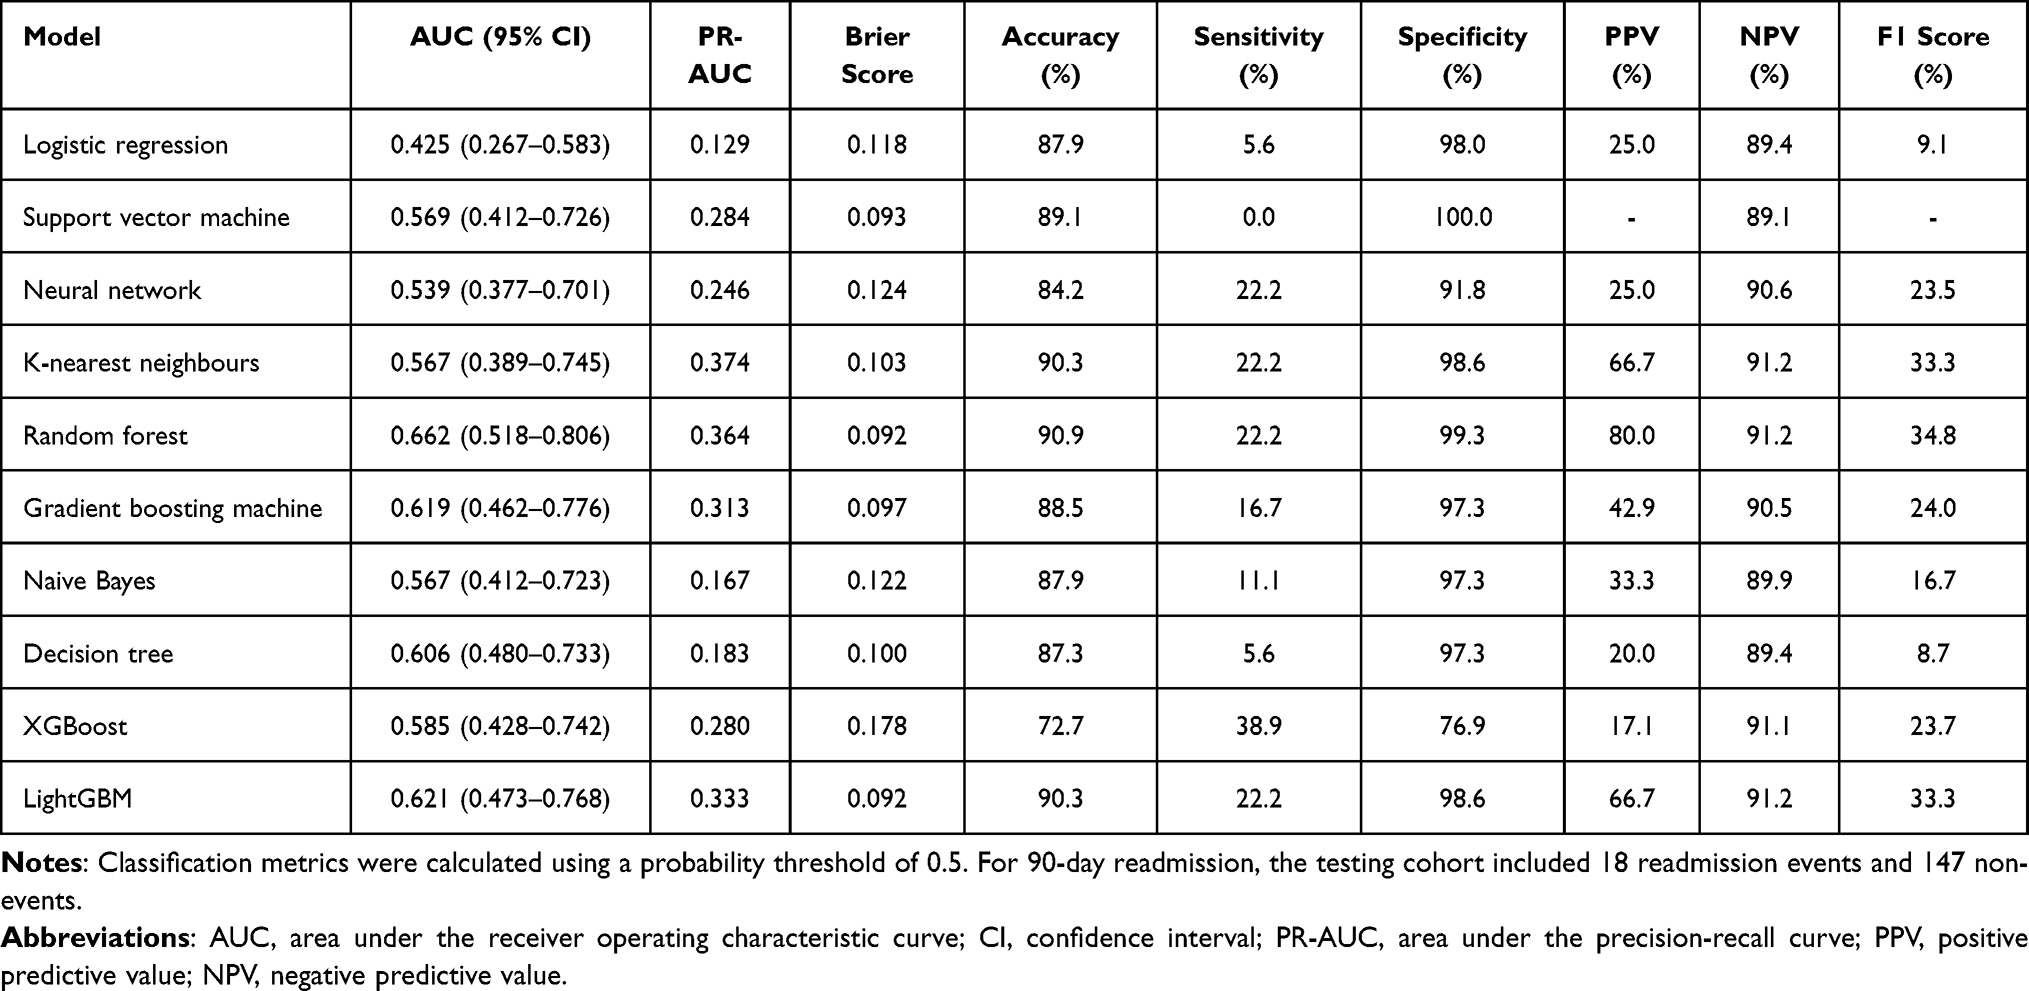 |
Table 3 Performance of Machine Learning Models for Predicting 90-Day Readmission in the Independent Testing Cohort |
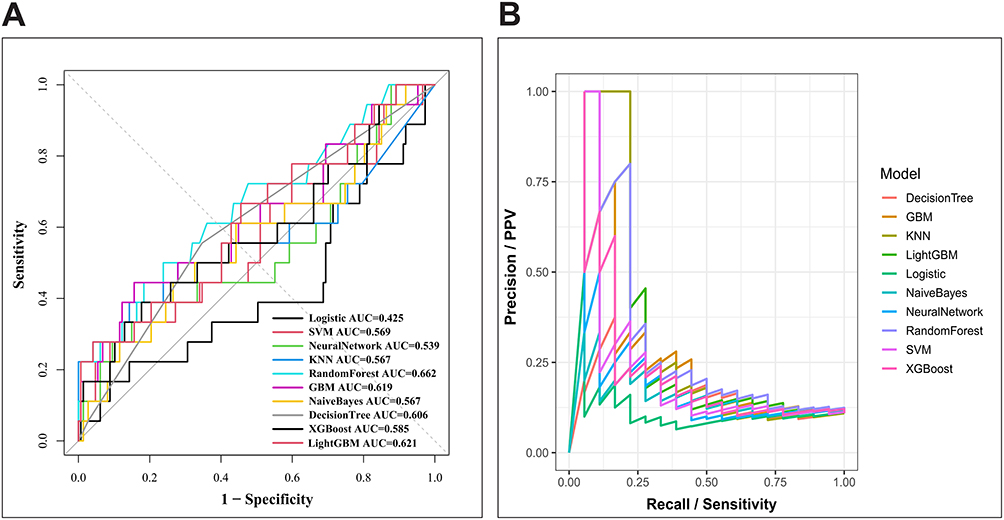 |
Figure 4 Discrimination performance of machine learning models for 90-day readmission in the testing cohort. Testing-cohort ROC and precision–recall curves were generated to evaluate the ability of 10 machine learning models to predict 90-day readmission. (A) ROC curves demonstrate modest discrimination across models, with the Random Forest model achieving the highest AUC among the evaluated algorithms. (B) Precision–recall curves illustrate the difficulty of predicting readmission in the setting of a low event rate and class imbalance. The overall results indicate that 90-day readmission was more challenging to predict than 1-week functional recovery. |
RF achieved the best discrimination for 90-day readmission and showed the best overall classification balance among the tested models. However, at the default probability threshold of 0.5, RF identified only 4 of 18 readmission events and 146 of 147 non-readmission cases (true positives = 4, false negatives = 14, true negatives = 146, false positives = 1), confirming low sensitivity despite high specificity and accuracy. XGBoost identified 7 of 18 readmission events but produced more false positives (true positives = 7, false negatives = 11, true negatives = 113, false positives = 34), illustrating the sensitivity-specificity trade-off. Testing-cohort confusion matrices for all models are shown in Supplementary Figure S4.
XGBoost had higher sensitivity for detecting readmission events but lower specificity and overall accuracy. Therefore, RF was chosen as the final model for the readmission endpoint.
Calibration and Clinical Utility
Calibration curves and decision curve analyses were used to evaluate the agreement between predicted probabilities and observed outcomes, as well as potential clinical net benefit. For 1-week functional recovery, calibration and decision curve results are shown in Figure 5, and numerical calibration summaries are provided in Supplementary Table S7. For the final XGBoost model, the test-set calibration intercept was 0.539 and the calibration slope was 0.937, suggesting acceptable calibration slope but some miscalibration in calibration-in-the-large.
 |
Figure 5 Calibration and clinical utility of models for 1-week functional recovery. Calibration curves and decision curve analysis were used to evaluate probability agreement and potential clinical usefulness of the functional recovery prediction models in the testing cohort. (A) Calibration curves compare mean predicted probabilities with observed event rates for each model; the diagonal reference line represents perfect calibration. Models closer to the diagonal show better agreement between predicted and observed recovery probabilities. (B) Decision curve analysis shows the net benefit of each model across different threshold probabilities, with “treat all” and “treat none” strategies included as clinical reference strategies. These analyses provide complementary information beyond discrimination alone. |
Calibration and decision curve analyses for 90-day readmission are shown in Figure 6, and numerical calibration summaries are provided in Supplementary Table S8. For the final RF model, the test-set calibration intercept was −0.768 and the calibration slope was 0.684, consistent with limited calibration and the exploratory nature of the readmission model.
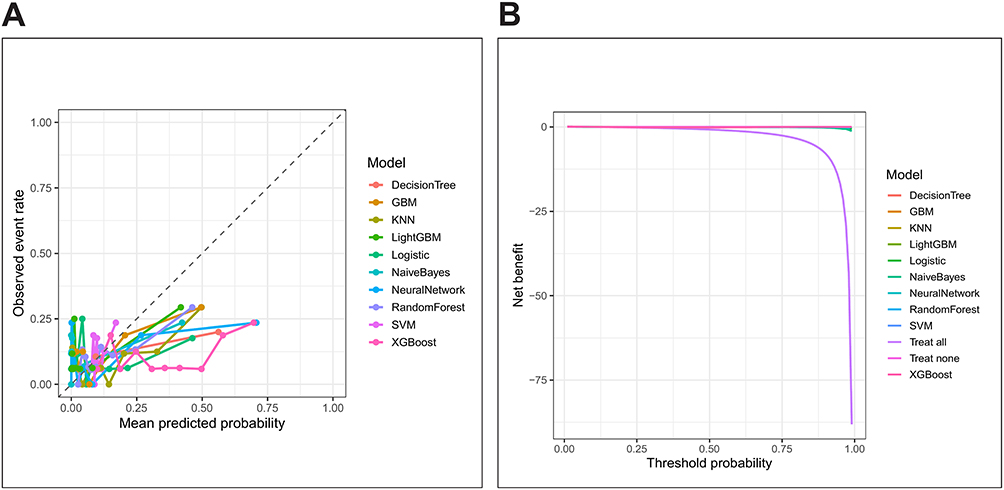 |
Figure 6 Calibration and clinical utility of models for 90-day readmission. Calibration and decision curve analyses were performed for the 90-day readmission models in the testing cohort. (A) Calibration curves show the relationship between predicted readmission probabilities and observed readmission rates. The compressed range of observed event rates reflects the relatively low frequency of 90-day readmission. (B) Decision curve analysis evaluates the net clinical benefit of each model across threshold probabilities. The results suggest limited but variable clinical utility for readmission prediction, consistent with the modest discrimination and class imbalance observed for this endpoint. |
Model Interpretation Using SHapley Additive ExPlanations Analysis
For the 1-week functional recovery model, SHAP analysis was performed for the final XGBoost model to clarify the contribution of individual predictors to model output (Figure 7). Top SHAP-ranked predictors are summarized in Supplementary Table S9, and model-specific importance plots are provided in Supplementary Figure S5.
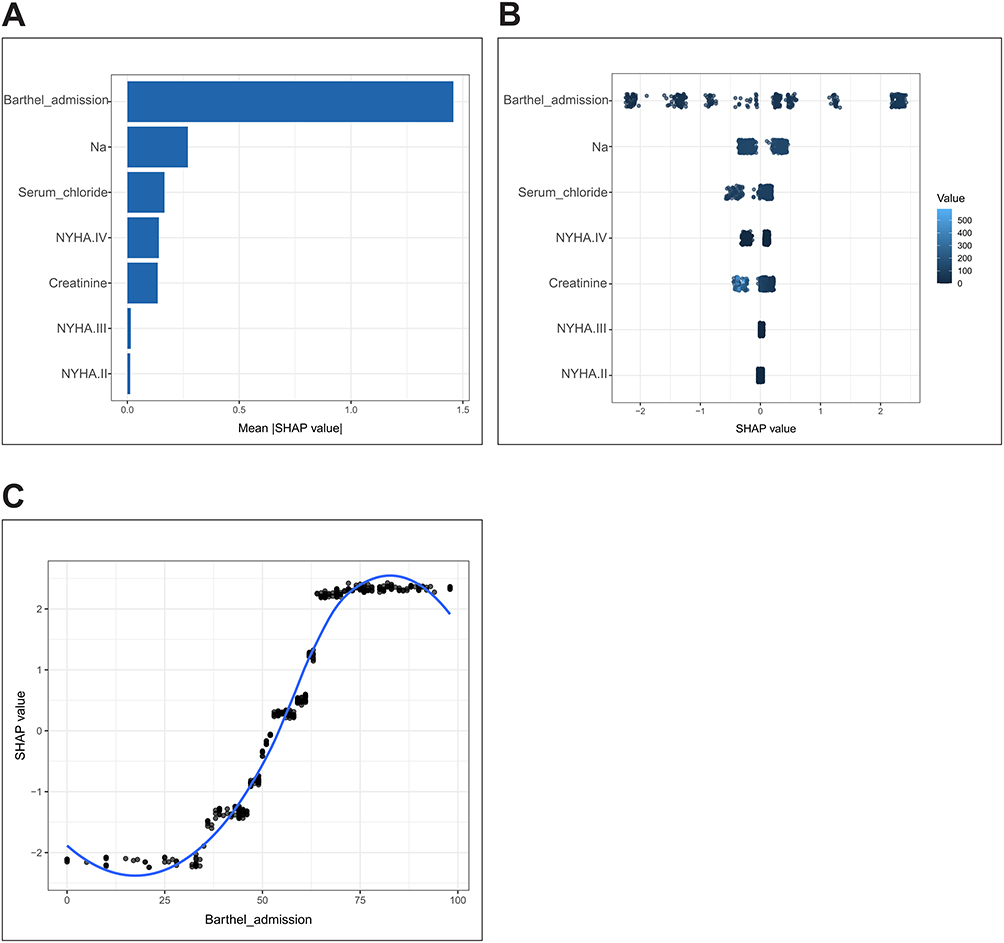 |
Figure 7 SHAP-based interpretation of the final XGBoost model for 1-week functional recovery. SHAP analysis was used to interpret the final XGBoost model for predicting 1-week functional recovery. (A) Global SHAP importance plot ranking predictors according to mean absolute SHAP value. Admission Barthel Index was the most influential predictor, followed by serum sodium, serum chloride, NYHA class, and creatinine-related variables. (B) SHAP beeswarm plot showing both the magnitude and direction of each predictor’s contribution to model output across individual patients. Each point represents one patient, with color indicating the original feature value. (C) SHAP dependence plot for admission Barthel Index, showing its nonlinear relationship with the predicted probability of functional recovery. Higher admission Barthel Index values generally contributed positively to the model output, indicating a higher likelihood of early functional recovery. |
SHAP analysis of the final RF model for 90-day readmission revealed that the top predictors were serum creatinine, LDL-C, total cholesterol, CRP, and creatinine clearance (Figure 8). Model-specific importance plots for the readmission endpoint are provided in Supplementary Figure S6.
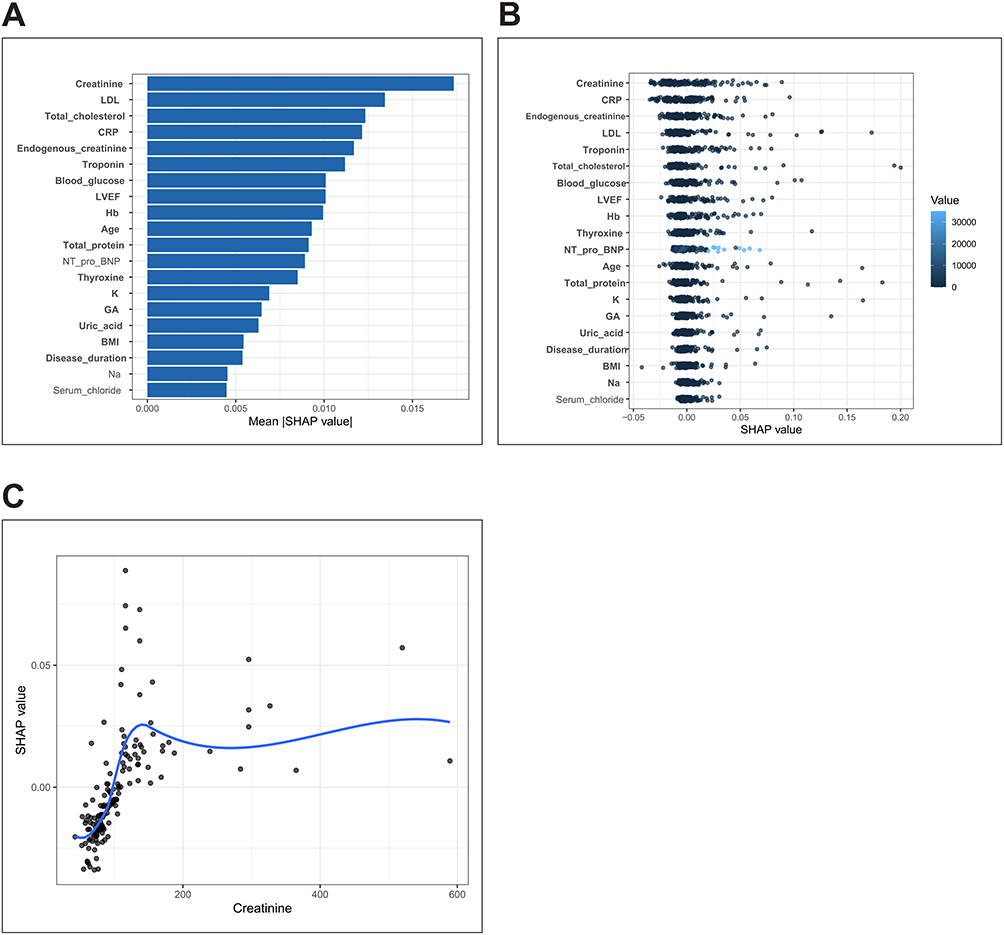 |
Figure 8 SHAP-based interpretation of the final Random Forest model for 90-day readmission. SHAP analysis was applied to the final Random Forest model for predicting 90-day readmission. (A) Global SHAP importance plot showing the predictors with the largest average contribution to model output. Serum creatinine ranked as the most important variable, followed by LDL cholesterol, total cholesterol, C-reactive protein, endogenous creatinine, serum sodium, troponin, serum chloride, blood glucose, LVEF, hemoglobin, age, NT-proBNP, and other laboratory or clinical indicators. (B) SHAP dependence plot for serum creatinine, illustrating how creatinine values influenced the model’s predicted readmission risk. (C) SHAP beeswarm plot displaying the distribution, direction, and magnitude of feature effects across patients. These findings suggest that renal function, lipid metabolism, inflammatory status, and cardiac-related indicators contributed to the Random Forest readmission prediction model. |
To facilitate individualized risk estimation and interpretation, we further developed a Shiny-based web risk calculator based on the final prediction models. The calculator provides predicted probabilities for 1-week functional recovery and 90-day readmission and displays corresponding SHAP-based interpretability outputs through an interactive interface (Supplementary Figure S7).
Discussion
This study developed and interpreted ML models for predicting 1-week functional recovery and 90-day readmission in patients with CVD. The main findings were as follows. First, short-term functional recovery could be predicted with relatively good performance using routinely available admission variables. Although RF achieved the numerically highest test-set AUC, XGBoost showed comparable discrimination, higher specificity and positive predictive value, favorable PR-AUC and Brier score, and better suitability for SHAP-based interpretation and web-based implementation. Therefore, XGBoost was selected as the final model for 1-week functional recovery. Second, admission Barthel Index score, NYHA functional class, serum creatinine, serum chloride, and serum sodium were important contributors to functional recovery prediction. Third, prediction of 90-day readmission was more challenging. The RF model achieved the highest test-set AUC for this endpoint, but its discrimination was modest and its sensitivity was low, indicating limited ability to identify patients who were subsequently readmitted. Finally, SHAP analysis improved model interpretability, and the Shiny-based application provided a preliminary platform for presenting individualized predictions.
For 1-week functional recovery, the final XGBoost model demonstrated acceptable discrimination and balanced classification performance in the independent test cohort. This finding suggests that short-term functional recovery after hospitalization for cardiovascular disease may be predicted using routinely available admission variables. Although XGBoost was not the best model in terms of AUROC, it was selected as the final model based on an overall evaluation of discrimination, specificity, precision, probability performance, interpretability and feasibility of implementation. The RF model performed slightly better than XGBoost in terms of AUROC, but XGBoost had a better rule-in performance, as evidenced by a higher specificity and positive predictive value, while having a comparable discrimination. These characteristics may be useful when the purpose is to identify patients with a high likelihood of early functional recovery.
Among the selected predictors, admission Barthel Index score was the most influential variable in SHAP analysis. This is clinically plausible because the Barthel Index reflects baseline independence in activities of daily living and may capture the combined effects of frailty, disease severity, physical reserve, and rehabilitation potential. Recent studies and reviews also support the prognostic relevance of ADL impairment and functional independence in patients with heart failure and CVD.9,27–29 Patients with higher functional independence at admission are more likely to achieve favorable short-term recovery after discharge. In contrast, patients with lower admission Barthel Index scores could require more intensive rehabilitation planning and more intensive post-discharge support.27,30
The NYHA functional class was also an important contributor to the model prediction. The NYHA class reflects the severity of cardiac functional limitation, and patients with advanced functional impairment may have lower exercise tolerance, greater symptom burden, and slower recovery of daily living ability. Serum creatinine, serum sodium and serum chloride were also retained as important predictors. These variables may reflect renal function, fluid balance, neurohormonal activation, and electrolyte disturbance, all of which are clinically relevant in patients with cardiovascular disease and heart failure.31–33 These associations should be interpreted as predictive contributions rather than causal relationships, especially because SHAP values describe how model features contribute to predictions rather than establishing etiologic mechanisms.34
Compared with the functional recovery endpoint, the prediction of 90-day readmission was less satisfactory. The RF model was the best model for discrimination for this endpoint (test-set AUC: 0.662). The overall accuracy and specificity were good but the sensitivity was low (22.2%). This suggests that the model correctly identified most patients not readmitted but also missed a large number of patients that were readmitted. Hence the high accuracy should be taken with caution, likely due to the low event rate and class imbalance. From a clinical perspective, low sensitivity limits the usefulness of the model for screening patients at high risk of readmission.14–18
The relatively weak performance for readmission prediction is not unexpected. Hospital readmission is a complex outcome that is affected by multiple factors including severity of disease, comorbidity burden, medication adherence, participation in rehabilitation, socioeconomic status, caregiver support, access to outpatient care, and quality of transitional care. Recent reviews have emphasized that readmission risk is often influenced by clinical and non-clinical factors that are difficult to fully capture in routinely collected inpatient datasets.14,17,18,35 Many of these factors were not available in the present dataset. Also, the number of positive events was small, which limited the statistical power. Future work should explore larger sample sizes and multicenter datasets, class-weighted algorithms, threshold optimization, cost-sensitive learning and inclusion of post-discharge and social determinants of health to improve readmission prediction.35,36
SHAP analysis for the readmission model suggested key predictors including serum creatinine, LDL-C, total cholesterol, CRP, and creatinine clearance. This is clinically plausible as renal dysfunction, lipid metabolism, and systemic inflammation are closely associated with cardiovascular risk and post-discharge vulnerability.32,33,37 However, the modest AUC and low sensitivity indicate that these predictors alone may not suffice to stratify the risk of readmission accurately. Therefore, the readmission model should be regarded as exploratory and hypothesis-generating rather than ready for direct clinical decision-making.
A strength of this study is that it simultaneously evaluated two clinically relevant post-discharge outcomes: short-term functional recovery and 90-day readmission. Functional recovery is an important patient-centered outcome, but is less often studied than mortality or readmission in cardiovascular risk prediction studies. By incorporating admission functional status and laboratory indicators, the present study provides a more comprehensive view of early post-discharge prognosis. The use of SHAP analysis also improves model transparency and can help clinicians understand which variables most strongly influence individual predictions.
From a multidisciplinary health care perspective, the proposed models could provide a practical framework for identifying patients needing different levels of support postdischarge. Patients with a low predicted probability of early functional recovery could benefit from early rehabilitation assessment, individualised exercise planning, nursing education, nutritional support, medication review and closer outpatient follow-up. For patients with elevated predicted readmission risk, coordinated management involving cardiologists, rehabilitation physicians, nurses, pharmacists, primary care providers, and family caregivers may be particularly important.27,30,35 Although the current models should not be used as standalone decision-making tools, the integration of interpretable predictions into a Shiny-based application may facilitate communication among multidisciplinary team members and support individualized care planning.38
Telemedicine and digital health modalities may provide a practical pathway for incorporating prediction models into post-discharge cardiovascular management. Remote follow-up, home-based cardiac rehabilitation, wearable or app-based monitoring, and structured mHealth communication may help reinforce adherence, support symptom surveillance, and identify patients who need early contact from multidisciplinary teams. A recent randomized trial of the European Society of Hypertension CARE smartphone application showed that app-assisted follow-up improved office and ambulatory blood pressure control compared with usual care, supporting the feasibility of mHealth-assisted cardiovascular risk management.39 In the present study, the Shiny-based application should be viewed as an early research prototype that could be combined with such telemedicine workflows only after external validation and prospective evaluation.
The Shiny-based web application further improves the accessibility of the models by allowing individualized probability estimation and visualization of model interpretation results. However, this application should be considered a research prototype rather than a clinically validated decision-support system. Before clinical implementation, the models require external validation, prospective evaluation, assessment of calibration in independent populations, and investigation of whether model-guided interventions can improve patient outcomes.36,38,40,41
Several limitations should be acknowledged. First, this study was a retrospective single-center study, which may lead to selection bias and affect the generalizability. Second, the sample size was moderate and the number of readmission events was small, which decreased the reliability and stability of the readmission model. Several models, especially flexible tree-based or instance-based algorithms, achieved near-perfect training performance but substantially lower testing performance, indicating possible overfitting and limited generalizability. Third, although internal validation and independent test-set evaluation were performed, external validation was not available and no fully nested outer cross-validation procedure was performed. Fourth, important variables related to post-discharge care, medication adherence, rehabilitation intensity, socioeconomic status, and family support were not included. These unmeasured factors may be particularly important for predicting readmission. Fifth, although SHAP improves interpretability, it does not establish causal relationships between predictors and outcomes. Finally, the choice of the classification threshold may have influenced sensitivity and specificity, particularly for the imbalanced endpoint of readmission.
Future studies should validate these models in larger and more diverse multicenter cohorts. For prediction of functional recovery, future studies may explore longitudinal functional trajectories beyond 1 week after discharge. For readmission prediction, additional clinical, behavioral, social, and post-discharge management variables should be incorporated to improve sensitivity and clinical usefulness. Prospective studies are also needed to determine whether prediction-guided rehabilitation planning, follow-up scheduling, or transitional care interventions can improve functional outcomes and reduce preventable readmissions.
Conclusion
ML models showed promising performance for predicting 1-week functional recovery in patients with CVD, with admission functional status, cardiac functional class, renal function, and electrolyte indicators contributing importantly to model predictions. XGBoost was selected as the final functional recovery model based on comprehensive performance and implementation considerations. In contrast, prediction of 90-day readmission remained challenging, with only modest discrimination and limited sensitivity. The SHAP-based interpretation and Shiny application may support individualized risk estimation, model transparency, and multidisciplinary post-discharge management, but further optimization, external validation, and prospective clinical evaluation are required before these models can be applied in routine clinical practice.
Declaration of Generative AI and AI-Assisted Technologies
The authors declare that generative AI and AI-assisted technologies were used only for language polishing, grammar checking, and improving the readability of the manuscript. No AI tool was used to generate original scientific content, perform data analysis, interpret results, or draw conclusions. All content was carefully reviewed and verified by the authors, who take full responsibility for the accuracy and integrity of the final manuscript.
Abbreviations
AUC, area under the receiver operating characteristic curve; BMI, body mass index; CI, confidence interval; CRP, C-reactive protein; CVD, cardiovascular disease; DM, diabetes mellitus; GA, glycated albumin; GBM, gradient boosting machine; Hb, hemoglobin; HDL-C, high-density lipoprotein cholesterol; HTN, hypertension; K, serum potassium; KNN, k-nearest neighbors; LASSO, least absolute shrinkage and selection operator; LDL-C, low-density lipoprotein cholesterol; LightGBM, light gradient boosting machine; LVEF, left ventricular ejection fraction; ML, machine learning; Na, serum sodium; NPV, negative predictive value; NT-proBNP, N-terminal pro-B-type natriuretic peptide; NYHA, New York Heart Association; PPV, positive predictive value; PR-AUC, area under the precision–recall curve; RF, random forest; ROC, receiver operating characteristic; SHAP, SHapley Additive exPlanations; SVM, support vector machine; XGBoost, extreme gradient boosting.
Data Sharing Statement
The datasets generated and/or analyzed during the current study are not publicly available because they contain sensitive clinical and follow-up information from patients with cardiovascular disease. De-identified data may be made available from the corresponding author upon reasonable request and with institutional approval.
Ethics Approval and Consent to Participate
This study was approved by the Medical Ethics Committee of Renmin Hospital, Hubei University of Medicine (approval number: SYSRMYY-KYXS-2022-073). The study site was Shiyan Renmin Hospital. The study was conducted in accordance with the Declaration of Helsinki. Because this was a retrospective study using routinely collected clinical data, the requirement for written informed consent was waived by the ethics committee.
Author Contributions
Jianzhou Tian contributed to methodology, software, data curation, writing – original draft, and writing – review & editing. Li Tian contributed to data curation, formal analysis, writing – original draft, and writing – review & editing. Qianqian Xie, Siru Zhang, Xiang Li, Shuxin Liu, and Hualin Zhang contributed to investigation, writing – original draft, and writing – review & editing. Yi Feng contributed to supervision, project administration, and writing – review & editing. Jun Shen contributed to conceptualization, supervision, project administration, and writing – review & editing. All authors read and approved the final manuscript. All authors made a significant contribution to the work reported, whether that is in the conception, study design, execution, acquisition of data, analysis and interpretation, or in all these areas; took part in drafting, revising or critically reviewing the article; gave final approval of the version to be published; have agreed on the journal to which the article has been submitted; and agree to be accountable for all aspects of the work.
Funding
This work was supported by the Natural Science Foundation of Hubei Province (Grant No. 2026AFC0267), the Scientific and Technological Project of Shiyan City of Hubei Province (Grant No. 25Y107), the Key Cultivation Project of Shiyan Renmin Hospital (Grant No. syrmyn-2026-004), and the Biomedical Technology Research Project of Shiyan Renmin Hospital (Grant No. syrmswyx2026-11).
Disclosure
The authors declare that they have no competing interests in this work.
References
1. Ding YN, Wang HY, Chen XF, Tang X, Chen HZ. Roles of sirtuins in cardiovascular diseases: mechanisms and therapeutics. Circ Res. 2025;136(5):524–19. doi:10.1161/CIRCRESAHA.124.325440
2. Mensah GA, Fuster V, Murray C, Roth GA. Global burden of cardiovascular diseases and risks, 1990-2022. J Am Coll Cardiol. 2023;82(25):2350–2473. doi:10.1016/j.jacc.2023.11.007
3. Martin SS, Aday AW, Almarzooq ZI, et al. 2024 heart disease and stroke statistics: a report of US and global data from the American heart association. Circulation. 2024;149(8):e347–e913. doi:10.1161/CIR.0000000000001209
4. Dos SBV, Bassi-Dibai D, Guedes C, et al. Barthel index is a valid and reliable tool to measure the functional Independence of cancer patients in palliative care. Bmc Palliat Care. 2022;21(1):124. doi:10.1186/s12904-022-01017-z
5. Ferfeli S, Galanos A, Dontas IA, Triantafyllou A, Triantafyllopoulos IK, Chronopoulos E. Reliability and validity of the Greek adaptation of the modified barthel index in neurorehabilitation patients. Eur J Phys Rehabil Med. 2024;60(1):44–54. doi:10.23736/S1973-9087.23.08056-5
6. Shah S, Vanclay F, Cooper B. Improving the sensitivity of the Barthel Index for stroke rehabilitation. J Clin Epidemiol. 1989;42(8):703–709. doi:10.1016/0895-4356(89)90065-6
7. Kitamura M, Izawa KP, Taniue H, et al. Relationship between activities of daily living and readmission within 90 days in hospitalized elderly patients with heart failure. Biomed Res Int. 2017;2017:7420738. doi:10.1155/2017/7420738
8. Lu J, Wang M, Zhang Y, et al. The prevalence of activities of daily living impairment in patients with heart failure: a systematic review and meta-analysis. Front Cardiovasc Med. 2022;9:952926. doi:10.3389/fcvm.2022.952926
9. Roy AR, Killian JM, Schulte PJ, Roger VL, Dunlay SM. Activities of daily living and outcomes in patients with advanced heart failure. Am J Med. 2022;135(12):1497–1504.e2. doi:10.1016/j.amjmed.2022.08.009
10. Sabouri M, Rajabi AB, Hajianfar G, et al. Machine learning based readmission and mortality prediction in heart failure patients. Sci Rep. 2023;13(1):18671. doi:10.1038/s41598-023-45925-3
11. McDonagh TA, Metra M, Adamo M, et al. 2023 focused update of the 2021 ESC Guidelines for the diagnosis and treatment of acute and chronic heart failure. Eur Heart J. 2023;44(37):3627–3639. doi:10.1093/eurheartj/ehad195
12. Heidenreich PA, Bozkurt B, Aguilar D, et al. 2022 AHA/ACC/HFSA guideline for the management of heart failure: a report of the American college of cardiology/American heart association joint committee on clinical practice guidelines. Circulation. 2022;145(18):e895–e1032. doi:10.1161/CIR.0000000000001063
13. Lundberg SM, Erion G, Chen H, et al. From local explanations to global understanding with explainable AI for trees. Nat Mach Intell. 2020;2(1):56–67. doi:10.1038/s42256-019-0138-9
14. Mahajan SM, Heidenreich P, Abbott B, Newton A, Ward D. Predictive models for identifying risk of readmission after index hospitalization for heart failure: a systematic review. Eur J Cardiovasc Nurs. 2018;17(8):675–689. doi:10.1177/1474515118799059
15. Frizzell JD, Liang L, Schulte PJ, et al. Prediction of 30-day all-cause readmissions in patients hospitalized for heart failure: comparison of machine learning and other statistical approaches. JAMA Cardiol. 2017;2(2):204–209. doi:10.1001/jamacardio.2016.3956
16. Yu MY, Son YJ. Machine learning-based 30-day readmission prediction models for patients with heart failure: a systematic review. Eur J Cardiovasc Nurs. 2024;23(7):711–719. doi:10.1093/eurjcn/zvae031
17. Hajishah H, Kazemi D, Safaee E, et al. Evaluation of machine learning methods for prediction of heart failure mortality and readmission: meta-analysis. BMC Cardiovasc Disord. 2025;25(1):264. doi:10.1186/s12872-025-04700-0
18. Alnomasy N, Pangket P, Mostoles RJ, et al. Predictive performance of machine learning models for heart failure readmission: a systematic review. Biomedicines. 2025;13(9):2111. doi:10.3390/biomedicines13092111
19. Collins GS, Moons KGM, Dhiman P, et al. TRIPOD+AI statement: updated guidance for reporting clinical prediction models that use regression or machine learning methods. BMJ. 2024;385:q902. doi:10.1136/bmj.q902
20. Moons K, Damen J, Kaul T, et al. PROBAST+AI: an updated quality, risk of bias, and applicability assessment tool for prediction models using regression or artificial intelligence methods. BMJ. 2025;388:e082505. doi:10.1136/bmj-2024-082505
21. Daneshvar A, Mousa G. Regression shrinkage and selection via least quantile shrinkage and selection operator. PLoS One. 2023;18(2):e0266267. doi:10.1371/journal.pone.0266267
22. Hu J, Szymczak S. A review on longitudinal data analysis with random forest. Brief Bioinform. 2023;24(2). doi:10.1093/bib/bbad002
23. Chen TQ, Guestrin C, Assoc CM XGBoost: a scalable tree boosting system. In:
24. Ke GL, Meng Q, Finley T, et al. LightGBM: a highly efficient gradient boosting decision tree. In:
25. Kuhn M. Building predictive models in R using the caret package. J Stat Softw. 2008;28(5):1–26. doi:10.18637/jss.v028.i05
26. Molodianovitch K, Faraggi D, Reiser B. Comparing the areas under two correlated ROC curves: parametric and non-parametric approaches. Biometrical J. 2006;48(5):745–757. doi:10.1002/bimj.200610223
27. Makita S, Yasu T, Akashi YJ, et al. JCS/JACR 2021 guideline on rehabilitation in patients with cardiovascular disease. Circ J. 2022;87(1):155–235. doi:10.1253/circj.CJ-22-0234
28. Shibahashi H, Takakubo Y, Murakawa M, Takagi M, Murakami M. Factors influencing post discharge activities of daily living in patients receiving rehabilitation in acute care hospital. Sci Rep. 2025;15(1):33623. doi:10.1038/s41598-025-19186-1
29. Nakamura M, Yamamoto K, Nozaki S, et al. Decline in oral function contributes to decreased activities of daily living at discharge in elderly patients with heart failure. PLoS One. 2025;20(5):e0323806. doi:10.1371/journal.pone.0323806
30. Thomas RJ, Beatty AL, Beckie TM, et al. Home-Based cardiac rehabilitation: a scientific statement from the American association of cardiovascular and pulmonary rehabilitation, the American Heart Association, and the aMerican College Of Cardiology. Circulation. 2019;140(1):e69–e89. doi:10.1161/CIR.0000000000000663
31. Savarese G, Becher PM, Lund LH, Seferovic P, Rosano G, Coats A. Global burden of heart failure: a comprehensive and updated review of epidemiology. Cardiovasc Res. 2023;118(17):3272–3287. doi:10.1093/cvr/cvac013
32. Marx N, Federici M, Schütt K, et al. 2023 ESC Guidelines for the management of cardiovascular disease in patients with diabetes. Eur Heart J. 2023;44(39):4043–4140. doi:10.1093/eurheartj/ehad192
33. Damman K, Testani JM. The kidney in heart failure: an update. Eur Heart J. 2015;36(23):1437–1444. doi:10.1093/eurheartj/ehv010
34. Gershman SJ, Assad JA, Datta SR, et al. Explaining dopamine through prediction errors and beyond. Nat Neurosci. 2024;27(9):1645–1655. doi:10.1038/s41593-024-01705-4
35. Hamadi H, Haley DR, Park S, Tafili A, Zhao M, Spaulding A. Social determinants of health data reporting and hospitals’ 30-day readmissions. Health Care Manage Rev. 2026;51(2):121–128. doi:10.1097/HMR.0000000000000469
36. Ziegler A. Clinical prediction models: a practical approach to development, validation, and updating. Biometrical J. 2020;62(4):1122–1123. doi:10.1002/bimj.202000088
37. Ridker PM. C-reactive protein and the prediction of cardiovascular events among those at intermediate risk: moving an inflammatory hypothesis toward consensus. J Am Coll Cardiol. 2007;49(21):2129–2138. doi:10.1016/j.jacc.2007.02.052
38. Vickers AJ, Elkin EB. Decision curve analysis: a novel method for evaluating prediction models. Med Decis Making. 2006;26(6):565–574. doi:10.1177/0272989X06295361
39. Konstantinidis D, Siafi E, Iliakis P, et al. Targeting better hypertension control with the usage of the ESH smartphone application. Eur J Prev Cardiol. 2026;33(7):1162–1171. doi:10.1093/eurjpc/zwaf240
40. Riley RD, Ensor J, Snell K, et al. Calculating the sample size required for developing a clinical prediction model. BMJ. 2020;368:m441. doi:10.1136/bmj.m441
41. van Smeden M, Moons KG, de Groot JA, et al. Sample size for binary logistic prediction models: beyond events per variable criteria. Stat Methods Med Res. 2019;28(8):2455–2474. doi:10.1177/0962280218784726
 © 2026 The Author(s). This work is published and licensed by Dove Medical Press Limited. The
full terms of this license are available at https://www.dovepress.com/terms
and incorporate the Creative Commons Attribution
- Non Commercial (unported, 4.0) License.
By accessing the work you hereby accept the Terms. Non-commercial uses of the work are permitted
without any further permission from Dove Medical Press Limited, provided the work is properly
attributed. For permission for commercial use of this work, please see paragraphs 4.2 and 5 of our Terms.
© 2026 The Author(s). This work is published and licensed by Dove Medical Press Limited. The
full terms of this license are available at https://www.dovepress.com/terms
and incorporate the Creative Commons Attribution
- Non Commercial (unported, 4.0) License.
By accessing the work you hereby accept the Terms. Non-commercial uses of the work are permitted
without any further permission from Dove Medical Press Limited, provided the work is properly
attributed. For permission for commercial use of this work, please see paragraphs 4.2 and 5 of our Terms.
Recommended articles
Machine Learning-Driven Prediction of One-Year Readmission in HFrEF Patients: The Key Role of Inflammation
Ma F, Hu Y, Han P, Qiu Y, Liu Y, Ren J
Clinical Interventions in Aging 2025, 20:1071-1084
Published Date: 24 July 2025
Using Interpretable Machine Learning with SHAP to Assess Dynapenic Abdominal Obesity as a Stroke Risk Predictor: A Prospective Cohort Study
Chen W, Cao Y, Xiao J, Wang D
Vascular Health and Risk Management 2026, 22:591884
Published Date: 18 March 2026
Development and Interpretable Machine Learning-Based Prediction of Cardiovascular Disease Risk in Chinese COPD Patients: An Analysis of the CHARLS Database
Yuan Y, Zhu J, Zhao X, Huang Q, Li J, Wang Y, Liu W, Chen M, Li D, Wu B, Li W, Wu D
International Journal of Chronic Obstructive Pulmonary Disease 2026, 21:590631
Published Date: 25 May 2026
Explainable Machine Learning Integrating Patient and Environmental Factors for Predicting Multidrug-Resistant Organism Colonization or Infection on ICU Admission
Gu G, Ji Y, Xiong X, Chen M, Pan J, Yang Y, Yang M, Wang B
Infection and Drug Resistance 2026, 19:581390
Published Date: 3 June 2026
Development and Validation of a Prediction Model for Postoperative Delirium
Li L, Qiao N, Yang X, Yang X
Neuropsychiatric Disease and Treatment 2026, 22:592611
Published Date: 9 June 2026