Back to Journals » International Journal of Chronic Obstructive Pulmonary Disease » Volume 21
Development and Interpretable Machine Learning-Based Prediction of Cardiovascular Disease Risk in Chinese COPD Patients: An Analysis of the CHARLS Database
Authors Yuan Y, Zhu J ![]() , Zhao X, Huang Q, Li J, Wang Y, Liu W, Chen M, Li D, Wu B, Li W, Wu D
, Zhao X, Huang Q, Li J, Wang Y, Liu W, Chen M, Li D, Wu B, Li W, Wu D
Received 21 December 2025
Accepted for publication 18 May 2026
Published 25 May 2026 Volume 2026:21 590631
DOI https://doi.org/10.2147/COPD.S590631
Checked for plagiarism Yes
Review by Single anonymous peer review
Peer reviewer comments 4
Editor who approved publication: Prof. Dr. Zijing Zhou
Yalian Yuan,* Jiajian Zhu,* Xuanna Zhao,* Qiu Huang, Jiahua Li, Yunan Wang, Weiliang Liu, Min Chen, Dongming Li, Bin Wu, Wen Li, Dong Wu
Department of Respiratory and Critical Care Medicine, Affiliated Hospital of Guangdong Medical University, Zhanjiang, 524013, People’s Republic of China
*These authors contributed equally to this work
Correspondence: Dong Wu, Department of Respiratory and Critical Care Medicine, The Affiliated Hospital of Guangdong Medical University, No. 57, South of Renmin Road, Zhanjiang, Guangdong, 524013, People’s Republic of China, Email [email protected] Wen Li, Department of Respiratory and Critical Care Medicine, The Affiliated Hospital of Guangdong Medical University, No. 57, South of Renmin Road, Zhanjiang, Guangdong, 524013, People’s Republic of China, Email [email protected]
Background: Individuals with chronic obstructive pulmonary disease (COPD) experience a significant decline in their quality of life owing to cardiovascular disease (CVD). This study aimed to develop a predictive framework for evaluating CVD risk in patients with COPD.
Patients and Methods: Data from 1070 COPD patients participating in the 2015 China Health and Retirement Longitudinal Study (CHARLS) were analyzed. To ensure robust feature selection, Least Absolute Shrinkage and Selection Operator (LASSO) regression and the Boruta algorithm were utilized. Subsequently, the predictive performance of six distinct Machine learning (ML) models (Logistic Regression, Random Forest, Support Vector Machine (SVM), Gradient Boosting Machine, XGBoost, and Multi-Layer Perceptron) was comprehensively compared. The Synthetic Minority Oversampling Technique-Nominal Continuous (SMOTE-NC) was applied to the training set to combat class imbalance. An interpretable risk assessment tool was developed using SHapley Additive exPlanations (SHAP).
Results: 305 participants (28.50%) had CVD. Seven variables were used to build the six models. The SVM model showed comparatively better performance than the others, with a training Area Under the Receiver Operating Characteristic curve (AUROC) of 0.819 (95% Confidence Interval (CI) 0.793– 0.844), accuracy of 74.42%, sensitivity of 75.56%, precision of 74.18%, specificity of 73.26%, and F1 score of 74.86%. In the test set, the AUROC was 0.719 (95% CI, 0.670– 0.760), with an accuracy of 68.63%, sensitivity of 64.20%, precision of 66.53%, specificity of 64.96%, and F1 score of 69.36%.
Conclusion: This study identified seven key predictors—sex, body weight, hypertension, dyslipidemia, disability, self-rated health, and vision status—that are significantly associated with cardiovascular risk in Chinese patients with COPD. Among the six machine-learning algorithms evaluated, the SVM model demonstrated the most robust performance; however, its predictive capacity remains moderate, reflecting the inherent limitations of cross-sectional survey data and the reliance on self-reported diagnoses. Future prospective studies and rigorous external validation in independent cohorts are essential to refine these predictors and translate this machine-learning approach into reliable clinical decision-support systems for the personalized management of COPD patients.
Keywords: cardiovascular disease, COPD, machine learning, predictive modeling
Introduction
Chronic obstructive pulmonary disease (COPD) and cardiovascular disease (CVD) are two of the leading causes of global morbidity and mortality. The co-occurrence of these conditions significantly amplifies the clinical burden and worsens patient prognoses. Previous findings reveal that cardiovascular and pulmonary causes collectively account for the majority of sudden deaths,1 emphasizing the importance of developing accurate predictive models to identify high-risk populations and improve preventive strategies. Patients with COPD often develop CVD.2,3 CVD occurs more frequently in individuals with COPD compared to those without COPD (59.6% vs 28.4%).4 Moreover, there is a significant rise in acute cardiovascular incidents within 30 days and one year following an acute exacerbation of COPD.5 However, concurrent CVD in COPD often goes undetected.6 This heightened risk is driven by profound pathophysiological linkages; specifically, factors such as chronic intermittent hypoxia, sustained systemic inflammation, and endothelial dysfunction serve as critical biological bridges linked to CVD in COPD patients.7–9 Hence, it is crucial to create predictive models for assessing CVD risk in individuals with COPD.
Many models10,11 have been developed to predict CVD risk in patients with COPD, but some studies have some limitations: radiomic features are often combined with clinical variables, while comprehensive psychosocial and metabolic markers are often ignored. For instance, Lin et al used whole-lung computed tomography (CT) to predict the risk of CVD. This may compromise the specificity of the signal, or reduce the accuracy of the prediction.12 Furthermore, many authors still depend on standard methods like multivariable logistic regression. While these traditional models can identify links between CVD prevalence and clinical variables, they often struggle to capture complex, non-linear interactions among high-dimensional clinical data.7,13 Additionally, they are not adaptable, need manual selection of variables and features, require specialist knowledge, and have no guidance on building and adjusting models.
ML offers a promising approach to address these challenges. First, ML models can extract feature patterns from training data to new clinical data with the same accuracy.14 Second, modern ML systems combine large-scale data processing with automatic feature generation to construct models from different sources.15,16 Third, ML outperforms other methods for the prediction of CVD, especially multidimensional risk evaluation.17,18
While ML has been extensively utilized for CVD risk prediction in the general population (eg, You et al), studies focusing specifically on the COPD demographic remain scarce. General population models often fail to fully capture the unique pathophysiological status of COPD patients. Therefore, exploring targeted ML models for this specific population is of great clinical significance.19 Similarly, Huang et al created a CVD risk model for middle-aged and elderly people using the China Health and Retirement Longitudinal Study (CHARLS) dataset.20 Studies have shown that ML can improve CVD prediction accuracy, minimize errors, and simplify data analysis.21 While previous studies focused on COPD and CVD using traditional statistical approaches, only a limited number of studies have used ML techniques to establish CVD risk models for this demographic.9,22 The data from CHARLS were used to comprehensively investigate variables associated with CVD and develop a robust, interpretable model for the likelihood of CVD in individuals with COPD using ML techniques.
Methods
Data Source
The data for this study were obtained from the China Health and Retirement Longitudinal Study (http://charls.pku.edu.cn). The original CHARLS project was approved by the Biomedical Ethics Committee of Peking University (Approval No. IRB00001052-11015), and written informed consent was obtained from all participants. The current study is a secondary analysis of publicly accessible and de-identified data. According to Items 1 and 2 of Article 32 of the “Measures for Ethical Review of Life Science and Medical Research Involving Human Subjects” (issued by the National Health Commission of China, February 18, 2023), research involving the use of publicly available or anonymized data that does not involve sensitive personal information or pose significant risk to subjects is exempt from further institutional ethical review. Consequently, this research meets the exemption criteria and was exempt from additional review by the Ethics Committee of the Affiliated Hospital of Guangdong Medical University. We were not eligible if subjects were younger than 45 or older than 85 years, if they were not diagnosed with physician-diagnosed COPD in the fourth survey wave, or had physician-diagnosed asthma. The final sample consisted of 1070 participants. The selection procedure is illustrated in Figure 1. The study was conducted in accordance with the Declaration of Helsinki (2013).
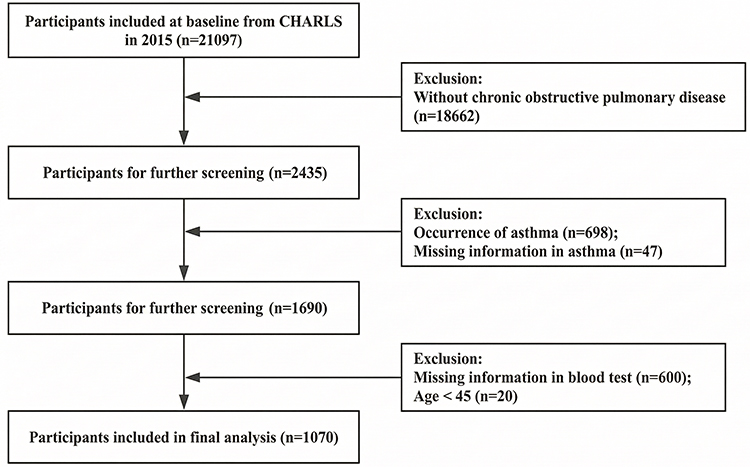 |
Figure 1 Participant selection process flowchart. |
Data Collection
Definition of CVD
This study focused on CVD, heart disease, and heart failure. Based on the standard CHARLS questionnaire, CVD was defined by self-reported physician diagnoses of major cardiovascular conditions, specifically including angina pectoris, coronary heart disease, and heart failure. Due to the nature of the survey, further refined sub-classification of CVD types was not feasible.20 Participants who had heart disease were considered CVD. Participants were divided into two groups: COPD without CVD (non-CVD group) and COPD with CVD (CVD group).
Sociodemographic and Behavioral Characteristics
The sociodemographic factors analyzed included age, sex, marital status, permanent residence, educational level, and retirement status. The marital status was either married or single. Permanent residences were either urban or rural. The educational level was classified as illiterate, primary school, middle school, high school, or higher. Retirement status was yes or no. Behavior included smoking and drinking history, social behavior, and nighttime sleep duration (yes or no). Nighttime sleep duration was determined by asking the participants how many times they had slept in the previous month (ie, the time they spent sleeping at night).
Health Status
We also identified possible CVD indicators, such as hypertension, diabetes, cancer, stroke, mental illness, arthritis, dyslipidemia, liver and kidney disease, gastrointestinal problems, cognitive impairment, and hip fractures. Self-rated health, life satisfaction, Activities of Daily Living (ADL) scores [Instrumental Activities of Daily Living (IADL) and basic ADL], vision and hearing status, pain, cognitive function, grip strength, falls, tooth loss, disability. Self-rated health, life satisfaction, vision, and hearing status were good, fair, or poor; pain, falls, tooth loss, disability, and yes or no. Cognitive function was assessed using the total cognition score and depressive symptoms were measured using the Center for Epidemiologic Studies Depression (CESD-10) scale. Hypertension was defined as self-reported hypertension, a diastolic blood pressure of 90 mmHg, or a systolic blood pressure(SBP) of 140 mmHg. Diabetes mellitus was self-reported, confirmed by a physician, or had a fasting blood glucose level of 126 mg/dl.
Physiological Indicators and Laboratory Test Results
The physiological parameters are SBP (Mean±Standard Deviation, SD), diastolic blood pressure, pulse, height, weight, waist circumference, body mass index (BMI), peak expiratory flow rate (Median [Interquartile Range,IQR]), white blood cell (WBC), mean corpuscular volume (MCV), platelets (PLT), blood urea nitrogen (BUN), blood glucose (GLU), creatinine (CREA), total cholesterol (TC), triglycerides (TG), high-density lipoprotein cholesterol (HDL), low-density lipoprotein cholesterol (LDL), C-reactive protein (CRP), glycated hemoglobin (HbA1c), uric acid (UA), hematocrit (HCT), hemoglobin (Hb), cystatin C (CYSC) also reported as Median [IQR].
Operational Definitions of Key Variables
To ensure study reproducibility, key subjective variables were strictly operationalized based on the official CHARLS questionnaires. Disability was defined using the ADL and IADL scales. The ADL items included dressing, bathing, eating, getting into or out of bed, and using the toilet, while the IADL items included managing money and shopping for groceries. Patients were categorized as 0 (no disability) if they reported “no difficulty” across all items, and 1 (having a disability) if they reported any level of difficulty in one or more items. Self-Rated Health status (SRH), originally assessed via a 5-point Likert scale (1=Excellent, 2=Very good, 3=Good, 4=Fair, 5=Poor), was recoded into a 3-tier ordinal variable to avoid sparse categories: Excellent/Very good/Good (coded as 0), Fair (coded as 1), and Poor (coded as 2). Similarly, vision status (Eyesight) was evaluated based on self-reported distance and near vision (originally a 5-point scale) and was categorized into three levels: Excellent/Good (coded as 0), Fair (coded as 1), and Poor (coded as 2).
Data Preprocessing
Key candidates were identified from the literature and CHARLS data. Variables with a missing rate greater than 20% or those not strongly associated with CVD were excluded. We retained 61 features for analysis, including demographics, health indicators, and clinical parameters such as age, sex, education level, residence, marital status, retirement status, SRH, diabetes, hypertension, stroke, dyslipidemia, arthritis, liver and kidney diseases, digestive system diseases, mental health problems, height, weight, waist circumference, SBP, peak expiratory flow, WBC, MCV, PLT, HbA1c, GLU, TC, HDL, LDL, TG, Hb, CYSC, CREA, BUN, and UA. Missing values were handled using Multiple Imputation by Chained Equations (MICE) with 5 iterations, generating multiple plausible estimates for each missing value to capture uncertainties and provide reliable data for subsequent analyses.
To rigorously prevent data leakage, the initial dataset (consisting of 765 COPD patients without CVD and 305 with CVD) was first randomly partitioned into a training set (70%) and an independent test set (30%). It is crucial to note that all subsequent feature selection and data balancing procedures were performed exclusively on the training set. The independent test set remained completely sequestered to ensure an unbiased evaluation of the models’ generalization performance. Model fitting and tuning occurred in training sets, whereas test sets measured performance. Feature selection was restricted to training sets, because of overfitting and speeding training, using Least Absolute Shrinkage and Selection Operator (LASSO) with cross-validation for feature selection. After LASSO screening gender, hypertension, dyslipidemia, disability, self-rated health score, visual acuity and weight were key predictors. The model performance was evaluated using 10-fold cross-validation.
The Boruta analysis identified high predictor features and eliminated redundant or irrelevant variables.23 This improved the interpretability of future machine-learning models and reduced the overfitting risk. The features identified in this analysis are clinically important because they establish a robust evidence-based model for cardiovascular risk assessment in COPD patients. To ensure selection stability, Boruta was executed for 100 iterations, retaining only features statistically confirmed as more important than randomized shadow features. To ensure rigorous feature selection and mitigate multicollinearity, we employed a dual-strategy combining LASSO regression and the Boruta algorithm. While the Boruta algorithm acts as an all-relevant feature selector capable of capturing complex non-linear relationships, LASSO applies L1 regularization to identify a sparse subset of highly predictive linear features. By taking the intersection of the features confirmed as “important” by Boruta and those retained by the optimal LASSO model, we effectively eliminated redundant variables and selected a robust, highly reproducible set of predictors. This combined methodological approach ensures that the final model is both interpretable and strictly scientifically justified. Overfitting concerns were resolved using correlation analysis of the continuous variables. Because the class imbalance was high in the original cohort, the Synthetic Minority Oversampling Technique-Nominal Continuous (SMOTE-NC) algorithm was applied solely to the training set post-split. This generated synthetic samples for the minority class, effectively rebalancing the training set distribution to a 1:1 ratio while keeping the test set pristine.24
Machine Learning Modeling
All machine-learning models were developed and validated using Python 3.11.4. Following preprocessing, six classification algorithms were applied to the training and test data: Logistic Regression (LR), Random Forest Classifier (RF), Multi-Layer perceptron (MLP), Gradient Boosting Machine (GBM), Support Vector Machine (SVM),25 and extreme Gradient Boosting (XGBoost). To standardize the input values and ensure a uniform feature evaluation while avoiding overfitting, one-hot encoding and Z-score algorithms were used. The grid parameters were tuned to determine the optimal configurations for each model, reducing the overfitting risk and improving the prediction performance. Grid Search, an optimization technique of hyperparameters, is searched for predefined combinations to identify the best model performance configuration.26 The optimal parameters for each model are as follows: LR (“C”: 1, “penalty”: “l2”, “solver”: “liblinear”); RF (“max_depth”: 5, “max_features”: “sqrt”, “min_samples_leaf”: 5, “min_samples_split”: 10, “n_estimators”: 50); SVM (“C”: 10, “gamma”: “scale”, “kernel”: “rbf”); XGB (“learning_rate”: 0.01, “max_depth”: 5, “n_estimators”: 200, “reg_alpha”: 0, “reg_lambda”: 1, “subsample”: 0.8); GBM (“learning_rate”: 0.05, “min_data_in_leaf”: 10, “n_estimators”: 100, “num_leaves”: 15, “reg_alpha”: 0.1, “reg_lambda”: 0.1); MLP (“alpha”: 1, “early_stopping”: True, “hidden_layer_sizes”: (50,), “learning_rate_init”: 0.01, “max_iter”: 300).
SHAP Interpretability Analysis
We assessed model performance on the test set using the Area Under Receiver Operating Characteristic Curve (AUROC), precision, recall, and F1-score. We also studied classification behavior. SHapley Additive exPlanations (SHAP) was used to test model interpretability. Bar charts of average SHAP values and summary plots of SHAP helped characterize the feature contribution to predictions. The mean absolute SHAP value for each feature is shown in the average SHAP bar chart. The SHAP value distribution for each feature and its effect on the model output are presented in the SHAP summary plot.
Statistical Analysis
Continuous variables are expressed as mean ± SD (range) or median (IQR) and analyzed using Student’s t-test or Wilcoxon rank-sum test, depending on the data distribution. Categorical variables were counted and percentages were analyzed using the chi-square test or Fisher’s exact test, as appropriate. All tests were two-sided, and the significance level was set at p < 0.05. Statistical analyses were carried out using SPSS 27.0 (IBM Corp), R 4.4.0 (The R Foundation for Statistical Computing), and Python 3.12.5 (Python Software Foundation).
Results
Patient Characteristics
In the initial examination, 1070 participants were divided into two categories: 765 individuals with COPD but no CVD (no CVD group) and 305 individuals with COPD and CVD (CVD group). We found that the CVD group had more females (55.4% vs 39.5%, p < 0.001), slightly older age (median age 64.0 vs 63.0 years, p = 0.024), and almost significant increase in the number of unmarried persons (21.0% vs 15.9%, p = 0.05), as displayed in Table 1. Comorbidities such as hypertension, diabetes, cancer, mental illness, dyslipidemia, and liver and kidney conditions were more prevalent in the CVD group (all p < 0.05). This group also displayed elevated frequencies of retirement and disability (20.0% vs 11.6% and 52.1% vs 41.2%, respectively; p < 0.01), reduced grip strength (median 26.1 vs 29.1, respectively; p < 0.001), and increased instances of poor self-perceived health and pain (48.2% vs 31.1% and 53.4% vs 36.6%, respectively; p < 0.001). Impaired vision and hearing were more common in the CVD cohort (p < 0.05). Clinical parameters such as SBP, body weight, waist circumference, BMI, HbA1c, CREA, and CYSC were notably higher in the CVD group (p < 0.05), accompanied by marginally reduced sleep duration (p = 0.038). No substantial variances were observed in urban-rural distribution, educational attainment, stroke incidence, or peak expiratory flow (p > 0.05).
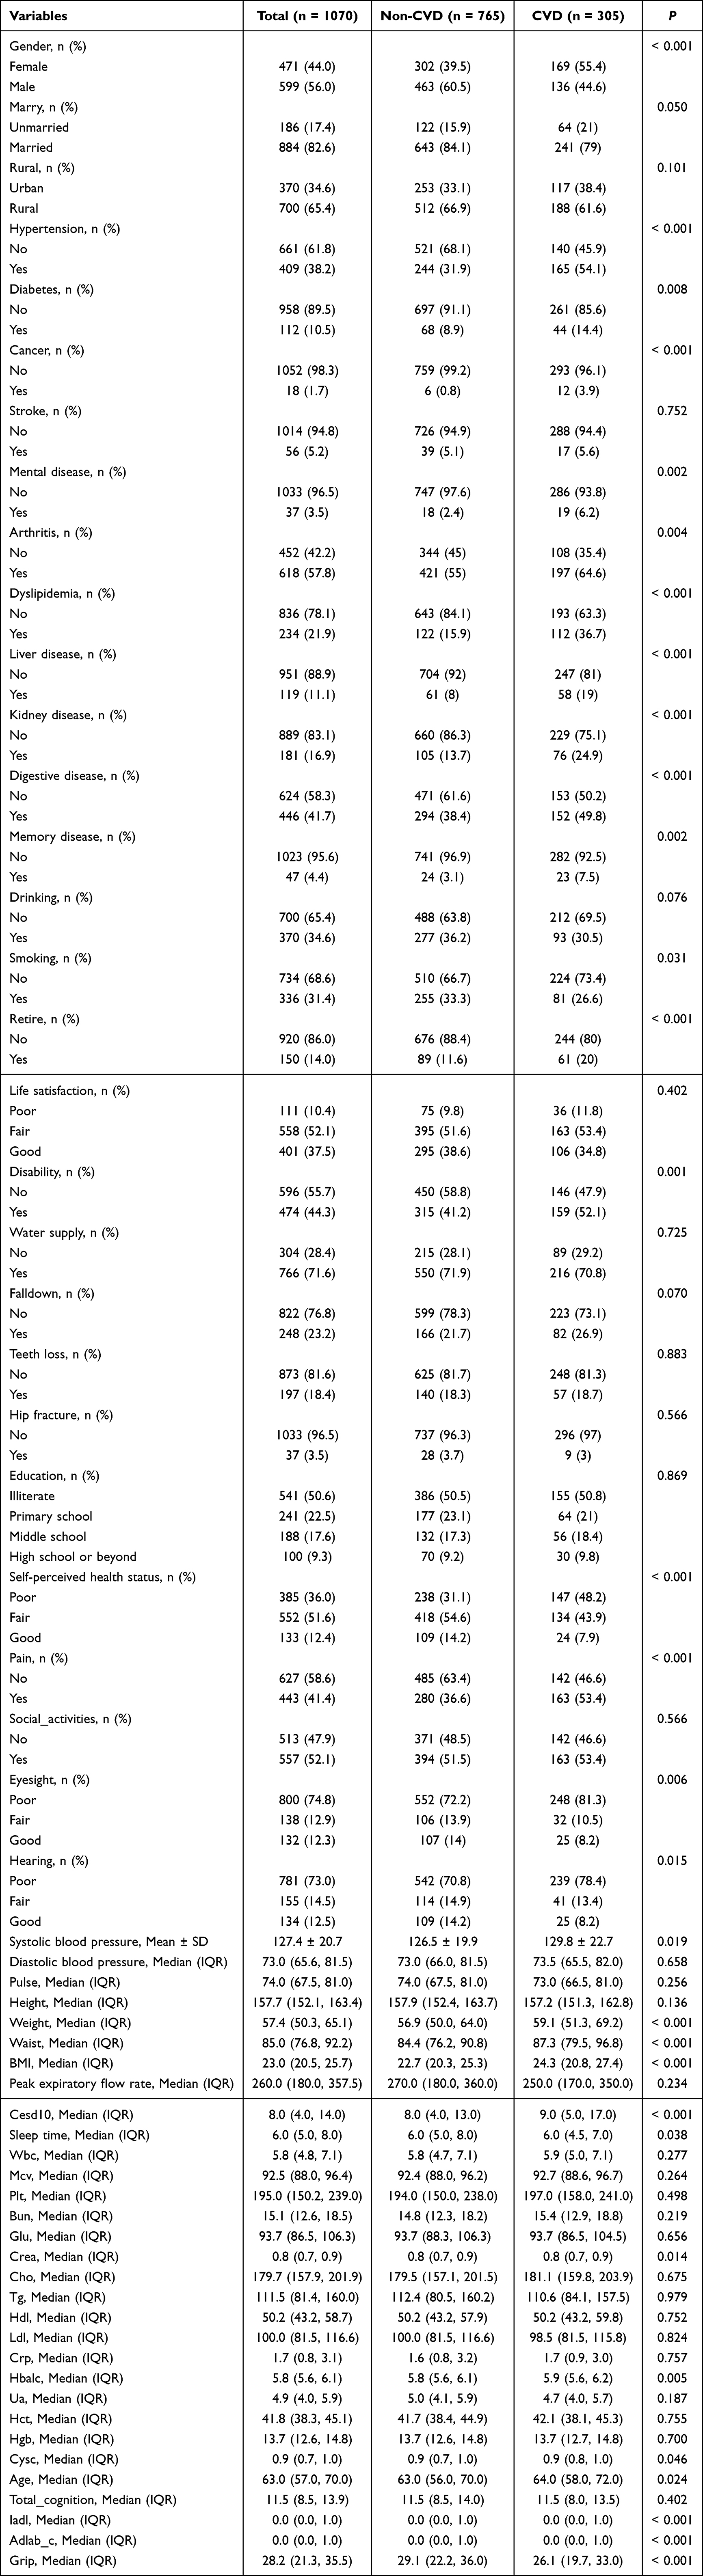 |
Table 1 Comparison of Baseline Data Between CVD Group and Non-CVDgroup |
Characterisation of CVD Incidence
Samples of non-CVD group and CVD group were randomly divided into training and test sets with 70% to 30% ratio. This equitable distribution of basic characteristics in both groups provided a good foundation for model training and validation. The best predictors for the model were found using LASSO regression and the Boruta algorithm. By taking the intersection of the features identified by the Boruta algorithm and LASSO regression, seven key predictors were ultimately selected: sex, hypertension, dyslipidemia, disability, self-rated health, vision status, and body weight, as shown in Table 2.
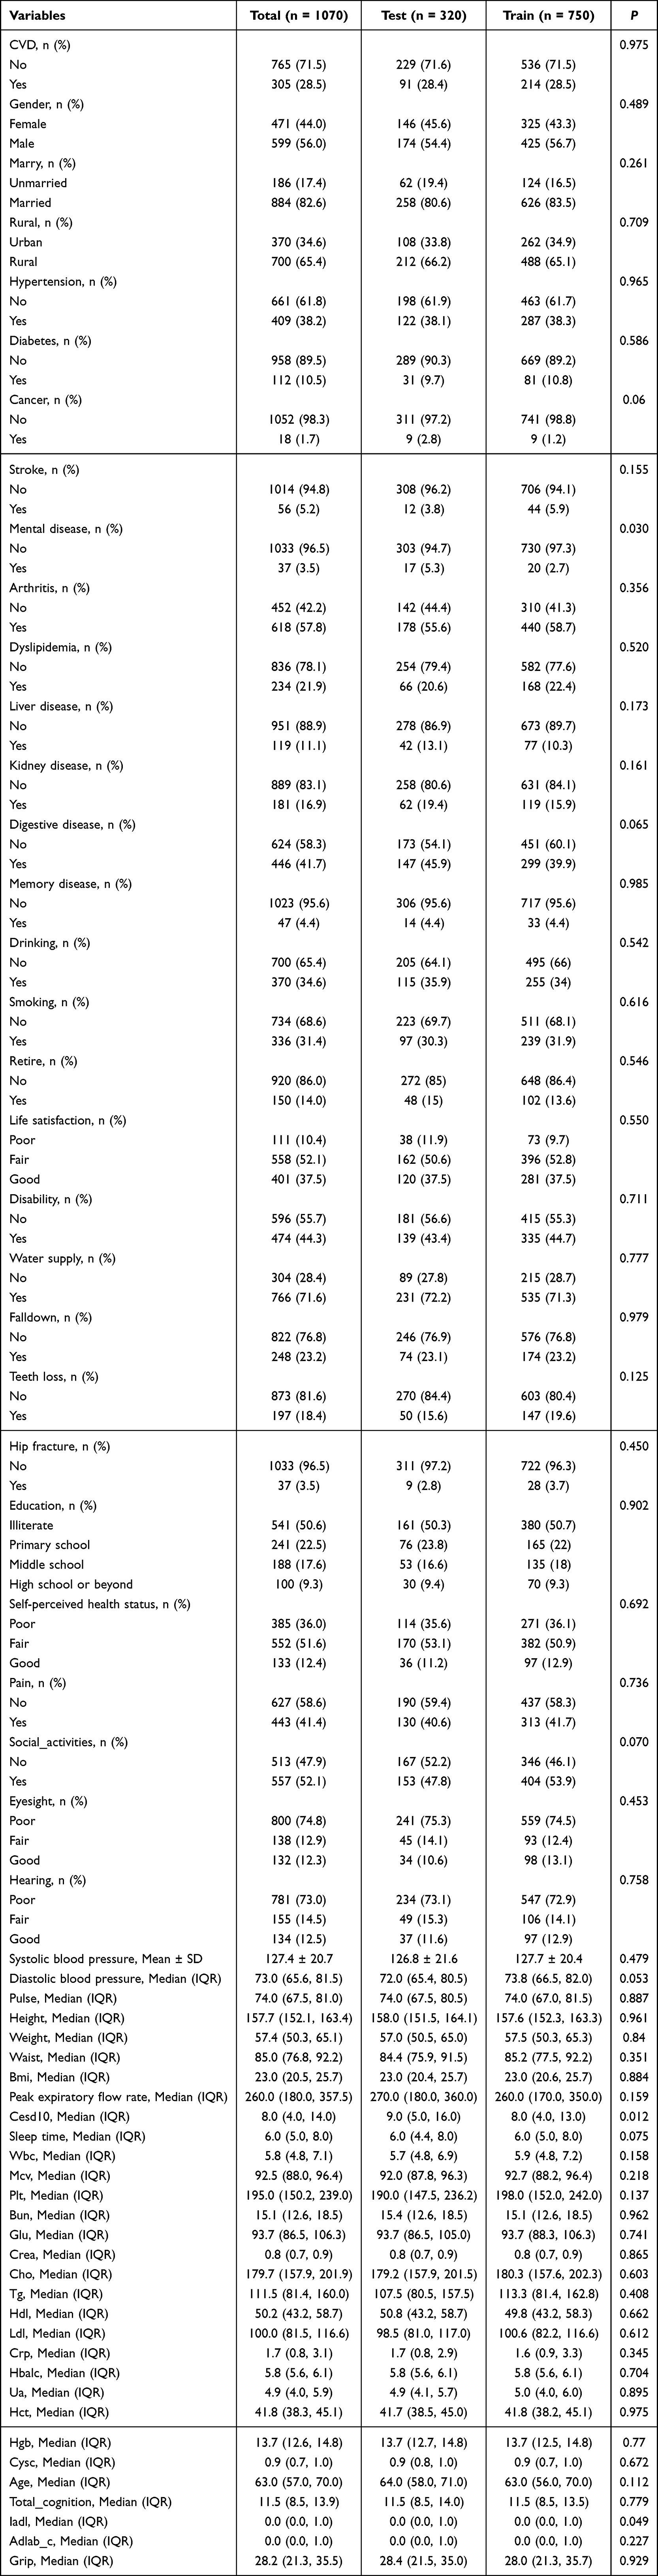 |
Table 2 Training Set and Test Set Variability Analysis |
Machine Learning Model Construction and Evaluation
The predictive performance of the six ML models is comprehensively detailed in Figure 2. Comparative analysis revealed distinct generalization patterns across these algorithms. While Logistic Regression and the Multi-Layer Perceptron (MLP) provided baseline predictive capabilities, the tree-based ensemble models—Random Forest, Light Gradient Boosting Machine (LightGBM), and XGBoost—exhibited pronounced overfitting, characterized by excellent discrimination in the training set followed by a substantial decline in test set performance. Conversely, the SVM demonstrated the most stable and robust generalization. In the training set, the SVM yielded an AUROC of 0.819 (95% CI: 0.793–0.844), with 74.42% accuracy (95% CI: 71.60–76.92), 75.56% sensitivity (95% CI: 71.70–79.12), 74.18% precision (95% CI: 70.17–77.66), 73.26% specificity (95% CI: 69.08–76.80), and 74.86% F1 score. Maintaining this robust performance in the independent test set, the SVM achieved the highest AUROC of 0.719 (95% CI: 0.670–0.760), 68.63% accuracy (95% CI: 64.16–72.85), 64.20% sensitivity (95% CI: 66.58–78.58), 66.53% precision (95% CI: 60.13–72.26), 64.96% specificity (95% CI: 58.03–70.65), and 69.36% F1 score. Although the 95% confidence intervals across the evaluated models largely overlapped (indicating that the differences in their numerical AUROCs were not strictly statistically significant), the SVM was definitively selected as the optimal model due to its superior generalization and resistance to the severe overfitting observed in the tree-based models. Overall, these findings indicate that the SVM framework provides the most reliable predictive capacity among all tested algorithms.
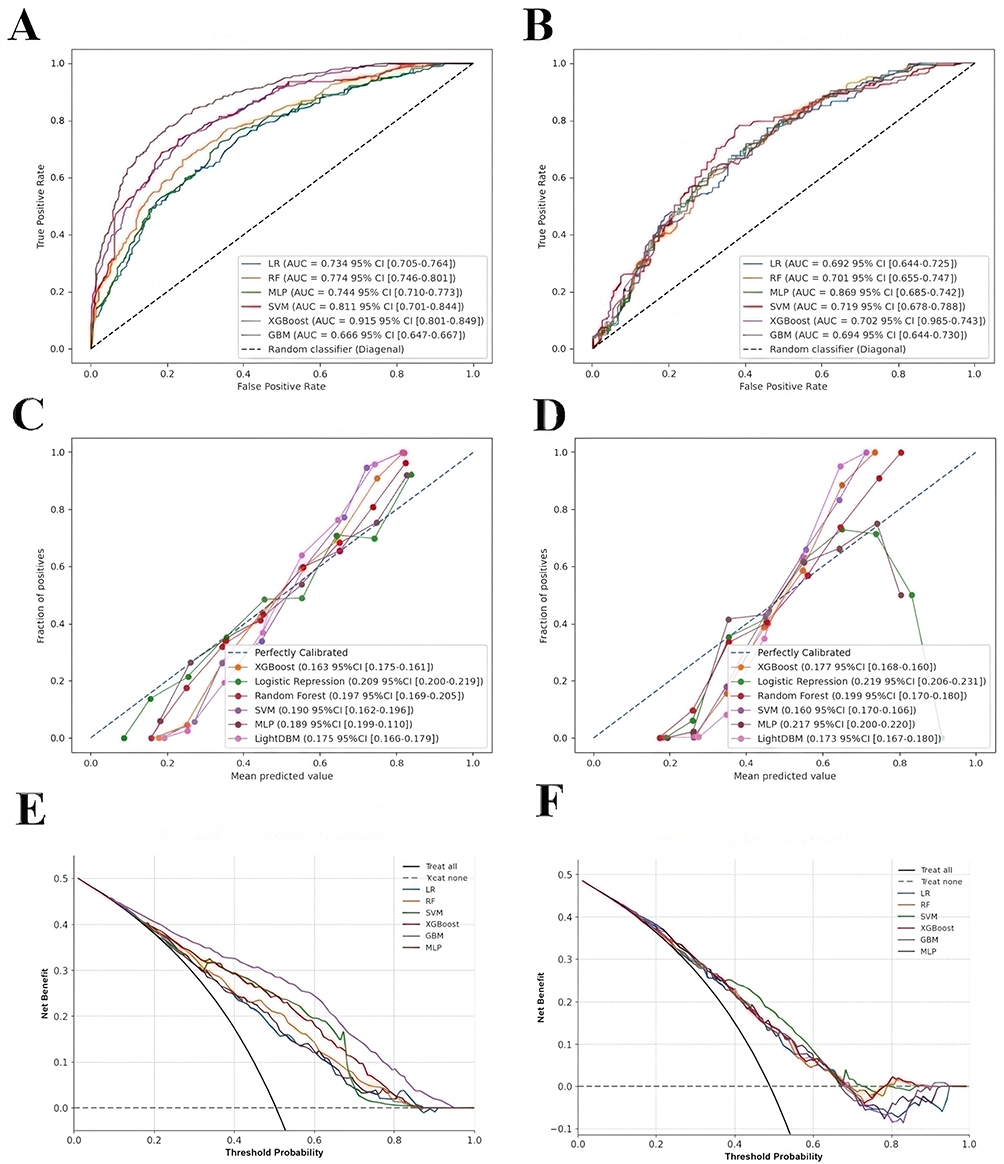 |
Figure 2 The performance and comparison of six different predictive models. (A) ROC curves generated from the training set; (B) ROC curves generated using the test set; (C) Calibration curve for the training set; (D) Calibration curve for the test set; (E) DCA curve for the training set; (F) DCA curve for the test set. |
Model Interpretation
Figure 3A shows the SHAP values of the predictive variables for cardiovascular event risk of COPD using the SVM model. The horizontal value is the effect of features on the model output, whereas the vertical value orders the predictive variables according to their significance. The color gradient represents different levels of feature values: high values of feature values are red and low values of feature values are blue. Body weight changes (red dots) tended to have positive SHAP values, suggesting that weight gain may be associated with increased cardiovascular event risk. The SRH, hypertension history (hibpe), and vision status (eyesight) also tended to have positive SHAP values. Note the dual nature of hypertension history: hypertension (red dots) tends to show positive SHAP values (higher cardiovascular risk) and hypertension (blue dots) tends to be low risk. Gender, dyslipidemia and disability status (disability) tend to have less influence on model predictions but are clinically relevant. The SHAP values were clustered and showed a more predictable impact on cardiovascular risk. Figure 3B lists the model variables by importance. Body weight, SRH, hypertension history (hibpe), and vision status (eyesight) were the top four predictors.
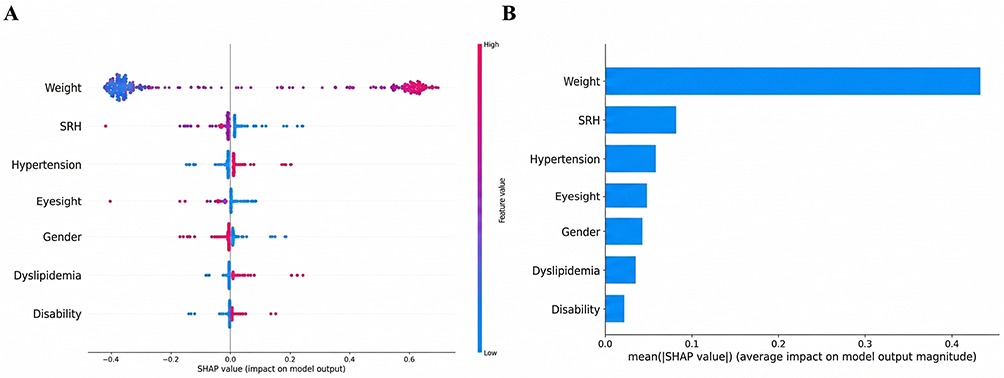 |
Figure 3 SHAP of the model. (A) Characteristic attributes in SHAP. The abscissa is the SHAP value, and each line denotes a feature. Higher eigenvalues are indicated by red dots, and lower eigenvalues are indicated by blue dots. (B) Importance ranking plot of features of the SVM model. |
Discussion
This study used a large public database and ML to predict and identify factors affecting cardiovascular events in patients with COPD. Conventional tools for assessing cardiovascular risk, such as Framingham or QRisk, may not accurately predict CVD in COPD patients,27 highlighting the need for further studies. Specified predictive models were developed for COPD patients in China that incorporate standard variables such as demographics, comorbidities, and health-related factors. One advantage of this study is that we used a large public database and ML to predict factors affecting cardiovascular events in patients with COPD. Our predictive model can predict the probability of cardiovascular events, improve our understanding of CVD risk in patients with COPD, and enhances early risk identification.
Using LASSO regression and the Boruta algorithm, we identified seven key variables that significantly increased the risk of CVD, including female sex, weight gain, hypertension, dyslipidemia, disability, low self-rated health scores, and visual impairment. Previous studies have strongly supported these connections. A global analysis of the prevalence of CVD from 2010 to 2019 showed significant sex and age differences, with women having a higher prevalence than men.20,28 Our results support these findings, showing that conventional risk factors, hormonal differences, and particular circumstances such as pregnancy and breast cancer treatments may affect women differently, and coronary heart disease guidelines recommend normal body weight.29 However, weight variability remains a critical determinant of long-term outcomes. A systematic review and meta-analysis showed that individuals with the highest weight variability were significantly more likely to experience cardiovascular events than those without (Relative Risk, RR=1.27, 95% CI 1.17–1.38). Moreover, each increase of 1 SD in BMI and weight variability was proportionally associated with increased risk.30 A study on the general population showed that adults who gained 10 kg without obesity or previous CVD history had a higher risk of myocardial infarction, angina pectoris and stroke, indicating the importance of weight gain in primary CVD prevention.31 Hypertension, the main CVD risk,32 was linked to higher risk of cardiovascular events in long-term study in South Korea, especially with SBP>150 mmHg.33 The increased levels of lipoprotein(a) [Lp(a)] further increased the CVD risk in hypertensive individuals, suggesting a synergistic effect when both conditions co-occur.34 Studies have shown that disability (no matter which type) can increase CVD risk and death more than non-disabled individuals.35 A follow-up study of ischemic stroke patients over 5 years found that functional disability (FD) at 3–6 months post-stroke independently increased the risk of cardiovascular events and all-cause mortality, especially when coupled with medium-high-risk vascular factors.36 Swedish Twin Aging Study showed the predictive value of self-rated health scores, 12 years follow-up associated CVD presence with worse self-rated health. Even with consideration of genetic and environmental factors, the effect of drug-treated CVD on survival was small, highlighting self-rated health as a significant predictor of mortality in CVD patients.37 The association between visual impairment and CVD has been tested in many studies. Both visual and hearing impairments are associated with an increased risk of chronic diseases in older populations.38 Genetic studies using Mendelian randomization have shown a correlation with sensory impairment as an early indication of chronic diseases,39 consistent with the understanding that age, smoking, and hypertension are common risk factors for cardiovascular and eye health. Clinical studies have shown that CVD prevalence is higher in patients with visual impairment than in those without.40 Notably, ophthalmic arterial ischemia due to carotid atherosclerotic stenosis is one of the main causes of visual impairment, and loss of vision suggests a risk of vascular lesions.41,42 Together, these studies confirm a strong link between the variables and cardiovascular events, supporting early intervention and clinical risk assessment.
The strong predictive value of these identified features closely aligns with the profound pathophysiological interplay between COPD and CVD. Specifically, the “spillover” of sustained systemic inflammation from the pulmonary compartment accelerates systemic atherosclerosis. Concurrently, chronic intermittent hypoxia and elevated oxidative stress directly induce widespread endothelial dysfunction and arterial stiffness. These hypoxia-driven vascular damages serve as critical biological bridges, explaining the heightened cardiovascular vulnerability in COPD patients. From a clinical perspective, understanding these mechanisms underscores the real-world applicability of our predictive model. By integrating this SVM-based framework into routine primary care screening protocols, clinicians can leverage readily available, non-invasive clinical data to proactively stratify risk, thereby facilitating timely cardiovascular interventions before acute events occur.
The SVM showed comparatively better performance than the other five ML models in terms of accuracy, sensitivity, precision, specificity, and F1. The AUROC score was 0.719 (95% CI: 0.670–0.760) on the Precision-Recall (PR) curve. The decision curve shows that model-guided interventions have good results across the spectrum and a few areas of low preference show less desirable results (Figure 2E and F). This is very useful in clinical applications. The calibration curve yielded a Brier score of 0.180 (95% CI: 0.170–0.189) in the test set. SVM is one of the general models of supervised learning, which provides a robust calibration and moderate predictive accuracy that makes it a useful prediction tool. The SVM model likely performed better than tree-based models (such as LightGBM and Random Forest) in our study due to its robust capability in handling moderate-sized, high-dimensional datasets with complex non-linear relationships. By utilizing the radial basis function (RBF) kernel, SVM effectively maps clinical and psychosocial features into a higher-dimensional space, maximizing the margin between CVD and non-CVD cases while resisting the overfitting that frequently plagues gradient boosting machines in smaller cohorts. It can handle small sample sizes, high dimensions, and non-linear distributions. It has advantages over other statistical models and emerging deep learning.43 Previous studies have investigated whether conventional forecasting techniques are effective in predicting the risk of cardiovascular events in COPD patients. A study using nationwide cohort data from Denmark and a multivariable logistic regression model to study the association between acute COPD exacerbations and severe cardiovascular events in stable concurrent CVD patients, found that cardiovascular event risk increases dramatically after moderate to severe COPD exacerbation peaks within months after severe exacerbation.44 Cobb et al studied COPD genotypes in a cross-sectional study of adults 40 years using National Health and Nutrition Examination Survey (NHANES) data. Logistic regression showed higher odds ratios for CVD in COPD than in control group: 1.76 (95% CI: 1.41–2.20) for chronic bronchitis, 2.31 (95% CI: 1.80–2.96) for emphysema and 2.98 (95% CI: 2.11–4.21) for combined COPD genotypes. These results suggest higher risk of CVD for all COPD genotypes and emphasize the importance of cardiovascular screening for emphysema and combination.45 We used data from CHARLS, a public database in China. We considered CHARLS data, including questionnaire scores, demographic data, health status, comorbidities, and blood test results, including peak expiratory flow, and built predictive models for a heart event in Chinese COPD patients using six ML algorithms. Such algorithms can identify features, navigate complex nonlinear relationships, and potentially surpass the traditional models.
This study provides useful information about the prediction of CVD in the Chinese COPD population. However, we must critically acknowledge that the predictive performance of our optimal SVM model (AUROC 0.719) is moderate, which is intrinsically tied to several inherent limitations of the dataset that cap its predictive power. First, the study relies on cross-sectional, retrospective data from a single source. This restricts our ability to capture the dynamic progression of COPD and limits the exploration of causal relationships between variables. Second, and most importantly, the CHARLS database lacks granular, COPD-specific clinical severity indicators—such as the Global Initiative for Chronic Obstructive Lung Disease (GOLD) classification, forced expiratory volume in 1 second (FEV1), acute exacerbation history, and the modified Medical Research Council (mMRC) dyspnea scale. Because pulmonary severity and exacerbation frequency are strong independent drivers of cardiovascular events, the absence of these core clinical metrics prevents the model from fully capturing the disease’s clinical heterogeneity, thereby imposing an inherent ceiling on the maximum achievable AUROC. Third, attempts to externally validate the model using foreign databases and other CHARLS years have failed to yield reliable results. Further studies should expand sample resources, conduct rigorous external validation, and incorporate clinical diagnostic data to improve applicability. Furthermore, due to the nature of the CHARLS database, our feature set lacks COPD-specific severity indicators, such as the GOLD stage, acute exacerbation history, and mMRC dyspnea scale, which limits the inclusion of pulmonary severity in the risk assessment. Finally, the identification of both COPD and CVD in our study relied exclusively on self-reported physician diagnoses, which is a common inherent constraint of large-scale epidemiological surveys like CHARLS. We must acknowledge that this approach inevitably introduces the risk of misclassification bias. On one hand, patients with mild or asymptomatic conditions, particularly those in rural areas with limited healthcare access, might remain underdiagnosed. On the other hand, recall bias among elderly participants could lead to the overreporting of specific conditions. Such misclassification could inherently affect the precision and generalizability of our predictive model. Despite including a comprehensive set of variables, the potential for residual confounding remains, as unmeasured factors such as detailed medication history, genetic predispositions, and specific dietary habits were unavailable. Moreover, while SHAP values significantly enhance model transparency, they inherently represent statistical associations rather than strict biological causality, which limits deep mechanistic interpretability.
Conclusion
In conclusion, this study developed an interpretable ML framework to identify risk factors for cardiovascular events in Chinese patients with COPD. While the SVM model achieved moderate and stable predictive performance, the findings remain strictly exploratory. The current model serves as a preliminary conceptual tool for risk stratification rather than a definitive clinical instrument. Given the inherent limitations of cross-sectional, self-reported data from a single database, rigorous prospective studies and external validation in independent clinical cohorts are essential before such predictive models can be safely deployed for individualized treatment and early intervention. Furthermore, future research efforts should focus on externally validating these predictive insights before attempting to translate them into actionable clinical decision-support systems (CDSS). If successfully validated, embedding such models into routine screening protocols could eventually assist clinicians in implementing personalized cardiovascular preventive strategies, thereby mitigating the dual disease burden for patients with COPD.
Acknowledgments
This research was funded by the Clinical Research Projects of the Affiliated Hospital of Guangdong Medical University (Grant No. LCYJ2020B008, LCYJ2022DL01).
Disclosure
The authors report no conflicts of interest in this work.
References
1. Kanani J. Autopsy analysis of sudden deaths in adults: causes and demographics from a one-year prospective study. Curr Health Sci J. 2025;51(3):343–17. doi:10.12865/CHSJ.51.03.05
2. Shnoda M, Gajjar K, Ivanova V. COPD and cardiovascular disease: a review of association, interrelationship, and basic principles for integrated management. Crit Care Nurs Q. 2021;44(1):91–102. doi:10.1097/CNQ.0000000000000342
3. Chen W, Thomas J, Sadatsafavi M, FitzGerald JM. Risk of cardiovascular comorbidity in patients with chronic obstructive pulmonary disease: a systematic review and meta-analysis. Lancet Respir Med. 2015;3(8):631–639. doi:10.1016/S2213-2600(15)00241-6
4. Chen H, Luo X, Du Y, et al. Association between chronic obstructive pulmonary disease and cardiovascular disease in adults aged 40 years and above: data from NHANES 2013–2018. BMC Pulm Med. 2023;23(1):159. doi:10.1186/s12890-023-02606-1
5. Goto T, Shimada YJ, Faridi MK, Camargo CA, Hasegawa K. Incidence of acute cardiovascular event after acute exacerbation of COPD. J Gen Intern Med. 2018;33(9):1461–1468. doi:10.1007/s11606-018-4518-3
6. Leong P, Macdonald MI, Ko BS, Bardin PG. Coexisting chronic obstructive pulmonary disease and cardiovascular disease in clinical practice: a diagnostic and therapeutic challenge. Med J Aust. 2019;210(9):417–423. doi:10.5694/mja2.50120
7. Li T, Chen L, Xu H, et al. The association between cardiovascular diseases and their subcategories with the severity of chronic obstructive pulmonary disease: a large cross-sectional study based on a Chinese hospital population cohort. Front Cardiovasc Med. 2025;12:1502341.
8. Maclay JD, McAllister DA, MacNee W. Cardiovascular risk in chronic obstructive pulmonary disease. Respirology. 2007;12(5):634–641. doi:10.1111/j.1440-1843.2007.01136.x
9. Gupta AS, Rajesh V, James P. Cardiovascular comorbidities associated with patients with chronic obstructive pulmonary disease – a hospital-based study. Egypt J Bronchol. 2020;13(5):591–595. doi:10.4103/ejb.ejb_64_19
10. Shi Y, Zhang J, Huang Y. Prediction of cardiovascular risk in patients with chronic obstructive pulmonary disease: a study of the National Health and Nutrition Examination Survey database. BMC Cardiovasc Disord. 2021;21(1):256. doi:10.1186/s12872-021-02225-w
11. Shah SA, Nwaru BI, Sheikh A, Simpson CR, Kotz D. Development and validation of a multivariable mortality risk prediction model for COPD in primary care. NPJ Prim Care Respir Med. 2022;32(1):31. doi:10.1038/s41533-022-00299-3
12. Lin X, Zhou T, Ni J, et al. CT-based whole lung radiomics nomogram: a tool for identifying the risk of cardiovascular disease in patients with chronic obstructive pulmonary disease. Eur Radiol. 2024;34(8):4852–4863. doi:10.1007/s00330-023-10502-9
13. Lucas-Ramos DP, Izquierdo-Alonso LJ, Bellon-Cano JM. Chronic obstructive pulmonary disease as a cardiovascular risk factor. Results of a case-control study (CONSISTE study). Int J Chron Obstruct Pulmon Dis. 2012;7:679–686. doi:10.2147/COPD.S36222
14. Wang Y, Fan Y, Bhatt P, Davatzikos C. High-dimensional pattern regression using machine learning: from medical images to continuous clinical variables. Neuroimage. 2010;50(1):151–164. doi:10.1016/j.neuroimage.2009.12.092
15. Heilbroner SP, Miotto R. Deep learning in medicine. Clin J Am Soc Nephrol. 2023;18(3):397–399. doi:10.2215/CJN.0000000000000080
16. Zhao X, Wang Y, Li J, et al. A machine-learning-derived online prediction model for depression risk in COPD patients: a retrospective cohort study from CHARLS. J Affect Disord. 2025;377:284–293. doi:10.1016/j.jad.2025.02.063
17. Liu T, Krentz A, Lu L, Curcin V. Machine learning based prediction models for cardiovascular disease risk using electronic health records data: systematic review and meta-analysis. Eur Heart J Digit Health. 2024;6(1):7–22. doi:10.1093/ehjdh/ztae080
18. Xi Y, Wang H, Sun N. Machine learning outperforms traditional logistic regression and offers new possibilities for cardiovascular risk prediction: a study involving 143, 043 Chinese patients with hypertension. Front Cardiovasc Med. 2022;9:905185. doi:10.3389/fcvm.2022.1025705
19. You J, Guo Y, Kang JJ, et al. Development of machine learning-based models to predict 10-year risk of cardiovascular disease: a prospective cohort study. Stroke Vasc Neurol. 2023;8(6):475–485. doi:10.1136/svn-2023-002332
20. Huang Q, Jiang Z, Shi B, et al. Characterisation of cardiovascular disease (CVD) incidence and machine learning risk prediction in middle-aged and elderly populations: data from the China health and retirement longitudinal study (CHARLS). BMC Public Health. 2025;25(1):120.
21. Zhou J, You D, Bai J, et al. Machine learning methods in real-world studies of cardiovascular disease. Cardiovasc Innov Appl. 2023;8(1):45–56.
22. Finkelstein J, Cha E, Scharf S. Chronic obstructive pulmonary disease as an independent risk factor for cardiovascular morbidity. Int J Chron Obstruct Pulmon Dis. 2009;4:337–349. doi:10.2147/COPD.S6400
23. Zhou H, Xin Y, Li S. A diabetes prediction model based on Boruta feature selection and ensemble learning. BMC Bioinformatics. 2023;24(1):156. doi:10.1186/s12859-023-05300-5
24. Chawla NV, Bowyer KW, Kegelmeyer WP. SMOTE: synthetic minority over-sampling technique. J Artif Intell Res. 2002;16:321–357. doi:10.1613/jair.953
25. Suykens J. Support vector machines: a nonlinear modelling and control perspective. Eur J Control. 2001;7(2–3):311–327. doi:10.3166/ejc.7.311-327
26. Ghawi R, Pfeffer J. Efficient hyperparameter tuning with grid search for text categorization using kNN approach with BM25 similarity. Open Comput Sci. 2019;9(1):160–180. doi:10.1515/comp-2019-0011
27. Amegadzie JE, Gao Z, Quint JK, et al. QRISK3 underestimates the risk of cardiovascular events in patients with COPD. Thorax. 2024;79(8):718–724. doi:10.1136/thorax-2023-220615
28. Rethemiotaki I. Global prevalence of cardiovascular diseases by gender and age during 2010–2019. Arch Med Sci Atheroscler Dis. 2024;8(1):196–205. doi:10.5114/amsad/176654
29. Dong SY, Yan ST, Wang ML, et al. Associations of body weight and weight change with cardiovascular events and mortality in patients with coronary heart disease. Atherosclerosis. 2018;274:104–111. doi:10.1016/j.atherosclerosis.2018.05.007
30. Massey RJ, Siddiqui MK, Pearson ER, Dawed AY. Weight variability and cardiovascular outcomes: a systematic review and meta-analysis. Cardiovasc Diabetol. 2023;22(1):145. doi:10.1186/s12933-022-01735-x
31. Kaneko H, Itoh H, Yotsumoto H, et al. Association of body weight gain with subsequent cardiovascular event in non-obese general population without overt cardiovascular disease. Atherosclerosis. 2020;306:15–20. doi:10.1016/j.atherosclerosis.2020.07.001
32. Poznyak AV, Sadykhov NK, Kartuesov AG, et al. Hypertension as a risk factor for atherosclerosis: cardiovascular risk assessment. Front Cardiovasc Med. 2022;9:837894. doi:10.3389/fcvm.2022.959285
33. Lee JY, Bak JK, Kim M, et al. Long-term cardiovascular events in hypertensive patients: full report of the Korean Hypertension Cohort. Korean J Intern Med. 2023;38(1):56–67. doi:10.3904/kjim.2022.249
34. Rikhi R, Bhatia HS, Schaich CL, et al. Association of Lp(a) (Lipoprotein[a]) and hypertension in primary prevention of cardiovascular disease: the Mesa. Hypertension. 2023;80(2):352–360. doi:10.1161/HYPERTENSIONAHA.122.20189
35. Son KY, Kim SH, Sunwoo S, et al. Association between disability and cardiovascular event and mortality: a nationwide representative longitudinal study in Korea. PLoS One. 2020;15(8):e0236665. doi:10.1371/journal.pone.0236665
36. Guan S, Zhang X, Liu H, et al. Is functional disability a risk equivalent to the comorbidity of multi-vascular risk factors for cardiovascular events and all-cause death? A 5-year follow-up study. Top Stroke Rehabil. 2020;27(7):553–562. doi:10.1080/10749357.2020.1738661
37. Bardage C, Isacson D, Pedersen NL. Self-rated health as a predictor of mortality among persons with cardiovascular disease in Sweden. Scand J Public Health. 2001;29(1):13–22. doi:10.1177/14034948010290010601
38. He J, Tang X, Jiang M, Zheng X. Associations between vision and hearing impairment and cardiovascular diseases: a longitudinal cohort of middle-aged and older adults in China. J Am Heart Assoc. 2024;13(21):e034851. doi:10.1161/JAHA.124.034851
39. Wang Y, Cheng F, Hou N, et al. Increased risk of chronic diseases and multimorbidity in middle-aged and elderly individuals with early vision, hearing, or dual sensory impairments: insights from prospective cohort studies and Mendelian randomization analysis. BMC Med. 2025;23(1):45. doi:10.1186/s12916-025-03872-y
40. Mendez I, Kim M, Lundeen EA, et al. Cardiovascular disease risk factors in US adults with vision impairment. Prev Chronic Dis. 2022;19:E42. doi:10.5888/pcd19.220027
41. Yoshida S, Oya S, Obata H, et al. Carotid endarterectomy restores decreased vision due to chronic ocular ischemia. Acta Neurochir. 2020;163(6):1767–1775. doi:10.1007/s00701-020-04603-3
42. Carbo AV, de la Fuente MGS, Garcia CP, Ruiz MNG. Orbital infarction syndrome after mechanical thrombectomy in acute ischaemic stroke. BMJ Case Rep. 2020;13(5):e234346.
43. Nedaie A, Najafi AA. Support vector machine with Dirichlet feature mapping. Neural Netw. 2018;106:60–72.
44. Løkke A, Hilberg O, Lange P, et al. Exacerbations predict severe cardiovascular events in patients with COPD and stable cardiovascular disease – a nationwide, population-based cohort study. Int J Chron Obstruct Pulmon Dis. 2023;18:419–429. doi:10.2147/COPD.S396790
45. Cobb K, Kenyon J, Lu J, et al. COPD is associated with increased cardiovascular disease risk independent of phenotype. Respirology. 2024;29(11):1047–1057. doi:10.1111/resp.14799
 © 2026 The Author(s). This work is published and licensed by Dove Medical Press Limited. The
full terms of this license are available at https://www.dovepress.com/terms
and incorporate the Creative Commons Attribution
- Non Commercial (unported, 4.0) License.
By accessing the work you hereby accept the Terms. Non-commercial uses of the work are permitted
without any further permission from Dove Medical Press Limited, provided the work is properly
attributed. For permission for commercial use of this work, please see paragraphs 4.2 and 5 of our Terms.
© 2026 The Author(s). This work is published and licensed by Dove Medical Press Limited. The
full terms of this license are available at https://www.dovepress.com/terms
and incorporate the Creative Commons Attribution
- Non Commercial (unported, 4.0) License.
By accessing the work you hereby accept the Terms. Non-commercial uses of the work are permitted
without any further permission from Dove Medical Press Limited, provided the work is properly
attributed. For permission for commercial use of this work, please see paragraphs 4.2 and 5 of our Terms.
Recommended articles
Using Machine Learning to Predict Likelihood and Cause of Readmission After Hospitalization for Chronic Obstructive Pulmonary Disease Exacerbation
Bonomo M, Hermsen MG, Kaskovich S, Hemmrich MJ, Rojas JC, Carey KA, Venable LR, Churpek MM, Press VG
International Journal of Chronic Obstructive Pulmonary Disease 2022, 17:2701-2709
Published Date: 20 October 2022
A Predictive Machine Learning Tool for Asthma Exacerbations: Results from a 12-Week, Open-Label Study Using an Electronic Multi-Dose Dry Powder Inhaler with Integrated Sensors

Lugogo NL, DePietro M, Reich M, Merchant R, Chrystyn H, Pleasants R, Granovsky L, Li T, Hill T, Brown RW, Safioti G
Journal of Asthma and Allergy 2022, 15:1623-1637
Published Date: 11 November 2022
Prevalence of Cardiovascular Disease and Rate of Major Adverse Cardiovascular Events in Severe Alpha-1 Antitrypsin Deficiency COPD
Ellis P, Bailey E, Choate R, Holm KE, Sandhaus RA, Turner AM, Newnham M
International Journal of Chronic Obstructive Pulmonary Disease 2024, 19:149-159
Published Date: 17 January 2024
Obstructive Airway Disease is Associated with Increased Cardiovascular Disease Risk Independent of Phenotype: Evidence from Two Nationwide Population-Based Studies
Meng K, Zhang X, Dai H
International Journal of Chronic Obstructive Pulmonary Disease 2025, 20:1435-1446
Published Date: 12 May 2025
Chronic Obstructive Pulmonary Disease and the Management of Cardiopulmonary Risk in the UK: A Systematic Literature Review and Modified Delphi Study
Shrikrishna D, Steer J, Bostock B, Dickinson SW, Piwko A, Ramalingam S, Saggu R, Stonham CA, Storey RF, Taylor CJ, Thakkar R, Gale CP
International Journal of Chronic Obstructive Pulmonary Disease 2025, 20:2073-2090
Published Date: 25 June 2025