Back to Journals » Neuropsychiatric Disease and Treatment » Volume 22
Development and Validation of a Prediction Model for Postoperative Delirium
Authors Li L, Qiao N, Yang X, Yang X
Received 23 January 2026
Accepted for publication 5 June 2026
Published 9 June 2026 Volume 2026:22 592611
DOI https://doi.org/10.2147/NDT.S592611
Checked for plagiarism Yes
Review by Single anonymous peer review
Peer reviewer comments 2
Editor who approved publication: Dr Rakesh Kumar
Laixi Li,1,* Ningning Qiao,2,* Xiaojuan Yang,3 Xiaohui Yang4
1Department of Anesthesiology, 541 General Hospital, Yuncheng, Shanxi Province, People’s Republic of China; 2Department of Orthopedics, 541 General Hospital, Yuncheng, Shanxi Province, People’s Republic of China; 3Department of Obstetrics, 541 General Hospital, Yuncheng, Shanxi Province, People’s Republic of China; 4Department of Anesthesiology, Xia County People’s Hospital, Yuncheng, Shanxi Province, People’s Republic of China
*These authors contributed equally to this work
Correspondence: Xiaohui Yang, Department of Anesthesiology, Xia County People’s Hospital, No. 56 Kangjie North Road, Xia County, Yuncheng, Shanxi Province, 044400, People’s Republic of China, Email [email protected]
Background: Postoperative delirium (POD) is a common and serious postoperative complication. Early identification of high-risk patients could facilitate targeted interventions.
Objective: To develop and validate a machine learning-based prediction model for POD using a multicenter retrospective cohort.
Methods: We analyzed data from 3000 surgical patients, divided into training (n=1400), internal testing (n=600), and external validation (n=1000) cohorts. Eight machine learning algorithms, including Random Forest (RF), XGBoost (XGB), LightGBM (LGBM), Support Vector Machine (SVM), K-Nearest Neighbors (KNN), Logistic Regression (LR), Decision Tree (DT), and Naive Bayes (NB), were systematically compared. The optimal model was selected based on Area Under the Curve (AUC), and interpretation was facilitated through SHapley Additive exPlanations (SHAP) analysis. Model calibration was assessed using Brier scores, and discrimination was evaluated through both internal and independent external validation.
Results: The Random Forest model demonstrated superior performance (training AUC: 0.913; internal testing AUC: 0.846; external validation AUC: 0.823; Brier score: 0.079), consistently identifying six key predictors: Chinese Mini Mental Status (CMMS) score, Prognostic Nutritional Index, ASA classification, age, dementia, and ICU admission.
Conclusion: This comprehensively validated machine learning framework, supported by rigorous multi-institutional validation and systematic algorithm benchmarking, provides an interpretable tool for risk stratification of POD. The identification of nutritional status as a leading predictor highlights previously underutilized targets for perioperative intervention.
Keywords: postoperative delirium, machine learning, prognostic nutritional index, SHapley additive exPlanations, Chinese mini mental status
Introduction
Postoperative delirium (POD) is a common and serious neuropsychiatric complication characterized by acute cognitive fluctuation. It is strongly associated with prolonged hospitalization, long-term cognitive decline, and increased mortality. Given the significant burden of POD on patient outcomes and healthcare resources, accurate and early risk stratification is crucial for implementing targeted preventative strategies. While various models have been developed for POD prediction, many suffer from limitations in generalizability due to single-center data, a lack of rigorous external validation, or insufficient transparency in their predictive mechanisms. Therefore, there is a pressing need for robust, interpretable, and externally validated machine learning models that can effectively identify high-risk patients across diverse clinical settings.
POD is a prevalent and serious neuropsychiatric complication characterized by acute cognitive fluctuation.1 It is strongly associated with prolonged hospitalization, long-term cognitive decline, and increased mortality.2 Given these severe sequelae, the early identification of high-risk patients is essential for implementing preventative strategies such as prehabilitation and pharmacological interventions. However, accurate prediction remains challenging because the etiology of delirium involves complex, non-linear interactions between physiological reserves and surgical stress. Traditional risk scores often rely on linear regression methods, which may fail to capture these intricate relationships and lack robustness across diverse patient populations.3,4
Machine learning (ML) offers a superior approach for modeling high-dimensional clinical data. Unlike conventional statistics, ML algorithms can detect subtle patterns and non-linear associations among risk factors. Despite this potential, the clinical adoption of ML models is currently hindered by two main limitations. First, many studies lack independent external validation, raising concerns about generalizability.5 Second, complex algorithms are frequently criticized as “black boxes” due to their lack of interpretability, making it difficult for clinicians to trust and understand the decision-making process underlying specific risk predictions.6
To address these challenges, this multicenter retrospective study aimed to develop and validate an interpretable machine learning framework for predicting postoperative delirium. We utilized a large dataset from multiple centers to ensure broad applicability and compared eight distinct algorithms to identify the optimal model. Furthermore, we integrated the SHapley Additive exPlanations (SHAP) method to resolve the “black box” issue. By visualizing the specific contributions of key predictors, including the Chinese Mini Mental Status (CMMS) score and the Prognostic Nutritional Index (PNI), this study provides a transparent tool to facilitate early risk stratification and guide personalized perioperative management.
Materials and Methods
Inclusion and Exclusion Criteria
This retrospective cohort study utilized data extracted from the electronic medical records systems of two medical centers in Shanxi Province. A total of 2000 patients who underwent surgery were consecutively enrolled from the 541 General Hospital between January 1, 2020, and December 31, 2024. These patients were randomly divided into a training cohort (n = 1400) and an internal testing cohort (n = 600) at a ratio of 7:3. To evaluate the generalizability of the model, an independent external validation cohort including 1000 patients who met the same eligibility criteria was collected from the Xia County People’s Hospital during the same study period.
Patients were eligible for inclusion if they met the following criteria: (1) aged 18 years or older; (2) underwent elective or emergency surgery under general or neuraxial anesthesia; (3) were admitted to the general ward or Intensive Care Unit (ICU) following surgery with an expected length of stay exceeding 24 hours; and (4) had complete clinical records, including preoperative cognitive assessment and postoperative delirium screening data.
Patients were excluded if they had: (1) inability to cooperate with preoperative cognitive assessment due to severe language barriers, profound deafness/blindness, or severe psychiatric disorders; (2) preoperative coma or a persistent vegetative state; (3) incomplete essential clinical data; or (4) planned discharge within 24 hours after surgery. Repeated surgeries of the same individual were excluded to avoid duplication, and only the data from the first qualifying surgery were retained for analysis.
All patient data were anonymized before analysis to ensure confidentiality. The study protocol was reviewed and approved by the Ethics Committees of both the 541 General Hospital and the Xia County People’s Hospital, and the requirement for informed consent was waived due to the retrospective nature of the study.
Data Collection
A comprehensive set of clinical variables was analyzed in this study, comprising demographic characteristics, comorbidities, perioperative factors, medication usage, and laboratory indicators. All data were systematically extracted from the electronic medical record systems of the participating hospitals and are summarized in Table 1. We strictly ensured that all predictor variables were recorded prior to the onset of postoperative delirium. Specifically, the variable “ICU admission” refers exclusively to the patient’s immediate postoperative disposition, which strictly preceded any subsequent diagnosis of POD during the three-day postoperative observation period.
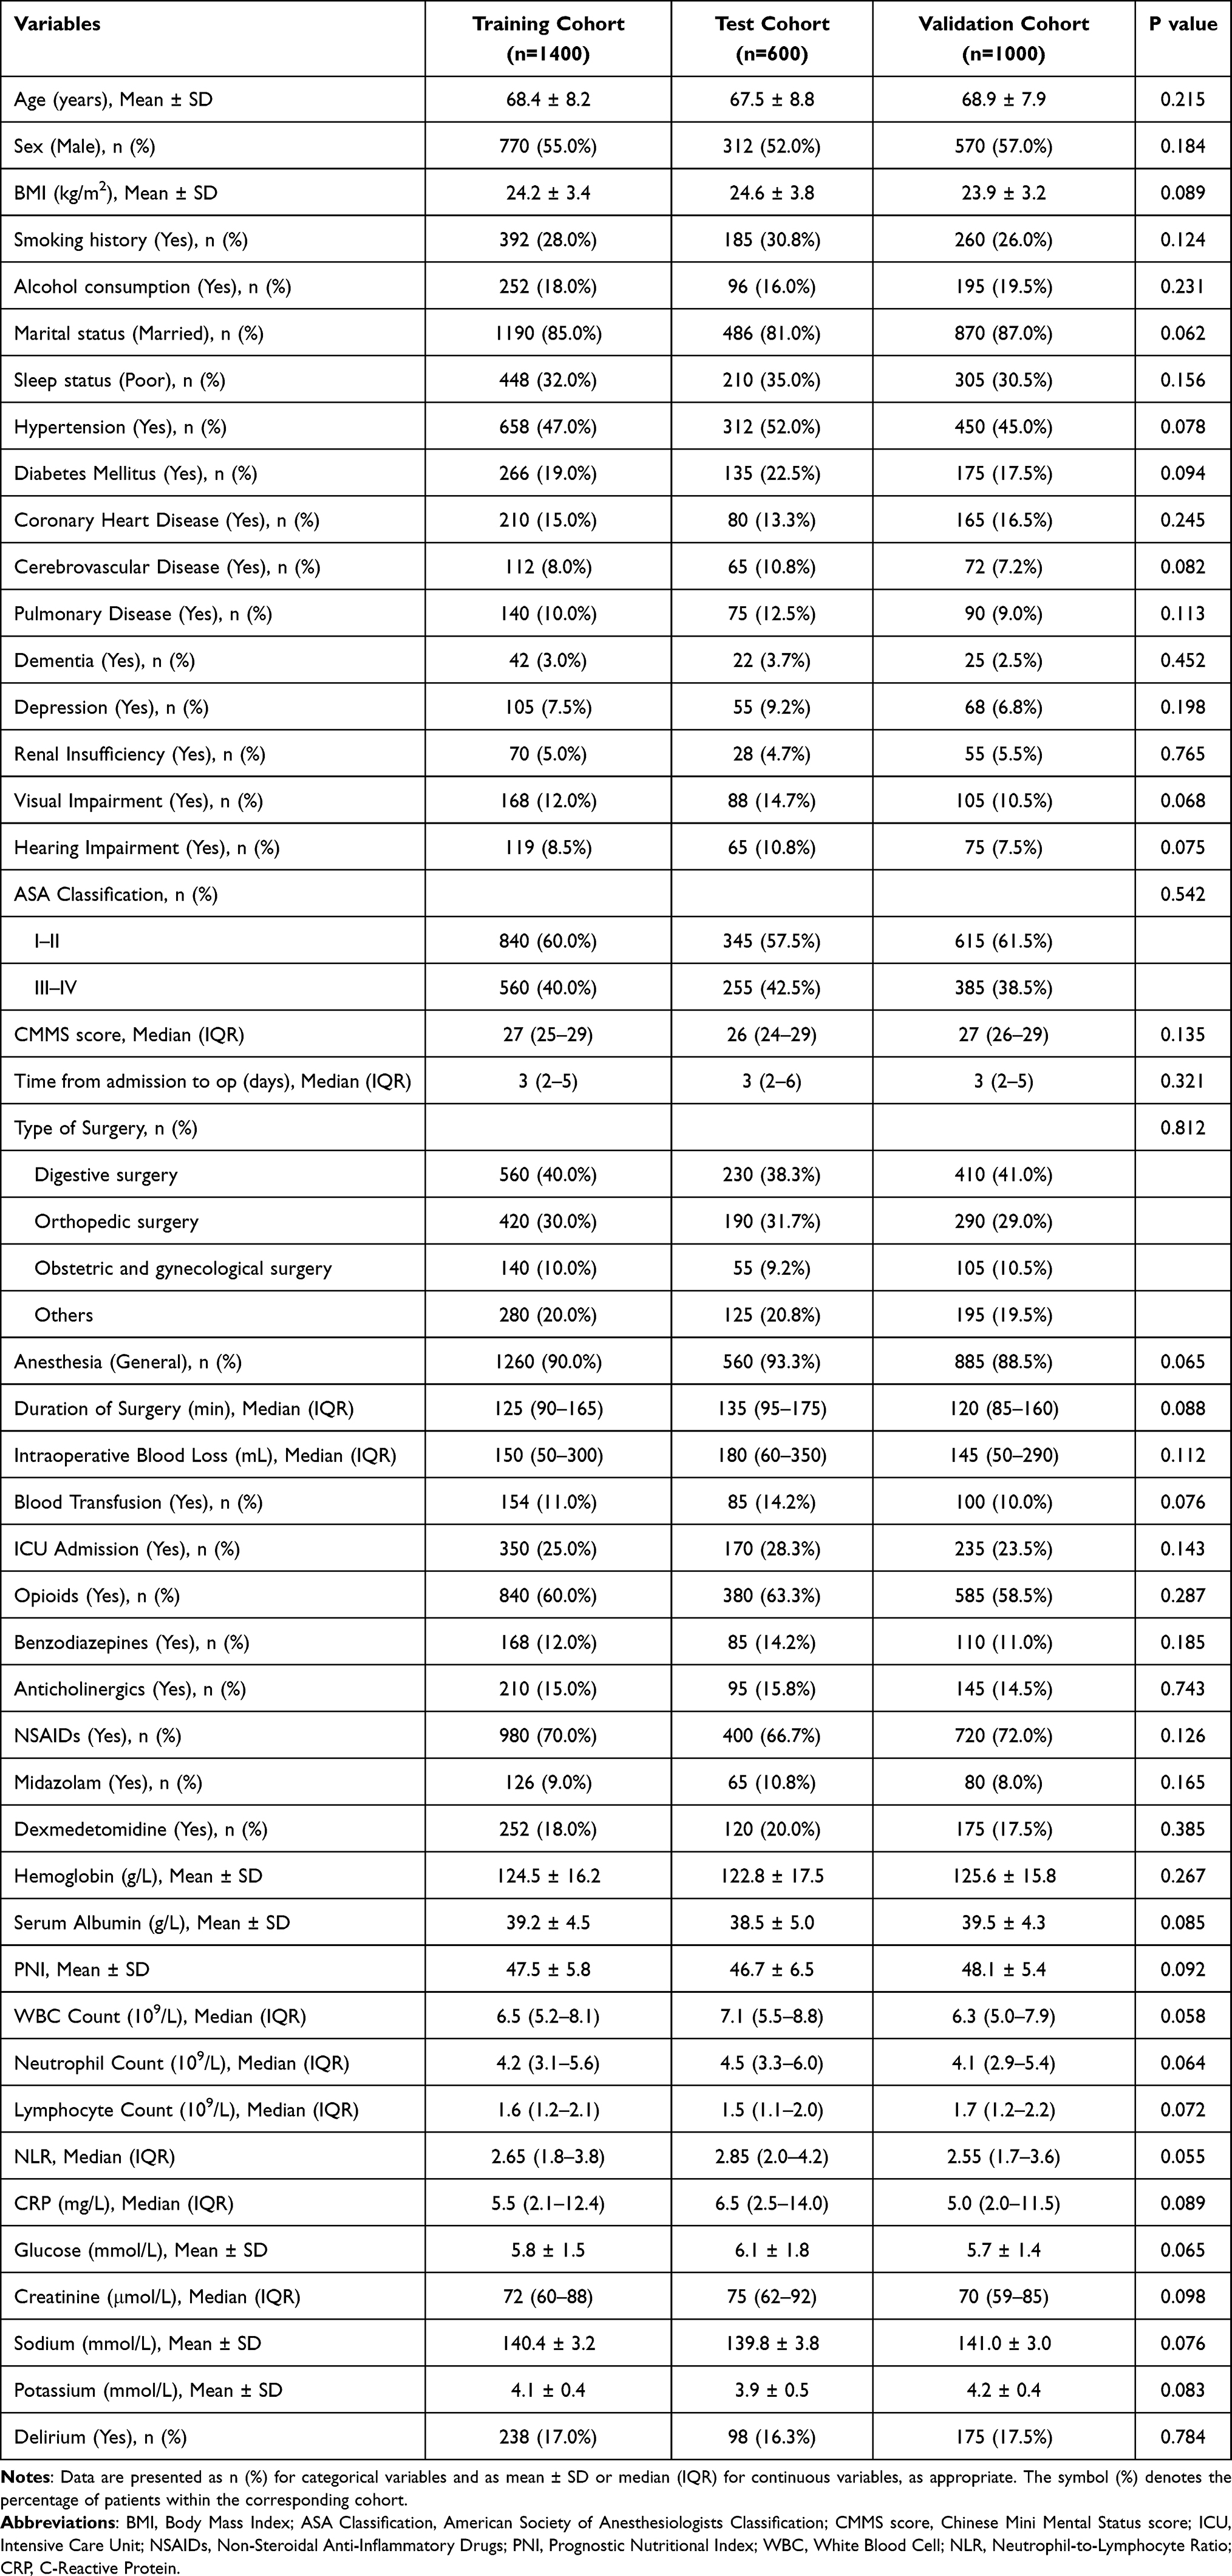 |
Table 1 Baseline Characteristics of Patients in the Training, Testing, and Validation Cohorts |
Demographic and Clinical Characteristics
Demographic and lifestyle variables included age, sex, body mass index (BMI), marital status, smoking history, alcohol consumption, and self-reported sleep quality. Clinical comorbidities were recorded as dichotomous variables, covering hypertension, diabetes mellitus, coronary heart disease, cerebrovascular disease, pulmonary disease, renal insufficiency, and depression. Sensory deficits, specifically visual and hearing impairments, were also documented. Dementia was defined as a documented medical history of major neurocognitive disorder. The American Society of Anesthesiologists (ASA) physical status was classified into two groups: I–II and III–IV.
Perioperative Factors and Medication
Surgical and anesthetic data included the time from admission to surgery, duration of surgery, anesthesia type (general or neuraxial), intraoperative blood loss, and blood transfusion requirements. The type of surgery was categorized into four groups: digestive surgery, orthopedic surgery, obstetric and gynecological surgery, and others. Detailed perioperative medication records were analyzed, including the use of opioids, benzodiazepines, anticholinergics, non-steroidal anti-inflammatory drugs (NSAIDs), midazolam, and dexmedetomidine. Postoperative admission to the Intensive Care Unit (ICU) was also recorded.
Laboratory Indicators
Routine preoperative laboratory markers included hemoglobin, white blood cell (WBC) count, neutrophil count, lymphocyte count, C-reactive protein (CRP), fasting glucose, serum creatinine, and electrolyte levels (sodium and potassium). Derived inflammatory and nutritional indices were also calculated. The Neutrophil-to-Lymphocyte Ratio (NLR) was computed, and the Prognostic Nutritional Index (PNI) was determined using the formula: PNI = 10 × serum albumin level (g/dL) + 0.005 × total lymphocyte count (per mm3).7
Cognitive Assessment
Preoperative cognitive status was quantitatively evaluated using the CMMS.8 This clinician-administered screening instrument typically requires 5 to 10 minutes to complete and assesses global cognitive function across seven distinct domains. These domains include orientation to time and place, registration of three words, attention and serial calculation, delayed recall, language functions, and visual constructional praxis. The total score ranges from 0 to 30, with lower scores indicating more severe cognitive impairment.
Data Management
The primary outcome was the incidence of postoperative delirium. All clinical data were routinely recorded by attending physicians and nurses at the time of care. To ensure data integrity, information was independently extracted and cross-verified by two trained researchers. Any inconsistencies were resolved through discussion under the supervision of the principal investigator. Given that the proportion of missing values for core clinical variables was extremely low (<5%), a single imputation method (mean/median imputation) was employed. This approach provides a robust and computationally efficient solution that preserves the original data distribution, avoiding the potential introduction of artificial noise or overfitting associated with complex multivariate imputation methods like MICE, which is particularly important for clinical parameters with strict physiological boundaries.
Outcome Measures
The primary outcome was the incidence of postoperative delirium occurring within three days after surgery. To ensure diagnostic accuracy, a rigorous two-step screening and adjudication process was implemented based on electronic medical records.
First, potential cases were flagged through a comprehensive screening of medical and nursing notes for key terms indicating mental status changes, such as “confusion”, “agitation”, or “disorientation”. Concurrently, patients prescribed new postoperative antipsychotic or sedative medications, including haloperidol, quetiapine, or olanzapine, were also flagged for review.
Second, all flagged cases underwent independent adjudication by a neurology specialist. The final diagnosis was confirmed according to the criteria outlined in the Diagnostic and Statistical Manual of Mental Disorders, Fifth Edition (DSM-5).9 This confirmation process involved a detailed review of vital signs, consciousness logs, Glasgow Coma Scale scores, and daily progress notes. Patients with evidence of preoperative delirium were excluded. To minimize bias, the adjudicating neurologists were fully blinded to all predictor variables, including PNI and ASA scores. This standardized assessment protocol was applied consistently across both the training and external validation cohorts.
Model Construction and Validation
The model construction phase was primarily conducted using the training cohort (n=1400). Eight distinct machine learning algorithms were developed, including Logistic Regression (LR), Decision Tree (DT), Random Forest (RF), Support Vector Machine (SVM), K-Nearest Neighbors (KNN), Naive Bayes (NB), Extreme Gradient Boosting (XGB), and Light Gradient Boosting Machine (LGBM). To optimize performance and prevent overfitting, grid search for hyperparameter tuning was applied alongside five-fold cross-validation. The performance of these eight models was comprehensively compared using the Area Under the Curve (AUC), multiple evaluation metrics (recall, precision, sensitivity, specificity, positive and negative predictive values, and F1-score). Based on these comparative analyses, the algorithm demonstrating the superior overall performance in the training cohort was identified as the optimal model for further validation. To ensure the adequacy of the sample size relative to model complexity, we calculated the Events Per Variable (EPV) ratio for the final model. With 238 POD events in the training cohort and 6 final predictors identified through dual-algorithm feature selection (LASSO and Boruta), the EPV was approximately 39.7, substantially exceeding the recommended minimum threshold of 10 for regression-based models and the more conservative threshold of 20 for machine learning prediction models. In the external validation cohort, 175 POD events and the same 6-predictor model yielded an EPV of approximately 29.2. These figures, together with the five-fold cross-validation strategy and LASSO-based shrinkage, provide strong assurance against model overfitting and support the statistical adequacy of the study.
The predictive capability of the selected optimal model was subsequently evaluated in both the internal testing cohort (n=600) and the independent external validation cohort (n=1000). In each cohort, model discrimination was quantified using Receiver Operating Characteristic (ROC) curves and the AUC value. Model calibration, reflecting the agreement between predicted probabilities and actual outcomes, was assessed using calibration plots and the Hosmer-Lemeshow test. The clinical utility and net benefit were evaluated using Decision Curve Analysis (DCA). Furthermore, to rigorously test the stability and robustness of the model within these specific datasets, five-fold cross-validation was also performed in both the testing and validation cohorts, with results visualized as fold-specific ROC curves. To mitigate the risk of generating biologically implausible synthetic patient profiles and distorting the natural epidemiological prevalence of postoperative delirium (POD), synthetic data generation techniques such as SMOTE were deliberately avoided. Instead, the inherent natural class imbalance was handled natively through the internal mechanisms of the selected machine learning algorithms, such as adjusting class weights and optimizing tree-based node splitting strategies. Model hyperparameter tuning was conducted using a rigorous Grid Search algorithm combined with k-fold cross-validation to prevent overfitting. We exhaustively evaluated a predefined hyperparameter space for all eight machine learning models, selecting the optimal combinations based on the highest Area Under the Curve (AUC) achieved on the validation folds. In addition to discriminative performance (AUC), model calibration was comprehensively assessed by calculating the Brier Score across the training, internal testing, and external validation cohorts. The Brier score evaluates the accuracy of probabilistic predictions, with values closer to 0 indicating superior calibration.
To ensure the clinical transparency of the optimal model, the SHapley Additive exPlanations (SHAP) framework was utilized. A SHAP summary plot was generated to reveal the global importance and directional impact of each predictor. Additionally, SHAP waterfall plots were constructed to visualize how specific features contributed to the predicted risk of delirium for individual patients, thereby facilitating personalized clinical decision-making.
Statistical Analyses
All statistical analyses and data visualizations were performed using R (version 4.4.2) and JD_DCPM (V6.11, Jingding Medical Technology Co., Ltd). Continuous variables were assessed for normality via the Shapiro–Wilk test. Normally distributed data are presented as mean ± standard deviation, with group comparisons conducted using Student’s t-tests. Non-normally distributed variables are expressed as median and interquartile range [M (Q1, Q3)] and analyzed via the Mann–Whitney-U test. Categorical variables are reported as frequencies (percentages) and evaluated using Chi-square tests or Fisher’s exact tests (for cell counts <5). Statistical significance was defined as a two-tailed p-value < 0.05.
Result
Basic Characteristics of the Patients
A total of 3000 patients meeting the inclusion criteria were ultimately enrolled in this study. The entire dataset was divided into three cohorts: a training cohort (n = 1400), a test cohort (n = 600), and an external validation cohort (n = 1000). The incidence of postoperative delirium was 17.0% (238/1400) in the training cohort, 16.3% (98/600) in the test cohort, and 17.5% (175/1000) in the validation cohort. No statistically significant difference was observed in the delirium incidence across the three groups (P = 0.784), indicating a balanced distribution of the outcome event.
The detailed baseline demographic and clinical characteristics of the patients are summarized in Table 1. There were no statistically significant differences among the three cohorts regarding age (P = 0.215), sex (P = 0.184), or BMI (P = 0.089). Preoperative comorbidities, such as hypertension (P = 0.078) and diabetes mellitus (P = 0.094), showed slight variations but remained statistically comparable across the groups. Similarly, preoperative cognitive status as assessed by the CMMS score (P = 0.135), and nutritional status indicated by PNI (P = 0.092) and serum albumin (P = 0.085), were well-balanced.
Regarding laboratory findings, certain inflammatory and metabolic markers, specifically WBC count (P = 0.058), NLR (P = 0.055), and blood glucose (P = 0.065), showed marginal differences with slightly higher levels observed in the test cohort. However, these differences did not reach statistical significance. Intraoperative factors, including the type of surgery, anesthesia method, and duration of surgery, were also consistently distributed across the training, test, and validation sets. Overall, the baseline characteristics confirm that the random splitting and cohort selection processes were effective, ensuring that the cohorts are representative of the same underlying population.
Feature Selection
Initially, we identified clinically relevant candidate predictors by combining a systematic literature review and clinical experience. These candidate variables encompassed demographics, preoperative comorbidities, laboratory findings, and intraoperative parameters.
To address potential multicollinearity and perform high-dimensional feature screening, LASSO regression analysis was first performed in the training cohort. By using 10-fold cross-validation to determine the optimal penalty parameter (λ), 11 variables with non-zero coefficients were retained from the initial pool (Figure 1A and B). Subsequently, to further evaluate the robustness of feature importance, the Boruta algorithm was employed. This random forest-based method compares the importance of original attributes with randomized “shadow” features. The Boruta analysis confirmed 13 features as “important” (green boxplots in Figure 1D), indicating they performed significantly better than random noise.
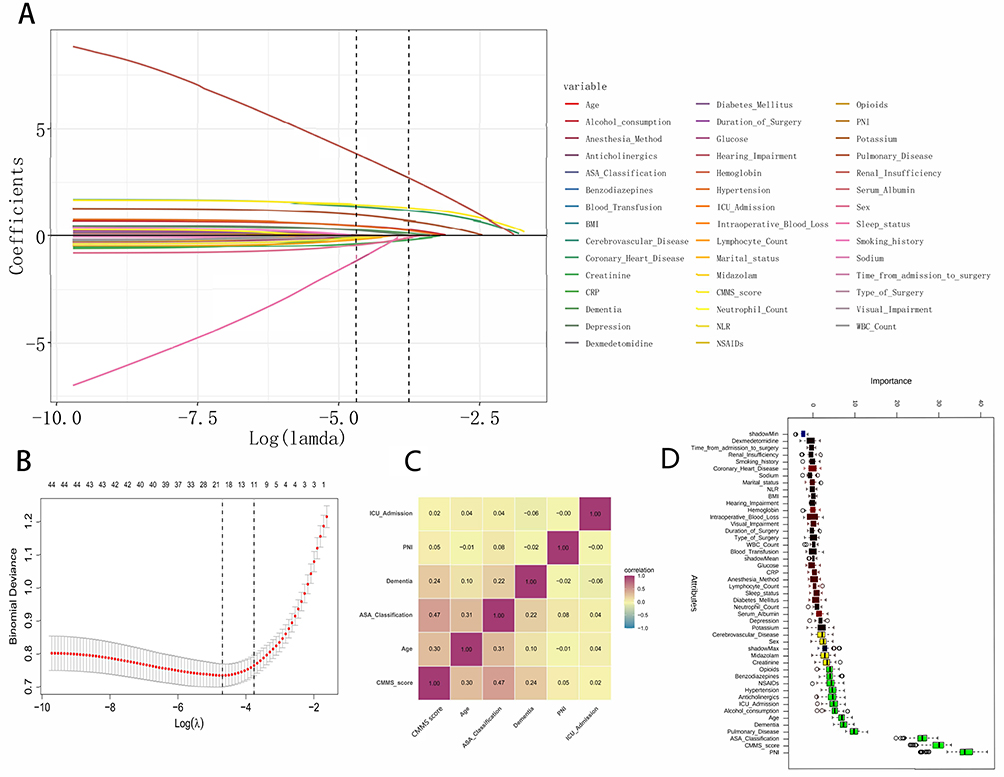 |
Figure 1 Feature selection and variable importance. (A) LASSO coefficient profiles of the candidate variables. Each curve corresponds to a variable. (B) Selection of the optimal tuning parameter (λ) in the LASSO regression using 10-fold cross-validation. The vertical dotted lines indicate the minimum mean squared error (left) and the 1-standard error criterion (right). (C) Correlation heatmap displaying the pairwise Spearman’s rank correlation coefficients among the final features selected by the intersection of LASSO and Boruta algorithms. The numbers inside the squares represent the correlation coefficients (r), while colors indicate the strength and direction (red for positive, blue for negative). (D) Feature importance ranking based on the Boruta algorithm. The boxplots represent the importance Z-scores of the candidate variables. Green boxplots indicate confirmed important features that performed significantly better than the randomized shadow features (ShadowMax, ShadowMean, ShadowMin). |
To ensure the reliability and generalizability of the final model, we selected the intersection of variables identified by both the LASSO and Boruta algorithms. Consequently, six key variables were determined as the final independent predictors: Age, Dementia, ASA Classification, CMMS score, ICU Admission, and Prognostic Nutritional Index (PNI). These selected features predominantly reflect two critical dimensions of patient status: cognitive reserve (Age, Dementia, CMMS score) and physiological vulnerability (ASA Classification, ICU Admission, PNI). This highlights that the interplay between pre-existing neurocognitive deficits and overall physical frailty serves as the most robust indicator of postoperative delirium, surpassing the predictive value of single isolated factors. A correlation heatmap of these final selected variables is shown in Figure 1C, confirming that they provide complementary information with minimal redundancy.
Model Development and Performance
Using the six identified independent predictors (Age, Dementia, ASA Classification, CMMS score, ICU Admission, and PNI), we constructed eight distinct machine learning models in the training cohort. The algorithms included Random Forest (RF), Naive Bayes (NB), Extreme Gradient Boosting (XGBoost), Logistic Regression (LR), Support Vector Machine (SVM), Light Gradient Boosting Machine (LGBM), K-Nearest Neighbors (KNN), and Decision Tree (DT). Following the exhaustive Grid Search cross-validation, the optimal hyperparameter configurations finalized for all eight machine learning algorithms are fully detailed in Supplementary Table S1.
The discriminative performance of these algorithms was systematically evaluated using ROC curve analysis, as illustrated in Figure 2A. Among all candidate models, the Random Forest classifier exhibited superior discriminative ability, achieving the highest Area Under the Curve (AUC) of 0.913 (95% CI: 0.890–0.936). This performance was notably better than that of the second-best model, Naive Bayes (AUC = 0.802, 95% CI: 0.765–0.839), as well as other widely used algorithms such as XGBoost (AUC = 0.792) and Logistic Regression (AUC = 0.787). A pairwise statistical comparison of the AUCs (Figure 2B) further confirmed that the predictive accuracy of the RF model was significantly higher than that of the other seven algorithms (P<0.05).
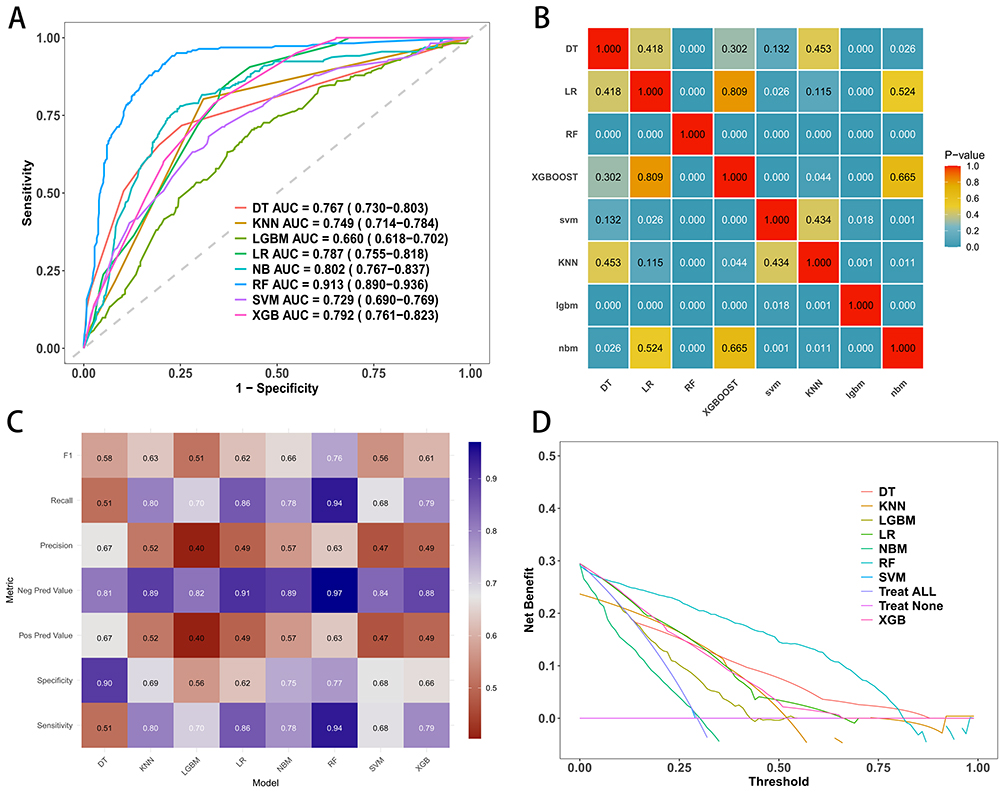 |
Figure 2 Comparison of different machine learning models in the training cohort. (A) Receiver Operating Characteristic (ROC) curves of eight machine learning models. The Random Forest (RF) model achieved the highest Area Under the Curve (AUC). (B) Heatmap of statistical comparison (P-values) between the AUCs of different models. (C) Heatmap visualizing the performance metrics (Sensitivity, Specificity, Precision, Recall, F1-score, etc.) of each model. (D) Decision Curve Analysis (DCA) comparing the clinical net benefit of different models across a range of threshold probabilities. |
Figure 2C further illustrates a comprehensive range of performance metrics for each model, including recall, precision, sensitivity, specificity, positive and negative predictive values, and F1-score. The Random Forest model consistently demonstrated balanced and superior performance across these multiple dimensions, exhibiting high sensitivity for detecting delirium while maintaining robust specificity. Furthermore, Decision Curve Analysis (DCA) was employed to assess the clinical utility of the models in the training phase (Figure 2D). The curves revealed that the RF model provided the highest net benefit across a wide range of threshold probabilities compared to the other seven algorithms and the “treat-all” or “treat-none” reference strategies.
Consequently, based on its optimal discrimination, balanced performance metrics, and superior clinical net benefit, the Random Forest model was selected as the final classifier for subsequent validation.
Model Performance on Both the Testing and External Validation Sets
To verify the robustness of the selected Random Forest model, we first evaluated its predictive performance in the internal testing cohort. As shown in Figure 3A, the model maintained excellent discriminative ability, yielding an AUC of 0.846 (95% CI: 0.817–0.875). The calibration curve demonstrated good agreement between the predicted probabilities of delirium and actual observations, with the curve closely following the ideal 45-degree diagonal line (Figure 3B). Furthermore, Decision Curve Analysis (DCA) indicated that the model offered a substantial net clinical benefit across a wide range of threshold probabilities in the testing set (Figure 3C). In addition, 5-fold cross-validation was performed to further verify the stability of the model predictions; as illustrated in Figure 3D, the model achieved a mean AUC of 0.823 (95% CI: 0.792–0.854), with performance across individual folds ranging from 0.782 to 0.862.
 |
Figure 3 Performance evaluation of the Random Forest (RF) model in the Test Cohort. (A) ROC curve of the RF model in the independent test cohort, showing the AUC with 95% confidence interval (CI). (B) Calibration curve of the RF model. The x-axis represents the predicted probability of postoperative delirium, and the y-axis represents the actual observed probability. The diagonal dotted line represents ideal prediction. (C) Decision Curve Analysis (DCA) for the RF model. The red line represents the net benefit of the RF model, which is higher than the “Treat All” or “Treat None” strategies within a wide range of thresholds. (D) ROC curves from 5-fold cross-validation in the test set, demonstrating the stability of the model. |
To further assess the generalizability of the model in a broader population, we validated its performance in the external validation cohort. The model exhibited strong predictive power with an AUC of 0.823 (95% CI: 0.792–0.854) (Figure 4A). Similar to the internal testing results, the calibration plot revealed a high degree of consistency between predicted and observed risks (Figure 4B). The DCA confirmed that using the model to guide clinical decisions would provide greater net benefit compared to the default “treat-all” or “treat-none” strategies (Figure 4C). Importantly, the ROC curves derived from 5-fold cross-validation in the external validation cohort (Figure 4D) demonstrated a mean AUC of 0.806 (95% CI: 0.773–0.838), further confirming that the model retains stable and robust generalization capabilities across different data subsets. The Random Forest (RF) model demonstrated excellent calibration, consistently yielding the lowest Brier scores across all datasets (0.052 in the Training cohort, 0.068 in the Testing cohort, and 0.079 in the Validation cohort), indicating a high degree of alignment between predicted probabilities and actual observed risks (Supplementary Table S2).
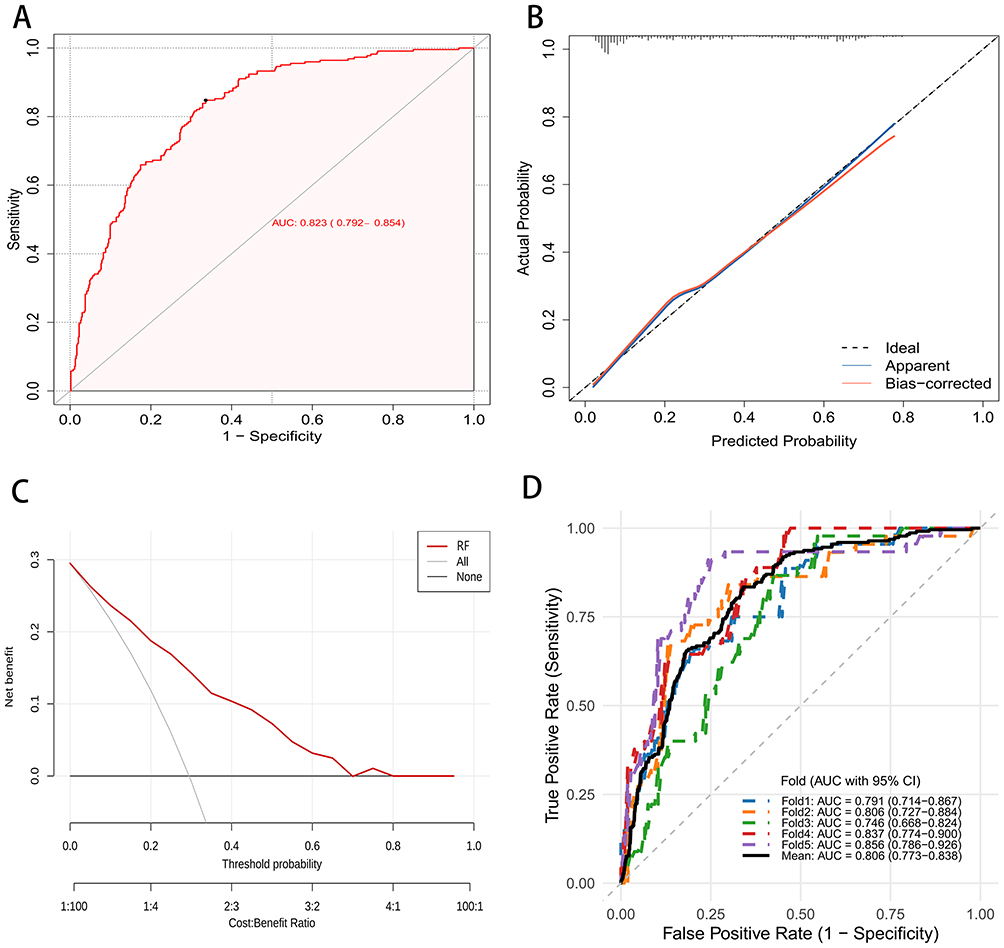 |
Figure 4 External validation of the Random Forest (RF) model in the Validation Cohort. (A) ROC curve of the RF model applied to the external validation cohort. (B) Calibration curve showing the agreement between predicted risks and actual outcomes in the validation cohort. (C) Decision Curve Analysis (DCA) demonstrating the clinical utility of the model in the validation cohort. (D) ROC curves showing the generalization performance of the model (with 5-fold validation or bootstrapping results) in the validation cohort. |
The slight and acceptable decrease in AUC values from the training cohort (0.913) to the internal testing (0.846) and external validation (0.823) sets suggests that the Random Forest model is stable and not overfitted to the training data.
Model Interpretation
To elucidate the underlying decision-making process of the Random Forest model and resolve the “black-box” issue commonly associated with machine learning, we employed the SHapley Additive exPlanations (SHAP) method to provide both global and local interpretability.
Figure 5A illustrates the global feature importance based on the mean absolute SHAP values. The results indicated that the CMMS score was the most influential predictor contributing to the model’s output, followed by PNI (Prognostic Nutritional Index), ASA Classification, Age, Dementia, and ICU Admission. This ranking highlights the critical role of cognitive status and nutritional condition in predicting the development of delirium.
 |
Figure 5 Model interpretability and visualization using SHAP analysis. (A) Bar plot of the mean absolute SHAP values, ranking the global importance of the predictors. (B) SHAP summary plot (beeswarm plot). Each dot represents a patient. The color represents the feature value (yellow for high, purple for low), and the position on the x-axis indicates the impact on the model output (positive SHAP values indicate increased risk of delirium). (C) SHAP waterfall plot explaining the prediction for an individual patient with a high risk of delirium. (D) SHAP waterfall plot explaining the prediction for an individual patient with a low risk of delirium. The arrows indicate how each feature pushes the prediction score higher (yellow) or lower (purple) from the base value. |
The SHAP summary plot (Figure 5B) further visualizes the directional impact of each feature on the predicted risk. In this plot, each point represents a sample, with color indicating the feature value (yellow for high, purple for low) and position on the x-axis representing the SHAP value (impact on model output). The analysis revealed that lower values (purple dots) of CMMS score and PNI were strongly associated with higher positive SHAP values, indicating an increased risk of delirium. Conversely, higher values (yellow dots) of ASA Classification, Age, Dementia status, and ICU Admission were positively correlated with the risk of delirium.
To demonstrate the clinical utility of the model at the individual level, we visualized the decision path for specific patients using force plots. Figure 5C displays an example of a high-risk prediction, where risk factors such as a low CMMS score (18), high ASA classification (III–IV), and advanced age (78) pushed the prediction score higher (yellow bars), outweighing the protective effects of other variables. In contrast, Figure 5D illustrates a different case where, despite a relatively low CMMS score, protective factors such as a younger age (51), lower ASA classification (I–II), and the absence of dementia or ICU admission (purple bars) effectively lowered the predicted risk. These individual-level explanations allow clinicians to understand why a specific prediction was made, facilitating personalized intervention strategies.
Discussion
In this multicenter retrospective study, we successfully developed and validated a robust machine learning framework for predicting Postoperative Delirium (POD). Among the eight algorithms evaluated, the Random Forest model demonstrated superior discrimination and calibration in both the internal testing and independent external validation cohorts. By integrating the SHAP interpretability framework, our study not only achieved high predictive accuracy but also quantified the specific contributions of risk factors. The results indicated that the CMMS score was the most influential predictor contributing to the model’s output, followed by PNI, ASA classification, Age, Dementia, and ICU admission. These findings underscore the multifactorial etiology of delirium, involving complex interactions between cognitive reserve, nutritional status, physiological vulnerability, and environmental stress.
The preoperative CMMS score emerged as the single most critical feature in our predictive model, a finding that strongly supports the cognitive reserve hypothesis. The CMMS score functions as a sensitive surrogate for baseline synaptic density and neural network integrity.10 Patients with lower preoperative scores possess a diminished neural buffer, rendering their brain networks highly susceptible to perioperative stressors such as anesthesia and surgical trauma.11,12 Mechanistically, a lower CMMS score often reflects underlying cholinergic deficiency and reduced neuroplasticity.13 When these vulnerable patients are exposed to surgical stress, the demand for neurotransmitter synthesis exceeds the brain’s limited capacity, leading to acute failure of network integration and the clinical manifestation of delirium.
Following cognitive baseline, the Prognostic Nutritional Index (PNI) was identified as the second most influential predictor. This highlights the often-overlooked role of nutritional-inflammatory status in brain health. PNI is a composite marker reflecting serum albumin levels and lymphocyte count. From a pathophysiological perspective, albumin functions as a vital antioxidant and a carrier for plasma ligands, playing a potential role in neuroprotection against oxidative stress.14 Conversely, hypoalbuminemia and lymphocytopenia are indicative of malnutrition and a suppressed immune system.15 This state of immunosenescence and frailty is closely linked to chronic systemic inflammation.16 The synergistic effect of malnutrition and inflammation likely compromises the blood-brain barrier and disrupts neural repair mechanisms, thereby lowering the threshold for delirium development.17
The ASA classification and patient age ranked next in importance, representing the overall physiological reserve and biological aging of the patient. The ASA classification serves as a global assessment of physical status and comorbidity burden. A higher ASA class correlates with reduced organ reserve, limiting the body’s ability to maintain hemodynamic and metabolic homeostasis during the perioperative period.18 This systemic instability can lead to transient cerebral hypoperfusion or hypoxia, which are direct precipitants of acute confusional states.19 Similarly, the predictive value of advanced age is mechanistically linked to the concept of “inflammaging” and primed microglia.20 In the aging brain, microglia are often in a sensitized state.21 Peripheral cytokines released during surgery, such as IL-6 and TNF-alpha, can penetrate the central nervous system and trigger these primed microglia to produce an exaggerated neuroinflammatory response, resulting in synaptic dysfunction and delirium.22
History of dementia and ICU admission were identified as the subsequent key predictors. While related to the CMMS score, a formal diagnosis of dementia represents established neuropathology, such as amyloid-beta deposition.23 These pathological changes severely compromise the integrity of the blood-brain barrier and neurotransmitter systems, making the brain exceptionally fragile to any insult.24 Finally, admission to the ICU introduces profound environmental and iatrogenic stress. The association between ICU stay and delirium is likely driven by sleep fragmentation, disruption of circadian rhythms, and sensory overload.25 Furthermore, the isolation inherent to the ICU environment, combined with the frequent administration of sedatives or analgesics with anticholinergic properties, can further decouple the patient from reality and aggravate cognitive dysfunction.26
The strengths of this study lie in its large multicenter dataset and the rigorous external validation, which ensures the generalizability of the findings across different clinical settings. The application of SHAP analysis addresses the black box limitation of machine learning, providing clinicians with a transparent tool to understand individual risk profiles. While the current model demonstrates strong discriminative performance, its applicability in urgent settings is constrained by CMMS requirements. We propose a tiered implementation framework: (1) full 6-predictor model for scheduled surgical settings with cognitive assessment capability; (2) simplified 5-predictor model using clinical cognitive proxies for urgent settings; (3) prospective validation of reduced-predictor variants. Beyond serving as a standalone prediction tool, this model framework facilitates risk-guided intervention allocation, particularly for emerging mechanistic insights regarding nutritional status optimization.
Several limitations must be acknowledged. First, the retrospective nature of the data limits our ability to infer causality. Second, although we employed a rigorous two-step screening and independent adjudication process based on DSM-5 criteria to minimize bias, the retrospective design precluded the use of standardized, prospective assessment tools like the CAM or CAM-ICU. Consequently, misclassification bias cannot be entirely ruled out, and hypoactive delirium may have been underdiagnosed, as its non-disruptive presentation is difficult to reliably capture through electronic medical record chart reviews. Third, the feasibility and validity of using the CMMS for preoperative cognitive assessment in urgent or emergency surgical settings are inherently limited. Factors such as acute pain, physiological instability, or severe anxiety may compromise patient performance, introducing measurement bias. Furthermore, this requirement introduces selection bias, as patients too distressed or unstable to complete the assessment were excluded, limiting the generalizability of our findings to the most critically ill emergency surgical population. Finally, while we included core clinical variables, the model did not incorporate intraoperative neurophysiological monitoring data or specific biomarkers, which could potentially enhance predictive precision. Regarding the research gap in machine learning modernization and explainability, we acknowledge that while the SHAP framework was employed to resolve the “black-box” issue, the integration of more advanced computational paradigms remains an area for future exploration. Our model is based on traditional machine learning algorithms, and it does not currently incorporate the latest hybrid approaches that combine fuzzy logic with deep learning. As highlighted by Fatima and Khushal, integrating fuzzy logic into the predictive pipeline could potentially enhance the clinical applicability of predictions by better handling the inherent uncertainties and “fuzziness” of clinical data.27 Future iterations of this model could explore these modernized frameworks to further improve interpretability and robustness. Prospective studies are warranted to validate whether guiding preventive strategies, such as nutritional prehabilitation or cognitive training based on this model, can effectively reduce the incidence of postoperative delirium. It is noteworthy that while this study employed the SHAP framework to address the “black-box” nature of machine learning, future POD prediction models could integrate advanced interpretability techniques as emerging technologies such as fuzzy logic, deep learning, and hybrid approaches evolve. This could include incorporating fuzzy logic into the machine learning pipeline to further enhance the clinical applicability of predictions, especially when dealing with the inherent uncertainties of clinical judgment. Furthermore, given the heterogeneity of different patient populations and clinical scenarios, developing adaptive, dynamic prediction frameworks capable of real-time optimization based on patient-specific characteristics may represent a significant advancement in this field.
Conclusion
This study constructed and externally validated a Random Forest model that accurately predicts the risk of postoperative delirium. The model identifies the preoperative CMMS score, PNI, ASA classification, Age, Dementia, and ICU admission as the primary determinants of risk. The model highlights the critical interplay between cognitive reserve, nutritional status, and physiological vulnerability as determinants of delirium risk. By quantifying individual patient risk through an interpretable framework, this model provides a foundation for risk-stratified perioperative management. However, the clinical utility of this prediction tool in improving patient outcomes remains to be demonstrated through prospective studies evaluating whether guiding preventive interventions based on this model reduces the incidence of postoperative delirium and improves postoperative cognitive trajectory.
Data Sharing Statement
All original data can be available from the corresponding author upon request.
Ethical Approval and Consent to Participate
This study adhered to the principles of the Declaration of Helsinki and was approved by the Institutional Review Board of the Ethics Committee of 541 General Hospital and the Xia County People’s Hospital (Approval No. 2026002). The informed consent is waived by the ethics committee because this is a retrospective design study. Patient confidentiality and data privacy were strictly safeguarded throughout the study.
Acknowledgments
This study was generously supported by Jingding Medical Tech, to whom we extend our sincere gratitude. We especially thank them for providing authorization and technical support for the JD_DCPM software. The team at Jingding Medical Tech offered invaluable assistance in data processing.
Author Contributions
All authors made a significant contribution to the work reported, whether that is in the conception, study design, execution, acquisition of data, analysis and interpretation, or in all these areas; took part in drafting, revising or critically reviewing the article; gave final approval of the version to be published; have agreed on the journal to which the article has been submitted; and agree to be accountable for all aspects of the work.
Funding
The authors received no financial support for the research, authorship, or publication of this article.
Disclosure
The authors report no conflicts of interest in this work.
References
1. Mufti HN, Hirsch GM, Abidi SR, et al. Exploiting machine learning algorithms and methods for the prediction of agitated delirium after cardiac surgery: models development and validation study. JMIR Med Inform. 2019;7(4):e14993. doi:10.2196/14993
2. Dodsworth BT, Reeve K, Falco L, et al. Development and validation of an international preoperative risk assessment model for postoperative delirium. Age Ageing. 2023;52:afad086. doi:10.1093/ageing/afad086
3. Zhao H, You J, Peng Y, et al. Machine learning algorithm using electronic chart-derived data to predict delirium after elderly hip fracture surgeries: a retrospective case-control study. Front Surg. 2021;8:634629. doi:10.3389/fsurg.2021.634629
4. Bishara A, Chiu C, Whitlock EL, et al. Postoperative delirium prediction using machine learning models and preoperative electronic health record data. BMC Anesthesiol. 2022;22:8. doi:10.1186/s12871-021-01543-y
5. Evered LA, Chan MTV, Han R, et al. Anaesthetic depth and delirium after major surgery: a randomised clinical trial. Br J Anaesth. 2021;127:704–16. doi:10.1016/j.bja.2021.07.021
6. Kwon Y-S, Kim J-H, Lee -J-J, et al. The relationship between perioperative blood transfusion and postoperative delirium in patients undergoing spinal fusion surgery: clinical data warehouse analysis. Medicina. 2022;58:268. doi:10.3390/medicina58020268
7. Wang Y, Jiang Y, Luo Y, et al. Prognostic nutritional index with postoperative complications and 2-year mortality in hip fracture patients: an observational cohort study. Int J Surg. 2023;109:3395–3406. doi:10.1097/JS9.0000000000000614
8. Katzman R, Zhang M, Ouang-Ya-Qu, et al. A Chinese version of the mini-mental state examination; impact of illiteracy in a shanghai dementia survey. J Clin Epidemiol. 1988;41(10):971–978. doi:10.1016/0895-4356(88)90034-0
9. First MB. Diagnostic and statistical manual of mental disorders, 5th edition, and clinical utility. J Nerv Ment Dis. 2013;201:727–729. doi:10.1097/NMD.0b013e3182a2168a
10. Astalosch M, Mousavi M, Ribeiro LM, et al. Risk factors for postoperative delirium severity after deep brain stimulation surgery in Parkinson’s disease. J Parkinsons Dis. 2024;14:1175–1192. doi:10.3233/JPD-230276
11. Stošić M, Perić V, Milić D, et al. Analyzing key predictors of postoperative delirium following coronary artery bypass grafting and aortic valve replacement: a machine learning perspective. Medicina. 2025;61:883. doi:10.3390/medicina61050883
12. Ning M, Rodionov A, Ross JM, et al. Prediction of postoperative delirium in older adults from preoperative cognition and occipital alpha power from resting-state electroencephalogram. Age Ageing. 2025;54(11). doi:10.1101/2024.08.15.24312053
13. Song Y, Zhang D, Wang Q, et al. Prediction models for postoperative delirium in elderly patients with machine-learning algorithms and SHapley additive exPlanations. Transl Psychiatry. 2024;14:57. doi:10.1038/s41398-024-02762-w
14. Wang W, Yao W, Tang W, et al. Association between preoperative albumin levels and postoperative delirium in geriatric hip fracture patients. Front Med. 2024;11:1344904. doi:10.3389/fmed.2024.1344904
15. Ritter C, Tomasi CD, Dal-Pizzol F, et al. Inflammation biomarkers and delirium in critically ill patients. Crit Care. 2014;18:R106. doi:10.1186/cc13887
16. Chen J, Yu J, Zheng C, et al. Preoperative prognostic nutritional index is useful factor for predicting postoperative delirium after primary total joint arthroplasty. BMC Musculoskeletal Disorders. 2021;22. doi:10.21203/rs.3.rs-135710/v1
17. Yu C, Chen L, Lei X, et al. Comparative analysis of four nutritional scores in predicting delirium in ICU patients. Front Nutr. 2025;12:1482150.
18. Lemstra AW, Kalisvaart KJ, Vreeswijk R, et al. Pre‐operative inflammatory markers and the risk of postoperative delirium in elderly patients. Int J Geriat Psychiatry. 2008;23:943–948. doi:10.1002/gps.2015
19. Barrientos RM, Hein AM, Frank MG, et al. Intracisternal interleukin-1 receptor antagonist prevents postoperative cognitive decline and neuroinflammatory response in aged rats. J Neurosci. 2012;32(42):14641–14648. doi:10.1523/JNEUROSCI.2173-12.2012
20. Zheng P, Tian X, Zhang W, et al. Rhein suppresses neuroinflammation via multiple signaling pathways in LPS‐stimulated BV2 microglia cells. Evid Based Complement Alternat Med. 2020;2020:7210627. doi:10.1155/2020/7210627
21. Qiu -L-L, Pan W, Luo D, et al. Dysregulation of BDNF/TrkB signaling mediated by NMDAR/Ca2+/calpain might contribute to postoperative cognitive dysfunction in aging mice. J Neuroinflamm. 2020;17:23. doi:10.1186/s12974-019-1695-x
22. Terrando N, Eriksson LI, Kyu Ryu J, et al. Resolving postoperative neuroinflammation and cognitive decline. Ann Neurol. 2011;70:986–995. doi:10.1002/ana.22664
23. Tilouche N, Hassen MF, Ali HBS, et al. Delirium in the intensive care unit: incidence, risk factors, and impact on outcome. Ind J Crit Care Med. 2018;22:144–149. doi:10.4103/ijccm.IJCCM_244_17
24. Chan CK, Song Y, Greene R, et al. Meta-analysis of ICU delirium biomarkers and their alignment with the NIA-AA research framework. Am J Crit Care. 2021;30:312–319. doi:10.4037/ajcc2021771
25. Wilcox ME, Burry L, Englesakis M, et al. Intensive care unit interventions to promote sleep and circadian biology in reducing incident delirium: a scoping review. Thorax. 2024;79:988–997. doi:10.1136/thorax-2023-220036
26. Fullerton JL, Hay J, Bryant-Craig C, et al. Pediatric traumatic brain injury and microvascular blood-brain barrier pathology. JAMA Network Open. 2024;7:e2446767. doi:10.1001/jamanetworkopen.2024.46767
27. Fatima U, Khushal R. Enhancing explainability in epidemiological predictions using fuzzy logic integrated with machine and deep learning algorithms. Sci Rep. 2025;15:36139. doi:10.1038/s41598-025-10689-5
 © 2026 The Author(s). This work is published and licensed by Dove Medical Press Limited. The
full terms of this license are available at https://www.dovepress.com/terms
and incorporate the Creative Commons Attribution
- Non Commercial (unported, 4.0) License.
By accessing the work you hereby accept the Terms. Non-commercial uses of the work are permitted
without any further permission from Dove Medical Press Limited, provided the work is properly
attributed. For permission for commercial use of this work, please see paragraphs 4.2 and 5 of our Terms.
© 2026 The Author(s). This work is published and licensed by Dove Medical Press Limited. The
full terms of this license are available at https://www.dovepress.com/terms
and incorporate the Creative Commons Attribution
- Non Commercial (unported, 4.0) License.
By accessing the work you hereby accept the Terms. Non-commercial uses of the work are permitted
without any further permission from Dove Medical Press Limited, provided the work is properly
attributed. For permission for commercial use of this work, please see paragraphs 4.2 and 5 of our Terms.
Recommended articles
Using Machine Learning Algorithms to Predict High-Risk Factors for Postoperative Delirium in Elderly Patients
Liu Y, Shen W, Tian Z
Clinical Interventions in Aging 2023, 18:157-168
Published Date: 8 February 2023
Preoperative Prognostic Nutritional Index Is a Predictive Factor for Postoperative Delirium in Elderly Patients with Femoral Neck Fracture
Xu Y, Luo Y
Clinical Interventions in Aging 2025, 20:941-950
Published Date: 2 July 2025
Using Interpretable Machine Learning with SHAP to Assess Dynapenic Abdominal Obesity as a Stroke Risk Predictor: A Prospective Cohort Study
Chen W, Cao Y, Xiao J, Wang D
Vascular Health and Risk Management 2026, 22:591884
Published Date: 18 March 2026
Explainable Machine Learning Integrating Patient and Environmental Factors for Predicting Multidrug-Resistant Organism Colonization or Infection on ICU Admission
Gu G, Ji Y, Xiong X, Chen M, Pan J, Yang Y, Yang M, Wang B
Infection and Drug Resistance 2026, 19:581390
Published Date: 3 June 2026
Multi‑feature Prediction Model for Coronary Heart Disease Comorbidity in Middle‑aged and Older Adults with COPD Based on Machine Learning and SHAP
Li R, Wang Q, Zhang X, Zhou F
International Journal of Chronic Obstructive Pulmonary Disease 2026, 21:623174
Published Date: 10 July 2026