
Back to Journals » Risk Management and Healthcare Policy » Volume 19
Development and Internal Validation of an Explainable Machine Learning Model for Compassion Fatigue Risk Stratification Among Clinical Nurses in China

Received 17 April 2026
Accepted for publication 24 June 2026
Published 22 July 2026 Volume 2026:19 617883
DOI https://doi.org/10.2147/RMHP.S617883
Checked for plagiarism Yes
Review by Single anonymous peer review
Peer reviewer comments 2
Editor who approved publication: Dr Keon-Hyung Lee
Meng Chen,1 Chengcheng Che2
1Department of Gastroenterology, Shengjing Hospital of China Medical University, Shenyang, Liaoning, 110004, People’s Republic of China; 2Department of Emergency Medicine, Shengjing Hospital of China Medical University, Shenyang, Liaoning, 110004, People’s Republic of China
Correspondence: Chengcheng Che, Department of Emergency Medicine, Shengjing Hospital of China Medical University, No. 36 Sanhao Street, Heping District, Shenyang, Liaoning, 110004, People’s Republic of China, Email [email protected]
Background: Compassion fatigue (CF) is a significant occupational challenge among nurses and is associated with adverse workforce and patient-care outcomes. In China’s demanding healthcare system, identifying nurses at elevated risk of CF may help inform targeted support strategies. This study aimed to develop and internally validate an explainable machine learning (ML)-based model for CF risk stratification among clinical nurses.
Methods: A cross-sectional survey was conducted among 969 clinical nurses in Liaoning Province, China. CF status was classified using established Professional Quality of Life Scale questionnaire cutoff criteria. A hybrid approach combining the Boruta algorithm and Least Absolute Shrinkage and Selection Operator regression was employed. Eight ML algorithms were developed and compared. Model performance was evaluated using the area under the receiver operating characteristic curve (AUC), accuracy, recall, and F1-score. Shapley Additive exPlanations (SHAP) analysis was used to interpret the optimal model and quantify the contribution of important risk factors.
Results: Based on questionnaire-defined criteria, 56.2% of participants were classified as having elevated CF symptoms. Among the evaluated algorithms, the Naïve Bayes (NB) model demonstrated the best overall performance, achieving an AUC of 0.924 (95% confidence interval [CI]: 0.894– 0.954) in the testing set. It also showed favorable calibration and potential net benefit. SHAP analysis indicated that social support, work engagement, and mindfulness were important protective factors, whereas exposure to workplace violence, frequent night shifts, prolonged daily working hours, and department assignment were important risk factors associated with elevated CF symptom classification.
Conclusion: The NB-based model demonstrated strong discrimination and interpretability for stratifying nurses at elevated risk of CF within this study population. The findings highlight potentially modifiable factors associated with elevated CF symptoms and may support targeted occupational health strategies. External and prospective validation studies are still needed before broader implementation in clinical or administrative settings.
Keywords: compassion fatigue, machine learning, naïve Bayes, risk stratification, SHAP, clinical nurses
Introduction
Clinical nurses are frequently exposed to high levels of occupational stress due to direct, sustained interaction with patient suffering, excessive workloads, and extended working hours.1 These demanding conditions contribute to the development of compassion fatigue (CF), a psychological syndrome characterized by emotional exhaustion and a diminished capacity for empathy.2 CF is a multidimensional construct comprising burnout and secondary traumatic stress.3 Burnout arises from prolonged exposure to job-related stressors, resulting in emotional exhaustion and professional detachment,4 whereas secondary traumatic stress stems from indirect exposure to patients’ trauma, manifesting as fear and anxiety.5 CF has significant organizational implications, as elevated CF symptoms are associated with increased nurse turnover, reduced quality of care, and compromised patient safety, thereby challenging healthcare system sustainability.6
The prevalence of CF varies widely across nursing specialties, ranging from 7.3% to 86%, with the highest rates observed in high-workload clinical settings, such as emergency, obstetrics and gynecology, intensive care unit (ICU), and oncology departments.7–10 Asian nursing populations often exhibit more pronounced manifestations of CF, a trend attributed to cultural expectations of self-sacrifice, hierarchical workplace dynamics, and under-resourced healthcare systems,11,12 highlighting the importance of understanding occupational stressors in these contexts. In China, hospitals—particularly those in Liaoning Province—manage large patient volumes and serve an aging population that requires intensive nursing care.13 Consequently, identifying nurses at elevated risk of CF in this setting is critical for workforce planning and targeted occupational health interventions.
CF has important implications not only for nurses’ psychological well-being but also for healthcare organizations and patient outcomes. Previous studies have demonstrated that elevated levels of CF are associated with reduced job satisfaction, increased turnover intention, absenteeism, diminished quality of care, and a higher likelihood of medical errors.14 Furthermore, CF may negatively affect patient safety by impairing nurses’ emotional engagement, communication, and clinical decision-making.15 Given the persistent nursing workforce shortages and increasing healthcare demands in China, identifying nurses at elevated risk of CF has become an important occupational health priority.1 However, standard instruments such as the Professional Quality of Life Scale (ProQOL) are primarily designed for retrospective symptom assessment rather than to support multivariable risk-stratification modeling.16,17 Moreover, previous research has predominantly relied on traditional statistical approaches, such as linear or logistic regression, which may be limited in capturing complex, nonlinear relationships and interactions among multidimensional CF-related factors.18,19
Recent advancements in machine learning (ML)—a subset of artificial intelligence (AI)—offer an opportunity to address these limitations.20 ML models are increasingly employed in healthcare research due to their capacity to process high-dimensional datasets, identify nonlinear patterns, and support risk stratification in complex scenarios.21 Nevertheless, many ML models function as “black boxes”, limiting their transparency and reducing their usefulness for healthcare administrators seeking to understand the variables contributing to model stratification. Explainable artificial intelligence approaches, such as SHapley Additive exPlanations (SHAP), address this limitation by quantifying the contribution of individual variables to model outputs and providing interpretable insights into risk stratification patterns.22 Such transparency is particularly valuable for nursing managers because it supports evidence-based resource allocation, targeted interventions, and workforce planning.
Emerging studies have applied ML to CF assessment in specific nursing populations and demonstrated promising discriminative performance. For example, Bian et al employed XGBoost to classify Chinese ICU nurses at elevated risk of CF (achieving the area under the receiver operating characteristic curve [AUC] of 0.832),23 while Li et al developed a Random Forest model for operating room nursing staff (reporting an AUC of 0.851).24 However, ML-based risk-stratification models targeting the broader clinical nursing workforce remain scarce. To address this gap, the present study developed and internally validated an explainable ML-based risk-stratification model for clinical nurses in China. By integrating the SHAP framework, this approach may provide interpretable information to help nursing administrators identify nurses at elevated risk of CF and develop targeted occupational health strategies to support workforce well-being.
Methods
Study Design and Participants
A cross-sectional study was conducted among clinical nurses working in Liaoning Province, China, between June 2024 and January 2025. Using convenience sampling, a total of 969 nurses were recruited from six tertiary public hospitals and four secondary public hospitals. To capture the diversity of clinical nursing practice, participants were drawn from multiple clinical specialties, including internal medicine, surgery, ICUs, emergency departments, pediatrics, and oncology units. The inclusion criteria were: (1) registered clinical nurses engaged in direct patient care with at least one year of work experience; (2) possession of a valid nursing practice certificate; and (3) voluntary participation with provision of informed consent. The exclusion criteria were: (1) nurses who were on leave, suspended from duty, or participating in off-site training during the study period; (2) those who had experienced major adverse life events within the previous year; (3) those with a history of physical or mental illness; (4) those not engaged in direct clinical nursing activities; and (5) those who declined to participate.
Ethics Statement
This study was reviewed and approved by the Ethical Review Committee of Shengjing Hospital of China Medical University (No. 2024PS1367K) and adhered to the Declaration of Helsinki. Written informed consent was obtained from all participants prior to their involvement in this study. This study ensured the anonymity and confidentiality of participants’ private information.
Data Collection
Data were collected using an online survey administered between June 2024 and January 2025. Electronic questionnaires were distributed through nursing department directors at participating hospitals. Before dissemination, directors received standardized instructions regarding the study objectives and survey procedures to ensure consistent implementation across sites. Participants were informed that participation was anonymous, voluntary, and confidential. The questionnaire was developed using Wenjuanxing, a widely used Chinese online survey platform, and distributed through institutional WeChat groups. After accessing the survey link, participants were required to provide electronic informed consent before completing the questionnaire. The research team was responsible for coordinating survey administration and monitoring data collection throughout the study period.
Several quality-control measures were implemented to ensure data integrity. First, each mobile device and IP address was permitted to submit only one questionnaire to prevent duplicate responses. Second, the online survey platform was configured to encourage response completeness, and any residual missingness was systematically addressed during the data preprocessing phase. Third, questionnaires completed in less than 5 minutes were flagged and excluded when response patterns suggested inattentive completion. Fourth, questionnaires containing logical inconsistencies or obvious repetitive response patterns were considered invalid and excluded from the final analysis. The survey comprised approximately 131 items and required 15–20 minutes to complete. A total of 1,050 questionnaires were distributed, and 998 responses were received. After excluding invalid questionnaires, 969 valid responses were retained for analysis, yielding an effective response rate of 92.3%.
Instruments
The selection of associated variables was guided by the Compassion Stress and Fatigue Model and previous empirical evidence.25 Individual psychological resources (mindfulness, resilience, and self-efficacy), social resources (perceived social support), and occupational factors (occupational stressors, workplace violence, and work engagement) have consistently been identified as important correlates of CF among nurses.26–28 Therefore, these constructs were included to capture the multidimensional determinants of CF risk.
Demographics Questionnaire
A self-designed questionnaire was employed to collect sociodemographics (age, gender, marital status, education level, number of children, monthly income, and professional rank), occupational data (hospital grade, clinical department, years of nursing experience, daily working hours, and participation in mental health training), and lifestyle characteristics (smoking, alcohol consumption, monthly frequency of night shifts, self-reported health status, dietary habits, exercise habits, and sleep duration).
Compassion Fatigue
Nurses’ CF was assessed using the Chinese version of the Professional Quality of Life Scale (ProQOL), validated by Chen and Wang.29 The ProQOL consists of 30 items categorized into three subscales: burnout, compassion satisfaction, and secondary traumatic stress. Each item is scored on a 5-point Likert scale, ranging from 1 (“never”) to 5 (“always”). We defined high CF risk based on questionnaire cutoff scores. This is a screening classification, not a formal clinical diagnosis. Cutoff values for elevated risk were defined as follows: compassion satisfaction scores < 37, burnout scores >27, and secondary traumatic stress scores > 17. CF severity was classified as mild, moderate, or severe based on the number of subscales exceeding their respective thresholds: one subscale for mild CF, two for moderate CF, and three for severe CF. In the current study, the ProQOL demonstrated strong internal consistency, with a Cronbach’s α coefficient of 0.753.
For the purposes of model development, participants meeting the predefined ProQOL cutoff criteria were classified as exhibiting elevated CF symptoms. This classification was intended for research-based risk stratification and should not be interpreted as a formal clinical diagnosis of CF.
Mindfulness
Mindfulness was assessed using the Chinese version of the Mindful Attention Awareness Scale (MAAS).30 This is a unidimensional instrument that comprises 15 items designed to measure the frequency of open receptivity to and awareness of present-moment experiences in daily life. Items were rated on a 6-point Likert scale ranging from 1 (“almost always”) to 6 (“almost never”). Total scores range from 15 to 90, with higher scores indicating higher levels of dispositional mindfulness. In the current study, the MAAS demonstrated robust internal consistency, yielding a Cronbach’s α coefficient of 0.957.
Resilience
Nurses’ resilience was assessed using the 10-item Connor-Davidson Resilience Scale (CD-RISC-10),31 which has been validated in the Chinese population.32 The CD-RISC-10 comprises 10 items, each rated on a 5-point Likert scale, ranging from 1 (“strongly disagree”) to 5 (“strongly agree”). Total scores range from 10 to 50, with higher scores indicating greater resilience. In this study, the scale demonstrated strong internal consistency, with a Cronbach’s α coefficient of 0.940.
Perceived Social Support
Perceived social support was assessed using the Multidimensional Scale of Perceived Social Support (MSPSS), developed by Zimet.33 The MSPSS includes 12 items categorized into three domains: family support, friend support, and significant others. Responses are recorded on a 7-point Likert scale ranging from 1 (“strongly disagree”) to 7 (“strongly agree”). Total scores range from 12 to 84, with higher scores reflecting greater social support. In this study, the MSPSS demonstrated strong internal consistency, yielding a Cronbach’s α coefficient of 0.966.
Self-Efficacy
Self-efficacy was measured using the General Self-Efficacy Scale (GSES), originally developed by Luszczynska and Schwarzer.34 The GSES consists of 10 items scored on a 4-point Likert scale, ranging from 1 (“not at all true”) to 4 (“exactly true”). Total scores range from 10 to 40, with higher scores indicating greater self-efficacy. In this study, the GSES demonstrated strong internal consistency, yielding a Cronbach’s α coefficient of 0.916.
Occupational Stressors
Nurses’ occupational stressors were assessed using the Nurse Occupational Stressor Scale (NOSS), developed by Chen et al35 The NOSS comprises 21 items across nine subscales: work demands, work-family conflict, workplace violence and bullying, organizational issues, insufficient support from coworkers or caregivers, occupational hazards, difficulty taking leave, powerlessness, and unmet basic physiological needs. Each item is rated on a 4-point Likert scale, ranging from 1 (“strongly disagree”) to 4 (“strongly agree”). Total scores range from 21 to 84, with higher scores indicating a greater frequency of experienced work stressors. In this study, the NOSS demonstrated strong internal consistency, yielding a Cronbach’s α coefficient of 0.933.
Workplace Violence
Workplace violence experienced by clinical nurses was evaluated using the Chinese version of the Workplace Violence Scale (WVS).36 The WVS assesses five types of workplace violence—physical assault, threats, verbal sexual harassment, sexual abuse, and emotional abuse—via five items. Each item is rated on a 4-point Likert scale from 0 (“never”) to 3 (“more than three times”). Total scores are categorized into four groups: never (0 point), low (1–5 points), intermediate (6–10 points), and high (11–15 points).37 In this study, the WVS demonstrated strong internal consistency, with a Cronbach’s α coefficient of 0.912.
Work Engagement
Work engagement was assessed using the short version of the Utrecht Work Engagement Scale (UWES), developed by Schaufeli et al38 The UWES comprises 9 items across three subscales: vigor, dedication, and absorption. Responses are recorded on a 7-point Likert scale from 0 (“never”) to 6 (“always”). Total scores range from 0 to 54, with higher scores indicating greater work engagement. In this study, the UWES-9 exhibited strong internal consistency, yielding a Cronbach’s α coefficient of 0.969.
Data Preprocessing
To ensure methodological robustness, comprehensive data preprocessing was implemented prior to model development. Variables with >20% missing values were excluded to reduce potential bias from excessive missingness. Remaining missing data were handled using the Multivariate Imputation by Chained Equations (MICE).39 This iterative technique addresses missingness by leveraging the correlations between variables to generate plausible imputed values, thereby preserving the distribution and statistical power of the dataset. All continuous variables were subjected to Z-score normalization to standardize feature scales and enhance model convergence efficiency. Categorical variables were converted into numerical form using one-hot encoding. The dataset was partitioned using stratified random sampling, allocating 70% of observations to the training set for model development and 30% to the testing set for performance evaluation. Because the proportion of participants classified as having CF (56.2%) was relatively balanced, no additional class-balancing procedures (eg, synthetic minority over-sampling technique [SMOTE] or random oversampling) were applied.
Feature Selection
In this study, we employed the Boruta algorithm, a robust wrapper method founded on the Random Forest framework—to assess feature importance in our dataset. This method effectively identifies statistically significant candidate factors by iteratively comparing original features against permuted “Shadow” features: synthetic variables generated through randomization of attributes. The algorithm’s non-parametric nature circumvents distributional assumptions while maintaining high dimensionality tolerance, thereby enhancing model robustness and streamlining feature selection.40 To complement the Boruta approach, the Least Absolute Shrinkage and Selection Operator (LASSO) logistic regression was subsequently employed. The optimization of the regularization parameter (λ) was achieved through 10-fold cross-validation using the minimization of binomial deviance as the selection criterion. Within this framework, we prioritized the λ.1se criterion (the largest λ maintaining cross-validated error within one standard error of λ.min) to promote model parsimony while preserving predictive performance, aligning with best practices for regularization in clinical risk models.41 Ultimately, we adopted the intersection of features identified by both the Boruta and LASSO as the definitive set of risk factors.42
Model Construction
This study evaluated eight ML algorithms to ensure methodological diversity and robustness in CF risk stratification: Logistic Regression (LR),43 Random Forest (RF),44 eXtreme Gradient Boosting (XGBoost),45 Light Gradient Boosting Machine (LGBM),46 Naive Bayes (NB),47 K-Nearest Neighbors (KNN),48 Decision Tree (DT),49 and Neural Network (NNet).50 A random seed of 12 was set before model training for each algorithm to enhance reproducibility. Hyperparameter tuning was conducted using 5-fold cross-validation within the training set and the optimal parameter combination was selected primarily according to the highest cross-validated AUC. The final hyperparameter configurations are presented in Supplementary Table S1. After tuning, each final model was refitted on the full training set and evaluated on the independent testing set to provide an unbiased estimate of model performance.
Model Performance Evaluation
We conducted a comprehensive evaluation of the risk stratification models, emphasizing three critical dimensions: discrimination, calibration, and potential practical utility. The discrimination capability was assessed using the AUC, complemented by additional performance metrics including accuracy, precision, sensitivity (recall), specificity, log loss, negative predictive value (NPV), and F1- score. The 95% confidence interval (CI) for the AUC was estimated using bootstrap resampling with 1,000 iterations. Calibration was rigorously evaluated through calibration plots and Brier scores to quantify the alignment between predicted probabilities and observed outcomes. To evaluate clinical applicability, decision curve analysis (DCA) was employed to estimate the net benefit across varying risk thresholds, thereby assessing the models’ potential utility for future risk-screening support.
Model Interpretation
To enhance the interpretability of our optimal ML model, we employed SHapley Additive exPlanations (SHAP), a game theory-derived framework that quantifies feature contributions to predictions by calculating Shapley values.51 SHAP decomposes model outputs into additive effects from individual features, accounting for both main effects and interactions, thereby enabling a dual-level interpretation. Globally, features were ranked by their aggregate impact on predictions, while locally, the direction (positive/negative) and magnitude of each feature’s influence on specific outcomes were elucidated.SHAP values were visualized using - beeswarm plots, where data points were color-mapped to normalized feature values, illustrating how feature magnitudes correlated with their predictive influence. The entire analysis workflow is presented in Figure 1.
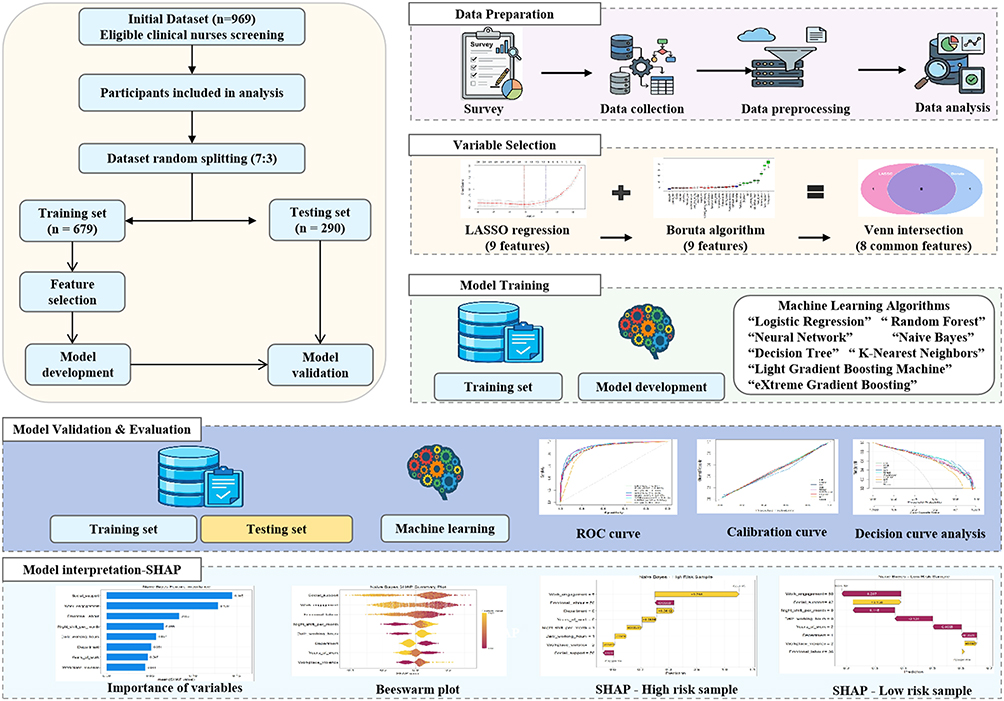 |
Figure 1 Flow diagram of the study process. Abbreviations: LASSO, Least Absolute Shrinkage and Selection Operator; ROC, Receiver Operating Characteristic; SHAP, Shapley Additive exPlanations. |
Statistical Analyses
Descriptive analyses were conducted using SPSS version 27.0 (IBM Corp., Armonk, NY, USA). Continuous variables were expressed as medians and interquartile ranges (IQRs) and compared using the Mann–Whitney U-test. Categorical variables were presented as frequencies and percentages and compared using the Chi-square test or Fisher’s exact test, as appropriate. A two-sided p-value < 0.05 was considered statistically significant.
ML analyses were conducted using R version 4.4.2 (R Foundation for Statistical Computing, Vienna, Austria). Data preprocessing and imputation were performed using the “mice” package. Feature selection was conducted using the “Boruta” and “glmnet” packages. ML models were developed using the following R packages: LR with “glmnet”, RF with “randomForest”, XGBoost with “xgboost”, LGBM with “lightgbm”, NNet with “nnet”, NB with “klaR”, KNN with “class”, and DT with “rpart”. Hyperparameter tuning and cross-validation procedures were implemented using the “caret” framework. Model interpretation was performed using the “SHAPforxgboost” and “shapviz” packages, and graphical visualizations were generated using “ggplot2”.
Results
Participant Characteristics
Table 1 summarized the demographic and occupational characteristics of the study cohort. A total of 969 clinical nurses were included in the final analysis, with an average age of 34.0 years (range: 23–52 years). The majority of participants were female (87.6%). Regarding professional characteristics, 75.1% had more than five years of work experience, 70.8% reported average daily working hours exceeding 8 hours, and 72.5% reported a sleep duration of less than 7 hours. Approximately 30.9% of nurses reported working more than six night shifts per month, and 39.2% were employed in high-intensity departments, including emergency, critical care, or oncology departments.
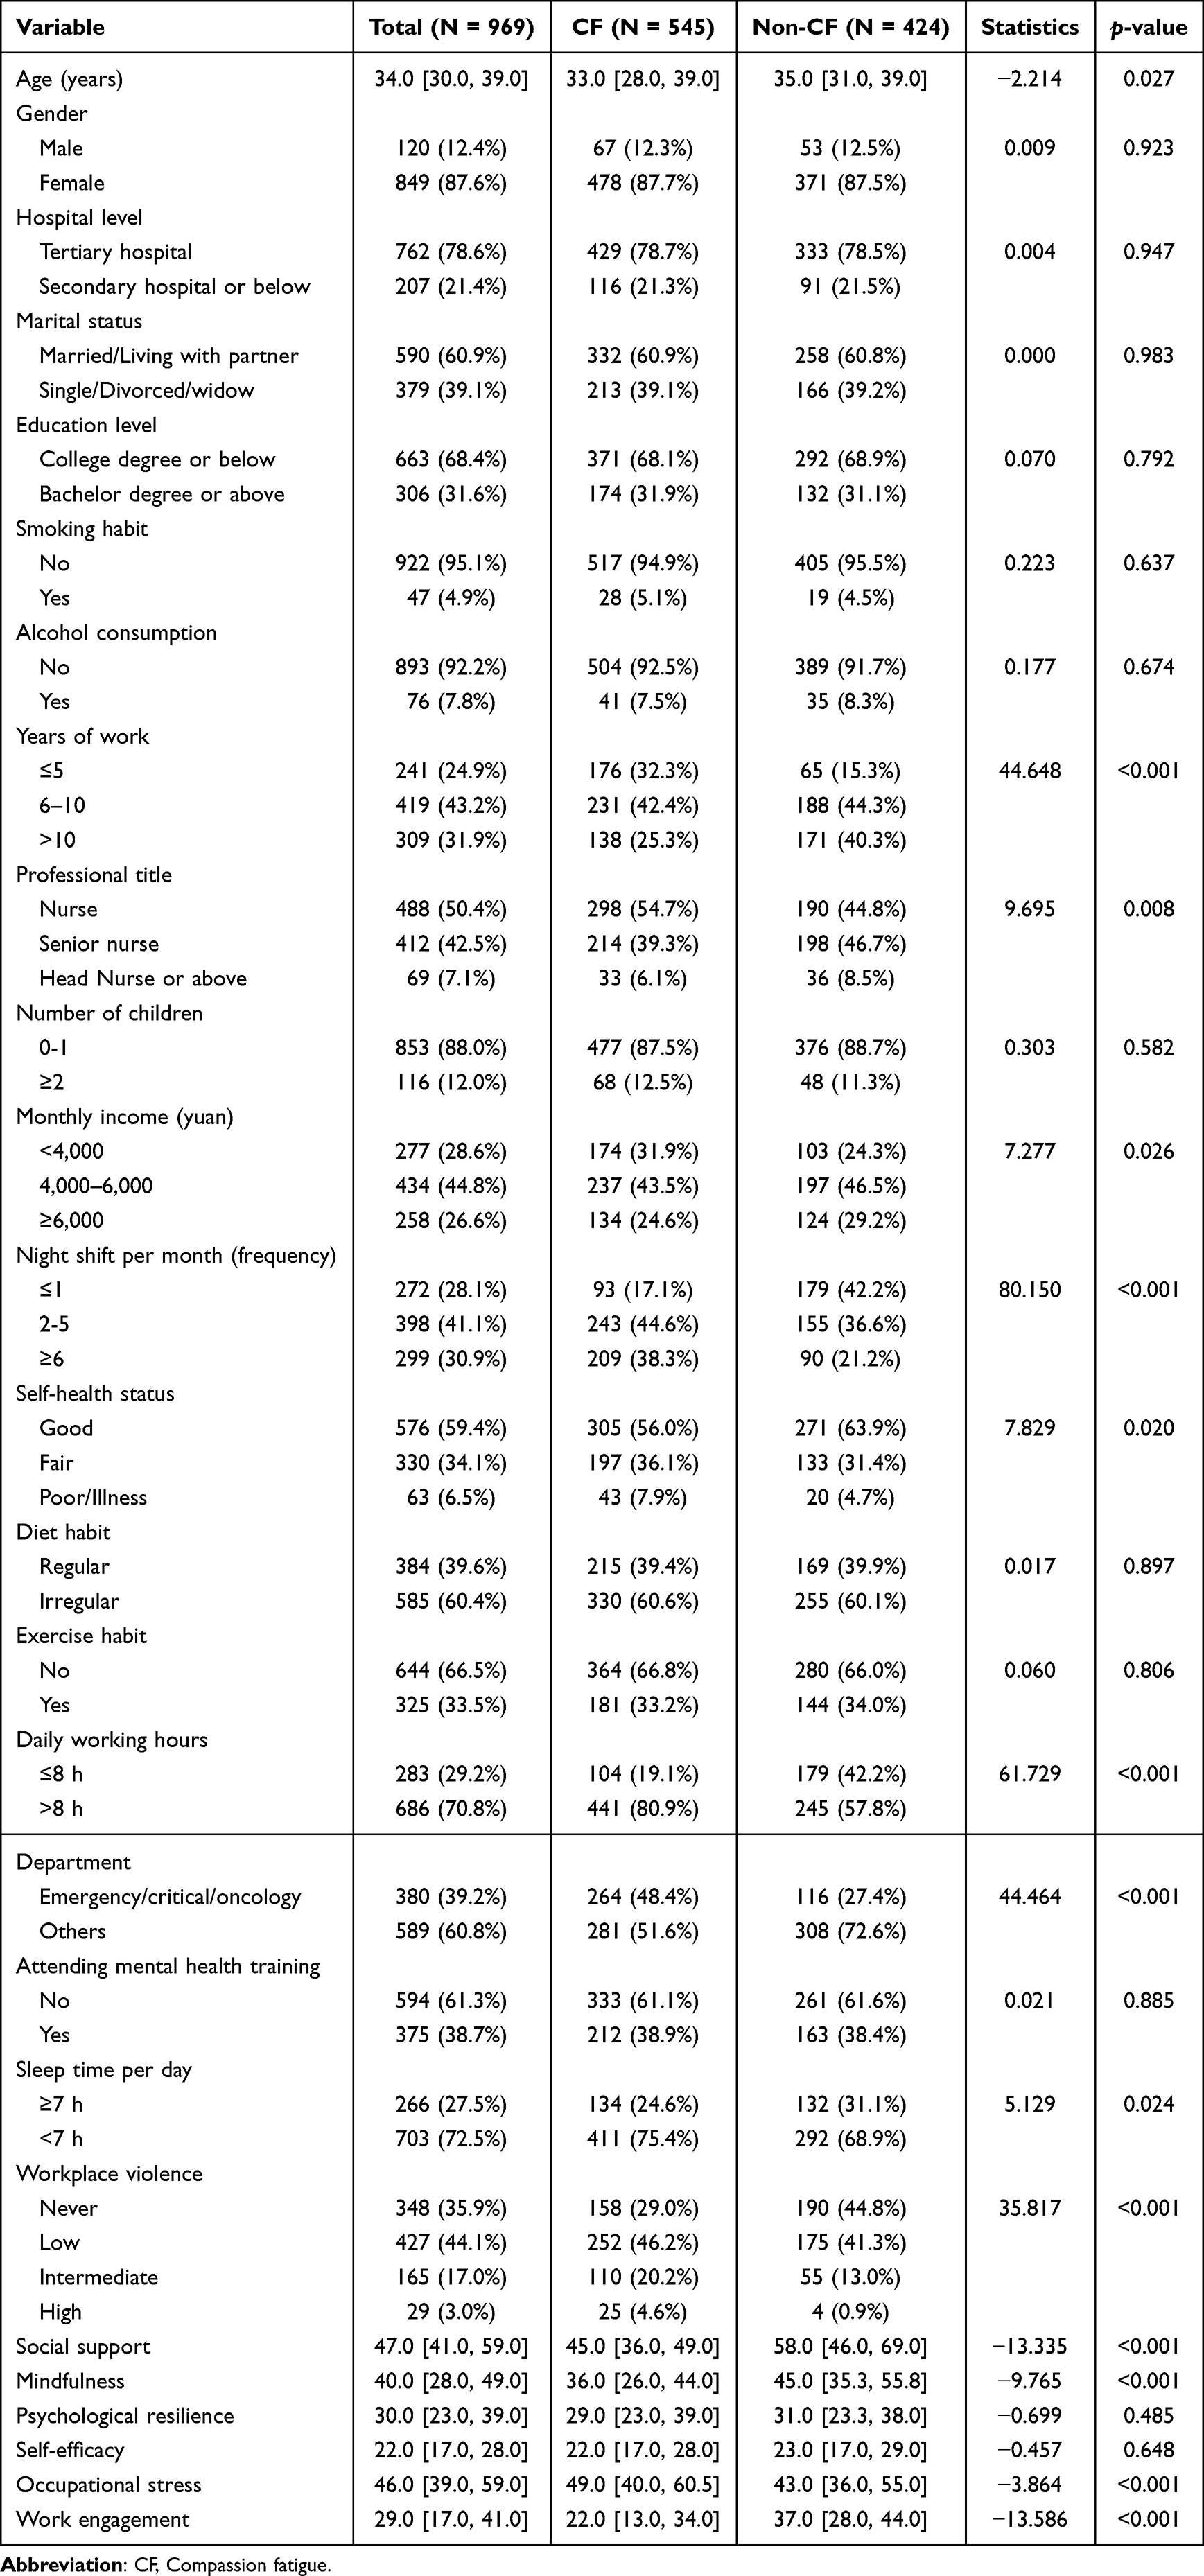 |
Table 1 Baseline Characteristics of Participants with or without Compassion Fatigue |
Based on the predefined ProQOL classification criteria, 56.2% (545/969) of participants were identified as being at elevated risk for CF. The distribution of questionnaire-defined CF symptom severity was illustrated in Supplementary Figure S1. Baseline characteristics were compared between participants classified as having elevated CF symptoms and those not meeting the ProQOL classification criteria (Table 1). Furthermore, the dataset was randomly divided into a training set (n = 679; 388 high-risk individuals) and a testing set (n = 290, 157 high-risk individuals). As shown in Supplementary Table S2, there were no statistically significant differences in baseline characteristics between the two groups (p > 0.05).
Feature Screening
To identify the most robust candidate factors associated with elevated CF symptoms, a dual-method feature screening strategy was employed. First, the Boruta algorithm was utilized to estimate feature importance and identify relevant variables. This algorithm identified nine key factors: social support, work engagement, mindfulness, years of work experience, night shifts per month, daily working hours, age, department, and workplace violence (Figure 2A). Concurrently, LASSO regression was applied to perform variable selection and regularization by penalizing the absolute size of the regression coefficients. As shown in Figure 2B and 2C, LASSO regression isolated nine features: social support, work engagement, mindfulness, years of work experience, night shifts per month, daily working hours, occupational stress, department, and workplace violence (Figure 2B and 2C). To enhance the stability and reliability of the final model, we extracted the intersection of features identified by both the Boruta algorithm and LASSO regression. Consequently, eight common variables were finalized as the input features for model construction: social support, work engagement, mindfulness, years of work experience, night shifts per month, daily working hours, department, and workplace violence (Figure 2D).
 |
Figure 2 Feature selection process using dual algorithms. (A) Feature importance ranking derived from the Boruta algorithm. Green boxes represent confirmed important variables, red boxes represent rejected variables, and blue boxes represent tentative variables. (B) LASSO coefficient profiles of the baseline features across different λ values. (C) Cross-validation plot for the LASSO regression model identifying the optimal tuning parameter λ; the right vertical dashed line indicates the selected λ value. (D) Venn diagram illustrating the overlapping variables identified by both the Boruta and LASSO algorithms. Abbreviations: LASSO, Least Absolute Shrinkage and Selection Operator. |
Model Performance Evaluation
Eight ML models were developed and evaluated for classifying nurses at elevated risk of CF. Figure 3 illustrated the ROC curves for both the training and testing sets. In the training set, the AUC values ranged from 0.861 to 0.925. Among the eight models, the NB model exhibited strong discriminative performance (AUC = 0.925, 95% CI: 0.906–0.944) (Figure 3A and Table 2). This performance was also observed in the testing set, where the NB model maintained the highest AUC (0.924, 95% CI: 0.894–0.954), followed by RF (AUC = 0.903) and XGBoost (AUC = 0.896) (Figure 3B and Table 2). Furthermore, the NB model showed the best overall performance across multiple performance metrics, achieving the highest accuracy (0.841), recall (0.924), NPV (0.892), and F1- score (0.863), as well as the lowest log loss (0.368) and Brier score (0.116) (Figure 4 and Table 2).
 |
Table 2 Comparative Metrics Among Eight Machine Learning Algorithms |
 |
Figure 3 ROC curves of the eight machine learning models in the training set (A) and testing set (B). Abbreviations: LR, Logistic Regression; RF, Random Forest; XGBoost, Extreme Gradient Boosting; LGBM, Light Gradient Boosting Machine; NNet, Neural Network; NB, Naïve Bayes; KNN, K-Nearest Neighbors; DT, Decision Tree; ROC, Receiver Operating Characteristic; AUC, Area Under the Receiver Operating Characteristic Curve. |
 |
Figure 4 Comparative performance of the eight machine learning models in the training and testing sets. Performance metrics include AUC, accuracy, precision, recall, specificity, NPV, F1-score, log loss, and Brier score. Abbreviations: LR, Logistic Regression; RF, Random Forest; XGBoost, Extreme Gradient Boosting; LGBM, Light Gradient Boosting Machine; NNet, Neural Network; NB, Naïve Bayes; KNN, K-Nearest Neighbors; DT, Decision Tree; AUC, Area Under the Receiver Operating Characteristic Curve; NPV, Negative Predictive Value. |
DCA was performed to assess the potential net benefit (Figure 5A). The results indicated that, within the evaluated threshold probability ranges, most models provided higher net benefit than the reference strategies. This was particularly evident for the LR, RF, XGBoost, and NB models in the testing set. Calibration plots for the eight models were presented in Figure 5B. The calibration curve of the NB model demonstrated the closest alignment with the ideal diagonal line, indicating favorable agreement between the predicted probabilities and the observed questionnaire-defined classifications. Consequently, based on a comprehensive evaluation of discrimination, calibration, and potential net benefit, the NB model was identified as the optimal model for stratifying nurses at elevated risk of CF within this study population.
 |
Figure 5 Assessment of calibration and potential net benefit in the training and testing sets. (A) DCA illustrating the net benefit of each model across a range of threshold probabilities. A model with a higher net benefit across a relevant threshold range is considered to have greater potential utility for risk-screening support. (B) Calibration curves comparing the predicted probabilities against the observed questionnaire-defined classifications. The diagonal dashed line represents perfect calibration, while curves closer to the diagonal indicate better agreement between predicted and observed classifications. Abbreviations: LR, Logistic Regression; RF, Random Forest; XGBoost, Extreme Gradient Boosting; LGBM, Light Gradient Boosting Machine; NNet, Neural Network; NB, Naïve Bayes; KNN, K-Nearest Neighbors; DT, Decision Tree; DCA, Decision Curve analysis. |
Model Explanation and Interpretability
To enhance the transparency of the optimal model, we employed the SHAP method to quantify the marginal contribution of each feature to the model output. Figure 6A displayed the mean absolute SHAP values, ranking features by their overall importance. The analysis identified social support, work engagement, mindfulness, night shifts per month, and daily working hours as the top five most influential features, underscoring their substantial contribution to classifying nurses at elevated risk of CF. Figure 6B provided a detailed visualization of feature effects using a SHAP summary plot (beeswarm plot). In this plot, each dot represents an individual sample, and the color gradient ranges from yellow to red according to normalized feature values. The horizontal location of the points indicates the impact of the feature value on the model output: points to the right of the central axis indicate a positive contribution to elevated risk of CF, whereas points to the left indicate a negative contribution (low risk).
 |
Figure 6 SHAP analysis of the optimal NB model. (A) Mean absolute SHAP values ranking the global importance of variables. Higher SHAP values indicate greater influence on model output. (B) SHAP summary (beeswarm) plot illustrating the direction and magnitude of feature effects across all participants. Each dot represents one participant. Color represents the feature value, ranging from low (red) to high (yellow). Positive SHAP values indicate increased likelihood of being classified as exhibiting elevated CF symptoms, whereas negative SHAP values indicate a decreased likelihood. (C) SHAP waterfall plot illustrating how individual factor contributions influence the classification of a representative participant at elevated risk of CF symptoms. (D) SHAP waterfall plot illustrating the classification process for a representative participant at lower risk. In the waterfall plots, positive SHAP values (yellow bars) increase the model output, whereas negative SHAP values (red bars) decrease the model output. The baseline value [E(f(x))] represents the average model prediction before considering individual feature contributions. Abbreviations: CF, Compassion Fatigue; NB, Naïve Bayes; SHAP, Shapley Additive exPlanations. |
To further elucidate the model stratification process at the individual level, SHAP waterfall plots were generated (Figure 6C and 6D). These plots visualize how each feature shifts the model output from the baseline value [E(f(x)) = 0.604] to the final model output. Figure 6C illustrated the stratification path for a participant classified by the model as being at elevated risk for CF according to the questionnaire-based classification criteria. Although high mindfulness and social support exerted negative contributions to the elevated CF classification, these were outweighed by features contributing positively to the model output, including low work engagement, department assignment, short work experience (≤5 years), frequent night shifts (2–5 times/month), long daily working hours (>8 h), and moderate exposure to workplace violence. The cumulative effect of these positive contributors resulted in a model output above the classification threshold [f(x) = 1.05]. Conversely, Figure 6D depicted the waterfall plot for a participant classified by the model as being at lower risk for CF. In this case, protective features, specifically high work engagement scores, infrequent night shifts (≤1 time/month), and standard daily working hours (≤8 h), made substantial negative contributions, resulting in a final model output below the classification threshold [f(x) = 0.184].
Discussion
Clinical nurses in China may be particularly susceptible to CF owing to workforce shortages, increasing service demands, patient-centered care requirements, and ongoing healthcare reforms.3 Given the multifactorial nature of CF, we developed and internally validated an explainable ML-based risk stratification model to identify factors associated with elevated CF symptoms among clinical nurses. Furthermore, SHAP analysis was integrated to improve model transparency and quantify the relative contribution of individual variables. To our knowledge, this study is among the first to systematically compare multiple ML algorithms and incorporate explainable AI techniques for CF risk classification within a large sample of Chinese clinical nurses. The findings highlight several potentially modifiable factors—including social support, work engagement, mindfulness, workplace violence, night shift frequency, and working hours—that may inform future occupational health strategies and workforce support initiatives.
In the current cohort, the proportion of nurses classified as having elevated CF symptoms was 56.2% based on the predefined ProQOL criteria. While this rate is notably lower than the rates reported among gynecological and obstetric nurses (75.9%)8 and emergency department staff (77.6%),18 it substantially exceeds the globally reported range of 7.3% to 44.8%.11 Such discrepancies likely stem from heterogeneity in demographic backgrounds, cultural contexts, assessment instruments, and occupational environments, including variations in workload. Beyond the overall proportion of nurses classified as exhibiting elevated CF symptoms, the distribution of questionnaire-defined symptom severity provides additional insight into workforce well-being. Although many nurses were categorized as having mild or moderate symptom levels, the presence of severe CF symptoms in a subset of participants (27.1%) is particularly concerning because such symptoms have been associated with emotional exhaustion, impaired occupational functioning, reduced job satisfaction, and increased turnover intention.25,28 These findings highlight the importance of routine monitoring and targeted support strategies across different levels of symptom burden.
More recently, ML algorithms have emerged as useful tools for processing high-dimensional, multivariate datasets compared to traditional statistical approaches.52 Findings regarding the optimal modeling technique remain mixed. Zhang and Dator compared models such as LR, RF, and XGBoost in nursing students, finding that the traditional LR model yielded the best performance (AUC = 0.770).19 In contrast, Yi et al identified XGBoost as the superior algorithm for stratifying CF risk among Chinese nursing interns.53 Furthermore, Zhang et al corroborated the efficacy of multiple ML classifiers—including RF, KNN, SVM and NB—in predicting CF among psychological hotline counselors, thereby supporting the utility of ML frameworks in risk stratification.54 In the current analysis, we systematically evaluated eight distinct ML algorithms. Among these, the NB model demonstrated superior discriminative ability, calibration, and potential net benefit within the testing cohort, identifying it as the optimal screening tool for this study population. Quantitatively, the NB model achieved AUC values of 0.925 in the training set and 0.924 in the testing set. These metrics were higher than those achieved by the LR model (0.917 and 0.899, respectively). The NB model also showed favorable performance across key indicators, including accuracy, recall, NPV, log loss, Brier score, and F1-score. These findings suggest that the model may be useful for stratifying participants with elevated CF symptoms within internally validated data, although external validation is required before broader application.
The advantageous performance of the NB model can be attributed to its unique probabilistic framework.55 Several factors may explain why the NB model outperformed more sophisticated ensemble approaches such as RF and XGBoost in the present study. First, the final model incorporated a relatively small set of carefully selected candidates identified through the combined Boruta-LASSO feature-selection strategy. Under such conditions, the simplicity of NB may facilitate stable estimation and reduce susceptibility to overfitting. Second, although the assumption of conditional independence among variables is rarely fully satisfied in healthcare datasets, previous studies have demonstrated that NB often remains highly effective when factor correlations are modest. Third, compared with more complex ensemble models, NB requires fewer parameters and may generalize better when the sample size is moderate relative to model complexity.56 Collectively, these characteristics may explain the superior discrimination and calibration observed in our testing cohort.
To further enhance the interpretability of the model, we employed SHAP analysis. Importantly, the use of SHAP extends beyond technical model interpretation. For nursing administrators, explainable AI provides a transparent framework for understanding why specific individuals or groups may be classified as being at elevated risk. Rather than functioning as a “black-box” algorithm, the model identifies the relative importance of modifiable occupational and psychosocial variables, thereby supporting evidence-informed prioritization of intervention strategies, workforce planning, and resource allocation.57 This transparency is critical for CF research, given the complex, multifactorial nature of associated factors, such as workload intensity and psychosocial stressors, that contribute to the condition. Notably, social support emerged as the most influential factor for CF risk among clinical nurses. Social support encompasses the perception of being cared for, esteemed, and valued within a social network.58 This finding aligns with prior research indicating that while healthcare professionals face unavoidable occupational stressors, those with robust social support systems exhibit lower susceptibility to CF and superior stress resilience.26 Furthermore, as a primary source of psychological resources, work engagement characterizes a positive, fulfilling, and work-related state of mind. Highly engaged employees typically demonstrate superior mental health and job performance compared to their less engaged counterparts.59 In our analysis, work engagement ranked as another critical determinant of CF. This corroborates a previous pilot study,60 which observed that increased work engagement correlates with higher compassion satisfaction and significantly reduced burnout levels. Therefore, the implementation of organizational strategies designed to enhance work engagement is recommended to mitigate CF, improve workforce well-being, and optimize the quality of patient care.61
Our analysis identified mindfulness as a significant protective factor. Conceptually, mindfulness is characterized by a non-judgmental, purposeful awareness of the present moment.62 Mindfulness-based interventions have been widely adopted in healthcare settings to facilitate emotional regulation, enabling nurses to modulate their affective responses to meet professional demands.63,64 Regarding occupational characteristics, our findings align with established literature identifying night shift frequency and prolonged daily working hours as critical contributors to CF.65 The adverse impact of night shifts is likely attributable to the disruption of natural circadian rhythms. Furthermore, night shifts are often characterized by reduced staffing levels concurrent with high patient acuity and rapid clinical deterioration, imposing a heavier cognitive and physical load on nurses. Similarly, extended daily working duration showed a positive correlation with burnout. Nurses operating under these conditions face excessive workloads to meet complex patient care needs, significantly elevating their susceptibility to CF.66 Based on these findings, evidence-based administrative strategies, such as circadian-friendly rostering, centralized night shift management, and performance-based incentive systems, may be considered. These measures may alleviate biological clock disruptions and mitigate work-life conflicts, thereby preserving the health and longevity of the nursing workforce.67
Our analysis revealed substantial heterogeneity in CF prevalence across distinct clinical departments. This observation parallels prior research identifying elevated CF levels among nurse stationed in high-intensity units, such as the ICUs, emergency departments, and oncology wards.68–70 Nurses in these heavy-workload environments are frequently confronted with traumatic clinical scenarios, such as life-threatening emergencies, end-of-life care dilemmas, ethical conflicts, and the management of intractable pain, all of which amplify emotional exhaustion. Regarding professional tenure, our results corroborate previous findings,71,72 demonstrating an inverse correlation between years of working experience and CF risk. Specifically, senior nurses exhibited lower susceptibility to CF compared to their junior counterparts. This protective effect is plausibly explained by the accumulation of professional capital: over time, experienced nurses develop superior problem-solving competencies and emotional resilience, enabling them to navigate clinical emergencies and stressors with greater efficacy and composure.73 Furthermore, a deleterious workplace environment—characterized by exposure to patient assault, bullying, or other forms of violence—was identified as a potent risk-associated factor for elevated CF symptom classification. Such exposure significantly exacerbates emotional exhaustion and diminishes personal accomplishment. Theoretically, workplace violence acts as a catalyst, initiating a pathological trajectory from “compassion discomfort” to “compassion stress”, eventually culminating in severe CF symptoms.74 This process may undermine psychological well-being and contribute to adverse organizational outcomes, including reduced job satisfaction, eroded organizational loyalty, and increased turnover intention.75
Implications for Nursing Management
In occupational health management, identifying nurses who may be at elevated risk of adverse mental health outcomes is an important priority. Compared to approaches relying solely on retrospective assessment or traditional statistical associations, the present study may provide several useful insights for nursing administration. First, this study established and internally validated an explainable ML-based risk-stratification model through a systematic comparison of eight ML algorithms. The NB model demonstrated favorable discrimination and calibration in the present cohort, suggesting its potential as a screening-support model for elevated CF symptoms, pending external and prospective validation.
Second, the model integrated a multidimensional set of psychosocial and occupational variables, including social support, work engagement, mindfulness, workplace violence, night shift frequency, and working hours. These findings may help administrators identify modifiable areas for workforce support, such as strengthening social support systems, improving work engagement, optimizing shift arrangements, and preventing workplace violence.
Third, SHAP analysis provides interpretable information about the relative contribution of each variable to model stratification. This may help nursing managers understand not only which nurses are classified as being at elevated risk, but also which occupational or psychosocial features contribute most strongly to that stratification. Therefore, explainable ML may support more transparent and evidence-informed occupational health planning.
However, given that the present model was developed using cross-sectional survey data and underwent internal validation only, its primary value currently lies in identifying nurses who may exhibit elevated CF symptoms and in highlighting potentially modifiable associated factors. Future external validation and prospective implementation studies are required before routine deployment in nursing workforce management settings can be recommended.
Limitations
Several limitations of this study warrant acknowledgement. First, the cross-sectional design precludes causal inferences and does not allow for the assessment of the temporal relationships between associated factors and elevated CF symptoms. Longitudinal and prospective studies are needed to examine changes in CF over time and to evaluate the predictive performance of the proposed model in real-world settings.
Second, participants were recruited from hospitals within a single province in China using convenience sampling. Given regional differences in healthcare resources, organizational culture, and patient populations, the generalizability of the findings to other regions or countries may be limited. Therefore, external validation using multicenter and geographically diverse cohorts is warranted before broader implementation.
Third, although a comprehensive set of psychological, social, and occupational variables was included, residual confounding from unmeasured factors—such as personality traits, family circumstances, organizational climate, and other contextual influences—cannot be excluded and may affect model performance.
Fourth, the study relied on self-reported questionnaire data, which may be subject to recall bias and social desirability bias. In addition, the outcome variable was defined according to questionnaire-based classification criteria rather than a formal clinical diagnosis of CF. Accordingly, the model should be interpreted as a tool for classifying nurses with elevated CF symptoms or increased risk of CF rather than as a diagnostic instrument.
Finally, the model was developed and internally validated using only the present dataset only. Although the NB model demonstrated strong stratification performance and good interpretability, prospective studies and independent external validation are necessary to confirm its robustness, generalizability, and potential utility for occupational health screening and nursing workforce management.
Conclusion
In conclusion, this study demonstrated that a substantial proportion of Chinese clinical nurses were classified as exhibiting elevated CF symptoms according to questionnaire-based criteria. Among the evaluated ML algorithms, the NB model showed the best overall stratification performance, with favorable discrimination, calibration, and interpretability within the study population. Through SHAP-based interpretation, several important factors associated with elevated CF symptoms were identified, including social support, work engagement, workplace violence, and shift schedules. These findings suggest that explainable ML approaches may provide a useful framework for identifying nurses at elevated risk of CF and for highlighting potentially modifiable occupational and psychosocial factors. Such information may assist nursing administrators in workforce monitoring, resource allocation, and the development of targeted support strategies. However, because the model was developed using cross-sectional questionnaire data and underwent internal validation only, external validation and prospective evaluation studies are required before broader implementation in routine clinical or administrative use can be recommended.
Abbreviations
CF, Compassion Fatigue; ProQoL, Professional Quality of Life Scale; ML, Machine Learning; AI, Artificial Intelligence; SHAP, SHapley Additive exPlanations; AUC, Area Under the Curve; MAAS, Mindful Attention Awareness Scale; CD-RISC-10, Connor-Davidson Resilient Scale; MSPSS, Multidimensional Scale of Perceived Social Support; GSES, General Self-Efficacy Scale; NOSS, Nurse Occupational Stressor Scale; WVS, Workplace Violence Scale; UWES, Utrecht Work Engagement Scale; MICE, Multivariate Imputation by Chained Equations; LASSO, Least Absolute Shrinkage and Selection Operator; NPV, Negative Predictive Value; CI, Confidence Interval; DCA, Decision Curve Analysis; LR, Logistic Regression; RF, Random Forest; XGBoost, eXtreme Gradient Boosting; LGBM, Light Gradient Boosting Machine; NNet, Neural Network; NB, Naïve Bayes; KNN, K-Nearest Neighbors; DT, Decision Tree; ICU, Intensive Care Unit.
Data Sharing Statement
The data that support the findings of this study are available on request from the corresponding author. The data are not publicly available due to privacy or ethical restrictions.
Ethical Approval Statements
This study was reviewed and approved by the Ethical Review Committee for Shengjing Hospital of China Medical University (No. 2024PS1367K) and adhered to Declaration of Helsinki. Written informed consent was obtained from all participants prior to their involvement in this study.
Acknowledgments
The authors would like to thank all participants enrolled in the study.
Author Contributions
All authors made a significant contribution to the work reported, whether that is in the conception, study design, execution, acquisition of data, analysis and interpretation, or in all these areas; took part in drafting, revising or critically reviewing the article; gave final approval of the version to be published; have agreed on the journal to which the article has been submitted; and agree to be accountable for all aspects of the work.
Funding
There is no funding to report.
Disclosure
The authors report no conflicts of interest in this work.
References
1. Sinclair S, Raffin-Bouchal S, Venturato L, Mijovic-Kondejewski J, Smith-MacDonald L. Compassion fatigue: a meta-narrative review of the healthcare literature. Int J Nurs Stud. 2017;69:9–20. doi:10.1016/j.ijnurstu.2017.01.003
2. Peters E. Compassion fatigue in nursing: a concept analysis. Nurs Forum. 2018;53(4):466–480. doi:10.1111/nuf.12274
3. Zhang H, Xia Z, Yu S, Shi H, Meng Y, Dator WL. Interventions for compassion fatigue, burnout, and secondary traumatic stress in nurses: a systematic review and network meta-analysis. Nurs Health Sci. 2025;27(1):e70042. doi:10.1111/nhs.70042
4. Zhang YY, Han WL, Qin W, et al. Extent of compassion satisfaction, compassion fatigue and burnout in nursing: a meta-analysis. J Nurs Manag. 2018;26(7):810–819. doi:10.1111/jonm.12589
5. Arnold AT. An evolutionary concept analysis of secondary traumatic stress in nurses. Nurs Forum. 2020;55(2):149–156. doi:10.1111/nuf.12409
6. Garnett A, Hui L, Oleynikov C, Boamah S. Compassion fatigue in healthcare providers: a scoping review. BMC Health Serv Res. 2023;23(1):1336. doi:10.1186/s12913-023-10356-3
7. Hooper C, Craig J, Janvrin DR, Wetsel MA, Reimels E. Compassion satisfaction, burnout, and compassion fatigue among emergency nurses compared with nurses in other selected inpatient specialties. J Emerg Nurs. 2010;36(5):420–427. doi:10.1016/j.jen.2009.11.027
8. Lv J, Che XY, Xie LL, Ren M, Guo TZ, Tu SH. Prevalence and risk factors of compassion fatigue in gynecological and obstetric nurses: a systematic review and meta-analysis. Front Public Health. 2025;13:1590995. doi:10.3389/fpubh.2025.1590995
9. Van Mol M, Kompanje E, Bakker J, Nijkamp M. Compassion fatigue and burnout among healthcare professionals in the ICU. Crit Care. 2014;18(Suppl 1):P19. doi:10.1186/cc13209
10. Ortega-Campos E, Vargas-Román K, Velando-Soriano A, et al. Compassion fatigue, compassion satisfaction, and burnout in oncology nurses: a systematic review and meta-analysis. Sustainability. 2019;12(1):72. doi:10.3390/su12010072
11. Xie W, Chen L, Feng F, et al. The prevalence of compassion satisfaction and compassion fatigue among nurses: a systematic review and meta-analysis. Int J Nurs Stud. 2021;120:103973. doi:10.1016/j.ijnurstu.2021.103973
12. Wang J, Okoli CT, He H, et al. Factors associated with compassion satisfaction, burnout, and secondary traumatic stress among Chinese nurses in tertiary hospitals: a cross-sectional study. Int J Nurs Stud. 2020;102:103472. doi:10.1016/j.ijnurstu.2019.103472
13. Sun J, Xue X, Cui Z. Study on the spatial distribution characteristics and influencing factors of older adult(s) care facilities in Liaoning Province based on POI data. Front Public Health. 2026;14:1735719. doi:10.3389/fpubh.2026.1735719
14. Pavithrakshmi KM, Chukkali S, Krishnamurthy V. Interventions addressing compassion fatigue among nurses: a scoping review. J Adv Nurs. 2026. doi:10.1111/jan.70465
15. Ren H, Yuan T, Yin X, et al. The dual-path analysis of the effect of difficult nurse-patient relationship on compassion fatigue and compassion satisfaction in nurses. J Nurs Res. 2026;34(1):e437. doi:10.1097/jnr.0000000000000722
16. Boni RL, Dingley C, Reyes A. Measuring professional quality of life in nurses: a realist review. Clin J Oncol Nurs. 2022;26(3):318–323. doi:10.1188/22.CJON.318-323
17. Sun B, Hu M, Yu S, Jiang Y, Lou B. Validation of the Compassion Fatigue Short Scale among Chinese medical workers and firefighters: a cross-sectional study. BMJ Open. 2016;6(6):e011279. doi:10.1136/bmjopen-2016-011279
18. Xie W, Liu M, Okoli CT, et al. Construction and evaluation of a predictive model for compassion fatigue among emergency department nurses: a cross-sectional study. Int J Nurs Stud. 2023;148:104613. doi:10.1016/j.ijnurstu.2023.104613
19. Zhang H, Dator WL. Establishment and validation of a prediction model for compassion fatigue in nursing students. BMC Nurs. 2025;24(1):193. doi:10.1186/s12912-025-02834-2
20. Howell MD, Corrado GS, DeSalvo KB. Three epochs of artificial intelligence in health care. JAMA. 2024;331(3):242–244. doi:10.1001/jama.2023.25057
21. Haug CJ, Drazen JM. Artificial intelligence and machine learning in clinical medicine, 2023. N Engl J Med. 2023;388(13):1201–1208. doi:10.1056/NEJMra2302038
22. Sacks D, Baxter B, Campbell BCV, et al. Multisociety consensus quality improvement revised consensus statement for endovascular therapy of acute ischemic stroke. Int J Stroke. 2018;13(6):612–632. doi:10.1177/1747493018778713
23. Bian X, Luan S, Wu H, Zhang D, Gao P, Chen X. Development of ICU nurses’ compassion fatigue classification model: an explainable machine learning algorithm. BMC Nurs. 2026;25(1):448. doi:10.1186/s12912-026-04611-1
24. Li Z, Gao M, Zhang H, et al. Machine learning and SHAP interpretation to identify high-level compassion fatigue among operating room nurses: a multicenter cross-sectional study. BMC Nurs. 2026;25 1 578. doi:10.1186/s12912-026-04728-3
25. Sinnathamby A, Ibrahim H, Ong YT, et al. Towards a theory of compassion fatigue in palliative care and oncology: a systematic scoping review. Am J Hosp Palliat Care. 2026;43(2):193–205. doi:10.1177/10499091251315183
26. Fan LH, Huang T, Liao MQ, et al. The effect of self-efficacy on compassion fatigue among nursing interns: the mediation of psychological resilience and social support. Medicine. 2025;104(47):e46029. doi:10.1097/MD.0000000000046029
27. D’Antoni F, Matiz A, Crescentini C. Mindfulness-Oriented Professional Resilience (MOPR) Training to Reduce Compassion Fatigue in Healthcare Workers: a Pilot Study. Healthcare. 2025;13(2):92. doi:10.3390/healthcare13020092
28. Lourenção LG, Silva FGD, Penha JGM, et al. Interactions between occupational stress, compassion fatigue, and work engagement among nurses. Rev Bras Enferm. 2025;78(4):e20240555. doi:10.1590/0034-7167-2024-0555
29. Chen H, Wang Y. Reliability and validity of the Chinese version of the compassion fatigue scale. Chin Nurs Manag. 2013;13(4):39–41.
30. Li S, Su J, Zhao D, Wang J, Wang G. Future time perspective and academic procrastination among nursing students: the mediating role of mindfulness. Nurs Open. 2023;10(6):3737–3743. doi:10.1002/nop2.1630
31. Campbell-Sills L, Stein MB. Psychometric analysis and refinement of the Connor-davidson Resilience Scale (CD-RISC): validation of a 10-item measure of resilience. J Trauma Stress. 2007;20(6):1019–1028. doi:10.1002/jts.20271
32. Wang X, Gao Y, Wang Q, Zhang P. Relationships between self-efficacy and teachers’ well-being in middle school english teachers: the mediating role of teaching satisfaction and resilience. Behav Sci. 2024;14(8):629. doi:10.3390/bs14080629
33. Zimet GD, Powell SS, Farley GK, Werkman S, Berkoff KA. Psychometric characteristics of the multidimensional scale of perceived social support. J Pers Assess. 1990;55(3–4):610–617. doi:10.1080/00223891.1990.9674095
34. Luszczynska A, Scholz U, Schwarzer R. The general self-efficacy scale: multicultural validation studies. J Psychol. 2005;139(5):439–457. doi:10.3200/JRLP.139.5.439-457
35. Chen YC, Guo YL, Lin LC, et al. Development of the nurses’ occupational stressor scale. Int J Environ Res Public Health. 2020;17(2):649. doi:10.3390/ijerph17020649
36. Wang PX, Wang MZ, Hu GX, Wang ZM. Study on the relationship between workplace violence and work ability among health care professionals in Shangqiu City. Wei Sheng Yan Jiu. 2006;35(4):472–474.
37. Tian Y, Yue Y, Wang J, Luo T, Li Y, Zhou J. Workplace violence against hospital healthcare workers in China: a national WeChat-based survey. BMC Public Health. 2020;20(1):582. doi:10.1186/s12889-020-08708-3
38. Schaufeli WB, Bakker AB, Salanova M. The measurement of work engagement with a short questionnaire: a cross-national study. Educ Psychol Meas. 2006;66(4):701–716. doi:10.1177/0013164405282471
39. Zhang Z. Multiple imputation with multivariate imputation by chained equation (MICE) package. Ann Transl Med. 2016;4(2):30. doi:10.3978/j.issn.2305-5839.2015.12.63
40. Degenhardt F, Seifert S, Szymczak S. Evaluation of variable selection methods for random forests and omics data sets. Brief Bioinform. 2019;20(2):492–503. doi:10.1093/bib/bbx124
41. Tibshirani R. Regression Shrinkage and Selection via the Lasso. J R Stat Soc Series B Stat Methodol. 1996;58:267–288. doi:10.1111/J.2517-6161.1996.TB02080.x
42. Sun M, Sun X, Wang F, Liu L. Machine learning-based prediction of diabetic peripheral neuropathy: model development and clinical validation. Front Endocrinol. 2025;16:1614657. doi:10.3389/fendo.2025.1614657
43. LaValley MP. Logistic regression. Circulation. 2008;117(18):2395–2399. doi:10.1161/CIRCULATIONAHA.106.682658
44. Breiman L. Random forests. Mach Learn. 2001;45(1):5–32. doi:10.1023/a:1010933404324
45. Chen T, Guestrin C. XGBoost: a Scalable Tree Boosting System. Proc ACM SIGKDD Int Conf Knowl Discov Data Min. 2016;785–794. doi:10.1145/2939672.2939785
46. Rufo DD, Debelee TG, Ibenthal A, Negera WG. Diagnosis of Diabetes Mellitus Using Gradient Boosting Machine (LightGBM). Diagnostics. 2021;11(9):1714. doi:10.3390/diagnostics11091714
47. Yang Z, Ren J, Zhang Z, et al. A new three-way incremental naive bayes classifier. Electronics. 2023;12(7):1730. doi:10.3390/electronics12071730
48. Mullick SS, Datta S, Das S. Adaptive learning-based -nearest neighbor classifiers with resilience to class imbalance. IEEE Trans Neural Netw Learn Syst. 2018;29(11):5713–5725. doi:10.1109/TNNLS.2018.2812279
49. Li G, Miao J, Jing P, et al. Development of predictive model for post-stroke depression at discharge based on decision tree algorithm: a multi-center hospital-based cohort study. J Psychosom Res. 2024;187:111942. doi:10.1016/j.jpsychores.2024.111942
50. Kriegeskorte N, Golan T. Neural network models and deep learning. Curr Biol. 2019;29(7):R231–R236. doi:10.1016/j.cub.2019.02.034
51. Gholami H, Darvishi E, Moradi N, et al. An interpretable (explainable) model based on machine learning and SHAP interpretation technique for mapping wind erosion hazard. Environ Sci Pollut Res Int. 2024;31:64628–64643. doi:10.1007/s11356-024-35521-x
52. Handelman GS, Kok HK, Chandra RV, Razavi AH, Lee MJ, Asadi H. eDoctor: machine learning and the future of medicine. J Intern Med. 2018;284(6):603–619. doi:10.1111/joim.12822
53. Yi L, Shuai T, Zhou J, Cheng L, Jiménez-Herrera MF, Tian X. Development and validation of a machine learning-based predictive model for compassion fatigue in Chinese nursing interns: a cross-sectional study utilizing latent profile analysis. BMC Med Educ. 2024;24(1):1495. doi:10.1186/s12909-024-06505-9
54. Zhang L, Zhang T, Ren Z, Jiang G. Predicting compassion fatigue among psychological hotline counselors using machine learning techniques. Curr Psychol. 2023;42(5):4169–4180. doi:10.1007/s12144-021-01776-7
55. Langseth H, Nielsen T. Classification using hierarchical naïve bayes models. Mach Learn. 2006;63(2):135–159. doi:10.1007/s10994-006-6136-2
56. Langarizadeh M, Moghbeli F. Applying naive bayesian networks to disease prediction: a systematic review. Acta Inform Med. 2016;24(5):364–369. doi:10.5455/aim.2016.24.364-369
57. Cheng X, Wang T, Zhu D, Ma J. Uncertainty explanation of artificial intelligence models by SHAP. Knowledge-Based Syst. 2026;337:115437. doi:10.1016/j.knosys.2026.115437
58. Zhang Y, He H, Yang C, et al. Chain mediations of perceived social support and emotional regulation efficacy between role stress and compassion fatigue: insights from the COVID-19 pandemic. Front Public Health. 2023;11:1269594. doi:10.3389/fpubh.2023.1269594
59. Vargas-Benítez MÁ, Izquierdo-Espín FJ, Castro-Martínez N, et al. Burnout syndrome and work engagement in nursing staff: a systematic review and meta-analysis. Front Med. 2023;10:1125133. doi:10.3389/fmed.2023.1125133
60. Mason VM, Leslie G, Clark K, et al. Compassion fatigue, moral distress, and work engagement in surgical intensive care unit trauma nurses: a pilot study. Dimens Crit Care Nurs. 2014;33(4):215–225. doi:10.1097/DCC.0000000000000056
61. Marti F, Giannarelli D, Mitello L, Fabriani L, Latina R, Mauro L. Correlation between Work Engagement and Burnout among Registered Nurses: an Italian hospital survey. Prof Inferm. 2019;72(1):42–49. doi:10.7429/pi.2019.72042
62. Li ACM, Chio FHN, Mak WWS, et al. Compassion fatigue, compassion satisfaction and mindfulness among healthcare professionals: a meta-analysis of correlational studies and randomized controlled trials. Soc Sci Med. 2025;367:117749. doi:10.1016/j.socscimed.2025.117749
63. Al-Jdeetawey NA, Al-Hammouri MM, Rababah JA, Ta’an WF, Suliman M. Effectiveness of a brief mindfulness-based intervention on compassion fatigue and compassion satisfaction in pediatric nurses. Worldviews Evid Based Nurs. 2025;22(1):e70002. doi:10.1111/wvn.70002
64. Öztürk Ş, Alagöz E. Relationships among secondary traumatic stress, mindfulness, compassion satisfaction, and compassion fatigue in psychiatric nurses. J Psychosoc Nurs Ment Health Serv. 2025;63(1):47–55. doi:10.3928/02793695-20240828-03
65. Ye L, Tang X, Li Y, et al. The prevalence and related factors of compassion fatigue among nursing interns: a cross-sectional study. BMC Nurs. 2024;23(1):762. doi:10.1186/s12912-024-02384-z
66. Zeng L, Liu D, Liang X, et al. The Levels and Influencing Factors of Compassion Fatigue among New Nurses during the COVID-19 Pandemic. J Nurs Manag. 2023;2023:4362841. doi:10.1155/2023/4362841
67. Amir K, Okalo P. Frontline nurses’ compassion fatigue and associated predictive factors during the second wave of COVID-19 in Kampala, Uganda. Nurs Open. 2022;9(5):2390–2396. doi:10.1002/nop2.1253
68. Duarte J, Pinto-Gouveia J. The role of psychological factors in oncology nurses’ burnout and compassion fatigue symptoms. Eur J Oncol Nurs. 2017;28:114–121. doi:10.1016/j.ejon.2017.04.002
69. Alharbi J, Jackson D, Usher K. Compassion fatigue in critical care nurses. An integrative review of the literature. Saudi Med J. 2019;40(11):1087–1097. doi:10.15537/smj.2019.11.24569
70. Jeanmonod D, Irick J, Munday AR, Awosika AO, Jeanmonod R. Compassion Fatigue in Emergency Medicine: Current Perspectives. Open Access Emerg Med. 2024;16:167–181. doi:10.2147/OAEM.S418935
71. Xie W, Wang J, Zhang Y, et al. The levels, prevalence and related factors of compassion fatigue among oncology nurses: a systematic review and meta-analysis. J Clin Nurs. 2021;30(5–6):615–632. doi:10.1111/jocn.15565
72. Kelly L, Runge J, Spencer C. Predictors of compassion fatigue and compassion satisfaction in acute care nurses. J Nurs Scholarsh. 2015;47(6):522–528. doi:10.1111/jnu.12162
73. Xie W, Wang J, Okoli CTC, et al. Prevalence and factors of compassion fatigue among Chinese psychiatric nurses: a cross-sectional study. Medicine. 2020;99(29):e21083. doi:10.1097/MD.0000000000021083
74. Chen M, Xie H, Liao X, Ni J. Workplace violence and turnover intention among Chinese nurses: the mediating role of compassion fatigue and the moderating role of psychological resilience. BMC Public Health. 2024;24(1):2437. doi:10.1186/s12889-024-19964-y
75. Kim Y, Lee E, Lee H. Association between workplace bullying and burnout, professional quality of life, and turnover intention among clinical nurses. PLoS One. 2019;14(12):e0226506. doi:10.1371/journal.pone.0226506
 © 2026 The Author(s). This work is published and licensed by Dove Medical Press Limited. The
full terms of this license are available at https://www.dovepress.com/terms
and incorporate the Creative Commons Attribution
- Non Commercial (unported, 4.0) License.
By accessing the work you hereby accept the Terms. Non-commercial uses of the work are permitted
without any further permission from Dove Medical Press Limited, provided the work is properly
attributed. For permission for commercial use of this work, please see paragraphs 4.2 and 5 of our Terms.
© 2026 The Author(s). This work is published and licensed by Dove Medical Press Limited. The
full terms of this license are available at https://www.dovepress.com/terms
and incorporate the Creative Commons Attribution
- Non Commercial (unported, 4.0) License.
By accessing the work you hereby accept the Terms. Non-commercial uses of the work are permitted
without any further permission from Dove Medical Press Limited, provided the work is properly
attributed. For permission for commercial use of this work, please see paragraphs 4.2 and 5 of our Terms.
Recommended articles

A Machine Learning Model Based on Health Records for Predicting Recurrence After Microwave Ablation of Hepatocellular Carcinoma
An C, Yang H, Yu X, Han Z, Cheng Z, Liu F, Dou J, Li B, Li Y, Li Y, Yu J, Liang P
Journal of Hepatocellular Carcinoma 2022, 9:671-684
Published Date: 28 July 2022
An Explainable Machine Learning Model to Predict Acute Kidney Injury After Cardiac Surgery: A Retrospective Cohort Study
Gao Y, Wang C, Dong W, Li B, Wang J, Li J, Tian Y, Liu J, Wang Y
Clinical Epidemiology 2023, 15:1145-1157
Published Date: 4 December 2023
Analysis of Health-Related Quality of Life in Elderly Patients with Stroke Complicated by Hypertension in China Using the EQ-5D-3L Scale
Wang S, Shen C, Yang S
Journal of Multidisciplinary Healthcare 2024, 17:1981-1997
Published Date: 30 April 2024
Machine Learning-Based Predictive Modeling of Diabetic Nephropathy in Type 2 Diabetes Using Integrated Biomarkers: A Single-Center Retrospective Study
Zhu Y, Zhang Y, Yang M, Tang N, Liu L, Wu J, Yang Y
Diabetes, Metabolic Syndrome and Obesity 2024, 17:1987-1997
Published Date: 10 May 2024
Integrating Machine Learning and the SHapley Additive exPlanations (SHAP) Framework to Predict Lymph Node Metastasis in Gastric Cancer Patients Based on Inflammation Indices and Peripheral Lymphocyte Subpopulations
Zhu Z, Wang C, Shi L, Li M, Li J, Liang S, Yin Z, Xue Y
Journal of Inflammation Research 2024, 17:9551-9566
Published Date: 23 November 2024