Back to Journals » Clinical Interventions in Aging » Volume 21
Development and Internal Validation of a Machine Learning–Based Classification Model for Identifying Cognitive Frailty in Older Inpatients with Type 2 Diabetes Mellitus
Authors Wang S, Tan T, Wang Q, Xu C, Yang C, Wang M, Dai K
Received 2 February 2026
Accepted for publication 17 May 2026
Published 1 July 2026 Volume 2026:21 594752
DOI https://doi.org/10.2147/CIA.S594752
Checked for plagiarism Yes
Review by Single anonymous peer review
Peer reviewer comments 3
Editor who approved publication: Dr Zhi-Ying Wu
Sijing Wang,1 Tingting Tan,2 Qingqing Wang,2 Cong Xu,2 Chongyao Yang,3 Miaoqin Wang,4 Kaili Dai5
1Nursing Department, West China School of Public Health and West China Fourth Hospital, Sichuan University, Chengdu, People’s Republic of China; 2Nursing Department, Affiliated Hospital of North Sichuan Medical College, Nanchong, People’s Republic of China; 3Department of Stomatology, Affiliated Hospital of North Sichuan Medical College, Nanchong, People’s Republic of China; 4Outpatient Department, Affiliated Hospital of North Sichuan Medical College, Nanchong, People’s Republic of China; 5Department of Critical Care Medicine, West China School of Public Health and West China Fourth Hospital, Sichuan University, Chengdu, People’s Republic of China
Correspondence: Kaili Dai, Department of Critical Care Medicine, West China School of Public Health and West China Fourth Hospital, Sichuan University, No. 18, Section 3, Renmin South Road, Wuhou District, Chengdu, Sichuan, 610041, People’s Republic of China, Email [email protected]
Background: Cognitive frailty (CF) is prevalent in older adults with type 2 diabetes mellitus (T2DM) and significantly increases risks of adverse outcomes. Early detection is essential for potential reversibility, requiring efficient bedside identification tools.
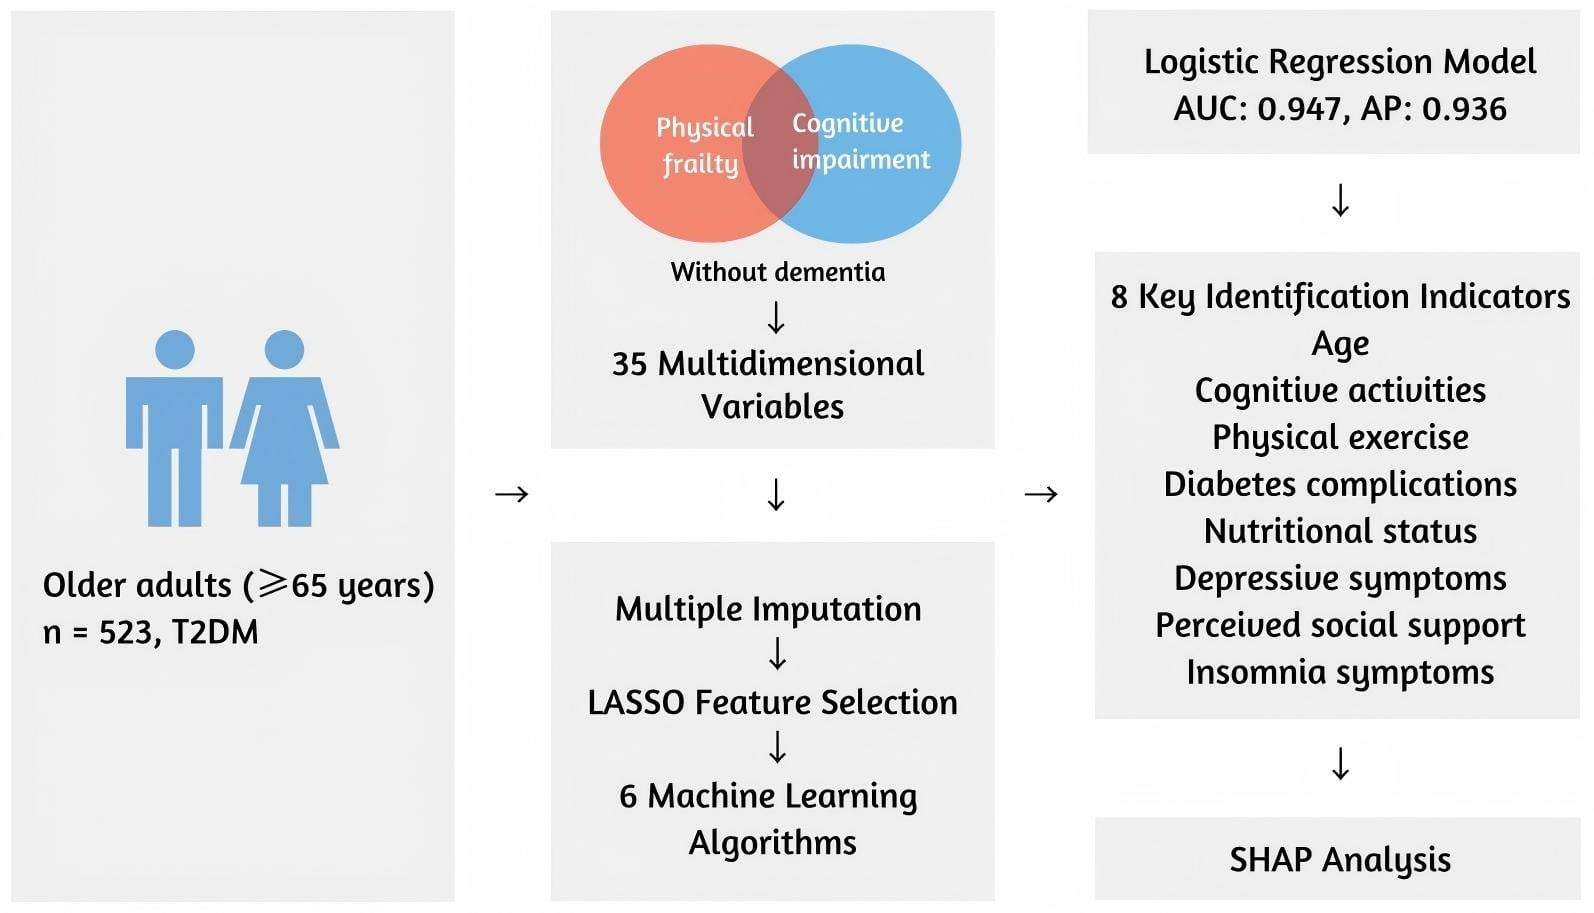
Methods: This study included 523 consecutive older adults (aged 65 years or older) diagnosed with T2DM at a tertiary care center in Sichuan, China. Within a health ecological framework, 35 candidate variables were collected. Multiple imputation was used for missing data. LASSO regression was applied to the full candidate set to select key features. Six algorithms (logistic regression, decision tree, random forest, support vector machine, XGBoost, and stacking) were trained to identify CF with a 70/30 split (training/test). Performance was evaluated on the test set using AUC, AP, accuracy, sensitivity, specificity, and calibration; SHAP was used to assess model interpretability.
Results: Mean age was 74.3± 6.4 years, and CF prevalence was 41.5%. LASSO identified eight indicators: age, cognitive activities, physical exercise, diabetes complications, nutritional status, depressive symptoms, perceived social support, and insomnia symptoms. On the test set, logistic regression achieved the best performance for identification (AUC 0.947, AP 0.936, accuracy 0.879, sensitivity 0.838, specificity 0.910), with good calibration. SHAP analysis revealed that older age, lower frequency of physical exercise, higher scores for depressive symptoms, lower social support, poorer nutritional status, a greater number of diabetes complications, lack of cognitive activities, and higher scores for insomnia symptoms were the major contributors to a higher likelihood of CF.
Conclusion: In this single-center hospital-based sample, a parsimonious model using eight readily obtainable features demonstrated strong internal validity for identifying CF in older inpatients with T2DM. This tool may facilitate early screening and clinical decision-making. Prospective studies are warranted to confirm its clinical utility. Study flowchart: ML identifies frailty indicators in older T2DM adults.A flowchart illustrating a study on older adults aged 65 years and above with type 2 diabetes mellitus, totaling 523 participants. The study focuses on physical frailty and cognitive impairment without dementia, using 35 multidimensional variables. The process involves multiple imputation (MICE), LASSO feature selection and six machine learning algorithms. A logistic regression model is applied, achieving an area under the curve of 0.947 and an average precision of 0.936. Eight key identification indicators are highlighted: age, cognitive activities, physical exercise, diabetes complications, nutritional status, depressive symptoms, perceived social support and insomnia symptoms. SHAP analysis is used for further insights.
Keywords: cognitive frailty, type 2 diabetes mellitus, older adults, machine learning, identification, health ecological theory
Graphical Abstract:
Introduction
Cognitive frailty (CF), defined by an international consensus group as the concurrence of physical frailty and cognitive impairment (CDR=0.5) in the absence of dementia, has emerged as an important geriatric syndrome.1 CF is prevalent in older adults and is associated with markedly increased risks of adverse outcomes, including approximately doubled risks of mortality, dementia, disability, and functional decline.2 In practice, early CF is often insidious - with subtle memory and mobility declines - making it difficult to detect in routine clinical care and complicating timely intervention.
Older adults with type 2 diabetes mellitus (T2DM) are particularly vulnerable to CF. T2DM is a well-established risk factor for accelerated cognitive decline and dementia. Evidence from longitudinal cohort studies indicates that individuals with diabetes experience a significantly faster rate of cognitive decline - approximately 1.5 to 2 times higher - than those without diabetes, across multiple cognitive domains, including memory and executive function.3 In addition to its detrimental effects on cognition, T2DM also contributes to physical frailty through metabolic, inflammatory, and muscular pathways. Chronic hyperglycemia and insulin resistance impair muscle protein synthesis and accelerate sarcopenia, while oxidative stress, systemic inflammation, and mitochondrial dysfunction further weaken muscle strength and physical performance. These pathophysiological alterations collectively reduce physiological reserve and resilience, predisposing diabetic older adults to physical frailty.4 Critically, these specific functional declines are not inevitable. Evidence suggests that targeted physical interventions are crucial in mitigating these specific declines. For instance, both eccentric and traditional resistance training have been shown to significantly enhance muscle strength, power, and functional performance in older adults, providing a robust mechanism to counteract the accelerated sarcopenia associated with metabolic dysfunction.5
Despite this high susceptibility, tools for the early identification of cognitive frailty in older adults with T2DM remain limited. While recent efforts have sought to build nomograms using conventional clinical factors, such as a study in Jinzhou that used 22 variables and logistic regression, these models often overlook broader psychosocial and environmental determinants.6 Furthermore, traditional linear models may fail to capture the complex, non-linear interactions between multidimensional features.
In this study, we propose developing a machine-learning-based identification model for CF in older T2DM inpatients. Drawing on a health-ecological perspective, we will integrate a broad array of 35 candidate factors across individual, clinical, psychosocial, and environmental domains.7,8 By employing advanced machine learning techniques and ensemble methods (Stacking), we aim to identify the optimal combination of indicators that accurately classifies CF and to provide model interpretability via SHAP analysis. Such a tool could enable earlier screening of CF and guide targeted prevention and management strategies in this vulnerable population.
Methods
Study Design and Participants
This cross-sectional study was conducted at a tertiary hospital in China and included hospitalized older adults diagnosed with T2DM between January and September 2024. Following the recommendation for clinical machine learning models, we targeted an Events Per Variable (EPV) ratio of 10–15.9 Given our 35 candidate features, the final inclusion of 523 participants ensured robust model development and internal validation.
Eligible inpatients were aged 65 years or older and had confirmed T2DM according to World Health Organization (WHO) criteria. To minimize the confounding impact of the acute phase of hospitalization and the potential for delirium to affect cognitive performance, all clinical and cognitive assessments were performed 48 to 72 hours after admission, once the patients’ clinical conditions had stabilized. Furthermore, per the inclusion criteria, all participants were required to be conscious and without communication barriers. During the assessment process, the research team further excluded individuals exhibiting clinical signs of delirium through direct interaction and observation, ensuring that participants were in an optimal state for cognitive and frailty testing. Those with a known diagnosis of dementia or severe neurocognitive disorders were excluded, as were inpatients unable to undergo frailty or cognitive assessments due to serious illness. The study was approved by the hospital’s ethics committee (Approval No. 2023ER432-1), and all participants or their legal representatives provided written informed consent.
Administration and Blinding
The clinical assessments, including the Fried Frailty Phenotype (FFP), MoCA, and CDR, were administered by a dedicated research team of six trained investigators (comprising clinical nurses and medical graduate students). To ensure diagnostic standardization, all team members completed an intensive training program led by a senior neurologist and passed a formal proficiency certification. To minimize assessment bias, the investigators remained blinded to the subsequent statistical analysis and machine learning modeling process. Throughout the administration of cognitive and frailty tools, the assessors followed standardized protocols to maintain objectivity regarding the patients’ overall clinical data.
Definition of Cognitive Frailty
Cognitive frailty was defined in accordance with the consensus of the International Academy on Nutrition and Aging (IANA) and the International Association of Gerontology and Geriatrics (IAGG).1,10 The diagnosis required concurrent physical frailty and mild cognitive impairment (MCI), in the absence of dementia. The specific content is as follows:11–14
1. Physical Frailty Assessment: Physical frailty was evaluated using the Fried Frailty Phenotype (FFP), with a score of 3–5 indicating frailty. The five components were assessed as follows: (1) Unintentional weight loss: Self-reported unintentional weight loss of > 4.5 kg or > 5% of baseline body weight in the past year; (2) Low grip strength: Measured using an electronic dynamometer (Xiangshan EH-101). Participants performed two trials with their dominant hand, and the mean value was recorded; (3) Self-reported exhaustion: Based on two items from the Center for Epidemiological Studies Depression Scale (as integrated in the FFP): “I felt that everything I did was an effort” and “I could not get going”. A positive score was assigned if either feeling occurred for ≥ 3 days in the past week. (4) Low physical activity: Defined as a weekly total energy expenditure of < 383 kcal for men or < 270 kcal for women, calculated using the International Physical Activity Questionnaire (IPAQ); (5) Slow gait speed: Measured by the time taken to walk 4.6 meters at a normal pace. Timing was recorded with an electronic stopwatch (Li-Ning LN-808), and “slow” was defined as exceeding sex- and height-adjusted thresholds.
2. Mild Cognitive Impairment (MCI) Assessment: MCI was identified through a three-step procedure to ensure diagnostic rigor: (1) Subjective Cognitive Decline (SCD): Confirmation of a persistent decline in memory or cognitive function compared to a prior normal state, independent of acute events. (2) Clinical Dementia Rating (CDR): A CDR score of 0.5 was required to indicate questionable dementia or MCI. (3) Montreal Cognitive Assessment (MoCA): Scores were adjusted for education levels: < 14 for illiterate participants, < 20 for primary school education, and < 25 for junior high school and above.
Data Collection
Candidate variables were selected based on the five domains of the health ecological model: personal traits, psychosocial factors, lifestyle behaviors, social environment, and structural conditions, supplemented by clinical relevance. A total of 35 candidate variables were collected. Sociodemographic data included age, sex, marital status, education level, place of residence, living arrangement, type of medical insurance, and monthly household income. Behavioral factors included smoking, alcohol use, physical exercise, and cognitive activity. Specifically, smoking and alcohol use were defined as habits occurring at least once per week during the preceding six months.15,16 Physical exercise was characterized as moderate-intensity physical activity lasting at least 30 minutes per session, maintained for at least three months.17 Cognitive activity was defined as persistent participation in intellectually stimulating pursuits, including reading, writing, calligraphy, stock trading, playing cards or chess, photography, painting, playing musical instruments, or handicrafts.18 Insomnia symptoms were assessed using the Athens Insomnia Scale (AIS), reflecting sleep status over the past month.19 Psychosocial metrics included perceived social support (measured using a validated scale) and depressive symptoms, assessed via the 15-item Geriatric Depression Scale (GDS-15), and confirmed clinical diagnosis if applicable.20,21 Nutritional status was assessed using the Mini Nutritional Assessment-Short Form (MNA-SF), with patients categorized as well-nourished, at risk of malnutrition, or malnourished.22
Diabetes-specific variables included duration of diabetes, family history, and HbA1c level, the latter of which was based on the initial laboratory result obtained within hospital admission. Diabetic complications were recorded: peripheral neuropathy, retinopathy, nephropathy, foot ulcers, and lower extremity arterial disease, based on clinical documentation and diagnostic results. The number of non-diabetes chronic comorbidities was also counted, including hypertension, coronary artery disease, stroke, chronic pulmonary disease, and others.23 Specific comorbid conditions documented were hypertension, dyslipidemia, hyperuricemia, osteoporosis, cardiovascular disease, chronic respiratory disease, and gastrointestinal disorders.24 Operational definitions and coding for clinical variables are detailed in Supplementary Table S1. The variable set was determined based on literature evidence and clinical judgment as relevant to CF risk in older adults. Data were obtained through structured interviews, physical examinations, and medical record review by trained research personnel.
Feature Selection and Model Development
The Least Absolute Shrinkage and Selection Operator (LASSO) logistic regression with 10-fold cross-validation was applied directly to the full set of 35 candidate variables to select the most relevant features. By introducing an L1 penalty, LASSO reduces model complexity and the potential for overfitting while retaining variables with stronger associations, particularly effective in clinical datasets with high dimensionality and correlated features.25
Based on the selected features, six machine learning models were developed: logistic regression, decision tree, random forest, support vector machine, extreme gradient boosting (XGBoost), and a stacking ensemble.26 These algorithms represent diverse modeling approaches, including linear classification, tree-based decisions, and ensemble learning techniques capable of capturing complex, nonlinear interactions. The dataset was randomly split into training (70%) and validation (30%) subsets. All data were standardized prior to modeling. Five-fold cross-validation was used to tune hyperparameters.
To enhance generalizability and reduce the likelihood of overfitting, a combination of grid and random search strategies was used to optimize the model. Each model’s performance was assessed in the validation cohort to identify the most accurate and stable identification model.
Model Interpretation
During the interpretation phase, this study applied Shapley Additive exPlanations (SHAP), a method grounded in cooperative game theory. By assigning a Shapley value to each input feature, SHAP quantifies each feature’s contribution to the model’s classification, enabling detailed interpretation of the optimal model’s decision logic.
Five types of SHAP visualizations were generated. The bar plot displays the average magnitude of each feature’s influence across all identifications. The scatter plot ranks features by their importance and illustrates whether higher or lower values push the model output toward a higher probability of cognitive frailty. The decision plot breaks down how individual features affect the classification for a specific patient, while the force plot shows the directional impact of each feature relative to a baseline. The summary stacked plot provides an overall view of how features contribute to the identified status across all samples. These visualizations clarify how the model determines the likelihood of cognitive frailty and offer support for future clinical identification and intervention planning.
Statistical Analysis
All statistical analyses were conducted using R 4.4.2, Python 3.9, and SPSS 26.0. To ensure data integrity, missing values were addressed using Multiple Imputation by Chained Equations (MICE). All continuous variables were standardized before analysis. Continuous variables following a normal distribution were expressed as mean ± standard deviation and compared using independent samples t-tests. Non-normally distributed continuous variables were summarized as median and interquartile range and compared using the Mann–Whitney U-test. Categorical variables were presented as counts and percentages, with between-group comparisons conducted using chi-square tests or Fisher’s exact tests as appropriate. Two-sided P-values less than 0.05 were considered statistically significant.
Results
Participant Selection and Baseline Characteristics
The detailed screening and recruitment process for the study participants is illustrated in the flow diagram (Figure 1). A total of 523 older adults with type 2 diabetes mellitus (T2DM) were finally included, with a mean age of 74.3 ± 6.4 years and a cognitive frailty (CF) prevalence of 41.5%. Among the participants, 235 (44.9%) were male, 445 (85.1%) were married, and 329 (62.9%) resided in urban areas. Baseline characteristics—including physical frailty status (47.8% frail, 43.2% prefrail, 9.0% non-frail), MCI (53.5%), and all 35 candidate variables—were balanced between the training and testing sets (all P > 0.05; Supplementary Tables S2 and S3).
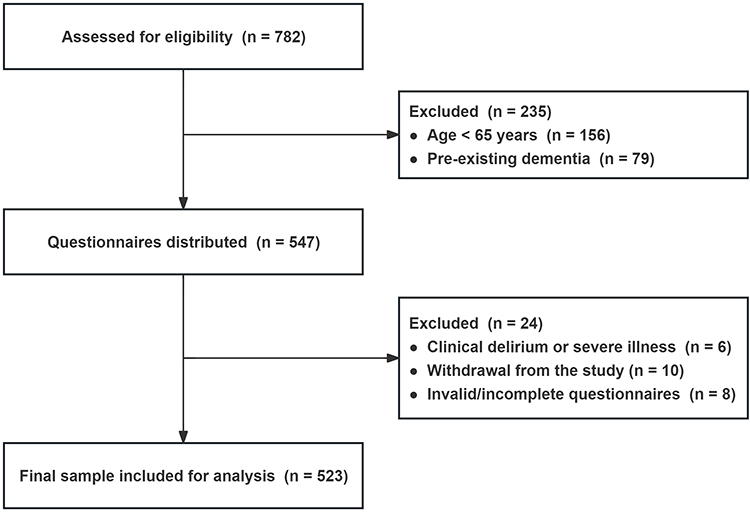 |
Figure 1 Flow Diagram of Participant Selection. Notes: No variables were excluded due to >10% missingness; missing data were addressed using Multiple Imputation by Chained Equations (MICE) prior to analysis. |
As shown in Table 1, participants with CF were significantly older and more likely to be female than those without CF. They also demonstrated lower levels of education and income, a higher likelihood of residing in rural areas, and were more frequently unmarried, widowed, or divorced. Furthermore, individuals with CF reported lower engagement in cognitive or physical activities and higher rates of depressive symptoms, insomnia, and malnutrition (all P < 0.001). Clinical comparisons revealed that the CF group had a higher prevalence of diabetes complications—such as neuropathy, foot ulcers, and lower-extremity arterial disease—and a greater number of non-diabetic comorbidities (all P < 0.05). Detailed baseline comparisons are presented in Table 1.
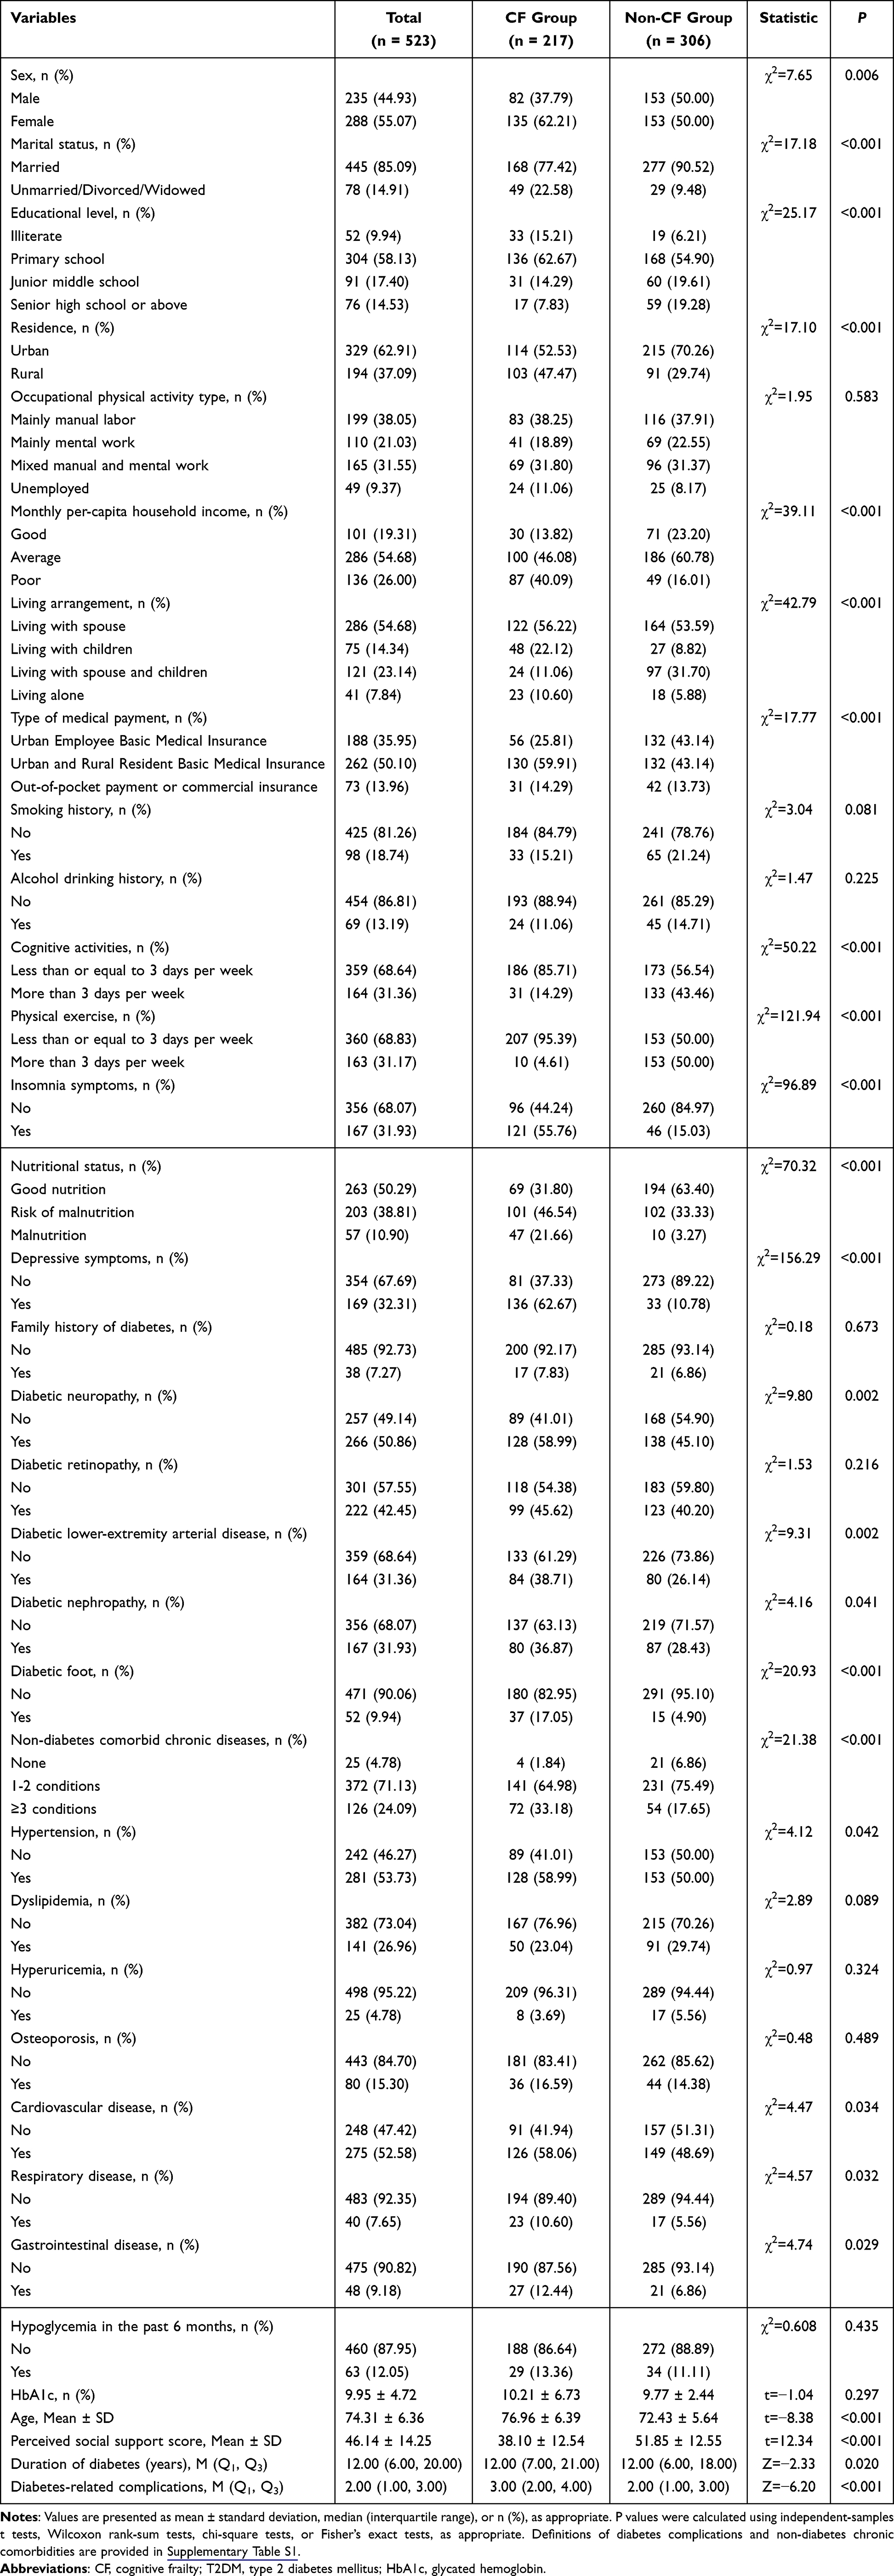 |
Table 1 Baseline Sociodemographic, Clinical, Behavioral, and Psychosocial Characteristics of Older Inpatients with Type 2 Diabetes Mellitus According to Cognitive Frailty Status |
Feature Selection for Model
The Least Absolute Shrinkage and Selection Operator (LASSO) logistic regression algorithm was employed to perform dimensionality reduction and feature selection on the training set. Based on the health ecological framework, all 35 candidate variables were directly entered into the LASSO model to minimize selection bias. As the penalty parameter λ increased, the coefficients of many variables gradually shrank toward zero (Figure 2). Using 10-fold cross-validation and the 1-SE rule, the optimal λ value was determined (Figure 3), at which 8 features with non-zero coefficients were selected as key features.
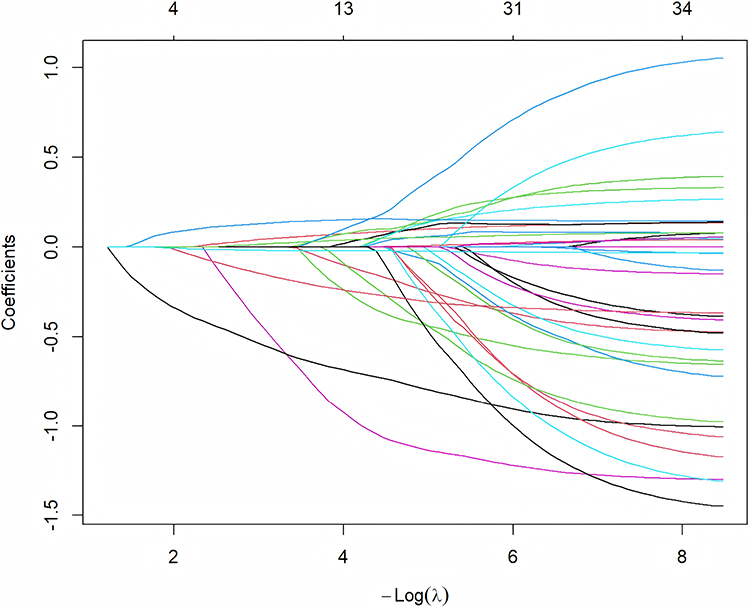 |
Figure 2 LASSO coefficient profiles of the 35 candidate features. The profile plot shows the shrinkage of coefficients as the penalty parameter (λ) increases. |
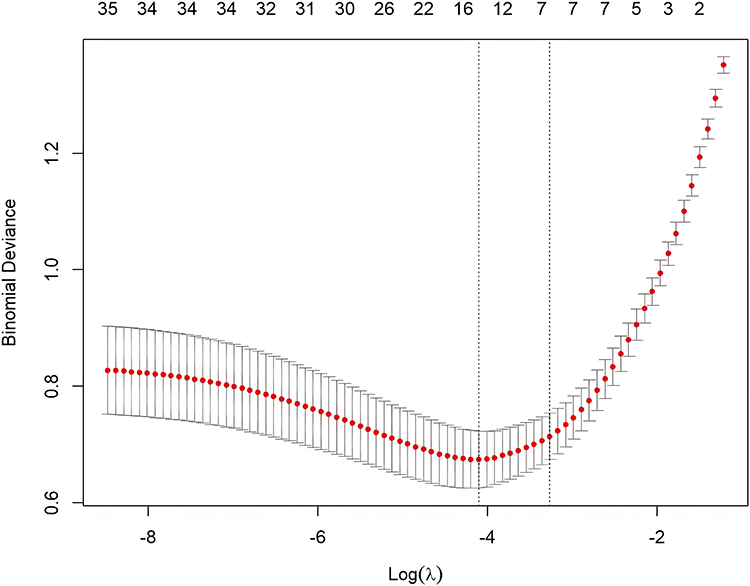 |
Figure 3 Ten-fold Cross-validation Plot. The plot illustrates the selection of the optimal penalty parameter (λ) using 10-fold cross-validation and the 1-SE rule to identify key features. |
The final features included age, cognitive activities, physical exercise, diabetes complications, nutritional status, depressive symptoms, perceived social support, and insomnia symptoms. These variables were subsequently used as inputs for machine learning model development.
Model Development and Comparison
Six machine learning models—logistic regression (LR), decision tree (DT), support vector machine (SVM), random forest (RF), XGBoost, and stacking—were trained and evaluated. As summarized in Table 2, all models demonstrated strong discriminative ability, with testing-set AUCs ranging from 0.863 to 0.947. Among the classifiers, the Logit model achieved the most robust performance in the testing set, yielding the highest AUC of 0.947 (95% CI: 0.903–0.977) and an average precision (AP) of 0.936 (95% CI: 0.890–0.972). This balance of high sensitivity and specificity indicates the model’s clinical utility in accurately identifying cognitive frailty while minimizing false positives. The stacking model ranked second, with an AUC of 0.945 (95% CI: 0.903–0.975), accuracy of 0.898 (95% CI: 0.841–0.936), sensitivity of 0.941 (95% CI: 0.858–0.977), and specificity of 0.865 (95% CI: 0.779–0.921). The RF and SVM classifiers followed closely behind, with test AUCs of 0.945 (95% CI: 0.907–0.974) and 0.943 (95% CI: 0.898–0.977), respectively. XGBoost showed comparable discrimination (AUC = 0.941, 95% CI: 0.900–0.971), but slightly lower balance in sensitivity and specificity. The DT model performed the weakest, with a test AUC of 0.863 (95% CI: 0.797–0.916) and sensitivity of 0.912. Detailed performance metrics for all models are presented in Table 2.
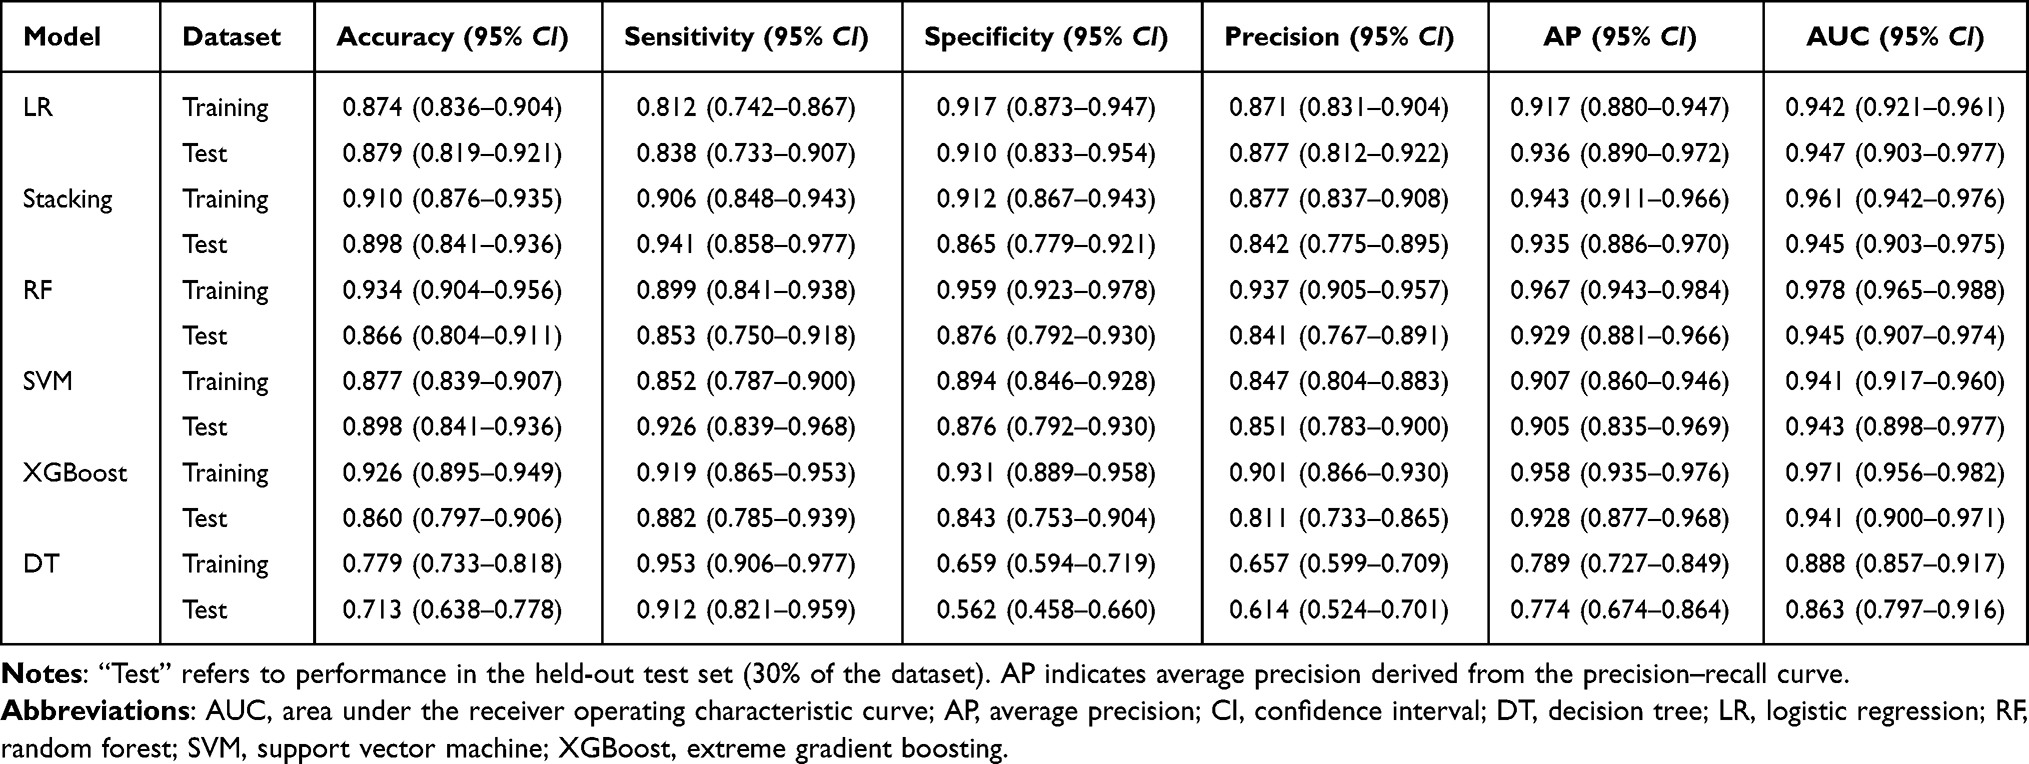 |
Table 2 Performance Metrics and 95% Confidence Intervals of Six Machine Learning Models for Identifying Cognitive Frailty in Training and Testing Sets |
Figure 4 presents ROC curves and calibration plots for each model on training and test datasets, with the LR curve consistently at the top in the test cohort. Figure 5 displays a heatmap comparing accuracy, sensitivity, specificity, ROC AUC, precision, recall, and AP across all models. Decision curve analysis (Figure 6) confirmed the net clinical benefit of the LR model across a range of threshold probabilities.
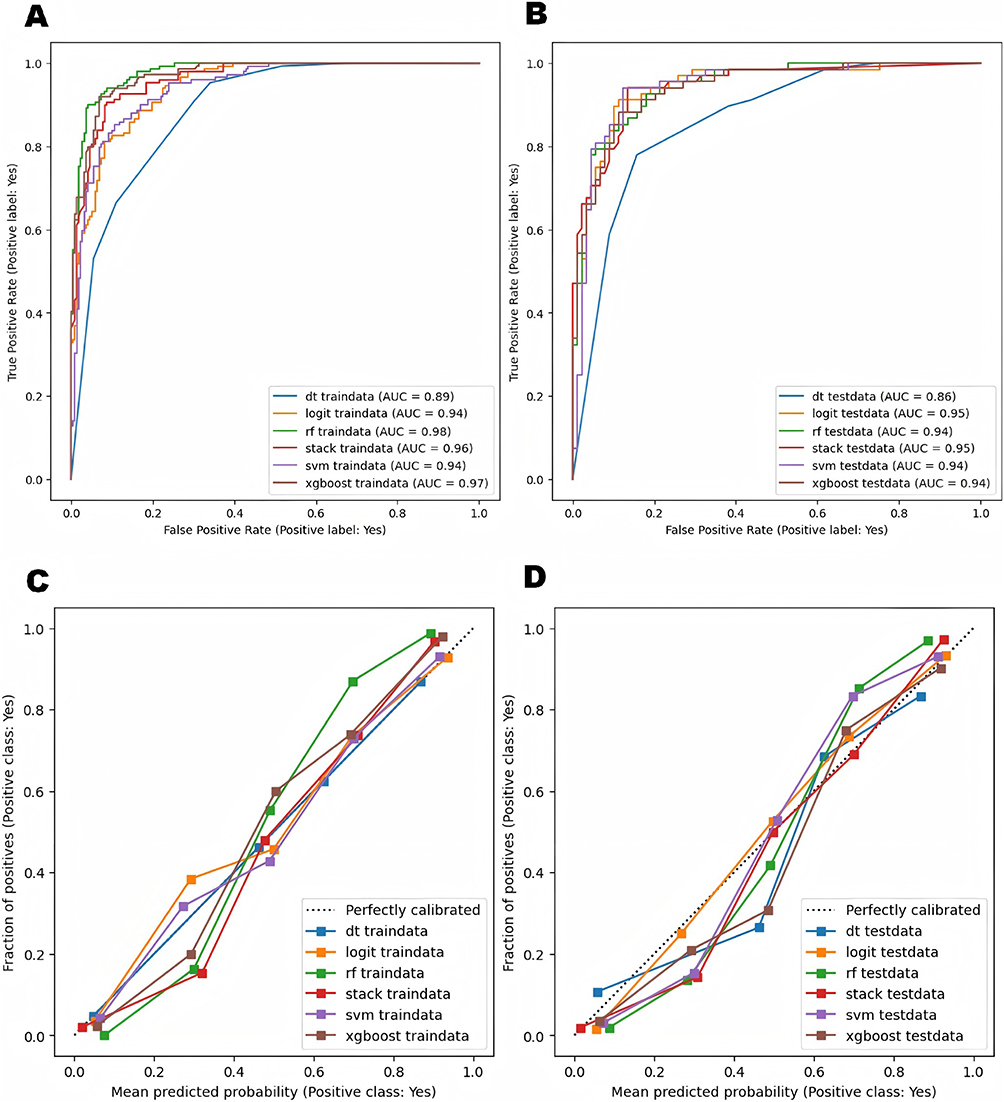 |
Figure 4 ROC curves and calibration plots of six machine learning models in the training and test sets. (A) ROC curves in the training set. (B) ROC curves in the test set. (C) Calibration plots in the training set. (D) Calibration plots in the test set. Abbreviations: AUC, area under the receiver operating characteristic curve; dt, decision tree; logit, logistic regression; rf, random forest; stack, stacking ensemble; svm, support vector machine; xgboost, extreme gradient boosting. |
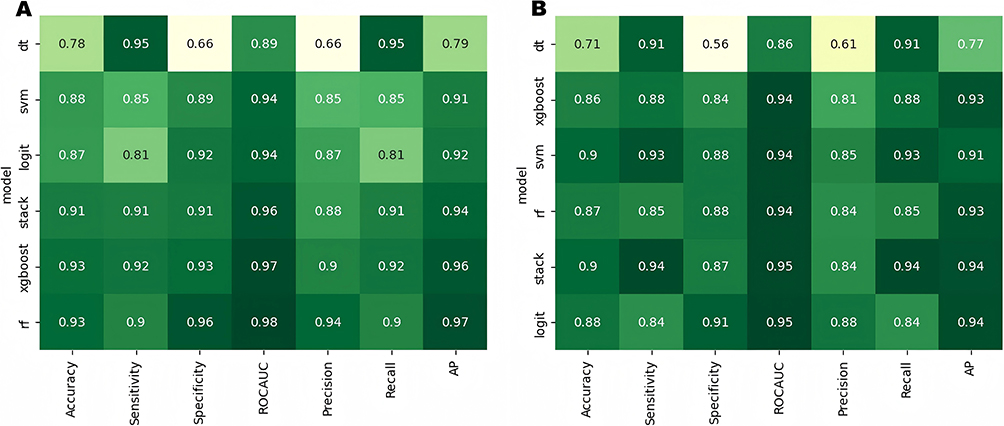 |
Figure 5 Heatmap of performance metrics for six machine learning models in the training and test sets. (A) Training set. (B) Test set. Abbreviations: ROCAUC, area under the receiver operating characteristic curve; AP, average precision; dt, decision tree; logit, logistic regression; rf, random forest; stack, stacking ensemble; svm, support vector machine; xgboost, extreme gradient boosting. |
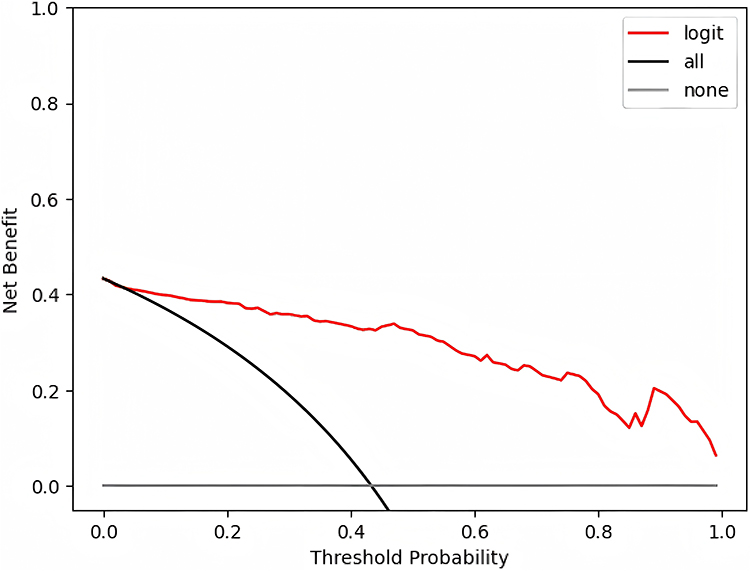 |
Figure 6 Decision curve analysis (DCA) of the logistic regression model on the test set. The red line indicates the logistic regression model; the black line represents the “treat all” strategy; the gray line represents the “treat none” strategy. |
Model Interpretability
To enhance interpretability, SHAP analysis was applied to the logistic regression model. Figure 7A shows the feature importance ranking from the logistic regression model, indicating that physical exercise, nutritional status (MNA score), and age were the most influential features associated with cognitive frailty. Figure 7B displays the SHAP summary bar plot, showing that physical exercise, nutritional status, and age were the top contributors to model classifications, based on their average absolute SHAP values. The SHAP summary dot plot (Figure 7C) reveals the direction of these effects: higher age, higher depressive symptoms (GDS score), higher insomnia symptoms (AIS score), and a greater number of diabetes-related complications (red dots skewed to the right) were associated with an increased probability of cognitive frailty. Conversely, frequent physical exercise, better nutritional status (MNA score), higher perceived social support and frequency of cognitive activities (red dots skewed left) served as significant protective factors. This visualization highlights not only the relative importance of each feature but also how high versus low values shift model outputs in opposing directions, enhancing clinical interpretability of the model’s decision-making.
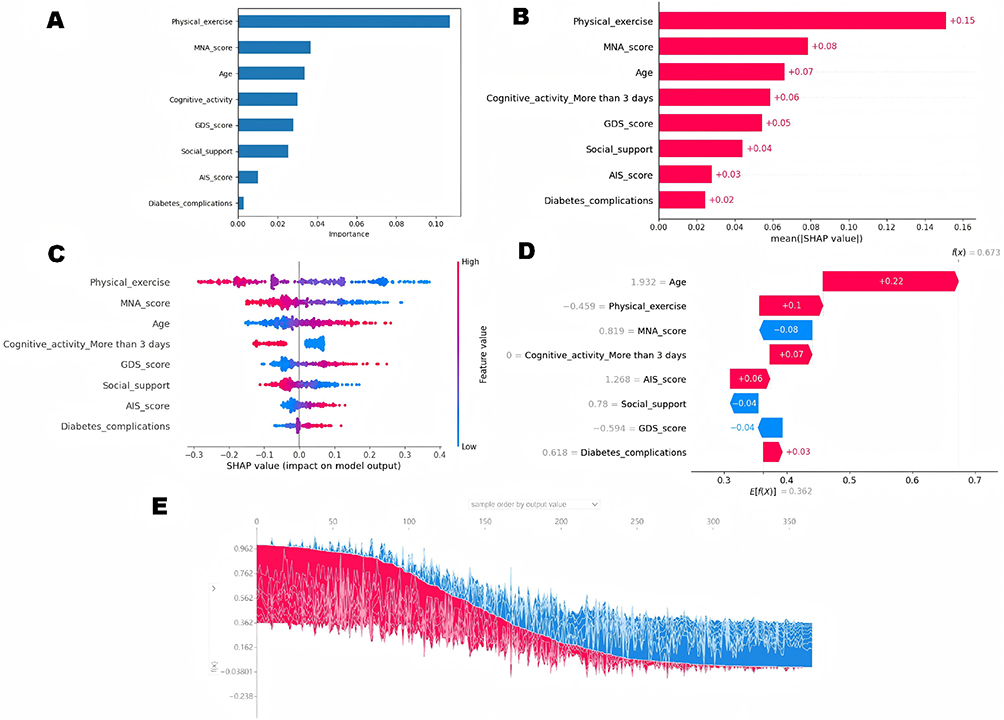 |
Figure 7 Model interpretability using SHAP analysis for the logistic regression model. (A) Logistic Regression Coefficient Importance Plot. (B) SHAP Summary Bar Plot showing global feature importance. (C) SHAP Summary Dot Plot illustrating the direction of feature effects. (D) SHAP Decision Plot for a representative individual sample, showing how features shift the model output from the baseline (E[f(x)]) to the final identification (f(x)). (E) SHAP Summary Stacked Plot visualizing global feature contributions across all samples. Abbreviations: SHAP, SHapley Additive exPlanations; MNA, Mini Nutritional Assessment; GDS, Geriatric Depression Scale; AIS, Athens Insomnia Scale. |
Figure 7D shows the SHAP decision plot for an individual case, illustrating how each feature contributes to shifting the model output from the baseline value (E[f(x)] = 0.362) to the final classification (f(x) = 0.673).
For this specific patient, advanced age (+0.22), lack of physical exercise (+0.1) and cognitive activities (+0.07), insomnia symptoms (+0.06), and more diabetes complications (+0.03) contributed positively to the cognitive frailty identification, whereas good nutritional status (MNA score, −0.08) and perceived social support (−0.04), and lower depressive symptoms (−0.04) exerted negative contributions, pulling the output back toward a lower probability.
Figure 7E presents the SHAP summary stacked plot, which visualizes how each feature contributes to the model’s outputs across all samples; red segments indicate features that drive identifications toward a higher likelihood of cognitive frailty, while blue segments indicate features that drive identifications toward a lower likelihood. This plot highlights the distribution and cumulative effect of feature contributions, supporting transparent patient stratification.
Discussion
Cognitive frailty (CF), defined as the coexistence of physical frailty and cognitive impairment without dementia, is a critical geriatric syndrome in older adults with T2DM, associated with increased risks of disability, hospitalization, and mortality.27 As a potentially reversible condition, early identification is essential to enable timely interventions.28 In this study, we developed and internally validated a parsimonious identification model for cognitive frailty in hospitalized older patients with T2DM. Eight indicators were identified using LASSO regression, encompassing demographic (age), behavioral (physical exercise and cognitive activity), clinical (diabetes complications, nutritional status, insomnia symptoms), and psychosocial domains (depressive symptoms, perceived social support) — all of which allow for rapid, non-invasive assessment via bedside interviews without the need for blood draws or specialized equipment. Among six models tested, logistic regression demonstrated the best performance (AUC = 0.947). This finding aligns with the principle that for clinical classification tasks with high-quality, focused variables, simpler models often achieve a better balance between sensitivity and specificity.25 SHAP analysis further enhanced the transparency of the model by quantifying the individual contribution of each feature to the identification likelihood.
The eight indicators identified in this study span demographic, behavioral, clinical, and psychosocial domains, aligning with the multifactorial nature of CF. Advancing age remains one of the most consistent risk factors, reflecting the parallel decline in cognitive and physical function.29 Behavioral factors, including higher frequency of cognitive and physical activity, were associated with a lower likelihood of CF, likely due to their beneficial effects on neuroplasticity, inflammation, and social engagement.30 From a clinical perspective, the presence of diabetes complications indicates a multisystem burden that accelerates cognitive deterioration.31 Malnutrition and depressive symptoms have also been widely reported as independent contributors to cognitive impairment.32,33 Notably, consistent with substantial clinical evidence, insomnia symptoms emerged as a critical indicator of CF. Emerging research demonstrates that poor sleep quality is not merely a common comorbid symptom of T2DM but a potent driver of multi-system functional decline.34 Mechanistically, sleep disruption has been shown to impair hippocampal neuroplasticity and synaptic integrity, leading to significant deficits in memory and executive function.35 Simultaneously, chronic sleep loss promotes a pro-inflammatory state and inhibits muscle protein synthesis, which accelerates the development of sarcopenia and increases the risk of falls. In patients with T2DM, chronic sleep fragmentation may exacerbate neuro-inflammatory processes and oxidative stress, thereby driving the concurrent progression of physical frailty and cognitive impairment.36 Furthermore, this study incorporated perceived social support as a critical indicator, expanding the scope of modeling beyond traditional biomedical factors. While the relationship between social support and cognitive decline is well-documented in observational studies, its integration into structured classification models for CF remains limited, particularly in machine learning.37,38 By including the Perceived Social Support Scale (PSSS) as a quantitative input, our findings highlight its value in identifying high-risk individuals and support the incorporation of psychosocial dimensions into clinical identification frameworks, thereby broadening both the theoretical and applied boundaries of CF modeling.
Compared with previous assessment tools for CF in older patients with T2DM, our model demonstrates higher precision and broader clinical utility. Studies by Deng et al and Yu & Yu developed nomograms with AUC values between 0.821 and 0.866.6,39 In contrast, our optimal model achieved a significantly higher AUC of 0.947. This improvement stems from a more comprehensive evaluation: unlike earlier models that prioritized biochemical indicators such as albumin or glycosylated hemoglobin, we incorporated often-overlooked psychosocial and behavioral factors, including perceived social support and insomnia symptoms. Additionally, whereas traditional nomograms use a fixed scoring system based on group averages, the SHAP analysis in our study identifies the specific impact of each factor for each individual patient. This makes our tool not just a classification instrument, but a practical guide for clinicians to prioritize personalized care where it is needed most.
Given the multi-dimensional nature of these data, it is imperative to align our methodology with standardized evaluation frameworks, such as the V3 framework (Verification, analytical Validation, and clinical Validation), to ensure that these AI-driven insights remain reliable and safe for geriatric care.40 This rigorous approach is essential for transitioning from “black-box” algorithms to evidence-based clinical decision-making, where the identification of these indicators serves as a direct roadmap for actionable treatment. Rather than relying on generalized management, our model enables clinicians to address the specific drivers of cognitive frailty through targeted rehabilitation and biomechanical optimization. For instance, when the model identifies a combination of low physical activity and malnutrition, it prompts the implementation of individualized resistance training—including eccentric or traditional protocols—specifically designed to enhance muscle power and functional performance in older adults. Simultaneously, the tool identifies non-physical indicators such as insomnia symptoms and low social support, facilitating a more comprehensive scope of care. Addressing sleep quality concurrently restores both cognitive and physical domains, while strengthening a patient’s psychosocial networks can mitigate emotional and psychological stressors that exacerbate frailty. By targeting these specific clusters of indicators, our tool enables a shift toward precision geriatric care, effectively identifying and reversing cognitive frailty before it progresses to irreversible disability. Ultimately, integrating this identification tool into chronic care systems will support earlier classification and long-term functional preservation in older adults with T2DM.
In summary, our single-center study developed a parsimonious classification model using eight readily obtainable clinical indicators to identify cognitive frailty in older inpatients with T2DM. The model demonstrated strong internal validity, achieving a testing-set AUC of 0.947 with good calibration. We recognize that several aspects of our study design require careful consideration when interpreting the results. Primarily, due to the single-center, cross-sectional design and the focus on hospitalized patients, the model cannot be used for prospective prediction or generalized to community-dwelling older adults. Furthermore, some indicators relied on self-reported data, which may introduce inherent recall bias. Consequently, future research should prioritize longitudinal validation across diverse populations to further assess the model’s robustness and its long-term impact on clinical outcomes.
Conclusion
This study developed and internally validated a logistic regression-based classification model to identify cognitive frailty among hospitalized older adults with T2DM. Grounded in a health-ecological framework, the model incorporates eight routinely accessible variables and demonstrates high discriminatory power (AUC = 0.947). SHAP analysis further enhances model transparency by clarifying each variable’s contribution to the classification outcome. This tool offers a practical and explainable solution for the early identification of concurrent cognitive frailty, facilitating timely clinical decision-making and the implementation of targeted interventions in geriatric diabetic care.
Data Sharing Statement
The datasets generated and/or analyzed during the current study are available from the corresponding author upon reasonable request.
Ethics Approval and Consent to Participate
The study was approved by the Ethics Committee of the Affiliated Hospital of North Sichuan Medical College (Approval No. 2023ER432-1). All procedures complied with the ethical standards of the Declaration of Helsinki. All participants or their legal representatives provided written informed consent prior to enrollment.
Funding
This study was supported by the Chengdu Municipal Health and Family Planning Commission (Grant No. 2025306) and the Sichuan Nursing Association (Grant No. H22027).
Disclosure
The authors declare that they have no conflicts of interest related to this study.
References
1. Kelaiditi E, Cesari M, Canevelli M, et al. Cognitive frailty: rational and definition from an (I.A.N.A./I.A.G.G.) international consensus group. J Nutr Health Aging. 2013;17(9):726–16. doi:10.1007/s12603-013-0367-2
2. Bu Z, Huang A, Xue M, Li Q, Bai Y, Xu G. Cognitive frailty as a predictor of adverse outcomes among older adults: a systematic review and meta-analysis. Brain Behav. 2021;11(1):e01926. doi:10.1002/brb3.1926
3. Biessels GJ, Strachan MWJ, Visseren FLJ, Kappelle LJ, Whitmer RA. Dementia and cognitive decline in type 2 diabetes and pre-diabetic stages: towards targeted interventions. Lancet Diabetes Endocrinol. 2014;2(3):246–255. doi:10.1016/S2213-8587(13)70088-3
4. Jang HC. Sarcopenia, frailty, and diabetes in older adults. Diabetes Metab J. 2016;40(3):182–189. doi:10.4093/dmj.2016.40.3.182
5. Chaabene H, Müller P, Dhahbi W, et al. The effects of eccentric versus traditional resistance training on muscle strength, power, hypertrophy, and functional performance in older adults: a systematic review with multilevel meta-analysis of randomized controlled trials. Ageing Res Rev. 2025;102933. doi:10.1016/j.arr.2024.102933
6. Yu Q, Yu H. Development and validation of a risk prediction model for cognitive frailty in elderly patients with type 2 diabetes mellitus. J Clin Nurs. 2025;34(8):3261–3275. doi:10.1111/jocn.17508
7. McLeroy KR, Bibeau D, Steckler A, et al. An ecological perspective on health promotion programs. Health Educ Behav. 1988;15(4):351–377. doi:10.1177/109019818801500401
8. Vaezghasemi M, Vogt T, Lindkvist M, et al. Multifaceted determinants of social-emotional problems in preschool children in Sweden: an ecological systems theory approach. SSM Popul Health. 2023;21:101345. doi:10.1016/j.ssmph.2023.101345
9. Riley RD, Snell KI, Ensor J, et al. Minimum sample size for developing a multivariable prediction model: part II — binary and time-to-event outcomes. Stat Med. 2019;38(7):1276–1296. doi:10.1002/sim.7992
10. Panza F, D’Introno A, Colacicco AM, et al. Cognitive frailty: predementia syndrome and vascular risk factors. Neurobiol Aging. 2006;27(7):933–940. doi:10.1016/j.neurobiolaging.2005.05.012
11. Ni XS, Wu F, Song J, et al. Chinese expert consensus on cognitive impairment assessment in older adults (2022). Zhonghua Yi Xue Za Zhi. 2022;102(36):2845–2850. doi:10.3760/cma.j.cn112137-20220829-00671
12. Fried LP, Tangen CM, Walston J, et al. Frailty in older adults: evidence for a phenotype. J Gerontol A Biol Sci Med Sci. 2001;56(3):M146–M156. doi:10.1093/gerona/56.3.M146
13. Nasreddine ZS, Phillips NA, Bédirian V, et al. The Montreal Cognitive Assessment, MoCA: a brief screening tool for mild cognitive impairment. J Am Geriatr Soc. 2005;53(4):695–699. doi:10.1111/j.1532-5415.2005.53221.x
14. Hughes CP, Berg L, Danziger WL, et al. A new clinical scale for the staging of dementia. Br J Psychiatry. 1982;140(6):566–572. doi:10.1192/bjp.140.6.566
15. Chronic Disease Prevention and Control Branch of Chinese Preventive Medicine Association. Good health management practice for chronic diseases (T/CHAA 007-2019). Chin J Prev Med. 2020;54(1):41–44. doi:10.3760/cma.j.issn.0253-9624.2020.01.009
16. Chinese Preventive Medicine Association. Chinese guideline on healthy lifestyle to prevent cardiometabolic diseases. Chin J Epidemiol. 2020;41(11):1719–1733. doi:10.3760/cma.j.cn112338-20200923-01193
17. National Center of Gerontology, Chinese Diabetes Society, China Sport Science Society. Guideline for exercise therapy of type 2 diabetes mellitus in China (2024 Edition). Chin J Sports Med. 2024;43(6):419–452.
18. Zhou QX, Zhou JR, Ku M, et al. Analysis of the status and influencing factors of cognitive frailty among the elderly in nursing homes. J Nurs Sci. 2020;35(9):88–92. doi:10.3870/j.issn.1001-4152.2020.09.088
19. Soldatos CR, Dikeos DG, Paparrigopoulos TJ. Athens Insomnia Scale: validation of an instrument based on ICD-10 criteria. J Psychosom Res. 2000;48(6):555–560. doi:10.1016/s0022-3999(00)00095-7
20. Dahlem NW, Zimet GD, Walker RR. The multidimensional scale of perceived social support: a confirmation study. J Clin Psychol. 1991;47(6):756–761.
21. Sheikh JI, Yesavage JA. Geriatric Depression Scale (GDS): recent evidence and development of a shorter version. Clin Gerontol. 1986;5(1–2):165–173. doi:10.1300/J018v05n01_09
22. Rubenstein LZ, Harker JO, Salva A, et al. Screening for undernutrition in geriatric practice: developing the short-form Mini-Nutritional Assessment (MNA-SF). J Gerontol a Biol Sci Med Sci. 2001;56(6):M366–M372. doi:10.1093/gerona/56.6.m366
23. Chinese Society of Geriatric Endocrinology and Metabolism, Chinese Geriatrics Society, Chinese Geriatric Health Care Medicine Society, et al. Chinese clinical guideline for the prevention and treatment of type 2 diabetes mellitus in the elderly (2022 edition). Chin J Intern Med. 2022;61(1):12–50. doi:10.3760/cma.j.cn112138-20211110-00814
24. Chinese Diabetes Society. Chinese guideline for the prevention and treatment of type 2 diabetes mellitus (2020 edition). Chin J Endocrinol Metab. 2021;37(4):311–398. doi:10.3760/cma.j.cn421209-20200915-00687
25. Fridgeirsson E, Khoshdel-Rad N, Liu X, et al. Comparative evaluation of regularization techniques for clinical prediction modeling in high-dimensional health data. J Am Med Inform Assoc. 2024;31(8):1573–1584. doi:10.1093/jamia/ocae125
26. Pudjihartono N, Fadason T, Kempa-Liehr AW, O’Sullivan JM. A review of feature selection methods for machine learning-based disease risk prediction. Front Bioinform. 2022;2:927312. doi:10.3389/fbinf.2022.927312
27. Thein FS, Li Y, Nyunt MSZ, Gao Q, Wee SL, Ng TP. Physical frailty and cognitive impairment is associated with diabetes and adversely impact functional status and mortality. Postgrad Med. 2018;130(6):561–567. doi:10.1080/00325481.2018.1491779
28. Fowler NR, Partrick KA, Taylor J, et al. Implementing early detection of cognitive impairment in primary care to improve care for older adults. J Intern Med. 2025;298(1):31–45. doi:10.1111/joim.20098
29. Park C, Kim N, Won CW, Kim M. Predicting cognitive frailty in community-dwelling older adults: a machine learning approach based on multidomain risk factors. Sci Rep. 2025;15(1):18369. doi:10.1038/s41598-025-00844-3
30. Kirk-Sanchez NJ, McGough EL. Physical exercise and cognitive performance in the elderly: current perspectives. Curr Alzheimer Res. 2014;11(8):861–872. doi:10.2174/1567205011666140617110022
31. Mogi M, Horiuchi M. Neurovascular coupling in cognitive impairment associated with diabetes mellitus. Circ J. 2011;75(5):1042–1048. doi:10.1253/circj.CJ-11-0287
32. Lee H, Lee E, Jang IY. Malnutrition and cognitive function in older adults: a systematic review and meta-analysis. Clin Nutr. 2021;40(5):2707–2716. doi:10.1016/j.clnu.2020.11.034
33. Ruan Q, Yu Z, Chen M, et al. Cognitive frailty and the risk of dementia and death in older adults: a meta-analysis of longitudinal studies. J Nutr Health Aging. 2015;19(6):660–666. doi:10.1007/s12603-015-0506-2
34. Wang J, Lee SY, Chu G, et al. Sleep disorders predict frailty progression in type 2 diabetes mellitus: findings from a cohort of 20,562 patients. Diabetes Metab J. 2026;50(1):199–202. doi:10.4093/dmj.2025.0905
35. Yaffe K, Falvey CM, Hoang T. Connections between sleep and cognition in older adults. JAMA Neurol. 2014;71(12):1549–1555. doi:10.1001/jamaneurol.2014.2259
36. Drăgoi CM, Dumitrescu IB, Nicolae AC, et al. Rhythms of life: melatonin, nutrition, sleep, and antioxidant strategies for healthy aging. Front Neurosci. 2026;20:1736978. doi:10.3389/fnins.2026.1736978
37. Gao L, Zhang D, Li Y, et al. Social support and risk of cognitive frailty in community-dwelling elderly: a longitudinal study. Int J Geriatr Psychiatry. 2022;37(1). doi:10.1002/gps.5649
38. Xu L, Chen Y, Liu T, et al. A review of cognitive frailty prediction models: gaps in psychosocial integration. Aging Mental Health. 2023;27(6):1111–1119. doi:10.1080/13607863.2022.2065163
39. Deng Y, Li N, Wang Y, et al. Risk factors and prediction nomogram of cognitive frailty with diabetes in the elderly. Diabetes Metab Syndr Obes. 2023;16:3175–3185. doi:10.2147/DMSO.S433100
40. Dhahbi W, Chamari K. The algorithmic athlete: a call to standardize assessment of sensor technologies and artificial intelligence. Int J Sports Physiol Perform. 2026;1:1–2. doi:10.1123/ijspp.2025-0500
 © 2026 The Author(s). This work is published and licensed by Dove Medical Press Limited. The
full terms of this license are available at https://www.dovepress.com/terms
and incorporate the Creative Commons Attribution
- Non Commercial (unported, 4.0) License.
By accessing the work you hereby accept the Terms. Non-commercial uses of the work are permitted
without any further permission from Dove Medical Press Limited, provided the work is properly
attributed. For permission for commercial use of this work, please see paragraphs 4.2 and 5 of our Terms.
© 2026 The Author(s). This work is published and licensed by Dove Medical Press Limited. The
full terms of this license are available at https://www.dovepress.com/terms
and incorporate the Creative Commons Attribution
- Non Commercial (unported, 4.0) License.
By accessing the work you hereby accept the Terms. Non-commercial uses of the work are permitted
without any further permission from Dove Medical Press Limited, provided the work is properly
attributed. For permission for commercial use of this work, please see paragraphs 4.2 and 5 of our Terms.
Recommended articles
Development of Machine Learning Models for Predicting Osteoporosis in Patients with Type 2 Diabetes Mellitus—A Preliminary Study
Wu X, Zhai F, Chang A, Wei J, Guo Y, Zhang J
Diabetes, Metabolic Syndrome and Obesity 2023, 16:1987-2003
Published Date: 30 June 2023
Prediction of the Risk of Bone Mineral Density Decrease in Type 2 Diabetes Mellitus Patients Based on Traditional Multivariate Logistic Regression and Machine Learning: A Preliminary Study
Zhang J, Xu Z, Fu Y, Chen L
Diabetes, Metabolic Syndrome and Obesity 2023, 16:2885-2898
Published Date: 19 September 2023
Application of Interpretable Machine Learning Models Based on Ultrasonic Radiomics for Predicting the Risk of Fibrosis Progression in Diabetic Patients with Nonalcoholic Fatty Liver Disease
Meng F, Wu Q, Zhang W, Hou S
Diabetes, Metabolic Syndrome and Obesity 2023, 16:3901-3913
Published Date: 2 December 2023
Risk Factors for Gout in Taiwan Biobank: A Machine Learning Approach
Liu YR, Nfor ON, Zhong JH, Lin CY, Liaw YP
Journal of Inflammation Research 2024, 17:9847-9856
Published Date: 26 November 2024
Construction and Validation of a Machine Learning-Based Risk Prediction Model for Sleep Quality in Patients with OSA
Tong Y, Wen K, Li E, Ai F, Tang P, Wen H, Guo B
Nature and Science of Sleep 2025, 17:1271-1289
Published Date: 12 June 2025