Back to Journals » Diabetes, Metabolic Syndrome and Obesity » Volume 16
Development and External Validation of Nomogram to Identify Risk Factors for CHD in T2DM in the Population of Northwestern China
Authors Meng Q ![]() , Yang J, Wang F, Li C, Sang G, Liu H, Shen D, Zhang J, Jiang S, Yusufu A, Du G
, Yang J, Wang F, Li C, Sang G, Liu H, Shen D, Zhang J, Jiang S, Yusufu A, Du G
Received 13 January 2023
Accepted for publication 30 April 2023
Published 4 May 2023 Volume 2023:16 Pages 1271—1282
DOI https://doi.org/10.2147/DMSO.S404683
Checked for plagiarism Yes
Review by Single anonymous peer review
Peer reviewer comments 2
Editor who approved publication: Prof. Dr. Muthuswamy Balasubramanyam
Qi Meng,1,2,* Jing Yang,1,2 Fei Wang,1,2 Cheng Li,3 Guoyao Sang,4 Hua Liu,1,2 Di Shen,1,2 Jinxia Zhang,1,2 Sheng Jiang,1,2,* Aibibai Yusufu,1,2,* Guoli Du1,2,*
1State Key Laboratory of Pathogenesis, Prevention and Treatment of High Incidence Diseases in Central Asia, Urumqi, People’s Republic of China; 2Department of Endocrinology, The First Affiliated Hospital of Xinjiang Medical University, Urumqi, People’s Republic of China; 3Laboratory Medicine Diagnostic Center, The First Affiliated Hospital of Xinjiang Medical University, Urumqi, People’s Republic of China; 4Data Statistics and Analysis Center of Operation Management Department, The First Affiliated Hospital of Xinjiang Medical University, Urumqi, People’s Republic of China
*These authors contributed equally to this work
Correspondence: Guoli Du; Aibibai Yusufu, Department of Endocrinology, The First Affiliated Hospital of Xinjiang Medical University, Urumqi, 830000, People’s Republic of China, Email [email protected]; [email protected]
Purpose: Cardiovascular disease is the leading cause of mortality in patients with type 2 diabetes mellitus (T2DM). This study aimed to develop and validate a nomogram for predicting the risk factors for coronary heart disease (CHD) in T2DM in the population of northwestern China.
Patients and Methods: The records of 2357 T2DM patients who were treated in the First Affiliated Hospital of Xinjiang Medical University from July 2021 to July 2022 were reviewed. After some data (n =239) were excluded, 2118 participants were included in the study and randomly divided into a training set (n =1483) and a validation set (n = 635) at a ratio of 3:1. Univariate and stepwise regression analysis was performed to screen risk factors and develop predictive models. The results of logistic regression are presented through a nomogram. The C-index, receiver operating characteristic (ROC) curve, calibration plot, and decision curve analysis (DCA) were employed to verify the distinction, calibration, and clinical practicality of the model.
Results: The stepwise logistic regression analysis suggested that independent factors in patients with T2DM combined with CHD were age, gender, hypertension (HTN), glycated hemoglobin (HbA1c), high density lipoprotein cholesterol (HDL-C), low density lipoprotein cholesterol (LDL-C), and Uygur, which were associated with the occurrence of CHD. The nomogram demonstrated good discrimination with a C-index of 0.771 (95% CI, 0.741, 0.800) in the training set and 0.785 (95% CI, 0.743, 0.828) in the validation set. The area under curve (AUC) of the ROC curves were 0.771 (95% CI, 0.741, 0.800) and 0.785 (95% CI, 0.743, 0.828) in the training and validation sets, respectively. The nomogram was well-calibrated. The DCA revealed that the nomogram was clinically valuable.
Conclusion: A nomogram based on 7 clinical characteristics was developed to predict CHD in patients with T2DM.
Keywords: nomogram, coronary heart disease, type 2 diabetes mellitus, ethnicity, risk factor
Introduction
The diabetes prevalence in 2019 is estimated to be 9.3% (463 million people) around the world, rising to 10.2% (578 million) and 10.9% (700 million) by 2030 and 2045, respectively.1 The prevalence of type 2 diabetes mellitus (T2DM) has been steadily increasing with time. Most patients with T2DM have at least one complication, and cardiovascular complications are the leading cause of morbidity and mortality in these patients.2
In China, the prevalence of coronary heart disease (CHD) has been continuously growing since 2006 and there are about 11 million CHD patients.3 Cardiovascular disease is the leading cause of morbidity and mortality in diabetes mellitus.4 The overall prevalence of CHD is 21.2% in one systematic review of 4,549,481 persons with T2DM.4 The conventional risk factors for CHD comprise dyslipidemia, hypertension (HTN), cigarette smoking, diabetes, vascular disease, menopausal status (women only), and age.5 Straka et al reported that patients with T2DM had a 10% greater risk of CHD, 53% of myocardial infarction, 58% of stroke, and a 112% increased risk of heart failure.6 T2DM is one of the critical risk factors for CHD, and diabetic patients have twice the risk of developing cardiovascular disease as non-diabetic patients.7 Early and progressive pathophysiological defects, involving changes in microvascular function and microangiopathy, are present in patients with T2DM before the diagnosis.8 Additionally, early good glycemic control in patients with T2DM combined with CHD can delay and prevent microvascular complications.9 Chronic hyperglycemia contributes to the development and progression of cardiovascular disease and can aggravate atherosclerosis.10 Identification of patients at risk is helpful for the prediction and therapeutic intervention of cardiovascular risk in T2DM.
A nomogram plays a vital role by graphically representing the effect of each predictor on the outcome, providing readers with a more tangible interpretation of each predictor’s impact on the outcome.11
Previous study by Xiao et al did not consider the factor ethnicity.12 In this study, 7 common clinical indicators were adopted to establish the prediction model, and the new nomogram plot can predict CHD risk factors for patients with T2DM in northwestern China. Moreover, some unnecessary clinical examinations can be avoided by using this model.
Materials and Methods
Ethical Approval of the Study Protocol
The study was conducted following the Declaration of Helsinki guidelines. The protocol was approved by the Ethics Committee of the First Affiliated Hospital of Xinjiang Medical University. Written informed consent was obtained from the patient. The ethical approval number of the study is K202301-31.
Subjects
A retrospective study on collected data was conducted by electronic medical record systems from patients treated at the First Affiliated Hospital of Xinjiang Medical University, from July 2021 to July 2022. First, 2357 patients were investigated, and 239 patients were excluded (148 with incomplete data, 33 with the diagnosis of diabetic ketoacidosis, and 58 with the diagnosis of diabetic foot). A total of 2118 patients were enrolled in this study, including 383 patients with CHD The 2118 patients were randomly divided into a training set (n = 1483) including 258 patients with CHD and an external validation set (n = 635) including 125 patients with CHD at a ratio of 7:3 (Figure 1).
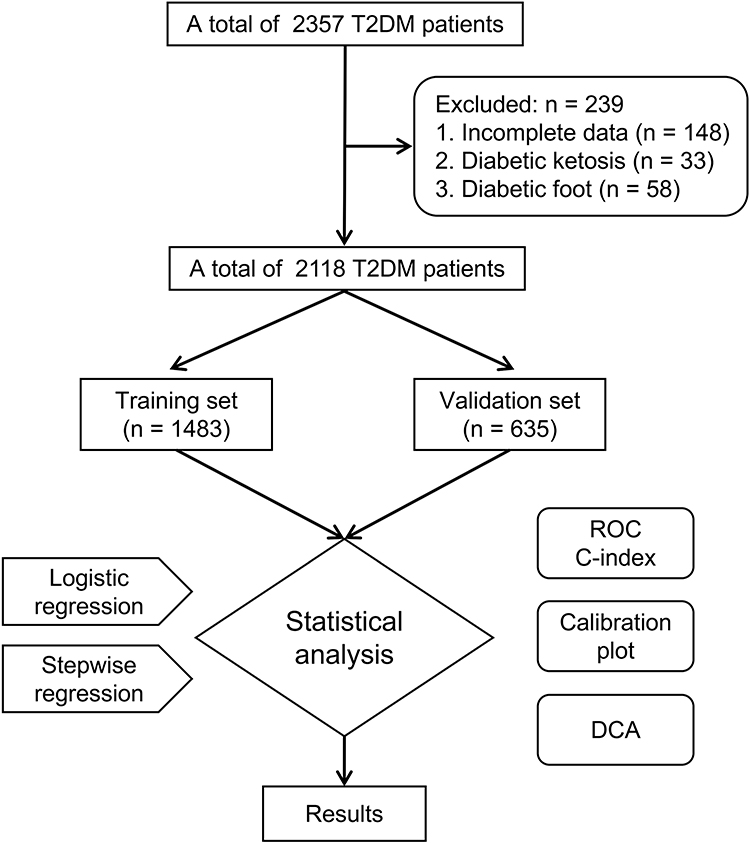 |
Figure 1 Flowchart of patients’ selection. Abbreviations: T2DM, diabetes mellitus type 2; ROC, receiver operating characteristic; DCA, decision curve analysis. |
Data Collection
The electronic medical record was reviewed for the following clinical variables: age, gender, ethnicity, comorbidities, and some biochemical indicators comprising high density lipoprotein cholesterol (HDL-C), low density lipoprotein cholesterol (LDL-C), creatinine (Cre), uric acid (UA), glycated hemoglobin (HbA1c), total bilirubin (TBIL), direct bilirubin (DBIL), indirect bilirubin (IBIL), alanine aminotransferase (ALT), aspartate aminotransferase (AST), and cystatin C (CysC).
Blood samples were collected by venipuncture after an overnight fast. All the laboratories’ biochemical indicators were measured by the Dimension AR/AVL Clinical Chemistry System (Newark, NJ, USA) in the central laboratory on the second day of admission.
Definition
The diagnostic criteria for T2DM were: typical diabetic symptoms (polydipsia, polyuria, polyphagia, and weight loss) or random venous plasma glucose ≥ 11.1 mmol/L (200 mg/dL) or fasting glucose ≥ 7.0 mmol/L (126 mg/dL) in venous plasma or OGTT 2 hours in patients without diabetic symptoms hour glucose ≥ 11.1 mmol/L (200 mg/dL) or HbA1c ≥ 6.5%.13
HTN was defined as the manifestation of systolic blood pressure (SBP) ≥ 140 mmHg or diastolic blood pressure (DBP) ≥ 90 mmHg or HTN controlled with medication. Three seated screening blood pressures (BP) were measured on three different days with a fully automated blood pressure monitor after 15 minutes of rest, and the average BP was calculated.14
The diagnostic criteria for CHD were defined as any of the following: (1) Patients with coronary artery disease (CAD) and “stable” anginal symptoms, and/or dyspneal; (2) Patients with new onset of heart failure or left ventricular dysfunction and suspected CAD; (3) Asymptomatic and symptomatic patients with stabilized symptoms < 1 year after an acute coronary syndrome (ACS), or patients with recent revascularization; (4) Asymptomatic and symptomatic patients > 1 year after initial diagnosis or revascularization; (5) Patients with angina and suspected vasospastic or microvascular disease; (6) Asymptomatic subjects in whom CAD was detected at screening.15
The diagnosis of diabetic ketoacidosis was confirmed when all of the three criteria were present: (1) Either elevated blood glucose levels or a family history of diabetes mellitus; (2) The presence of high urinary or blood ketoacids; (3) A high anion gap metabolic acidosis.16
The diagnosis of diabetic foot was that infection, ulceration, or destruction of tissues of the foot of a person with currently diagnosed T2DM, usually accompanied by neuropathy and/or peripheral artery disease in the lower extremity.17
According to the clinical guidelines for the prevention and treatment of T2DM in the elderly in China (2022 edition), HDL-C (male ≤ 1.0 mmol/L, female ≤ 1.3 mmol/L) and LDL-C (uncombined CHD ≥ 2.6 mmol/L, combined CHD ≥ 1.8 mmol/L) were defined as abnormal, respectively.18
Statistical Methods
The R (version 4.2.1) project was used for statistical analysis. Logistic regression was adopted for multi-factor analysis. The patients were divided into a training set and an external validation set at a ratio of 7:3. Then, univariate and multifactorial logistic regression analyses were performed, and stepwise regression was employed to screen out significant risk factors (P ≤ 0.05) for the establishment of a nomogram prediction model. Characteristics were assessed by dominance ratios (OR) with 95% confidence intervals (CI). Afterward, the corresponding P values were obtained, with statistical significance levels all being bilateral. C-index, receiver operating characteristic (ROC) curves, calibration plots, and decision curve analysis (DCA) were calculated using data from the training and validation sets to test the accuracy of the prediction model.
Results
Baseline Information of the Study Population
A total of 1344 males and 774 females were included in this study. The average age of the patients was 56.00 years (50.00, 64.00), and 383 (18.1%) of patients had CHD. The training group recruited a total of 1483 T2DM patients including 258 patients combined with CHD and the validation group recruited a total of 635 T2DM patients including 125 patients combined with CHD. There were 17.4% and 19.7% of participants with T2DM combined with CHD in the two groups (Table 1). The training and validation groups were comparable in demographic and clinical characteristics (P > 0.05), respectively.
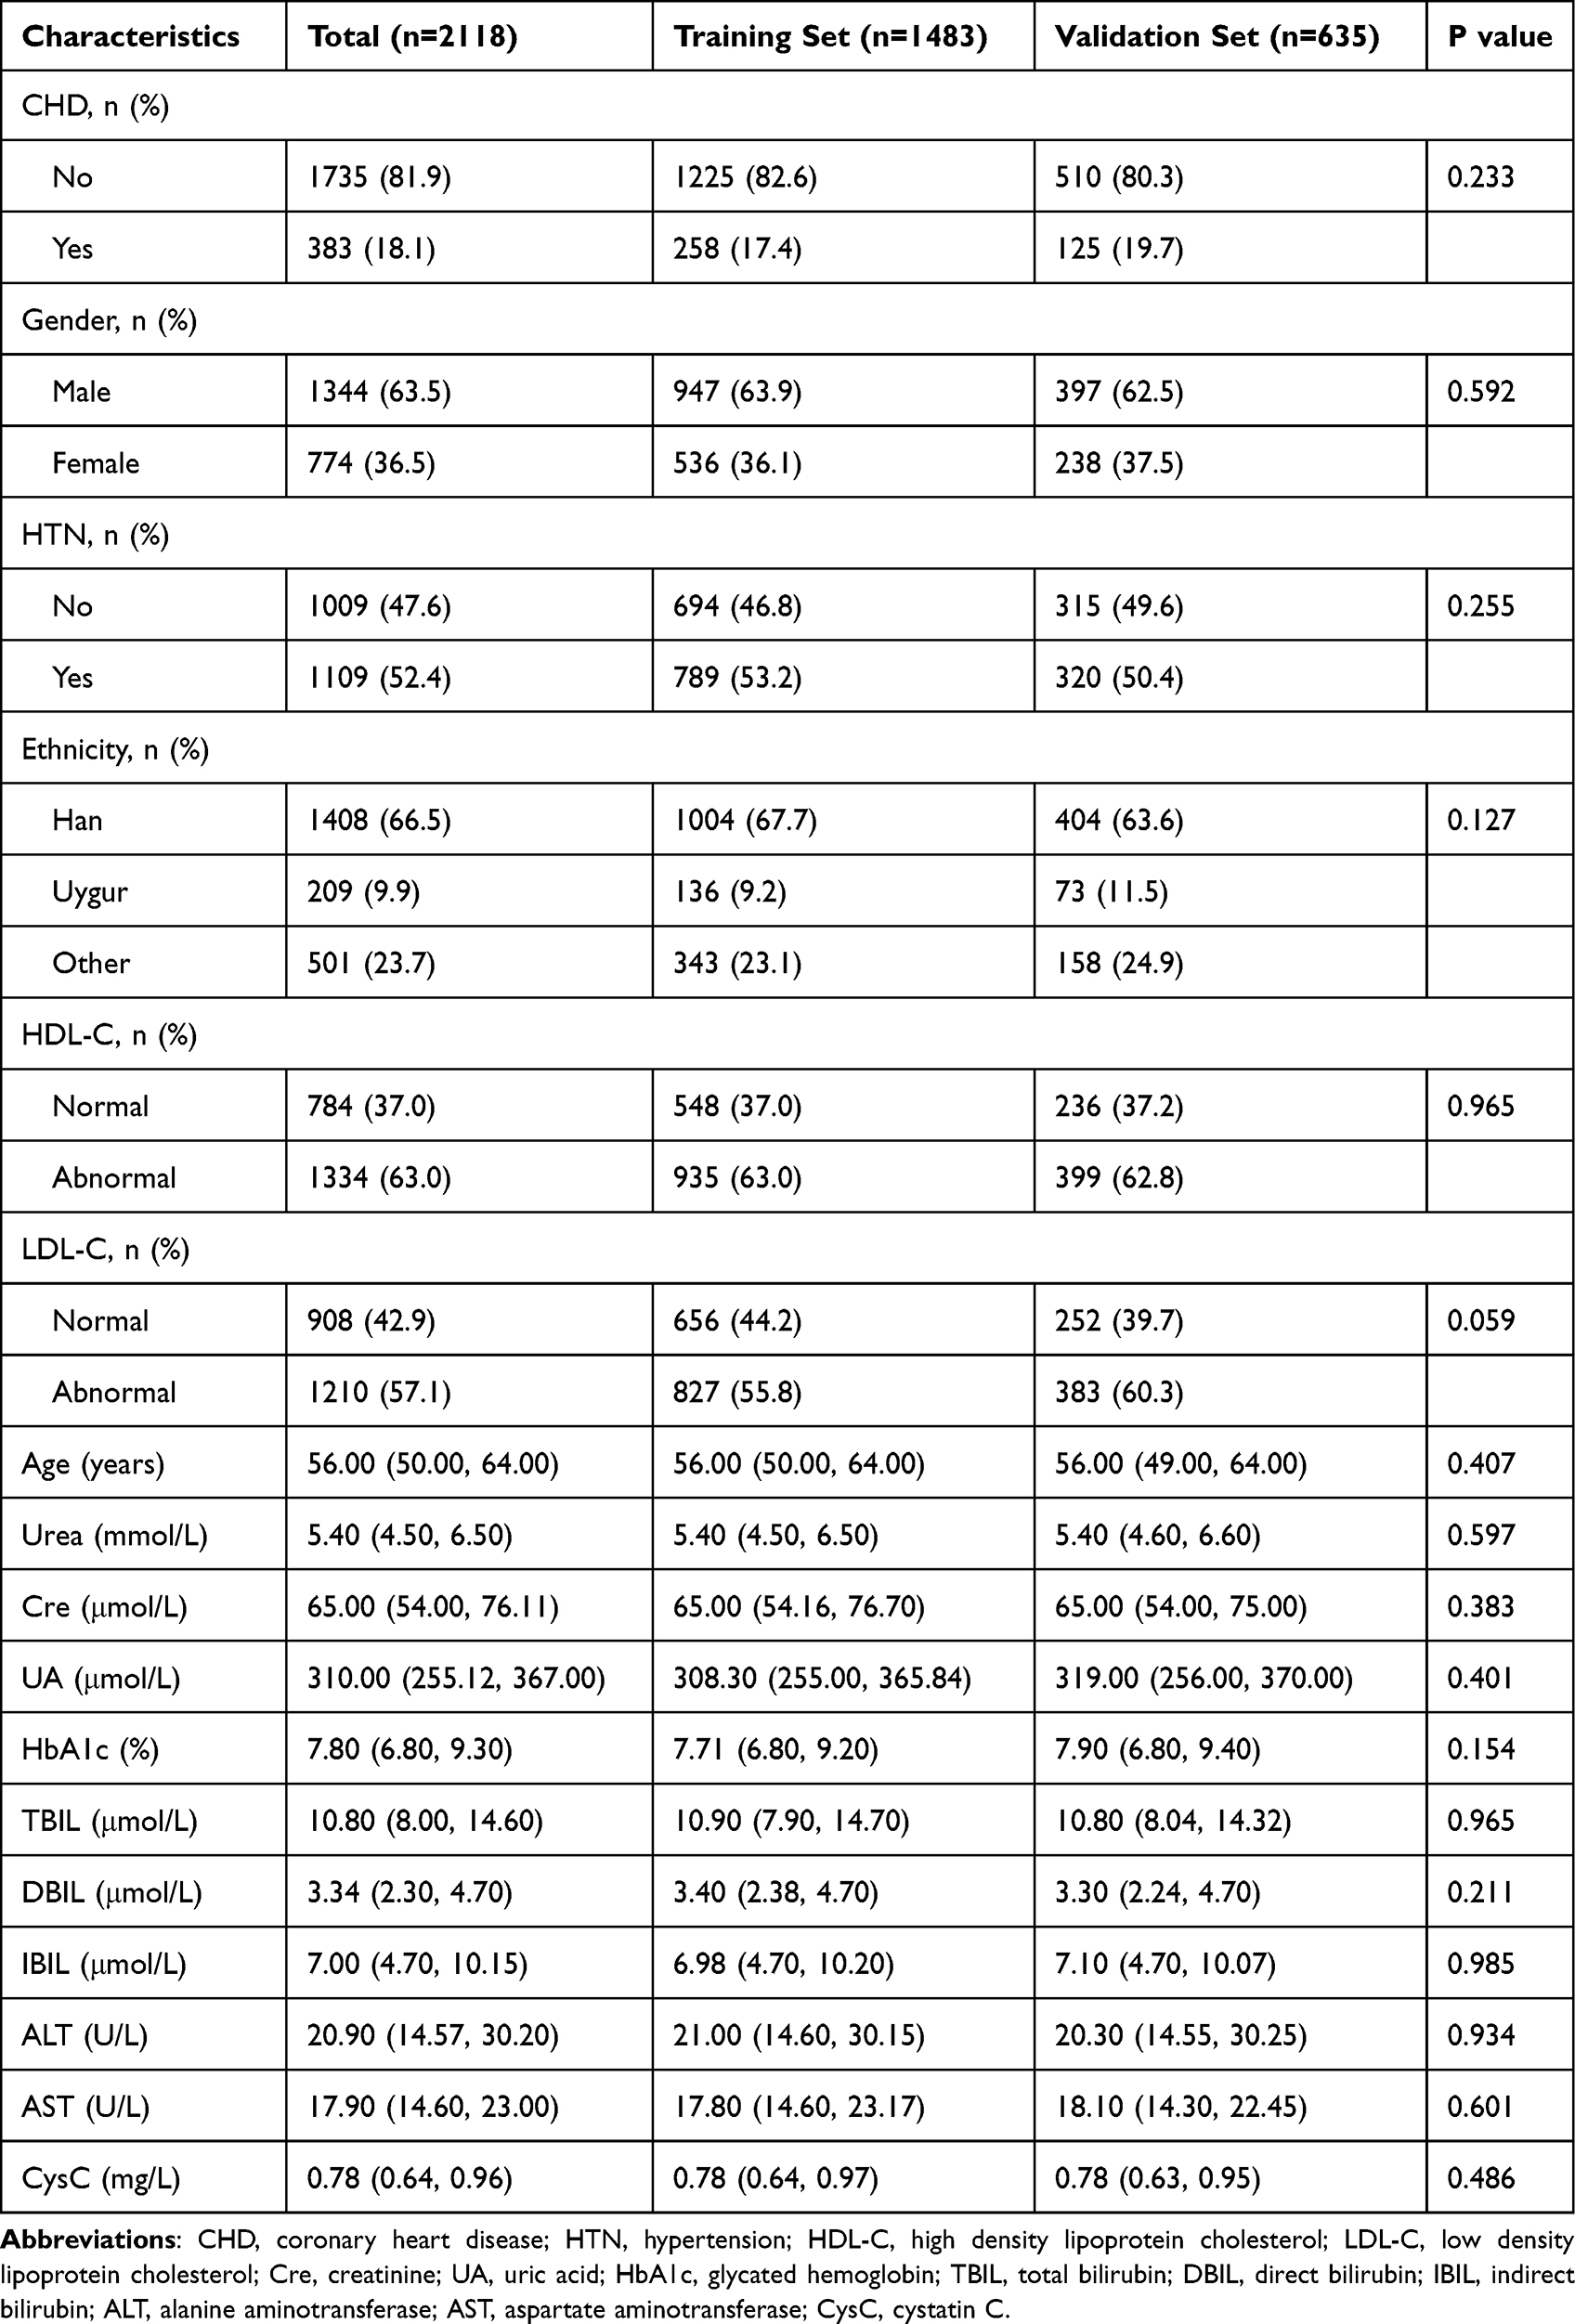 |
Table 1 Baseline Characteristics of Individuals in Training Set and Validation Set |
Characteristics’ Selection
The clinical variables of patients with T2DM combined with CHD were included in univariate and multivariate logistic regression (Table 2). The factors of association screened in the multiple-factor regression analysis were further adopted for the stepwise regression analysis. The stepwise logistic regression analysis suggested that age, female, HTN, HbA1c, LDL-C, HDL-C, and Uygur were independent factors in patients with T2DM combined with CHD and were associated with the occurrence of CHD (P < 0.05) (Table 3).
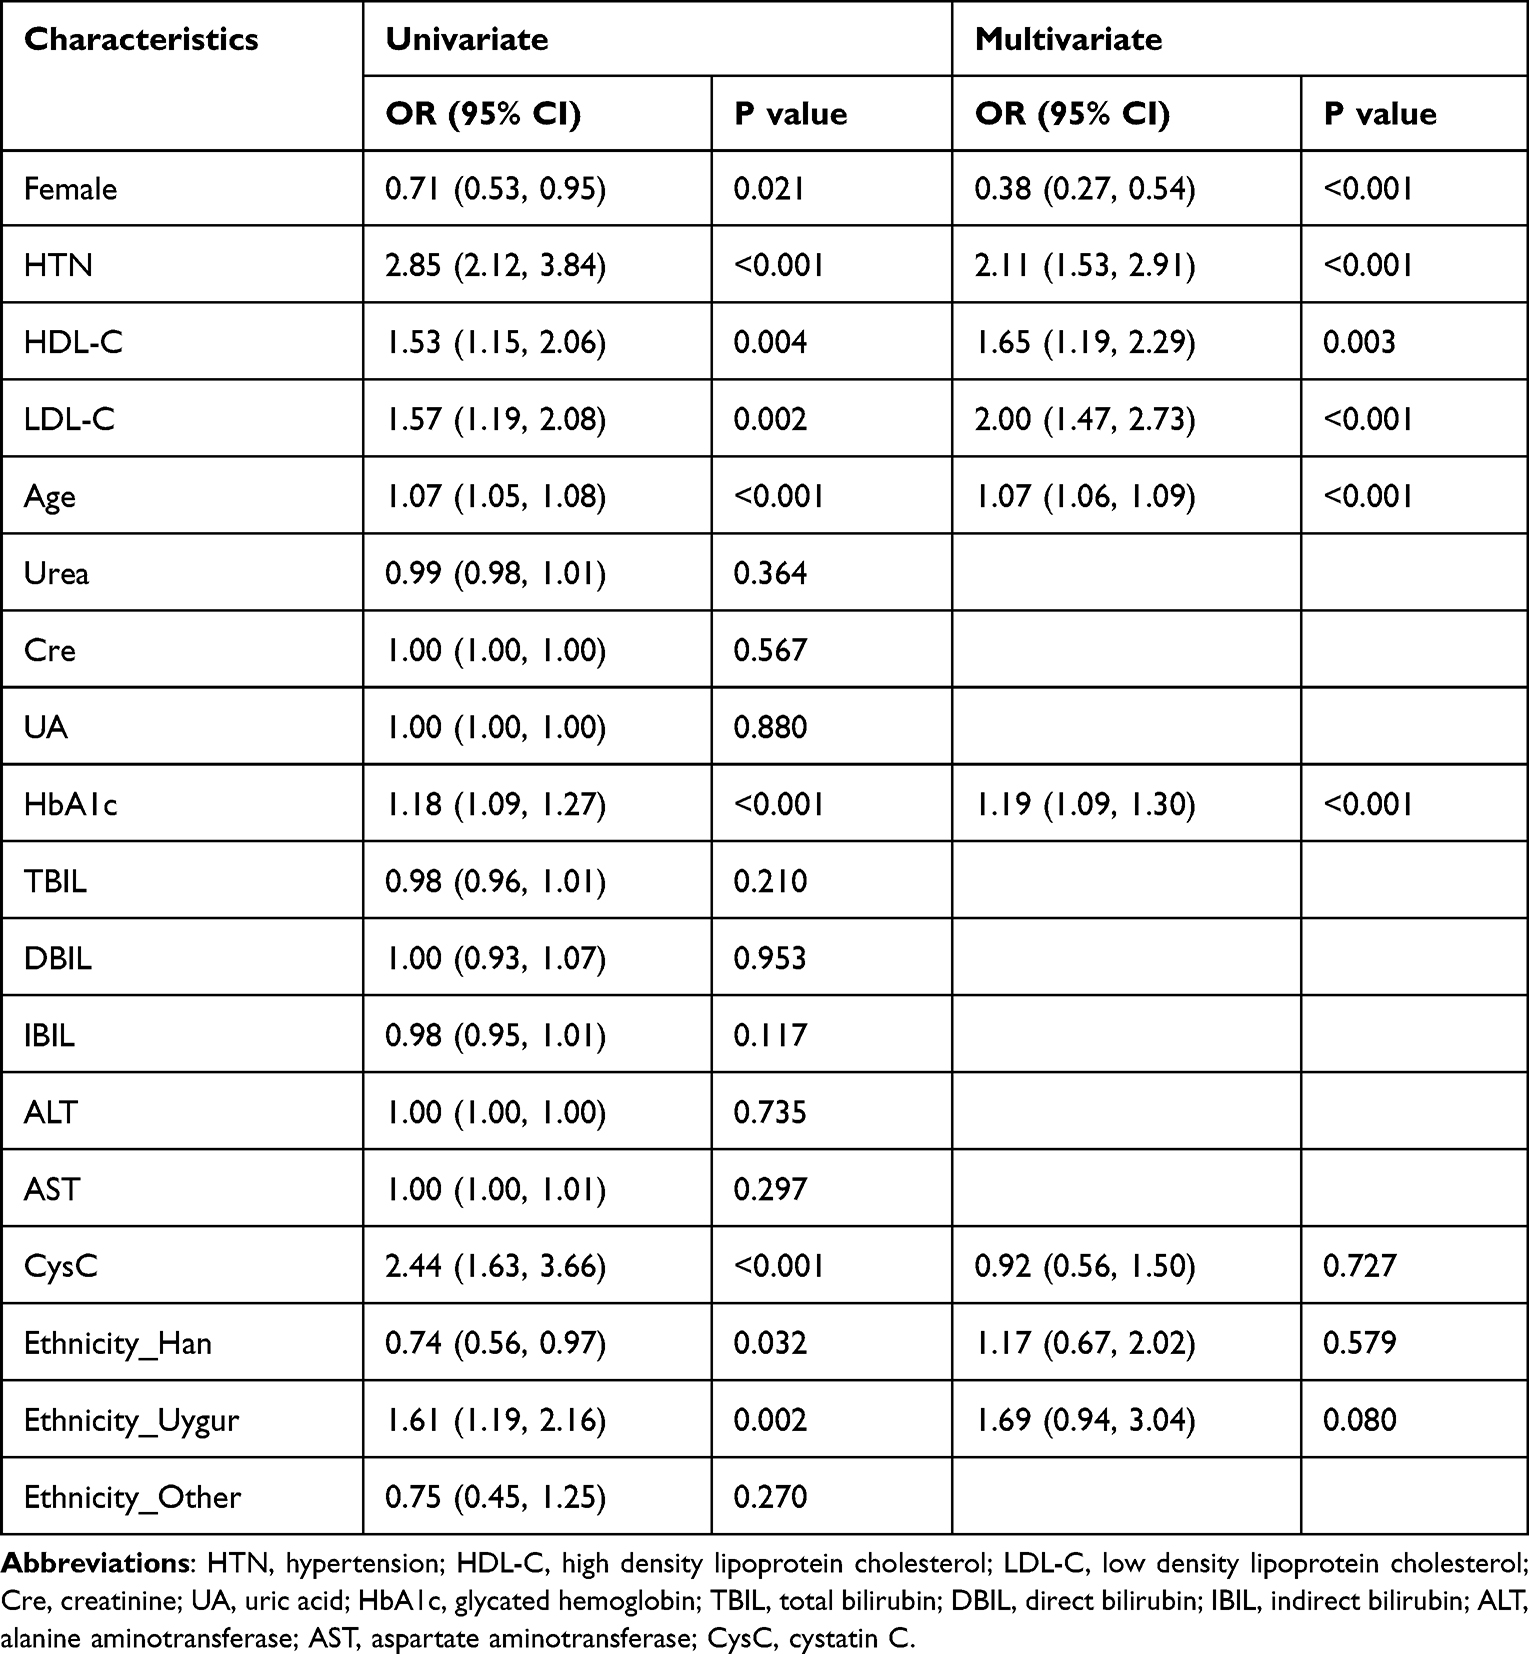 |
Table 2 Univariate and Multivariate Logistic Analyses Among the Patients |
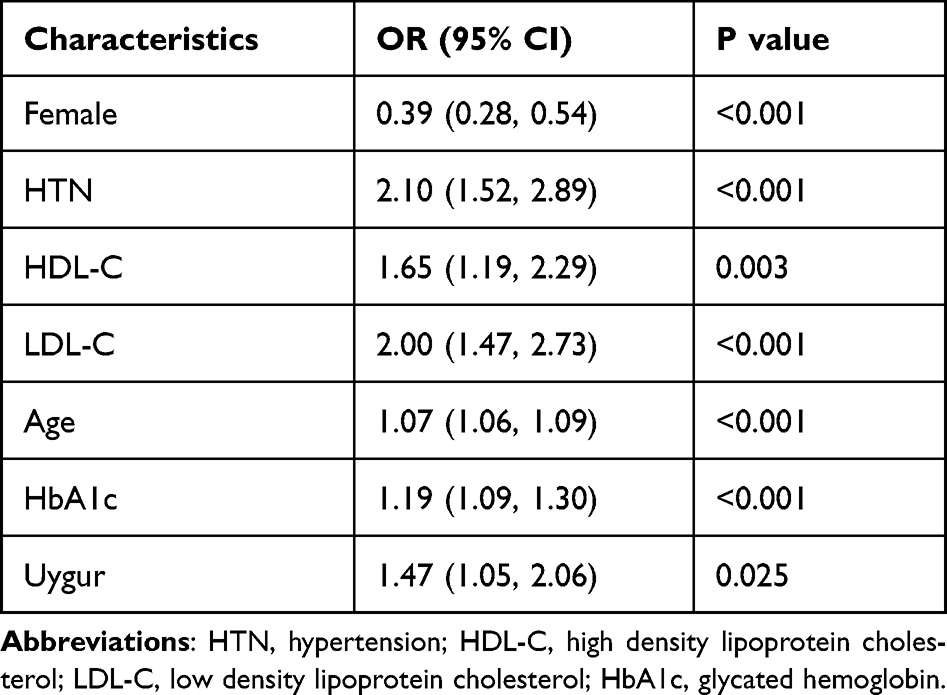 |
Table 3 Stepwise Logistic Regression Analysis to Construct a Nomogram Model |
The Creation of the Nomogram
The nomogram prediction model for CHD risk in patients with T2DM was developed using the risk factors independently (Figure 2). The scores for each factor were obtained following the scale above the nomogram corresponding to each risk factor, and the total score was acquired by summing the individual scores. The probability of predicting CHD was calculated from the total score. This total score ranged from 1 to 160, and the corresponding risk rate ranged from 0.1 to 0.85. A higher total score indicated a greater risk of CHD in patients with T2DM.
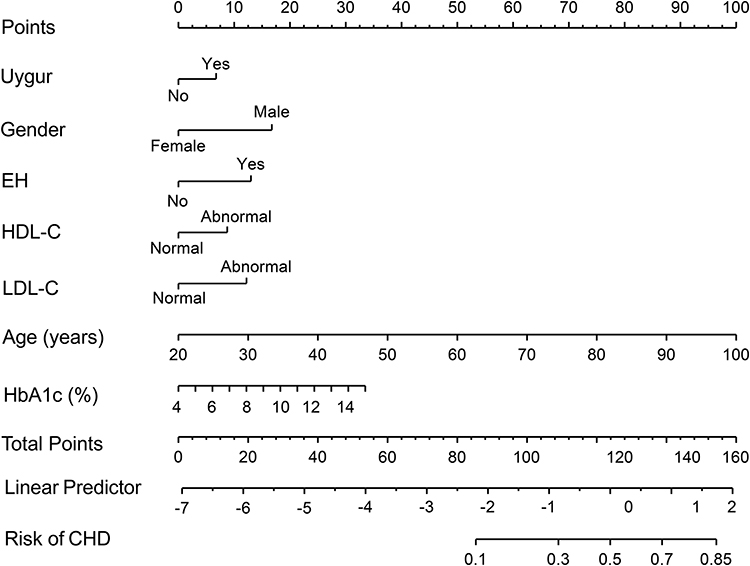 |
Figure 2 Nomogram for predicting the incidence of CHD in T2DM patients. Abbreviations: HTN, hypertension; HDL-C, high density lipoprotein cholesterol; LDL-C, low density lipoprotein cholesterol; HbA1c, glycated hemoglobin. Notes: The points of each feature were added to obtain the total points, and a vertical line was drawn on the total points to obtain the corresponding “risk of CHD”. |
Validation of the Nomogram
The area under curve (AUC) of the ROC curves for this nomogram was 0.771 (95% CI, 0.741, 0.800) (Figure 3A) and 0.785 (95% CI, 0.743, 0.828) (Figure 3B) for the training and validation sets, respectively. The C-index of the training set was 0.771 (95% CI, 0.741, 0.800), reflecting a relatively good discriminative ability. Similarly, the C-index of the validation set was 0.785 (95% CI, 0.743, 0.828), demonstrating satisfactory prediction results (Table 4).
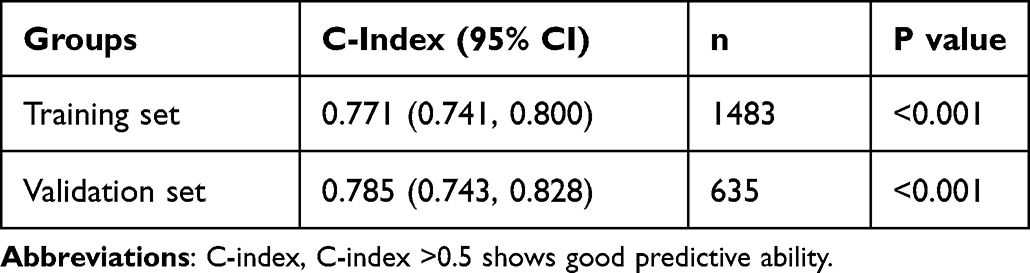 |
Table 4 C-Index in the Array Based on Training Set and Validation Set |
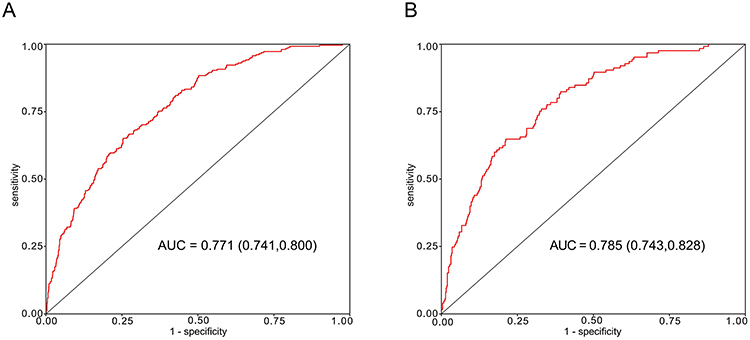 |
Figure 3 Receiver operating characteristic (ROC) curves for the prediction of CHD in the training set and validation set. (A) ROC curve of the nomogram in the training set. (B) ROC curve of the nomogram in the validation set. Abbreviation: AUC, area under the receiver operating characteristic curve. |
In the calibration plots, the red line represents the performance of the nomogram; a closer fit to the diagonal dotted line represents a better prediction. The blue solid line is bias-corrected by bootstrapping, indicating observed nomogram performance. The calibration plots in the training set (Figure 4A) and validation set (Figure 4B) revealed good agreement between the predicted probabilities and the actual observations.
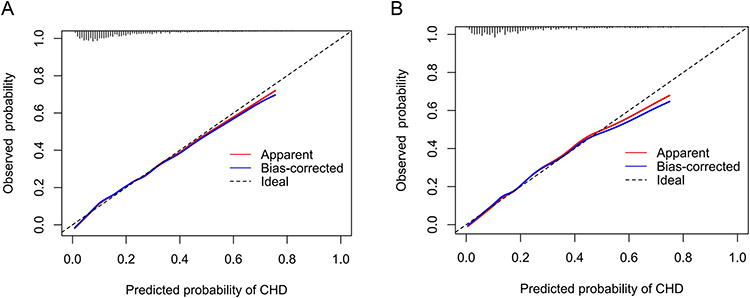 |
Figure 4 Calibration curves for the nomogram. (A) Calibration curve of the nomogram in the training set. (B) Calibration curve of the nomogram in the validation set. Notes: The x-axis represents the predicted incidence risk of CHD. The y-axis represents the actual diagnosed CHD. The diagonal dotted line represents a perfect prediction by an ideal model. The red line represents the performance of the nomogram; a closer fit to the diagonal dotted line represents a better prediction. The blue solid line is bias-corrected by bootstrapping (B = 1000 repetitions), indicating observed nomogram performance. |
As suggested in the DCA, the nomogram was clinically meaningful for predicting the risk of CHD development over a considerable range of threshold probabilities in both training (Figure 5A) and validation (Figure 5B) sets.
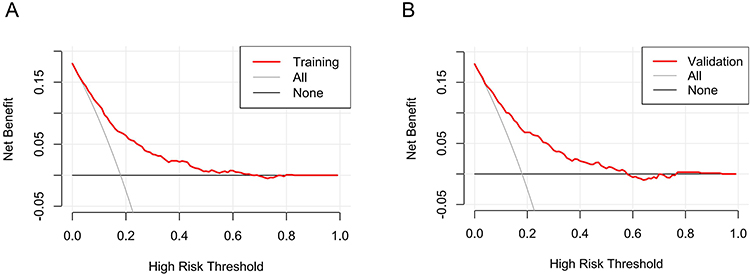 |
Figure 5 Decision curve analysis for the incidence risk nomogram of CHD. (A) Decision curve analysis of the training set. (B) Decision curve analysis of the validation set. Notes: The x-axis represents the predicted incidence risk of CHD. The y-axis indicates the net benefit. The red line represents the incidence risk nomogram of CHD. The thin solid line represents the assumption that all patients are diagnosed with CHD. The thick solid line represents the assumption that no patients are diagnosed with CHDfig. |
Discussion
The present study was designed to develop and validate a new nomogram for individualized prediction of the probability of CHD in T2DM patients, helpful in predicting and estimating the individualized risk factors of CHD. In this study, logistic regression analysis and stepwise regression analysis were performed on the clinical data of patients with T2DM combined with CHD. The results demonstrated that male, HTN, HDL-C, LDL-C, age, HbA1c, and Uygur were independent risk factors for CHD.
The nomogram model in this study involved the following 7 predictors: male, HTN, HDL-C, LDL-C, age, HbA1c, and Uygur. Based on the nomogram prediction model, ROC curves were generated, and AUC values of the training and validation sets were obtained to be 0.771 (95% CI, 0.741, 0.800) and 0.785 (95% CI, 0.743, 0.828), respectively. The C-indexes for the training and validation sets were 0.771 (95% CI, 0.741, 0.800) and 0.785 (95% CI, 0.743, 0.828), respectively, implying that the nomogram model had good discriminative power. The calibration curve revealed that the prediction model and nomogram demonstrated good performance. DCA decision curves suggested that the risk prediction model possessed good predictive power.
Our results were similar to previous studies, with an 18.1% prevalence of CHD in all patients with T2DM.4,19
Our findings suggest that ethnicity is an essential influencing factor for patients with T2DM combined with CHD. Xiao et al developed a nomogram based on nine indicators: gender, T2DM duration, non-high-density lipoprotein cholesterol, apolipoprotein A1, lipoprotein(a), homocysteine, atherogenic index of plasma, nerve conduction velocity, and carotid plaque, to predict the risk of CHD in T2DM patients with medium accuracy.12 Compared with the study by Xiao et al, the present study employed more common clinical indicators and a larger number of patients. And we found that the ethnicity of Uygur had effection the CHD. Besides, we developed a new nomogram based on different populations In Xiao et al study, they did not refer to ethnicity, and our study considered the effect of ethnicity on CHD. Patients with T2DM in Uygur ethnic group have a 1.47-fold higher risk of CHD than patients in other ethnic groups. The prevalence of CHD among Uygur in Xinjiang was 24.2% in 2012, which was much higher than the national average of 7.2%.20 Pursnani et al21 demonstrated that ethnicity was related to an increased risk of CHD and was second only to diabetes as a risk factor for CHD. Fernando et al indicated that a sedentary lifestyle and a western diet with higher fat and saturated fat are imperative factors in increased abdominal obesity and body fat and contribute to the development of CHD.22 The Uygur population consumes much more pasta, meat, and dairy products compared to the Han Chinese population.23 Therefore, the high prevalence of CHD in Uygur may be correlated with their high-fat diet lifestyle.24 Several genetic mutation positions different from other ethnic groups in Uygur have been identified: Egr3 (rs1996147), PON1 (rs662), ABCB1 (rs1045642), NFKB1 (rs28362491), GLUT4 (rs5418).25–28 This may contribute to the higher incidence of CHD in Uygur.
In contrast to the study by Shi et al, gender was included in the model in the present study.19. Our study revealed that male with T2DM had a higher prevalence of CHD. This study suggests that the female gender is a protective factor risk for developing CHD. Male, as a well-known risk factor for coronary atherosclerosis, is used in prediction models for the estimation of the probability of developing CAD.15,29 Compared with males, females have less atherosclerotic/non-atherosclerotic CAD due to the cardioprotective effects of estrogen.30
Our study unveils that age (OR = 1.07, 95% CI 1.06, 1.09) is an essential risk factor for the development of CHD. This population is younger than the study of Shi et al.19 Tyrrell et al uncovered that aging impacted atherosclerosis through multiple complex pathways.31 Alonso-Moran et al discovered that the incidence of cardiovascular disease in patients with T2DM significantly increased with age.32
The occurrence of CHD is generally associated with HTN. In the present study, the results of stepwise regression analysis revealed that HTN was an independent risk factor for patients with T2DM combined with CHD. Patients with HTN had 2.10 times the risk of CHD than those without HTN. The pathophysiological mechanisms underlie that HTN is a risk factor for CHD. Blood pressure could exert physical force on atherosclerotic plate development and cause pulsatile hemodynamics/arterial stiffness and coronary perfusion.33 Ehud reported that HTN can induce atherosclerosis through oxidative stress34 through increasing serum GM-CSF, MCP-1, and proinflammatory cytokine levels.35 Patients who took antihypertensive drugs presented a 16% reduction in the incidence of CAD and an 18% reduction in cardiovascular death.36 Hence, keeping blood pressure within the appropriate range is critical to preventing CHD for curtailing cardiovascular mortality.
This study verifies that HbA1c (OR = 1.19, 95% CI 1.09–1.30) is also a risk factor for CHD in patients with T2DM. Through genetic evidence, Leong et al confirmed a causal relationship between higher HbA1c and a higher risk of CAD.37 HbA1c was independently associated with cardiovascular events in patients of T2DM combined with CHD.38 Yan et al39 validated that HbA1c levels in CHD were positively correlated with the Syntax score. This can be employed to assess the severity and complexity of coronary artery lesions. Liu et al implied that maintaining good HbA1c levels in patients with CHD contributed to a better prognosis.40 Lynn Fillipon et al discovered that long-term glycemic control in patients with diabetes can weaken CHD and its associated complications.41
Our study demonstrated that LDL-C was a crucial independent risk factor for patients with T2DM combined with CHD. Patients with abnormal LDL-C had a 2 times higher risk of CHD than those with normal LDL-C. Additionally, LDL-C is a major driver of atherosclerosis formation. The atherogenic effect of LDL-C in arterial tissue has multiple sources, such as macrophage-derived foam cell formation, the release of bioactive pro-inflammatory lipids or their fragments after oxidation, extracellular lipid deposition, and immune response.42 Kawashiri et al discovered that coronary atherosclerosis in CHD patients declined as LDL-C was reduced to 74.9 mg/dL.43 The Emerging Risk Factors Collaboration (ERFC) reported that plasma LDL-C level was log-linearly associated with an increased risk of non-fatal MI or CHD death.44 A meta-analysis implied that the annual incidence of major cardiovascular events was lessened by 40% to 50% when LDL-C was reduced by 2–3 mmol/L.45 Therefore, the risk of cardiovascular disease can be reduced by lowering LDL-C levels.46
Our study concludes that HDL-C is one of the most affecting factors in T2DM patients with CHD. The risk of CHD was 1.65 times higher in T2DM patients with abnormal HDL-C than in those with normal HDL-C. Epidemiological studies have confirmed an inverse relationship between plasma HDL-C levels and CHD.47 HDL-C plays an anti-atherogenic role through several mechanisms, including the promotion of cholesterol excretion from the periphery to the liver followed by reverse cholesterol transport, endothelial protection, anti-inflammatory, antioxidant, and antithrombotic effects.48 The lower HDL-C level is a powerful independent predictor of CAD risk.49 Kardassis et al50 suggested that cardiovascular risk can be lowered by increasing HDL-C levels.
Xinjiang is a multi-ethnic inhabited region, and the prevalence of CHD is different among different ethnic groups.20 Compared with previous nomograms, we included ethnic group and other clinical indexes in the nomogram. It is more suitable for predicting the risk of CHD in patients with T2DM in Xinjiang region.
Limitations
Our study has several limitations. First, more clinical indicators were not included in our study owing to the restricted electronic medical records including drug use history, smoking history and so on. Second, some selection bias was unavoidable owing to the retrospective design and single-center nature of the study. Finally, the time period was not long enough and it is possible that many patients were not included in the study.
Conclusion
In this paper, a prediction model for the risk of CHD in patients with T2DM and plotted nomograms was established by analyzing the clinical indicators of T2DM patients. Age, female, HTN, HbA1c, HDL-C, LDL-C, and Uygur were included in the model. C-index, ROC, calibration curves, and DCA were employed to further verify the capability of the characteristic variables of the nomogram to predict the risk of CHD in patients with T2DM in northwestern China.
Author Contributions
All authors made a significant contribution to the work reported, whether that is in the conception, study design, execution, acquisition of data, analysis, and interpretation, or all these areas; took part in drafting, revising, or critically reviewing the article; gave final approval of the version to be published; have agreed on the journal to which the article has been submitted; were accountable for all aspects of the work.
Funding
The survey was funded by the National Natural Science Foundation of China (81660155), State Key Laboratory of Pathogenesis, Prevention and Treatment of High Incidence Diseases in Central Asia, Xinjiang Medical University (SKL-HIDCA-2019-15 and SKL-HIDCA-2021-2), Natural Science Foundation of Xinjiang Uygur Autonomous Region, Outstanding Youth Science Foundation Project (2021D01E28) and Xinjiang Young Scientific and Technical Talents Training Project (2019Q040).
Disclosure
The authors report no conflicts of interest in this work.
References
1. Saeedi P, Petersohn I, Salpea P, et al. Global and regional diabetes prevalence estimates for 2019 and projections for 2030 and 2045: results from the international diabetes federation diabetes atlas, 9th edition. Diabetes Res Clin Pract. 2019;157:107843. doi:10.1016/j.diabres.2019.107843
2. Zheng Y, Ley SH, Hu FB. Global aetiology and epidemiology of type 2 diabetes mellitus and its complications. Nat Rev Endocrinol. 2018;14(2):88–98. doi:10.1038/nrendo.2017.151
3. Ma L-Y, Chen -W-W, Gao R-L, et al. China cardiovascular diseases report 2018: an updated summary. J Geriatr Cardiol. 2020;17(1):1–8. doi:10.11909/j.issn.1671-5411.2020.01.001
4. Einarson TR, Acs A, Ludwig C, Panton UH. Prevalence of cardiovascular disease in type 2 diabetes: a systematic literature review of scientific evidence from across the world in 2007–2017. Cardiovasc Diabetol. 2018;17(1):83. doi:10.1186/s12933-018-0728-6
5. Pearson TA. New tools for coronary risk assessment: what are their advantages and limitations? Circulation. 2002;105(7):886–892. doi:10.1161/hc0702.103727
6. Straka RJ, Liu LZ, Girase PS, DeLorenzo A, Chapman RH. Incremental cardiovascular costs and resource use associated with diabetes: an assessment of 29,863 patients in the US managed-care setting. Cardiovasc Diabetol. 2009;8(1):53. doi:10.1186/1475-2840-8-53
7. Taylor KS, Heneghan CJ, Farmer AJ, et al. All-cause and cardiovascular mortality in middle-aged people with type 2 diabetes compared with people without diabetes in a large U.K. primary care database. Diabetes Care. 2013;36(8):2366–2371. doi:10.2337/dc12-1513
8. Sezer M, Kocaaga M, Aslanger E, et al. Bimodal pattern of coronary microvascular involvement in diabetes mellitus. J Am Heart Assoc. 2016;5(11). doi:10.1161/JAHA.116.003995
9. Casanova F, Adingupu DD, Adams F, et al. The impact of cardiovascular co-morbidities and duration of diabetes on the association between microvascular function and glycaemic control. Cardiovasc Diabetol. 2017;16(1):114. doi:10.1186/s12933-017-0594-7
10. Katakami N. Mechanism of development of atherosclerosis and cardiovascular disease in diabetes mellitus. J Atheroscler Thromb. 2018;25(1):27–39. doi:10.5551/jat.RV17014
11. Park SY. Nomogram: an analogue tool to deliver digital knowledge. J Thorac Cardiovasc Surg. 2018;155(4):1793. doi:10.1016/j.jtcvs.2017.12.107
12. Xiao S, Dong Y, Huang B, Jiang X. Predictive nomogram for coronary heart disease in patients with type 2 diabetes mellitus. Front Cardiovasc Med. 2022;9:1052547. doi:10.3389/fcvm.2022.1052547
13. American Diabetes Association Professional Practice Committee, American Diabetes Association Professional Practice Committee. 2. Classification and diagnosis of diabetes: standards of medical care in diabetes-2022. Diabetes Care. 2022;45(Suppl1):S17–S38. doi:10.2337/dc22-S002
14. Kjeldsen SE, Farsang C, Sleigh P, Mancia G; World Health Organization; International Society of Hypertension. 1999 WHO/ISH hypertension guidelines--highlights and esh update. J Hypertens. 2001;19(12):2285–2288. doi:10.1097/00004872-200112000-00026
15. Knuuti J, Wijns W, Saraste A, et al. 2019 ESC guidelines for the diagnosis and management of chronic coronary syndromes. Eur Heart J. 2020;41(3):407–477. doi:10.1093/eurheartj/ehz425
16. Dhatariya KK, Glaser NS, Codner E, Umpierrez GE. Diabetic ketoacidosis. Nat Rev Dis Primers. 2020;6(1):40. doi:10.1038/s41572-020-0165-1
17. van Netten JJ, Bus SA, Apelqvist J, et al. Definitions and criteria for diabetic foot disease. Diabetes Metab Res Rev. 2020;36(Suppl 1):e3268. doi:10.1002/dmrr.3268
18. Weng J, Ji L, Jia W, et al. Standards of care for type 2 diabetes in China. Diabetes Metab Res Rev. 2016;32(5):442–458. doi:10.1002/dmrr.2827
19. Shi R, Wu B, Niu Z, Sun H, Hu F. Nomogram based on risk factors for type 2 diabetes mellitus patients with coronary heart disease. Diabetes Metab Syndr Obes. 2020;13:5025–5036. doi:10.2147/DMSO.S273880
20. Chen QJ, Lai HM, Chen BD, et al. Appropriate LDL-C-to-HDL-C ratio cutoffs for categorization of cardiovascular disease risk factors among Uygur adults in Xinjiang, China. Int J Environ Res Public Health. 2016;13(2):235. doi:10.3390/ijerph13020235
21. Pursnani S, Merchant M. South Asian ethnicity as a risk factor for coronary heart disease. Atherosclerosis. 2020;315:126–130. doi:10.1016/j.atherosclerosis.2020.10.007
22. Fernando E, Razak F, Lear SA, Anand SS. Cardiovascular disease in South Asian migrants. Can J Cardiol. 2015;31(9):1139–1150. doi:10.1016/j.cjca.2015.06.008
23. Pan S, Yu ZX, Ma YT, et al. Appropriate body mass index and waist circumference cutoffs for categorization of overweight and central adiposity among Uighur adults in Xinjiang. PLoS One. 2013;8(11):e80185. doi:10.1371/journal.pone.0080185
24. Li X, Shan CF, Liu F, et al. Comparison on the 10 years risk for ischemic cardiovascular disease among Han, Uygur, Kazak population from Xinjiang Uygur Autonomous region. Zhonghua Xin Xue Guan Bing Za Zhi. 2019;47(6):486–491. doi:10.3760/cma.j.issn.0253-3758.2019.06.011
25. Li X, Ma YT, Xie X, et al. Association of Egr3 genetic polymorphisms and coronary artery disease in the Uygur and Han of China. Lipids Health Dis. 2014;13:84. doi:10.1186/1476-511X-13-84
26. Ma L, Yuan Y, Li J, Yu C, Zhao J. Distribution of CYP2C19, ABCB1 and PON1 polymorphisms in Chinese Han, Hui, Uygur and Kazak patients with coronary atherosclerotic heart disease. Int J Immunogenet. 2020;47(6):539–545. doi:10.1111/iji.12511
27. Lai HM, Li XM, Yang YN, et al. Genetic variation in NFKB1 and NFKBIA and susceptibility to coronary artery disease in a Chinese Uygur population. PLoS One. 2015;10(6):e0129144. doi:10.1371/journal.pone.0129144
28. Yu F, Liu F, Li XM, et al. GLUT4 gene rs5418 polymorphism is associated with increased coronary heart disease risk in a Uygur Chinese population. BMC Cardiovasc Disord. 2022;22(1):191. doi:10.1186/s12872-022-02630-9
29. Genders TS, Steyerberg EW, Alkadhi H, et al. A clinical prediction rule for the diagnosis of coronary artery disease: validation, updating, and extension. Eur Heart J. 2011;32(11):1316–1330. doi:10.1093/eurheartj/ehr014
30. Kolovou G, Kolovou V, Koutelou M, Mavrogeni S. Atherosclerotic and non-atherosclerotic coronary heart disease in women. Curr Med Chem. 2015;22(31):3555–3564. doi:10.2174/0929867322666150904105941
31. Tyrrell DJ, Goldstein DR. Ageing and atherosclerosis: vascular intrinsic and extrinsic factors and potential role of IL-6. Nat Rev Cardiol. 2021;18(1):58–68. doi:10.1038/s41569-020-0431-7
32. Alonso-Morán E, Orueta JF, Fraile Esteban JI, et al. The prevalence of diabetes-related complications and multimorbidity in the population with type 2 diabetes mellitus in the Basque Country. BMC Public Health. 2014;14:1059. doi:10.1186/1471-2458-14-1059
33. Weber T, Lang I, Zweiker R, et al. Hypertension and coronary artery disease: epidemiology, physiology, effects of treatment, and recommendations: a joint scientific statement from the Austrian society of cardiology and the Austrian society of hypertension. Wien Klin Wochenschr. 2016;128(13–14):467–479. doi:10.1007/s00508-016-0998-5
34. Grossman E. Does increased oxidative stress cause hypertension? Diabetes Care. 2008;31(Suppl 2):S185–S189. doi:10.2337/dc08-s246
35. Prasad K. Current status of primary, secondary, and tertiary prevention of coronary artery disease. Int J Angiol. 2021;30(3):177–186. doi:10.1055/s-0041-1731273
36. Thomopoulos C, Parati G, Zanchetti A. Effects of blood pressure lowering on outcome incidence in hypertension. 1. Overview, meta-analyses, and meta-regression analyses of randomized trials. J Hypertens. 2014;32(12):2285–2295. doi:10.1097/HJH.0000000000000378
37. Leong A, Chen J, Wheeler E, et al. Mendelian randomization analysis of hemoglobin A(1c) as a risk factor for coronary artery disease. Diabetes Care. 2019;42(7):1202–1208. doi:10.2337/dc18-1712
38. Rezende PC, Hlatky MA, Hueb W, et al. Association of longitudinal values of glycated hemoglobin with cardiovascular events in patients with type 2 diabetes and multivessel coronary artery disease. JAMA Netw Open. 2020;3(1):e1919666. doi:10.1001/jamanetworkopen.2019.19666
39. Yan Y, Gao R, Zhang S, et al. Hemoglobin A1c and angiographic severity with coronary artery disease: a cross-sectional study. Int J Gen Med. 2022;15:1485–1495. doi:10.2147/IJGM.S346525
40. Liu L, Ye J, Ying M, et al. The U-shape relationship between glycated hemoglobin level and long-term all-cause mortality among patients with coronary artery disease. Front Cardiovasc Med. 2021;8:632704. doi:10.3389/fcvm.2021.632704
41. Lynn Fillipon NM, Kitkungvan D, Dani SS, Downey BC. The relationship between glycosylated hemoglobin and myocardial perfusion imaging. Clin Cardiol. 2012;35(9):565–569. doi:10.1002/clc.22028
42. Boren J, Chapman MJ, Krauss RM, et al. Low-density lipoproteins cause atherosclerotic cardiovascular disease: pathophysiological, genetic, and therapeutic insights: a consensus statement from the European atherosclerosis society consensus panel. Eur Heart J. 2020;41(24):2313–2330. doi:10.1093/eurheartj/ehz962
43. Kawashiri MA, Sakata K, Hayashi K, et al. Impact of combined lipid lowering and blood pressure control on coronary plaque: myocardial ischemia treated by percutaneous coronary intervention and plaque regression by lipid lowering and blood pressure controlling assessed by intravascular ultrasonography (MILLION) study. Heart Vessels. 2017;32(5):539–548. doi:10.1007/s00380-016-0910-2
44. Ference BA, Ginsberg HN, Graham I, et al. Low-density lipoproteins cause atherosclerotic cardiovascular disease. 1. Evidence from genetic, epidemiologic, and clinical studies. A consensus statement from the European atherosclerosis society consensus panel. Eur Heart J. 2017;38(32):2459–2472. doi:10.1093/eurheartj/ehx144
45. Baigent C, Blackwell L; Cholesterol Treatment Trialists C. Efficacy and safety of more intensive lowering of LDL cholesterol: a meta-analysis of data from 170,000 participants in 26 randomised trials. Lancet. 2010;376(9753):1670–1681. doi:10.1016/S0140-6736(10)61350-5
46. Silverman MG, Ference BA, Im K, et al. Association between lowering LDL-C and cardiovascular risk reduction among different therapeutic interventions: a systematic review and meta-analysis. JAMA. 2016;316(12):1289–1297. doi:10.1001/jama.2016.13985
47. Di Angelantonio E, Sarwar N; Emerging Risk Factors C. Major lipids, apolipoproteins, and risk of vascular disease. JAMA. 2009;302(18):1993–2000. doi:10.1001/jama.2009.1619
48. Navab M, Reddy ST, Van Lenten BJ, Fogelman AM. HDL and cardiovascular disease: atherogenic and atheroprotective mechanisms. Nat Rev Cardiol. 2011;8(4):222–232. doi:10.1038/nrcardio.2010.222
49. White CR, Garber DW, Anantharamaiah GM. Anti-inflammatory and cholesterol-reducing properties of apolipoprotein mimetics: a review. J Lipid Res. 2014;55(10):2007–2021. doi:10.1194/jlr.R051367
50. Kardassis D, Mosialou I, Kanaki M, Tiniakou I, Thymiakou E. Metabolism of HDL and its regulation. Curr Med Chem. 2014;21(25):2864–2880. doi:10.2174/0929867321666140303153430
 © 2023 The Author(s). This work is published and licensed by Dove Medical Press Limited. The
full terms of this license are available at https://www.dovepress.com/terms
and incorporate the Creative Commons Attribution
- Non Commercial (unported, 3.0) License.
By accessing the work you hereby accept the Terms. Non-commercial uses of the work are permitted
without any further permission from Dove Medical Press Limited, provided the work is properly
attributed. For permission for commercial use of this work, please see paragraphs 4.2 and 5 of our Terms.
© 2023 The Author(s). This work is published and licensed by Dove Medical Press Limited. The
full terms of this license are available at https://www.dovepress.com/terms
and incorporate the Creative Commons Attribution
- Non Commercial (unported, 3.0) License.
By accessing the work you hereby accept the Terms. Non-commercial uses of the work are permitted
without any further permission from Dove Medical Press Limited, provided the work is properly
attributed. For permission for commercial use of this work, please see paragraphs 4.2 and 5 of our Terms.
Recommended articles
Development and Validation of a Model That Predicts the Risk of Diabetic Nephropathy in Type 2 Diabetes Mellitus Patients: A Cross-Sectional Study
Yang J, Jiang S
International Journal of General Medicine 2022, 15:5089-5101
Published Date: 20 May 2022
Preoperative Systemic Inflammatory Markers as a Significant Prognostic Factor After TURBT in Patients with Non-Muscle-Invasive Bladder Cancer
Ding L, Deng X, Wang K, Xia W, Zhang Y, Zhang Y, Shao X, Wang J
Journal of Inflammation Research 2023, 16:283-296
Published Date: 21 January 2023
A Nomogram for Predicting Vision-Threatening Diabetic Retinopathy Among Mild Diabetic Retinopathy Patients: A Case–Control and Prospective Study of Type 2 Diabetes
Ke J, Li K, Cao B
Diabetes, Metabolic Syndrome and Obesity 2023, 16:275-283
Published Date: 27 January 2023
Development and Validation of a Risk Nomogram Model for Predicting Constipation in Patients with Type 2 Diabetes Mellitus
Yuan HL, Zhang X, Peng DZ, Lin GB, Li HH, Li FX, Lu JJ, Chu WW
Diabetes, Metabolic Syndrome and Obesity 2023, 16:1109-1120
Published Date: 20 April 2023
The Potential of Single Nucleotide Polymorphisms (SNPs) as Biomarkers and Their Association with the Increased Risk of Coronary Heart Disease: A Systematic Review
Sitinjak BDP, Murdaya N, Rachman TA, Zakiyah N, Barliana MI
Vascular Health and Risk Management 2023, 19:289-301
Published Date: 5 May 2023