Back to Journals » Diabetes, Metabolic Syndrome and Obesity » Volume 16
A Nomogram for Predicting Vision-Threatening Diabetic Retinopathy Among Mild Diabetic Retinopathy Patients: A Case–Control and Prospective Study of Type 2 Diabetes
Received 6 November 2022
Accepted for publication 11 January 2023
Published 27 January 2023 Volume 2023:16 Pages 275—283
DOI https://doi.org/10.2147/DMSO.S394607
Checked for plagiarism Yes
Review by Single anonymous peer review
Peer reviewer comments 2
Editor who approved publication: Prof. Dr. Juei-Tang Cheng
Jing Ke,1,2 Kun Li,1,2 Bin Cao1,2
1Center for Endocrine Metabolism and Immune Diseases, Beijing Luhe Hospital, Capital Medical University, Beijing, 101149, People’s Republic of China; 2Beijing Key Laboratory of Diabetes Research and Care, Beijing, 101149, People’s Republic of China
Correspondence: Bin Cao, Tel +86-10-6954-3901, Email [email protected]
Aim: This study aims to develop a nomogram for predicting vision-threatening diabetic retinopathy (VTDR) in type 2 diabetes mellitus (T2DM) with mild non-proliferative diabetic retinopathy (NPDR) patients.
Materials and Methods: In case–control analysis, 440 patients with mild NPDR or VTDR were enrolled to identify predictors and develop a nomogram. In the prospective cohort, 120 T2DM patients with mild NPDR were enrolled for external validation. Sensitivity, specificity, and area under the receiver operating characteristic (AUC) were calculated to evaluate the predictive performance of the nomogram.
Results: In case–control analysis, 2-h C-peptide (OR = 0.85, 95% CI: 0.75 to 0.95, p = 0.006), sural nerve conduction impaired (SNCI) (mildly: OR = 2.18, 95% CI: 1.10 to 4.33, p = 0.026; moderately/severely: 3.66, 95% CI: 1.74 to 7.70, p < 0.001) and UACR (microalbuminuria: OR = 2.37, 95% CI: 1.25 to 4.48, p = 0.008; macroalbuminuria: 4.02, 95% CI: 1.61 to 10.06, p = 0.003) were identified as independent predictors. The concordance index of the prediction nomogram was 0.76 in the training set. In the test set, sensitivity, specificity, and AUC were 84.8%, 60.6%, and 0.73, respectively. In the prospective cohort, median follow-up period was 42 months, and 15 patients (12.5%) developed VTDR. Sensitivity, specificity, and AUC of prediction were 66.7%, 89.5%, and 0.75, respectively.
Conclusion: Introducing 2-h C-peptide, UACR, and SNCI, the nomogram demonstrated a good discriminatory power for predicting risk of VTDR in mild NPDR individuals.
Keywords: nomogram, diabetic retinopathy, type 2 diabetes mellitus, prediction, progression
Introduction
With the increasing prevalence of diabetes mellitus, the prevalence of diabetic microvascular complications is likely to increase in parallel.1 Diabetic retinopathy (DR) remains a global threat to vision and the economy.2–4 Overall, DR affects 30% of diabetes patients, 11% of whom show some degree of vision loss (vision-threatening DR (VTDR)). A pooled meta-analysis containing 59 population-based studies estimated the number of adults worldwide with vision-threatening DR (VTDR) was 28.54 million in 2020; by 2045, the number will project to 44.82 million.5 Early detection of VTDR at a stage allowing timely intervention is universally recognized to be important in preventing visual impairment.6
Various studies on DR have been conducted to explore the risk factors, which are associated with the disease. Potential predictors associated with diabetic retinopathy include age,7 obesity and tobacco use,8 duration of diabetes,9 poorly controlled hemoglobin A1c (HbA1c),10,11 high blood pressure and dyslipidemia,12 genetic susceptibility,13,14 and lack of nutrients (eg vitamins B, D, and E).15 Based on clinical characteristics that associated with DR, several prediction models have been developed.11,16,17 Although VTDR is one of the major causes of blindness, few predictive models have been made for predicting VTDR.
This study aims to set up an interactive nomogram, and then to evaluate the performance of predicting VTDR in a prospective cohort with mild non-proliferative diabetic retinopathy (NPDR).
Methods
Study Population
A total of 440 consecutive adult (>18 years) patients with type 2 diabetes mellitus (T2DM) treated at the Center for Endocrine Metabolism and Immune Diseases of Beijing Luhe Hospital, Capital Medical University (Beijing, China) between October 2017 and April 2018 were enrolled, forming a case–control set. Between May 2018 and May 2019, 120 T2DM patients with mild NPDR treatment and regular follow-up at our center comprised a prospective cohort for external validation. In the prospective cohort, height, body weight, blood pressure, UACR, and HbA1c test were measured at least twice a year, and two-field fundus photography was required at least once a year. The inclusion criterion of the case–control set was T2DM patients with mild NPDR or VTDR. The exclusion criteria were as follows: (1) type 1 diabetes mellitus or other types of diabetes mellitus (DM), (2) acute complications of diabetes, (3) history of any previous intravitreal injection or any other treatment for DR, (4) severe infectious disease.
Ophthalmic Examination
Visual acuity and two-field fundus photography were taken for fundus examinations. Fundus photography was evaluated by a well-trained retinal specialist, and DR severity was classified according to the International Clinical Diabetic Retinopathy and Diabetic Macular Oedema Disease Severity Scales,18 five stages of DR were defined: (1) no DR, (2) mild NPDR, (3) moderate NPDR, (4) severe NPDR, and (5) PDR. VTDR was defined as the presence of severe NPDR, PDR, or clinically significant diabetic macular edema. The participant’s retinopathy status was determined by the retinopathy severity of the worst affected eye.
Data Collection
Demographic and laboratory data was recorded, including age, gender, body mass index (BMI), duration of diabetes, history of Hypertension, ankle-brachial index (ABI), sural nerve conduction impaired (SNCI), fasting C-peptide, 2-h C-peptide, HbA1c, triglyceride (TG), high-density lipoprotein (HDL), low-density lipoprotein (LDL), visceral fat area, subcutaneous fat area, and urine albumin-to-creatinine ratio (UACR). Visceral fat area and subcutaneous fat were determined by the bioelectrical impedance analysis method. Overnight fasting blood samples and urine samples were collected before 08:00 hours.
Definition of the Stage of Sural Nerve Conduction and Stage of UACR
Sural nerve conduction was measured by nerve action potential amplitude (Amp) and conduction velocity (CV) using NC‐stat®/DPNCheck™ (Neurometrix Inc, Waltham, MA, USA). According to the program of the instrument, SNCI was automatically defined as 4 stages: (1) no obviously impaired, (2) mildly impaired, (3) moderately impaired, and (4) severely impaired. The participant’s SNCI status was determined by the worst affected lower limb.
UACR was defined as 3 stages: (1) normal: UACR < 30 mg/gm; (2) microalbuminuria: UACR 30–299 mg/gm; (3) macroalbuminuria: UACR ≥ 300 mg/gm.
Feature Selection and Model Development
The whole patients in the case–control set were randomly divided into training set and testing set using “caret” package, which included 70% and 30% of the data set, respectively. The least absolute shrinkage and selection operator (LASSO) method, which is suitable for the regression of high-dimensional data,19 was adopted to select the most effective predictive features from the training set. The LASSO regression began with the following candidate predictors: age, BMI, duration of diabetes, visceral fat area, subcutaneous fat area, fasting C-peptide, 2-h C-peptide, HbA1c, TG, LDL, HDL, uric acid, ABI, UACR, and SNCI. The remaining features in the LASSO regression were incorporated into logistic regression.
Multivariable logistic regression was then performed for developing a predictive model. To construct a quantitative tool, we developed a nomogram based on multivariable logistic analysis.
The discrimination performance was measured with the area under the receiver operating characteristic (AUC). Calibration performance was assessed using calibration curves with 1000 bootstrap resamples, which described the consistency between the predicted probability and the actual probability of VTDR.
Prospective Cohort Validation of a Nomogram
In the prospective cohort, nomogram was applied to predict VTDR. All patients underwent measurement of two-field fundus photography at least once every 6 months. Sensitivity, specificity, and AUC were calculated to evaluate the predictive performance of the nomogram.
Statistical Analysis
Continuous data were summarized as the median and interquartile range (IQR), and categorical data were in number and percentage (%). Kruskal–Wallis test was used to compare distributed data, and chi-square test was performed for categorical variables. R software version 3.6.3 (R foundation for Statistical Computing, Vienna, Austria) was used for all analyses. In all cases, p values <0.05 were considered statistically significant.
Results
Clinical Characteristics
As shown in Supplement Figure 1, a total of 507 patients diagnosed as T2DM with mild NPDR or VTDR were initially enrolled. Sixty-seven patients were excluded for the listed reason, and finally a total of 440 patients were enrolled, of which 308 cases were randomly assigned to the training set and 132 cases were into the testing set. In the prospective cohort, 120 T2DM patients with mild NPDR were enrolled to validate the performance of the nomogram. The median follow-up was 42 months. Characteristics in the case–control set and prospective cohort are given in Table 1. The prevalence of VTDR in both training and testing sets was 25%.
 |
Table 1 Clinical Characteristics of the Study Participants at Baseline |
Comparison of Clinical Characteristics in Case-Control Set
In the training and testing set, median 2-h C-peptide was 2.80ng/mL and 2.54ng/mL in VTDR, significantly lower than that in mild NPDR (4.54ng/mL and 3.96ng/mL, respectively) (Figure 1A). Furthermore, the median duration of diabetes in VTDR was longer than that in mild NPDR at the border of statistical significance (11.08 vs 8.42 years and 11.33 vs 7.00 years, respectively) (Figure 1B). For both UACR and SNCI (Figure 1C and D), as the severity increased, the proportion of VTDR increased.
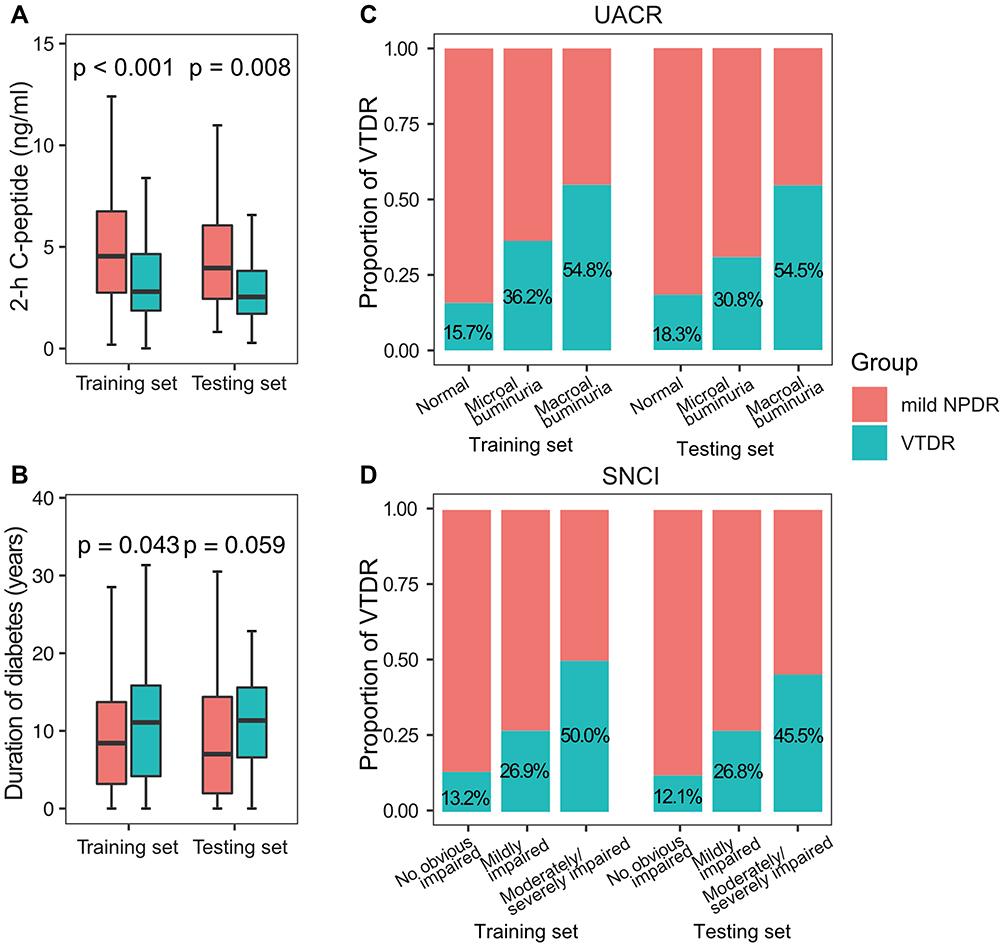 |
Figure 1 Comparison of clinical characteristics between mild NPDR and VTDR in the training and testing sets. Comparing with mild NPDR, 2-h C-peptide was significantly lower (A) and the median duration of diabetes was longer at the border of statistical significance (B) in the VTDR patients. As the severity of UACR and SNCI increased, the proportion of VTDR increased (C and D). |
However, there was no significant difference in age, HbA1c, fasting C-peptide, TG, LDL, HDL, BMI, visceral fat area, subcutaneous fat area, uric acid, and ABI between mild NPDR and VTDR in both training and testing set (Supplement Figure 2).
Feature Selection for Logistic Regression
In all 15 associated characteristic variables, 3 potential predictors were selected based on the data from the training set (Supplement Figure 3A). The nonzero coefficients of the features were SNCI, UACR, and 2-h C-peptide, and the corresponding coefficients were 0.36, 0.35, and −0.02, respectively (Supplement Figure 3B).
Development and Internal Validation of the Predictive Model
Multivariate logistic regression identified 2-h C-peptide (OR = 0.85, 95% CI: 0.75 to 0.95, p = 0.006), SNCI (mildly: OR = 2.18, 95% CI: 1.10 to 4.33, p = 0.026; moderately/severely: 3.66, 95% CI: 1.74 to 7.70, p < 0.001) and UACR (microalbuminuria: OR = 2.37, 95% CI: 1.25 to 4.48, p = 0.008; macroalbuminuria: 4.02, 95% CI: 1.61 to 10.06, p = 0.003) as predictors (Figure 2A). Logistic regression model performed well in the training set, with an AUC of 0.76 (Figure 2B). Using the testing set as the internal validation data, the sensitivity was 84.8%, specificity was 60.6%, and AUC was 0.73 (Figure 2C).
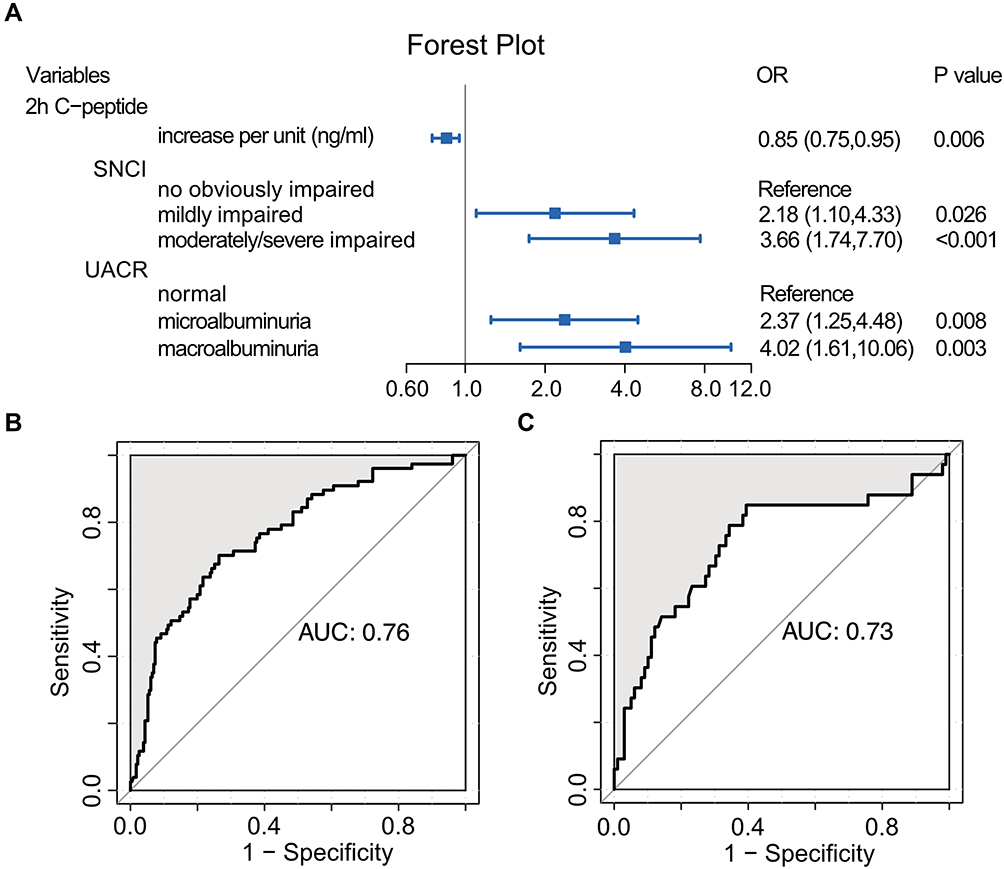 |
Figure 2 Forest plot and receiver operating characteristic curve for logistic regression analysis. 2-h C-peptide, SNCI, and UACR were included in the logistic regression (A). The area under the receiver operating characteristic curve of the training set (B) and the test set (C) were 0.76 and 0.73, respectively. |
Development of a Nomogram in the Training Set
Based upon the above predictors, a nomogram was configured (Figure 3A). The concordance index for the prediction nomogram was 0.76, which suggested acceptable discrimination by our model. A calibration curve with 1000 bootstraps showed that the predicted risk agreed well with the actual probabilities in the training set (Figure 3B), which suggested that our model was well calibrated with no obvious departure from perfect fitting.
 |
Figure 3 Nomogram to estimate the risk of VTDR (A). Each predictor is assigned a score on each axis. Compute the sum of points for all predictors and denote this value as the total points. The corresponding “risk of VTDR” of “total point” was converted to a predicted probability of VTDR. Calibration curve of the training set with 1000 bootstraps (B). The model was well calibrated when the predicted risk agreed well with the actual probabilities. |
The decision curve for the nomogram is presented in Supplement Figure 4. It showed that using the nomogram to predict VTDR adds more net benefit than either the treat-all-patients scheme or the treat-none scheme when the threshold probability between 25% and 80%. Within this range, the net benefit of training and testing set was comparable, with several overlaps.
Prospective Validation of the Nomogram
A prospective cohort containing 120 patients was established for validation. Based on the nomogram, the risk of each patient was calculated. The median follow-up was 42 months. A total of 15 patients were detected with VTDR. As illustrated in Figure 4A, as the grade of UACR and SNCI increased, the proportion of VTDR increased during the follow-up. Besides, the cohort was divided into upper-median and lower-median groups based on median value of 2-h C-peptide. As expected, more VTDR occurred in the lower-median 2-h C-peptide group when compared with the upper-median 2-h C-peptide group. Specificity (89.5%) was high, and sensitivity (66.7%) was acceptable when predicting VTDR. As illustrated in Figure 4B, the AUC of nomogram in prospectively predicting was 0.75, indicating a good discriminatory power.
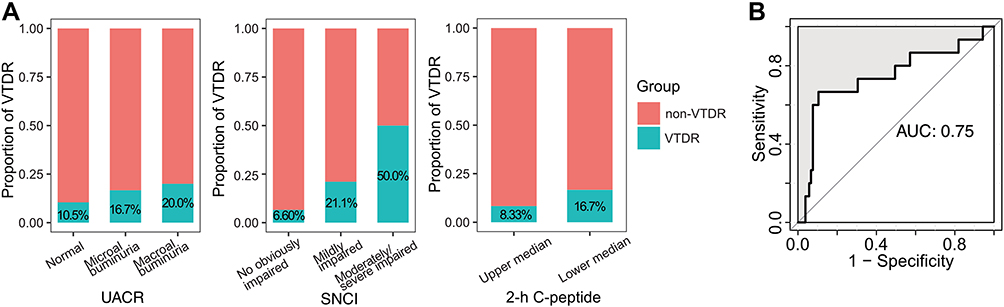 |
Figure 4 Proportion of VTDR and predicting AUC in the prospective cohort. As the grade of UACR and SNCI increased, the proportion of VTDR increased. Besides, more VTDR occurred in the lower-median 2-h C-peptide group than that in the upper median 2-h C-peptide group (A). AUC of prediction was excellent (B). |
Discussion
With a rapid increase in the number of T2DM, VTDR has been one of the most frequent causes of blindness in adults. Thus, research on predicting the risk of VTDR in high-risk population is needed. To our knowledge, this is the first study that used a nomogram to prospectively predict VTDR in mild NPDR patients. There were 15 out of 120 mild NPDR patients developed VTDR during a median follow-up of 42 months. The prospective cohort confirmed that the nomogram had acceptable predictive discrimination.
In this study, we confirmed the importance of the three major predictive factors of VTDR: UACR,20–22 2-h C-peptide, and SNCI. DR and nephropathy seem to progress in a parallel manner. This may be because DR shares similar pathophysiologic features with diabetic nephropathy.23 Previous studies24,25 have revealed that both fasting and postprandial C-peptide levels are negatively correlated with DR, indicating a potential predictive ability of C-peptide on DR. Consistent with previous conclusions, the current study demonstrated that the lower 2-h C-peptide, the higher risk of VTDR progression.
Although there are numerous clinical trials and observational studies, knowledge about association between SNCI and VTDR is unclear. Directly comparable studies with the same predictors on the progression of VTDR are lacking. H Kimura et al26 reported that reductions of sensory potential amplitude were obvious in the sural nerve, although no relation was found between sensory amplitude and retinal diabetic changes. Saini DC et al27 found that the association of severity of DR with diabetic neuropathy was inconclusive. In the current study, we combined Amp and CV and graded severity of SNCI, and the new finding indicated SNCI could be a strong predictor of VTDR. The roles of nerve damage in the pathophysiology of DR are worthy of further study.
HbA1c and Lipid metabolism are well-known risk factors for incidence of DR.28,29 Not only that, HbA1c is considered as the dominant factor impacting DR progression.30,31 In our study, however, no obvious correlation was found between these risk factors and progression of VTDR. Several reasons may help to explain this conflicting finding: First, blood glucose fluctuation persisted throughout the whole course of diabetes, and glycemic variability is also relevant to diabetic complications. It is reported that high HbA1c variability was associated with the progression of DR among individuals with T2DM.32 In this study, a single HbA1c at baseline could not represent glycemic fluctuation during the follow-up, which may explain the failure of predicting progression of DR. Second, SNCI, UACR, and 2-h C-peptide are more effective predictors of progression than HbA1c and duration of diabetes. Third, we focused on a specific progression, that is, from mild NPDR to VTDR. Differences in the study population may partially explain the inconsistent results.
Lipids and lipoproteins have been proposed to contribute to the pathogenesis of DR. Studies have demonstrated a positive association between plasma lipoproteins and DR.33,34 LDL has been proven to be predictors for developing DR in a prediction model.35 However, the associations of individual lipid with DR are weak overall.30,36 LDL was not considered as a risk factor of progression of VTDR in the present study. Lipid-lowering medication may explain this conflicting finding. As a standard treatment, lipid-lowering therapy would be administered to participants with elevated LDL, and the use of lipid-lowering drugs would reduce plasma lipid levels during the follow-up.
Based on these predictors, it is possible to calculate the individual risk for the progression of VTDR. Depending on the user-friendly nomogram, the risk is more easily understood to aid better clinical decision-making. A pooled meta-analysis37 enrolled eight predicting models of DR to validate their predictive accuracy in the large Hoorn Diabetes Care System cohort in the Netherlands. For predicting VTDR, C indices range from 0.51 to 0.83. The predictive performance is comparable between the current study and the previous research. Furthermore, the prospective design of our study effectively reduces bias, resulting in a reliable conclusion.
Strengthenings of our study were as follows: Firstly, this research focused on predicting VTDR in their high-risk population. It is greatly important to early detect VTDR at a stage allowing timely intervention; Secondly, a prospective cohort was enrolled for external validation; at present, few studies prospectively validate the predictive performance of VTDR.
However, we also acknowledged some limitations: Firstly, although we performed a prospective validation to prove the predictability of our model, a large data set is truly needed to further validate the model. Secondly, this study was carried out in only one center. More centers are needed to enlarge the range of population for external validation.
In conclusion, 2-h C-peptide, SNCI, and UACR were confined as independent predictors, and the predictive model incorporating these three predictors demonstrated a good discriminatory power for predicting VTDR. It needs to be further confirmed by large-scale populations.
Ethics
All samples were collected with signed informed consent from all patients, and all related procedures were approved by the Ethics Committee of Beijing Luhe Hospital, Capital Medical University.
Acknowledgments
The authors would like to thank all the participants who took part in the study.
Funding
This study was funded by the Science and Technology Committee of Tongzhou District (Number: KJ2020CX001-11, KJ2022CX022).
Disclosure
The authors declare no conflicts of interest in this work.
References
1. Sabanayagam C, Chee ML, Banu R, et al. Association of diabetic retinopathy and diabetic kidney disease with all-cause and cardiovascular mortality in a multiethnic asian population. JAMA Netw Open. 2019;2(3):e191540. doi:10.1001/jamanetworkopen.2019.1540
2. Cheung N, Mitchell P, Wong TY. Diabetic retinopathy. Lancet. 2010;376(9735):124–136. doi:10.1016/S0140-6736(09)62124-3
3. Monaco WA, Crews JE, Nguyen ATH, Arif A. Prevalence of vision loss and associations with age-related eye diseases among nursing home residents aged ≥65 years. J Am Med Dir Assoc. 2020;22:1156–1161. doi:10.1016/j.jamda.2020.08.036
4. Vujosevic S, Aldington SJ, Silva P, et al. Screening for diabetic retinopathy: new perspectives and challenges. Lancet Diabetes Endocrinol. 2020;8(4):337–347. doi:10.1016/S2213-8587(19)30411-5
5. Teo ZL, Tham YC, Yu M, et al. Global prevalence of diabetic retinopathy and projection of burden through 2045: systematic review and meta-analysis. Ophthalmology. 2021;128(11):1580–1591. doi:10.1016/j.ophtha.2021.04.027
6. Broadbent DM, Wang A, Cheyne CP, et al. Safety and cost-effectiveness of individualised screening for diabetic retinopathy: the ISDR open-label, equivalence RCT. Diabetologia. 2021;64(1):56–69. doi:10.1007/s00125-020-05313-2
7. Larsen MB, Henriksen JE, Grauslund J, Peto T. Prevalence and risk factors for diabetic retinopathy in 17 152 patients from the island of Funen, Denmark. Acta Ophthalmol. 2017;95(8):778–786. doi:10.1111/aos.13449
8. Tyrberg M, Nyström L, Arnqvist HJ, et al. Overweight, hyperglycemia and tobacco use are modifiable risk factors for onset of retinopathy 9 and 17 years after the diagnosis of diabetes - A retrospective observational nation-wide cohort study. Diabetes Res Clin Pract. 2017;133:21–29. doi:10.1016/j.diabres.2017.08.009
9. Bebu I, Braffett BH, Schade D, et al. An observational study of the equivalence of age and duration of diabetes to glycemic control relative to the risk of complications in the combined cohorts of the DCCT/EDIC study. Diabetes Care. 2020;43(10):2478–2484. doi:10.2337/dc20-0226
10. Kumari N, Bhargava M, Nguyen DQ, et al. Six-year incidence and progression of diabetic retinopathy in Indian adults: the Singapore Indian Eye study. Br J Ophthalmol. 2019;103(12):1732–1739. doi:10.1136/bjophthalmol-2018-313282
11. Kang EY, Lo FS, Wang JP, et al. Nomogram for prediction of non-proliferative diabetic retinopathy in juvenile-onset type 1 diabetes: a cohort study in an Asian population. Sci Rep. 2018;8(1):12164. doi:10.1038/s41598-018-30521-7
12. Chew EY, Davis MD, Danis RP, et al. The effects of medical management on the progression of diabetic retinopathy in persons with type 2 diabetes: the action to control cardiovascular risk in diabetes (ACCORD) eye study. Ophthalmology. 2014;121(12):2443–2451. doi:10.1016/j.ophtha.2014.07.019
13. Bhatwadekar AD, Shughoury A, Belamkar A, Ciulla TA. Genetics of diabetic retinopathy, a leading cause of irreversible blindness in the industrialized world. Genes. 2021;12:8. doi:10.3390/genes12081200
14. Milluzzo A, Maugeri A, Barchitta M, Sciacca L, Agodi A. Epigenetic mechanisms in type 2 diabetes retinopathy: a systematic review. Int J Mol Sci. 2021;22:19. doi:10.3390/ijms221910502
15. Milluzzo A, Barchitta M, Maugeri A, et al. Do nutrients and nutraceuticals play a role in diabetic retinopathy? A systematic review. Nutrients. 2022;14:20. doi:10.3390/nu14204430
16. Li L, Yang Y, Zhu X, et al. Design and validation of a scoring model for differential diagnosis of diabetic nephropathy and nondiabetic renal diseases in type 2 diabetic patients. J Diabetes. 2020;12(3):237–246. doi:10.1111/1753-0407.12994
17. Yao L, Zhong Y, Wu J, et al. Multivariable logistic regression and back propagation artificial neural network to predict diabetic retinopathy. Diabetes Metab Syndr Obes. 2019;12:1943–1951. doi:10.2147/DMSO.S219842
18. Wilkinson CP, Ferris FL 3rd, Klein RE, et al. Proposed international clinical diabetic retinopathy and diabetic macular edema disease severity scales. Ophthalmology. 2003;110(9):1677–1682. doi:10.1016/S0161-6420(03)00475-5
19. Sauerbrei W, Royston P, Binder H. Selection of important variables and determination of functional form for continuous predictors in multivariable model building. Stat Med. 2007;26(30):5512–5528. doi:10.1002/sim.3148
20. Ganjifrockwala FA, Joseph JT, George G. Evaluation of kidney function and risk factors of retinopathy in type 2 diabetes mellitus people in South Africa. Diabetes Res Clin Pract. 2017;127:218–223. doi:10.1016/j.diabres.2017.03.022
21. Zhuang X, Cao D, Zeng Y, et al. Associations between retinal microvasculature/microstructure and renal function in type 2 diabetes patients with early chronic kidney disease. Diabetes Res Clin Pract. 2020;168:108373. doi:10.1016/j.diabres.2020.108373
22. Romero-Aroca P, Navarro-Gil R, Valls-Mateu A, Sagarra-Alamo R, Moreno-Ribas A, Soler N. Differences in incidence of diabetic retinopathy between type 1 and 2 diabetes mellitus: a nine-year follow-up study. Br J Ophthalmol. 2017;101(10):1346–1351. doi:10.1136/bjophthalmol-2016-310063
23. Chen YH, Chen HS, Tarng DC. More impact of microalbuminuria on retinopathy than moderately reduced GFR among type 2 diabetic patients. Diabetes Care. 2012;35(4):803–808. doi:10.2337/dc11-1955
24. Wang Y, Wan H, Chen Y, et al. Association of C-peptide with diabetic vascular complications in type 2 diabetes. Diabetes Metab. 2020;46(1):33–40. doi:10.1016/j.diabet.2019.04.004
25. Yoon HJ, Cho YZ, Kim JY, et al. Correlations between glucagon stimulated C-peptide levels and microvascular complications in type 2 diabetes patients. Diabetes Metab J. 2012;36(5):379–387. doi:10.4093/dmj.2012.36.5.379
26. Kimura H, Harada N, Suzuki S, Takeuchi T. Sensory axonal dysfunction in the upper and lower limb of diabetic patients and its relation to diabetic retinopathy. Diabetes Res. 1987;4(4):169–173.
27. Saini DC, Kochar A, Poonia R. Clinical correlation of diabetic retinopathy with nephropathy and neuropathy. Indian J Ophthalmol. 2021;69(11):3364–3368. doi:10.4103/ijo.IJO_1237_21
28. Tapp RJ, Shaw JE, Harper CA, et al. The prevalence of and factors associated with diabetic retinopathy in the Australian population. Diabetes Care. 2003;26(6):1731–1737. doi:10.2337/diacare.26.6.1731
29. Busik JV. Lipid metabolism dysregulation in diabetic retinopathy. J Lipid Res. 2021;62:100017. doi:10.1194/jlr.TR120000981
30. Cheung N, Chee ML, Klein R, et al. Incidence and progression of diabetic retinopathy in a multi-ethnic US cohort: the multi-ethnic study of atherosclerosis. Br J Ophthalmol. 2022;106(9):1264–1268. doi:10.1136/bjophthalmol-2021-318992
31. Gubitosi-Klug R, Libman I, Drews KL, et al. TODAY Study Group. Development and progression of diabetic retinopathy in adolescents and young adults with type 2 diabetes: results from the TODAY Study. Diabetes Care. 2021;45(5):1049–1055.
32. Park JY, Hwang JH, Kang MJ, Sim HE, Kim JS, Ko KS. Effects of glycemic variability on the progression of diabetic retinopathy among patients with type 2 diabetes. Retina. 2021;41(7):1487–1495. doi:10.1097/IAE.0000000000003049
33. Eckel RH, McLean E, Albers JJ, Cheung MC, Bierman EL. Plasma lipids and microangiopathy in insulin-dependent diabetes mellitus. Diabetes Care. 1981;4(4):447–453. doi:10.2337/diacare.4.4.447
34. Lyons TJ, Jenkins AJ, Zheng D, et al. Diabetic retinopathy and serum lipoprotein subclasses in the DCCT/EDIC cohort. Invest Ophthalmol Vis Sci. 2004;45(3):910–918. doi:10.1167/iovs.02-0648
35. Zhao Y, Li X, Li S, et al. Using machine learning techniques to develop risk prediction models for the risk of incident diabetic retinopathy among patients with type 2 diabetes mellitus: a cohort study. Front Endocrinol. 2022;13:876559. doi:10.3389/fendo.2022.876559
36. Klein R, Sharrett AR, Klein BE, et al. The association of atherosclerosis, vascular risk factors, and retinopathy in adults with diabetes: the atherosclerosis risk in communities study. Ophthalmology. 2002;109(7):1225–1234. doi:10.1016/S0161-6420(02)01074-6
37. van der Heijden AA, Nijpels G, Badloe F, et al. Prediction models for development of retinopathy in people with type 2 diabetes: systematic review and external validation in a Dutch primary care setting. Diabetologia. 2020;63(6):1110–1119. doi:10.1007/s00125-020-05134-3
 © 2023 The Author(s). This work is published and licensed by Dove Medical Press Limited. The
full terms of this license are available at https://www.dovepress.com/terms
and incorporate the Creative Commons Attribution
- Non Commercial (unported, 3.0) License.
By accessing the work you hereby accept the Terms. Non-commercial uses of the work are permitted
without any further permission from Dove Medical Press Limited, provided the work is properly
attributed. For permission for commercial use of this work, please see paragraphs 4.2 and 5 of our Terms.
© 2023 The Author(s). This work is published and licensed by Dove Medical Press Limited. The
full terms of this license are available at https://www.dovepress.com/terms
and incorporate the Creative Commons Attribution
- Non Commercial (unported, 3.0) License.
By accessing the work you hereby accept the Terms. Non-commercial uses of the work are permitted
without any further permission from Dove Medical Press Limited, provided the work is properly
attributed. For permission for commercial use of this work, please see paragraphs 4.2 and 5 of our Terms.
Recommended articles
Risk Factors Analysis and the Establishment of Nomogram Prediction Model of Hidden Blood Loss After Total Hip Arthroplasty for Femoral Neck Fracture in Elderly Women
Hong WS, Zhang YX, Lin Q, Sun Y
Clinical Interventions in Aging 2022, 17:707-715
Published Date: 4 May 2022
Development and Validation of a Model That Predicts the Risk of Diabetic Nephropathy in Type 2 Diabetes Mellitus Patients: A Cross-Sectional Study
Yang J, Jiang S
International Journal of General Medicine 2022, 15:5089-5101
Published Date: 20 May 2022
Association Between Serum Albumin Level and Microvascular Complications of Type 2 Diabetes Mellitus
Zhang J, Deng Y, Wan Y, He S, Cai W, Xu J
Diabetes, Metabolic Syndrome and Obesity 2022, 15:2173-2182
Published Date: 23 July 2022
Development and Validation of a Risk Nomogram Model for Predicting Constipation in Patients with Type 2 Diabetes Mellitus
Yuan HL, Zhang X, Peng DZ, Lin GB, Li HH, Li FX, Lu JJ, Chu WW
Diabetes, Metabolic Syndrome and Obesity 2023, 16:1109-1120
Published Date: 20 April 2023
Non-Linear Relationship Between Fasting C-Peptide and Retinopathy in Patients with Type 2 Diabetes Mellitus - A Retrospective Study
Ma J, Han C, Lv Y, Cai H
Diabetes, Metabolic Syndrome and Obesity 2025, 18:1035-1045
Published Date: 7 April 2025