Back to Journals » Diabetes, Metabolic Syndrome and Obesity » Volume 19
Development and External Validation of a Machine Learning Model for Predicting Wound Infection in Diabetic Foot Ulcers
Authors Nie X, Jiang Y, Meng X, Liu J, Zhao H, Chen Y, Wang J, Lu T
Received 23 December 2025
Accepted for publication 18 February 2026
Published 7 March 2026 Volume 2026:19 586810
DOI https://doi.org/10.2147/DMSO.S586810
Checked for plagiarism Yes
Review by Single anonymous peer review
Peer reviewer comments 2
Editor who approved publication: Dr Rebecca Baqiyyah Conway
Xingguo Nie,1 Yang Jiang,2 Xiangyan Meng,3 Ju Liu,1 Haijian Zhao,1 Yundong Chen,1 Junbo Wang,1 Tan Lu1
1Department of Orthopedics, The First Affiliated Hospital of Henan Medical University, Weihui, Henan, People’s Republic of China; 2Burn Plastic Surgery and Medical Aesthetics Department, The First Affiliated Hospital of Henan Medical University, Weihui, Henan, People’s Republic of China; 3Department of Ophthalmology, The First Affiliated Hospital of Henan Medical University, Weihui, Henan, People’s Republic of China
Correspondence: Tan Lu, Department of Orthopedics, The First Affiliated Hospital of Henan Medical University, 88 Jiankang Road, Weihui, Henan, 453100, People’s Republic of China, Email [email protected]
Purpose: Wound infection is a major determinant of poor prognosis in patients with diabetic foot ulcers (DFUs). This study aimed to develop, compare, and externally validate multiple machine learning (ML) models for predicting wound infection in DFUs using routinely collected clinical indicators.
Methods: A total of 800 patients with DFUs were retrospectively enrolled. The primary cohort (n=500) was randomly divided into training (70%, n=350) and internal testing (30%, n=150) sets, while an independent cohort (n=300) was used for external validation. Eight ML algorithms were constructed and compared, including logistic regression, decision tree, random forest, support vector machine, k-nearest neighbor, naive Bayes, extreme gradient boosting, and light gradient boosting machine. Model performance was evaluated using area under the curve (AUC), accuracy, sensitivity, specificity, and other metrics in internal cross-validation and external validation. SHapley Additive exPlanations (SHAP) were applied for feature interpretability.
Results: The RF model demonstrated the best performance, with an AUC of 0.937 (95% CI 0.906 to 0.969) in training, 0.853 (95% CI 0.804 to 0.901) in internal testing, and 0.832 (95% CI 0.779 to 0.885) in external validation. Six key variables (age, duration of diabetes, ankle brachial index, ulcer area, vascular complications, and osteomyelitis) were identified as the most influential predictors. SHAP analysis provided interpretable insights into their contributions to infection risk.
Conclusion: The RF model showed robust predictive performance and generalizability for wound infection in DFUs. Its integration into clinical practice could enable early risk stratification and personalized interventions, potentially reducing amputations and improving outcomes. Future prospective studies are needed for further validation.
Keywords: diabetic foot, ulcer infection, predictive modeling, machine learning, external validation
Introduction
Diabetic foot ulcer (DFU) is one of the most severe and disabling complications of diabetes mellitus, affecting approximately 15–25% of patients during their lifetime.1 DFUs are a major global cause of hospitalization, lower-limb amputation, and premature mortality, creating a substantial economic and social burden.2 Among the various complications of DFU, wound infection plays a decisive role in therapeutic outcomes, frequently leading to delayed healing, increased risk of amputation, and even death. Timely identification of patients at high risk of infection is therefore essential to guide early intervention and improve clinical prognosis.3
The pathogenesis of DFU infection involves a complex interplay of systemic metabolic disturbances and local wound factors.4 Peripheral artery disease, neuropathy, poor glycemic control, and prolonged ulcer duration are known to compromise tissue perfusion and immune defense,5 thereby predisposing wounds to bacterial contamination and infection.6 Several clinical indicators and comorbidities have been associated with infection risk in DFU, but the evidence remains heterogeneous and sometimes conflicting.7 Moreover, most existing clinical scoring systems or logistic regression models are limited by their linear assumptions and often fail to capture non-linear interactions or complex dependencies among risk factors.8 Consequently, their predictive performance and generalizability remain suboptimal for real-world clinical application.
Recent advances in machine learning (ML) have opened new avenues for improving disease risk prediction in clinical research. ML models are capable of handling multidimensional data and uncovering intricate patterns that traditional statistical approaches may overlook. They have shown promising results in predicting diabetic complications such as retinopathy, nephropathy, and cardiovascular disease.9,10 However, only few studies have applied ML approaches to predict wound infection in DFU, and external validation of such models has rarely been performed.11 Furthermore, model interpretability is often limited, hindering clinical acceptance and implementation.12
Against this background, the present study aimed to develop and externally validate multiple machine learning models to predict wound infection in patients with diabetic foot ulcers using routinely collected clinical data. While machine learning has been applied to DFU prognosis, existing studies often suffer from limited sample sizes, lack of external validation, or the “black box” nature of complex algorithms. Distinct from previous literature, this study not only develops high-performance prediction models but also strictly validates them in an independent external cohort to ensure robustness. Furthermore, we prioritized clinical interpretability by employing SHAP analysis to visually explain the process of the model, thereby bridging the gap between advanced algorithms and clinical application. By comparing the predictive performance of various algorithms, this study aimed to establish a robust and transparent predictive framework to support the early identification of high-risk individuals and optimize individualized risk stratification for patients with DFU.
Materials and Methods
Inclusion and Exclusion Criteria
This retrospective cohort study utilized data extracted from the electronic medical records system of The First Affiliated Hospital of Henan Medical University. Patients were consecutively enrolled between January 1, 2020, and December 31, 2024. For external validation, an independent cohort including 300 patients who met the same eligibility criteria was collected from The First Central Hospital of Baoding during the same study period.
Patients were eligible for inclusion if they were clinically diagnosed with diabetic foot ulcers (DFUs) according to the guidelines of the International Working Group on the Diabetic Foot, had complete clinical and laboratory data, and were aged 18 years or older with a confirmed diagnosis of diabetes mellitus (type 1 or type 2). Only patients who were admitted to the hospital for the evaluation or treatment of DFUs within the defined study period were considered.
Patients were excluded if they had non-diabetic lower-extremity ulcers or wounds caused by other diseases, had evidence of severe systemic infection such as sepsis or multi-organ failure at admission, or had incomplete essential clinical data including laboratory or imaging results. Repeated hospitalizations of the same individual were excluded to avoid duplication, and only the first admission was retained for analysis. Patients who had undergone major lower-limb amputation prior to admission or had malignant ulcers were also excluded.
All patient data were anonymized before analysis to ensure confidentiality. The study protocol was reviewed and approved by the Ethics Committees of both participating hospitals, and the requirement for informed consent was waived due to the retrospective nature of the study.
Data Collection
A total of 22 variables were analyzed in this study, including both continuous and categorical variables. All data were obtained from the electronic medical record systems of the participating hospitals and are summarized in Table 1.
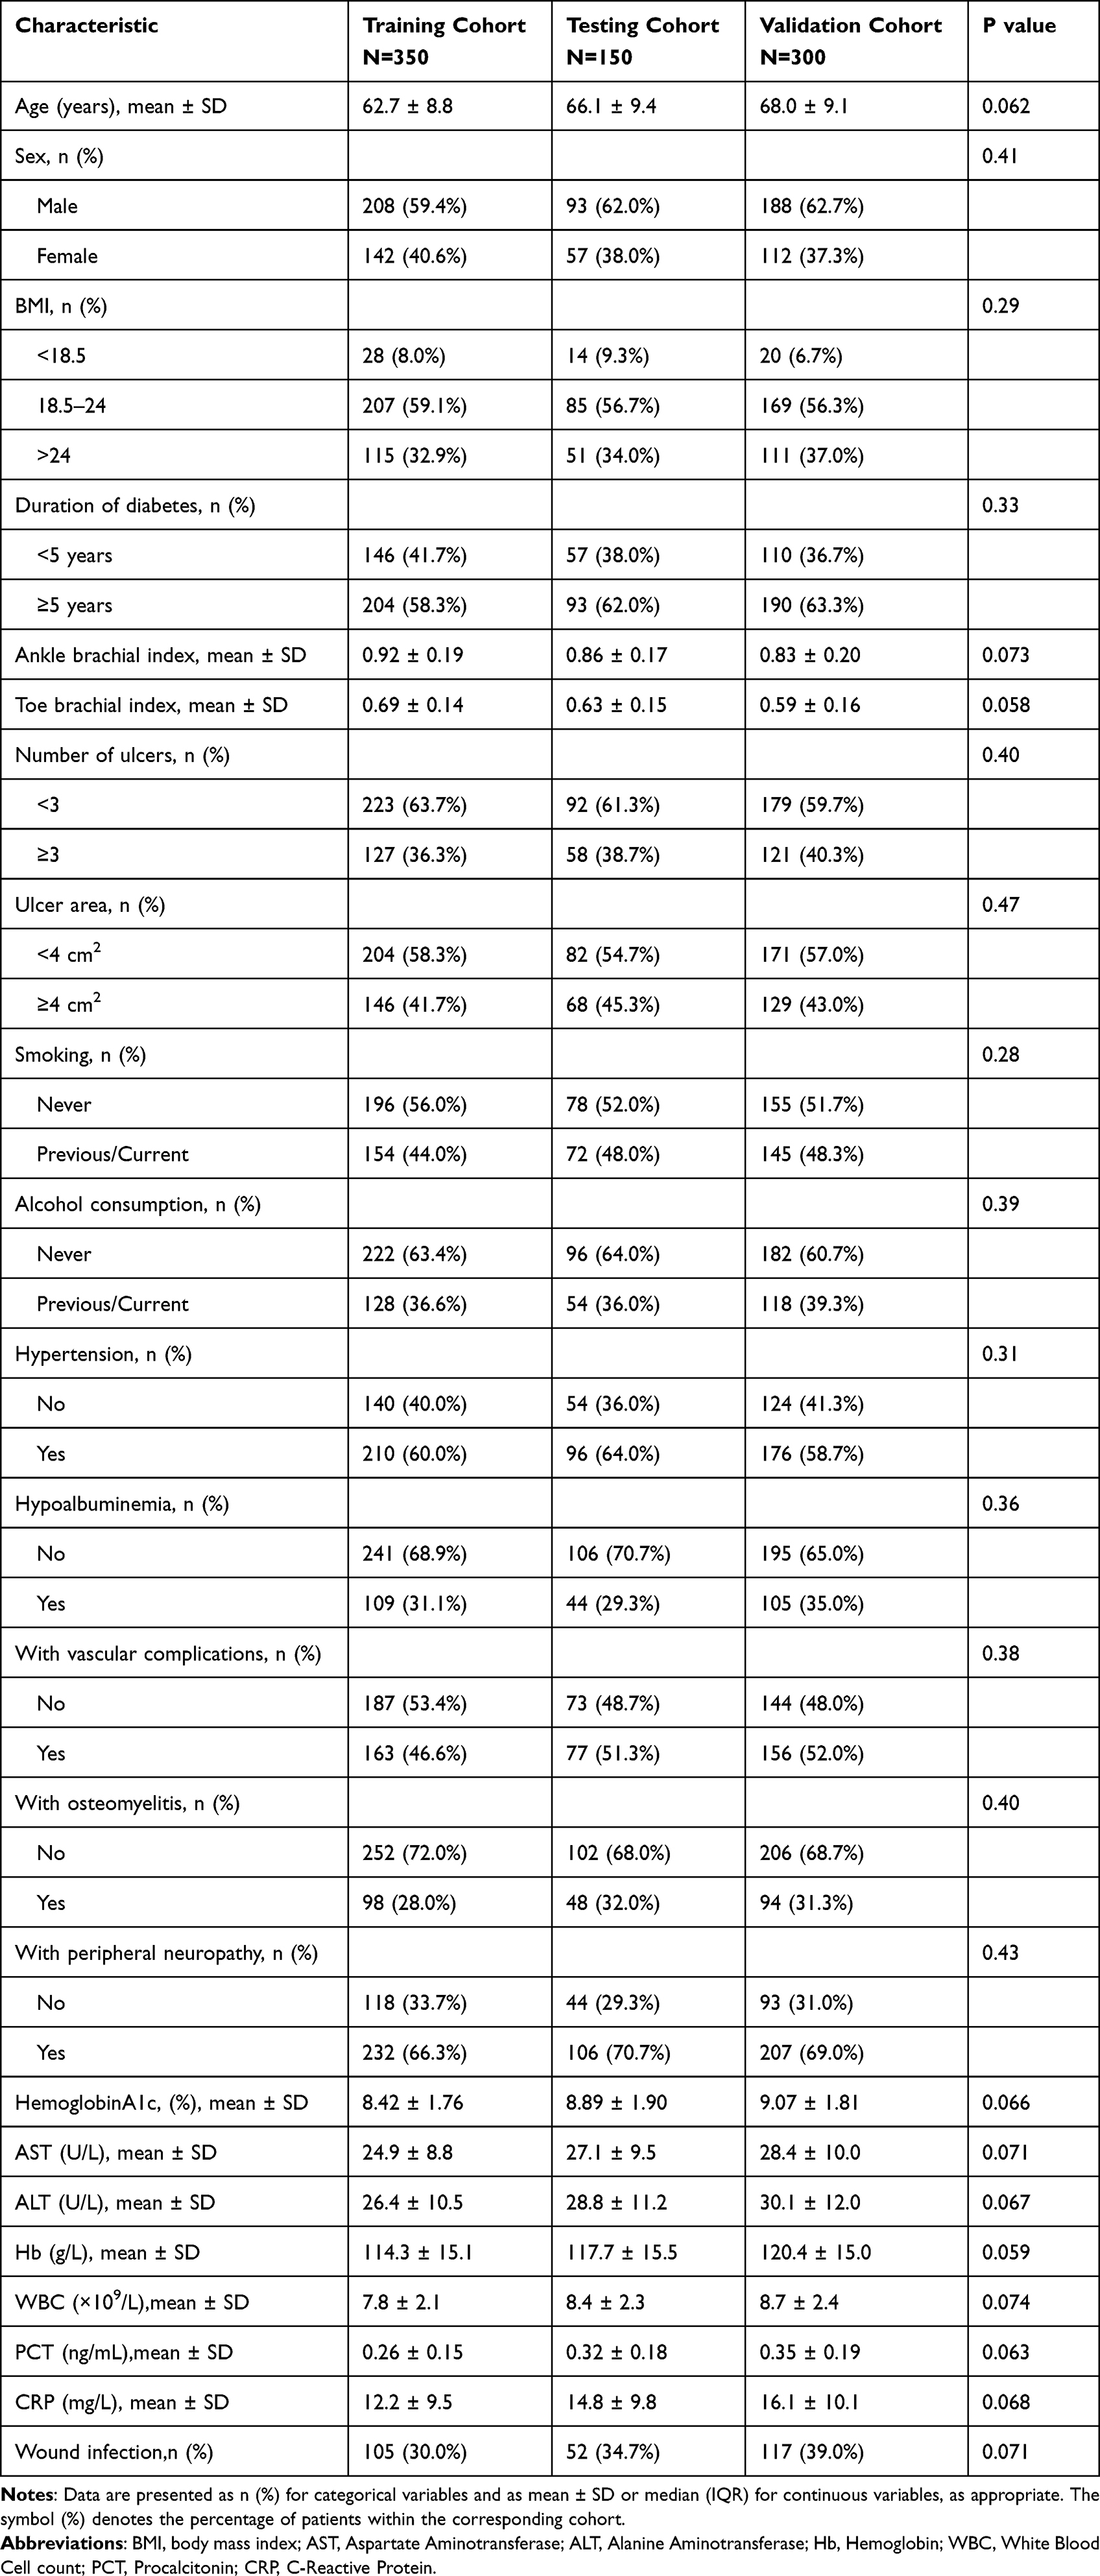 |
Table 1 Baseline Characteristics of Patients in the Training, Testing, and Validation Cohorts |
Continuous variables included age, ankle brachial index, toe brachial index, hemoglobin A1c (HbA1c, %), aspartate aminotransferase (AST, U/L), alanine aminotransferase (ALT, U/L), hemoglobin (Hb, g/L), white blood cell count (WBC, ×109/L), procalcitonin (PCT, ng/mL), and C-reactive protein (CRP, mg/L).
Categorical variables included sex (male or female), body mass index (BMI) categorized as underweight (< 18.5 kg/m2), normal weight (18.5–24.0 kg/m2), or overweight (> 24.0 kg/m2), duration of diabetes (< 5 years or ≥ 5 years), number of ulcers (< 3 or ≥ 3), ulcer area (< 4 cm2 or ≥ 4 cm2), smoking status (never or previous/current), alcohol consumption (never or previous/current), hypertension (yes or no), hypoalbuminemia (yes or no), with vascular complications (yes or no), with osteomyelitis (yes or no), and with peripheral neuropathy (yes or no).
All variables were routinely recorded by attending physicians and nursing staff at the time of admission or during hospitalization. Data were independently extracted and verified by two trained researchers to ensure completeness and accuracy. Any inconsistencies were resolved through discussion under the supervision of the principal investigator.
Outcome Measures
The primary outcome of this study was the presence of wound infection in diabetic foot ulcers (DFUs). The diagnosis of wound infection was established according to the criteria recommended by the International Working Group on the Diabetic Foot (IWGDF) and the Infectious Diseases Society of America (IDSA) guidelines.13,14
A wound was considered infected when there was clinical evidence of infection involving the skin, subcutaneous tissue, or deeper structures of the foot in a patient with diabetes.15 The diagnosis required the presence of at least two local signs or symptoms of inflammation, including erythema, warmth, swelling or induration, tenderness or pain, and purulent exudate.16 In severe cases, systemic manifestations such as fever, elevated white blood cell count, or increased inflammatory markers (C-reactive protein or procalcitonin) were also considered supportive evidence.17 Microbiological confirmation through positive wound culture was recorded when available but was not mandatory for diagnosis if clinical criteria were clearly met.
All diagnostic decisions were made by attending physicians specializing in endocrinology or wound care during hospitalization, based on clinical examinations, laboratory findings, and imaging assessments when necessary. To ensure consistency, patient records were independently reviewed by two experienced clinicians, and disagreements were resolved through consensus discussion.
Model Construction and Validation
Eight machine learning algorithms were developed to predict wound infection in patients with diabetic foot ulcers (DFUs), including logistic regression (LR), decision tree (DT), random forest (RF), support vector machine (SVM), k-nearest neighbors (KNN), naive Bayes model (NBM), extreme gradient boosting (XGB), and light gradient boosting machine (LGBM).
The entire dataset was randomly divided into a training set (70%) and a testing set (30%) using a 7:3 ratio. Model training and parameter tuning were performed on the training set, while the testing set was used to evaluate internal generalization performance. To improve model stability and prevent overfitting, tenfold cross-validation was employed during model training to optimize hyperparameters.
Model performance was assessed using multiple evaluation metrics, including area under the receiver operating characteristic curve (AUC), F1-score, recall (sensitivity), precision, positive predictive value (PPV), negative predictive value (NPV), specificity, and accuracy. DeLong tests were conducted to compare AUC values between models and determine the statistical significance of performance differences.For model comparison, each of the eight algorithms was ranked from best to worst for every evaluation metric, and points were assigned in descending order (best = 8 points; worst = 1 point). The cumulative score across all metrics was calculated to obtain the overall performance ranking.
To evaluate the model’s generalizability, the RF model was further validated in an independent external cohort from the First Central Hospital of Baoding. Model discrimination, calibration, and clinical utility were assessed in this cohort using ROC curves, calibration plots, and decision curve analysis (DCA), confirming its excellent predictive stability and applicability across different populations.
Finally, to enhance interpretability, the SHapley Additive exPlanations (SHAP) framework was used to quantify the contribution of each feature to model predictions. The SHAP summary plot and mean SHAP value bar chart identified global feature importance and the direction of influence on infection risk, while the waterfall plots visualized feature effects for individual patients, thereby improving model transparency and clinical interpretability.
Statistical Analyses
All statistical analyses and data visualizations were performed using R (version 4.4.2) and JD_DCPM (V6.11, Jingding Medical Technology Co., Ltd). Continuous variables were assessed for normality via the Shapiro–Wilk test. Normally distributed data are presented as mean ± standard deviation, with group comparisons conducted using Student’s t-tests. Non-normally distributed variables are expressed as median and interquartile range [M (Q1, Q3)] and analyzed via the Mann–Whitney-U test. Categorical variables are reported as frequencies (percentages) and evaluated using Chi-square tests or Fisher’s exact tests (for cell counts <5). Statistical significance was defined as a two-tailed p-value < 0.05.
Result
Basic Characteristics of the Patients
A total of 800 patients with diabetic foot ulcers were included in this study, comprising 350 cases in the training cohort, 150 in the internal testing cohort, and 300 in the external validation cohort. The baseline demographic and clinical characteristics of the three cohorts are summarized in Table 1. Overall, there were no significant differences in any variable among the three groups (all P > 0.05), indicating good cohort comparability.
The mean age of patients ranged from 62.7 ± 8.8 to 68.0 ± 9.1 years, and approximately 60% of participants were male. The majority of patients had a body mass index (BMI) within the normal range (18.5–24 kg/m2), and more than half (58–63%) had been diagnosed with diabetes for over five years. The ankle-brachial index (ABI) and toe-brachial index (TBI) were slightly lower in the validation cohort, but these differences were not statistically significant.
Regarding ulcer characteristics, most patients had fewer than three ulcers (≈60%) and an ulcer area less than 4 cm2. The prevalence of smoking (44–48%) and alcohol consumption (36–39%) was similar across cohorts. Comorbidities such as hypertension (58–64%), hypoalbuminemia (29–35%), vascular complications (47–52%), osteomyelitis (28–32%), and peripheral neuropathy (66–70%) were common but balanced among groups.
Laboratory findings were comparable, with mean hemoglobin A1c levels ranging from 8.42 ± 1.76% to 9.07 ± 1.81%. The mean levels of AST, ALT, hemoglobin, white blood cell count, procalcitonin (PCT), and C-reactive protein (CRP) showed no statistically significant inter-group differences (P > 0.05).
In total, wound infection occurred in 105 patients (30.0%) in the training cohort, 52 (34.7%) in the testing cohort, and 117 (39.0%) in the external validation cohort. The comparable baseline profiles across cohorts supported the reliability of subsequent model development and validation analyses.
Feature Selection
We first identified clinically relevant risk factors by combining a systematic literature review, clinical experience and expert consensus obtained from a multidisciplinary panel that included endocrinologists, vascular surgeons, and wound care specialists. Candidate predictors were thus established based on both clinical evidence and professional experience.
Initially, univariate logistic regression analysis was performed in the training cohort to evaluate the association between each variable and wound infection. Ten variables were significantly associated with infection (P < 0.05), including Age, Duration of diabetes, Ankle brachial index, Number of ulcers, Ulcer area, Hypoalbuminemia, With vascular complications, With osteomyelitis, With peripheral neuropathy, and CRP.
Variables with statistical significance in univariate analysis were subsequently entered into a multivariate logistic regression model to identify independent predictors (Table 2). Six variables remained significant in the final model: age, duration of diabetes, ankle brachial index, ulcer area, with vascular complications, and with osteomyelitis. These predictors were therefore selected as the final feature set for machine learning model development and validation.
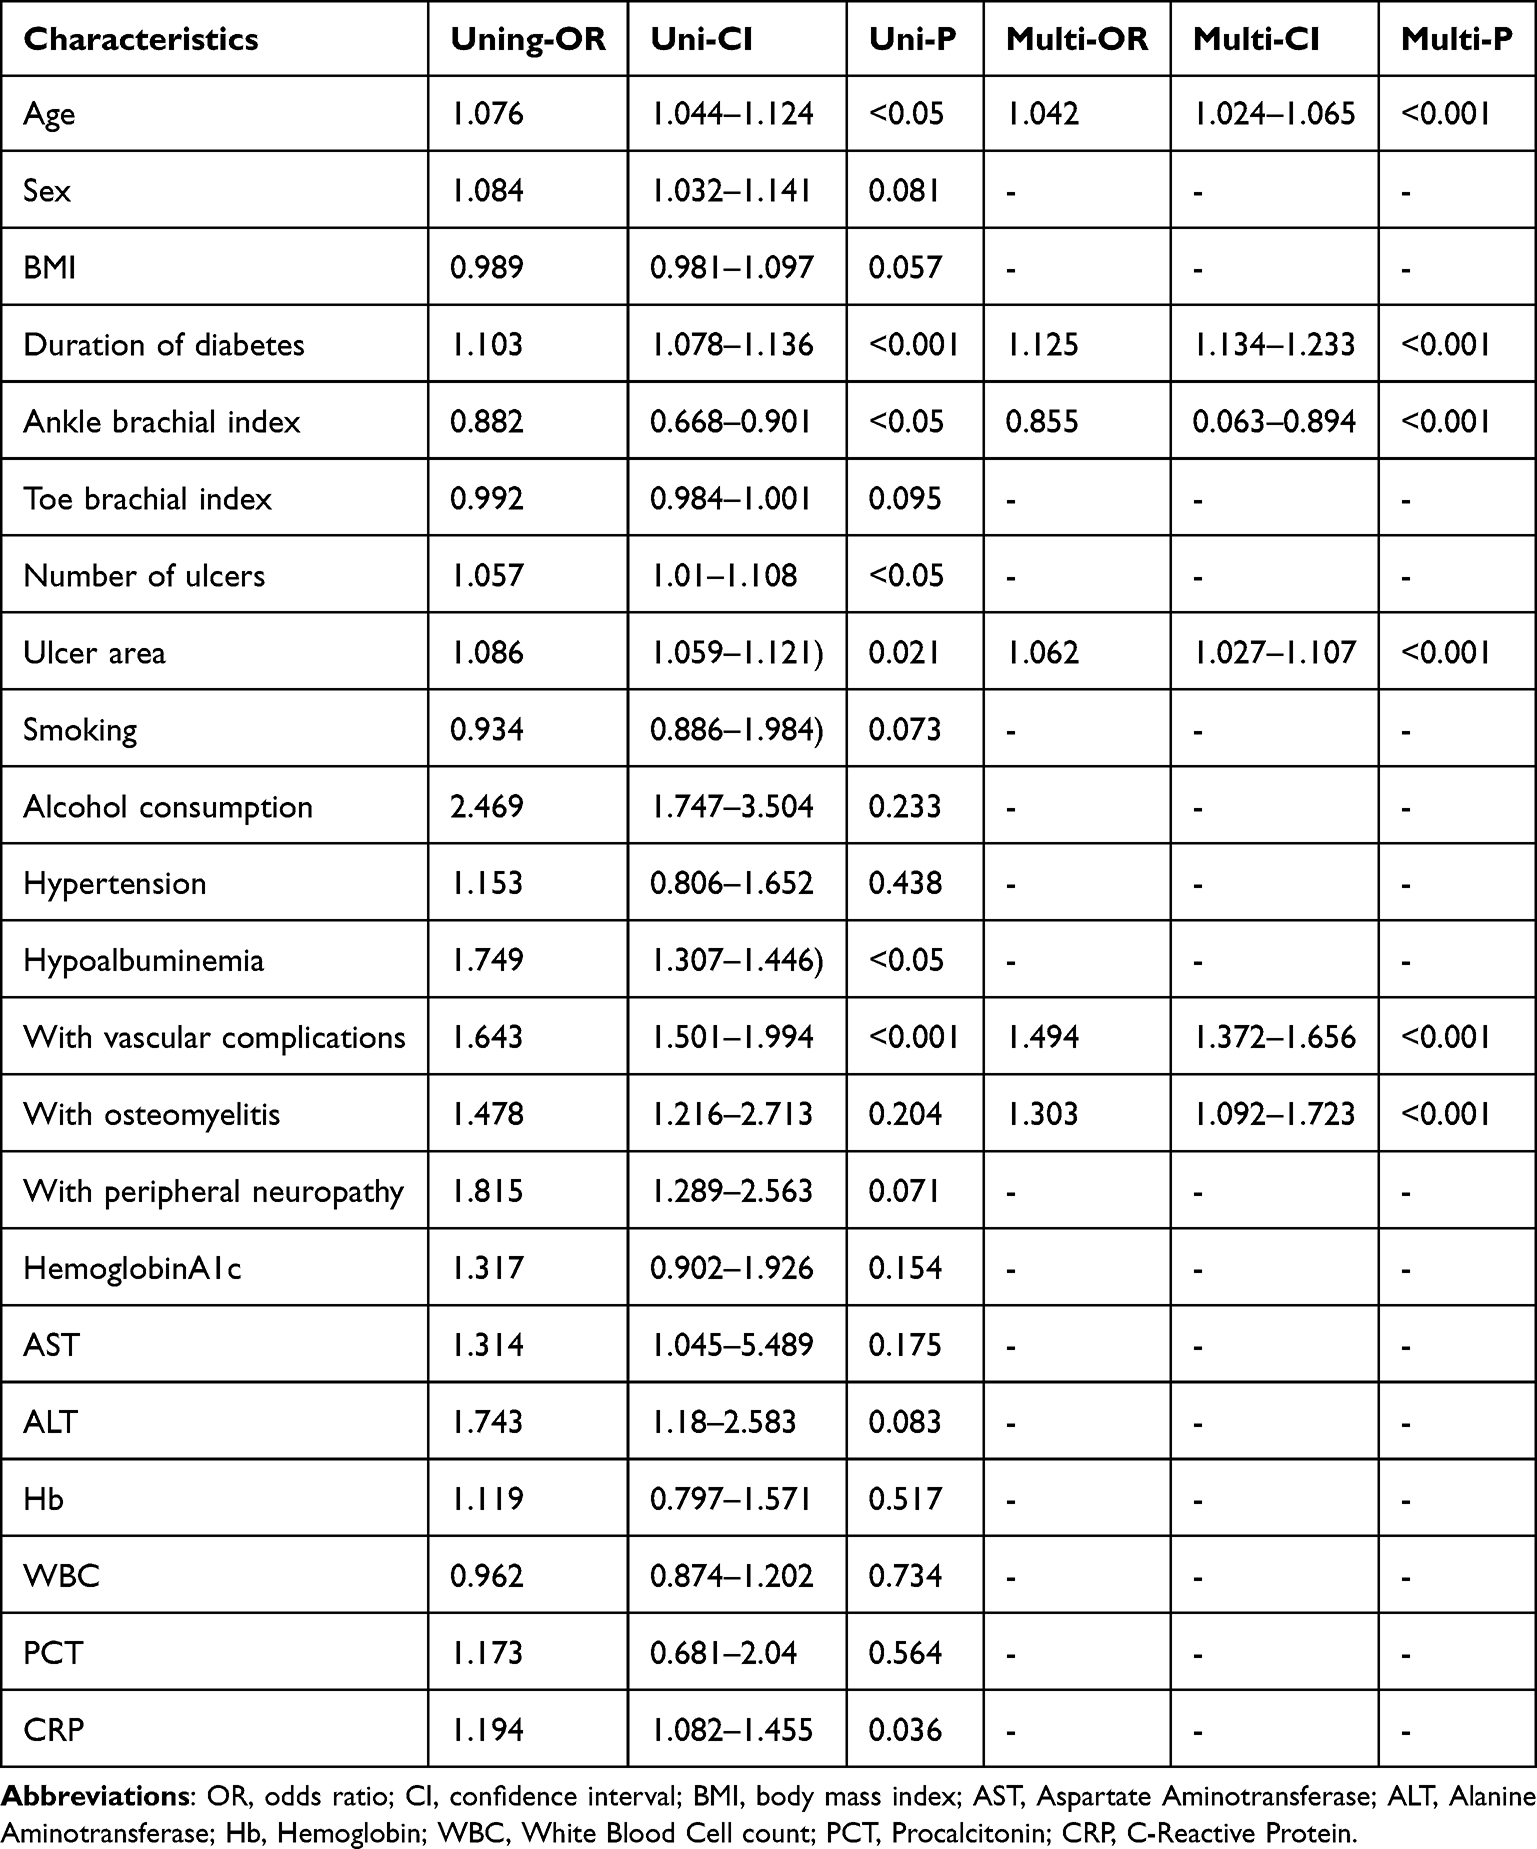 |
Table 2 Results of Univariate and Multivariate Logistic Regression Analysis |
The selected features reflected both systemic factors (such as age and duration of diabetes) and local wound characteristics (such as ulcer area and osteomyelitis status), emphasizing the multifactorial nature of wound infection in patients with diabetic foot ulcers.
Model Development and Performance
Eight machine learning algorithms, including Logistic Regression (LR), Decision Tree (DT), Random Forest (RF), Support Vector Machine (SVM), K-Nearest Neighbors (KNN), Naive Bayes (NBM), Extreme Gradient Boosting (XGB), and Light Gradient Boosting Machine (LGBM), were developed to predict wound infection in patients with diabetic foot ulcers. As shown in Figure 1A, the RF model demonstrated the highest discriminatory power for predicting wound infection, with an AUC of 0.937 (95% CI 0.906–0.969), followed by XGB (0.793), NBM (0.761), KNN (0.725), and DT (0.711). The LR, LGBM, and SVM models showed comparatively lower AUC values (0.692, 0.597, and 0.637, respectively). The superior ROC curve of the RF model indicated a stronger balance between sensitivity and specificity, reflecting its enhanced generalization ability in identifying infection risk. The detailed performance metrics of each algorithm are presented in Figure 1B. Across the seven evaluation indicators, namely F1-score, recall, precision, positive predictive value (PPV), negative predictive value (NPV), specificity, and sensitivity, the RF model consistently ranked highest in most metrics, achieving top scores in precision (0.76), NPV (0.94), and specificity (0.91). Overall, NBM and XGB models exhibited moderate performance, whereas LGBM and SVM showed lower predictive stability across metrics. Pairwise DeLong tests were performed to determine statistical differences in AUC values between models (Figure 1C). The RF model achieved significantly higher AUC values than all other models (P < 0.05 for all comparisons), confirming its superior predictive capability. Comparisons among other models, such as between DT and KNN or XGB and NBM, showed no statistically significant differences (P > 0.05). This analysis further supported the robustness and generalizability of the RF model in distinguishing patients with and without wound infection. Finally, a comprehensive ranking approach was used to evaluate the overall performance of each algorithm by aggregating their rankings across the eight evaluation metrics (Figure 1D). Each model received a score from 1 to 8 for each metric (best = 8, worst = 1), and the cumulative score was calculated. The RF model achieved the highest cumulative score of 63, indicating the best global performance, followed by NBM and XGB. The LGBM and SVM models ranked lowest due to their relatively poor predictive consistency.
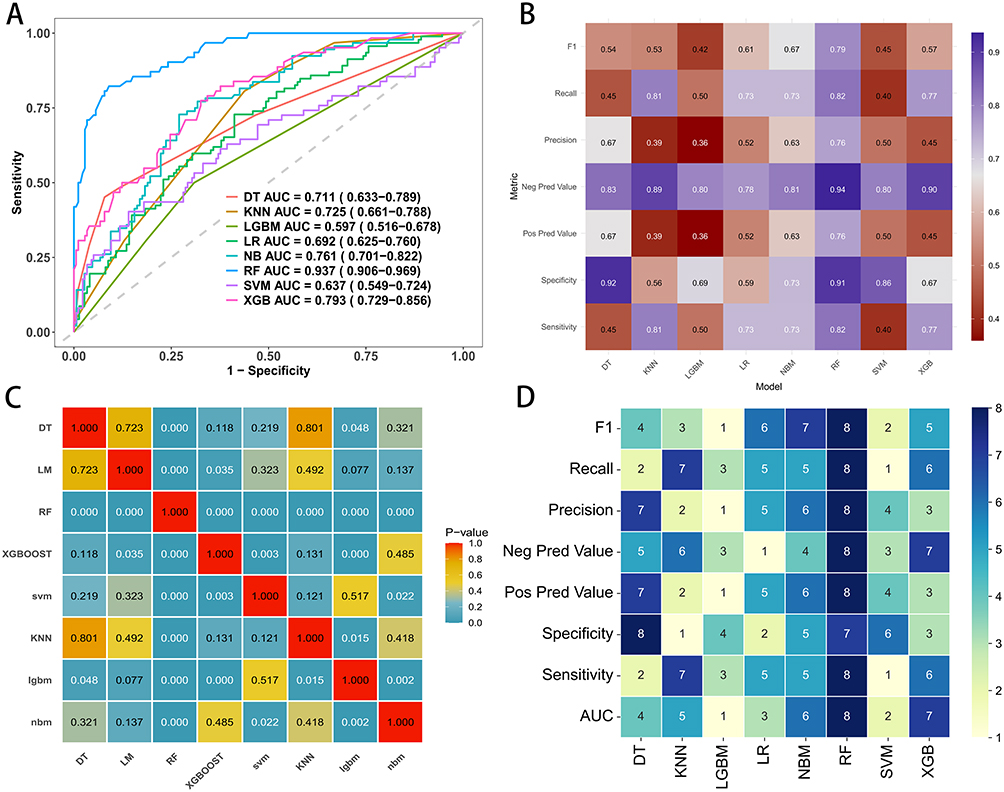 |
Figure 1 Performance comparison of machine learning models for predicting wound infection in patients with diabetic foot ulcers. (A) Receiver operating characteristic (ROC) curves for eight machine learning algorithms. (B) Heatmap comparison of evaluation metrics across models. (C) Pairwise statistical comparison of AUC values among different models, with color indicating P-values. (D) Ranking of model performance across metrics, where higher scores represent better relative ranking. |
Collectively, these findings demonstrated that the Random Forest model achieved the best and most stable performance in predicting wound infection among patients with diabetic foot ulcers and was thus selected for further interpretability analysis using the SHAP framework.
Model Performance on Both the Testing and External Validation Sets
The predictive performance of the Random Forest (RF) model was further evaluated in both the internal testing set and the external validation set to assess its discrimination, calibration, and clinical utility.
As shown in Figure 2A, the RF model demonstrated excellent discrimination in the testing cohort, with an AUC of 0.853 (95% CI 0.804–0.901). The ROC curve indicated a strong balance between sensitivity and specificity, suggesting good capability for distinguishing infected from non-infected cases. The calibration plot (Figure 2B) showed that the predicted probabilities closely matched the observed outcomes, indicating satisfactory model calibration. The calibration slope was 1.00 (0.74–1.26) with an intercept of approximately 0.00 (–0.33 to 0.33), demonstrating excellent agreement between predicted and actual infection risks. The decision curve analysis (DCA) (Figure 2C) showed that the RF model provided a higher net benefit across a wide range of threshold probabilities compared with the “treat-all” and “treat-none” strategies, indicating potential clinical usefulness for individualized risk evaluation. In addition, five-fold cross-validation results (Figure 2D) confirmed the model’s stability and reproducibility, with AUC values ranging from 0.763 to 0.909 and a mean AUC of 0.820 (95% CI 0.759–0.880). These findings collectively verified that the RF model exhibited strong discrimination and favorable calibration in the testing set.
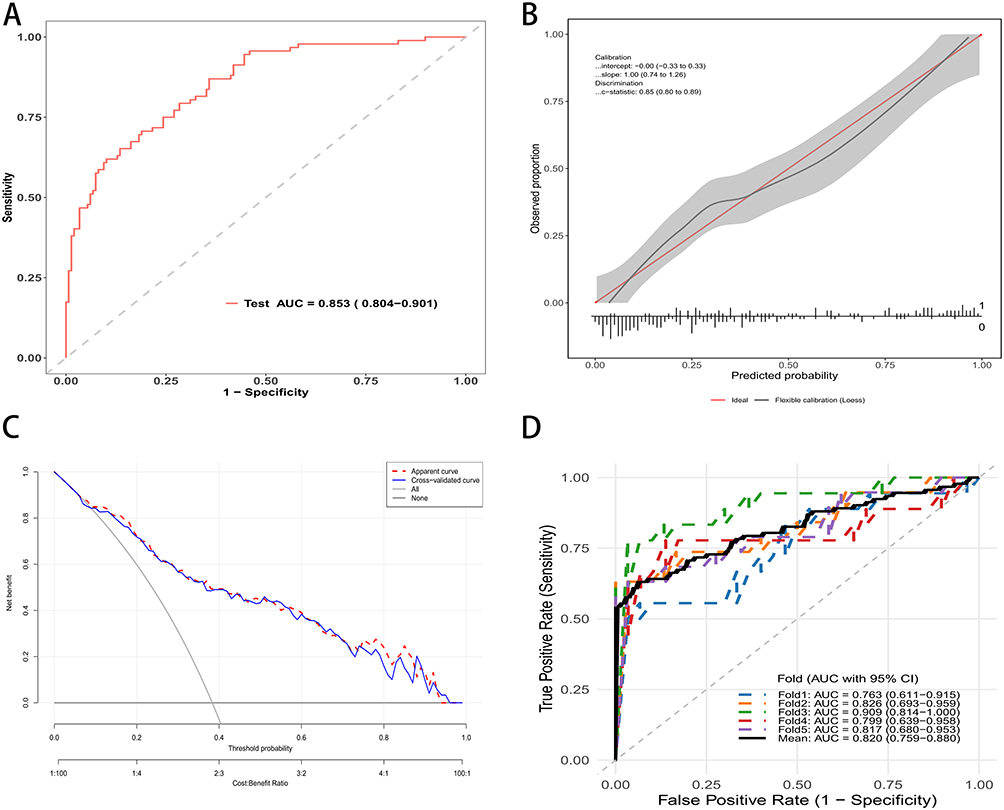 |
Figure 2 Performance evaluation of the Random Forest model in the test set. (A) Receiver operating characteristic (ROC) curve of the RF model with an AUC of 0.853 (95% CI: 0.804–0.901). (B) Calibration curve showing good agreement between predicted and observed probabilities; the gray band indicates the 95% confidence interval. (C) Decision curve analysis demonstrating the clinical utility of the model across a range of threshold probabilities. (D) ROC curves of fivefold cross-validation showing consistent model performance across folds with a mean AUC of 0.820 (95% CI: 0.759–0.880). |
The model’s generalizability was further examined using the external validation cohort. As illustrated in Figure 3A, the RF model achieved an AUC of 0.832 (95% CI 0.779–0.885), which remained comparable to that in the testing set, confirming its robust discriminative ability across independent data. The calibration curve (Figure 3B) demonstrated excellent agreement between predicted and observed probabilities, with a slope of 1.00 (0.72–1.28), an intercept of 0.00 (–0.32 to 0.32). These findings indicated that the RF model remained well-calibrated in the external dataset. The DCA curve (Figure 3C) showed consistent clinical net benefit in the validation cohort, suggesting that applying the RF model for infection risk prediction would yield greater clinical value than indiscriminate treatment strategies.
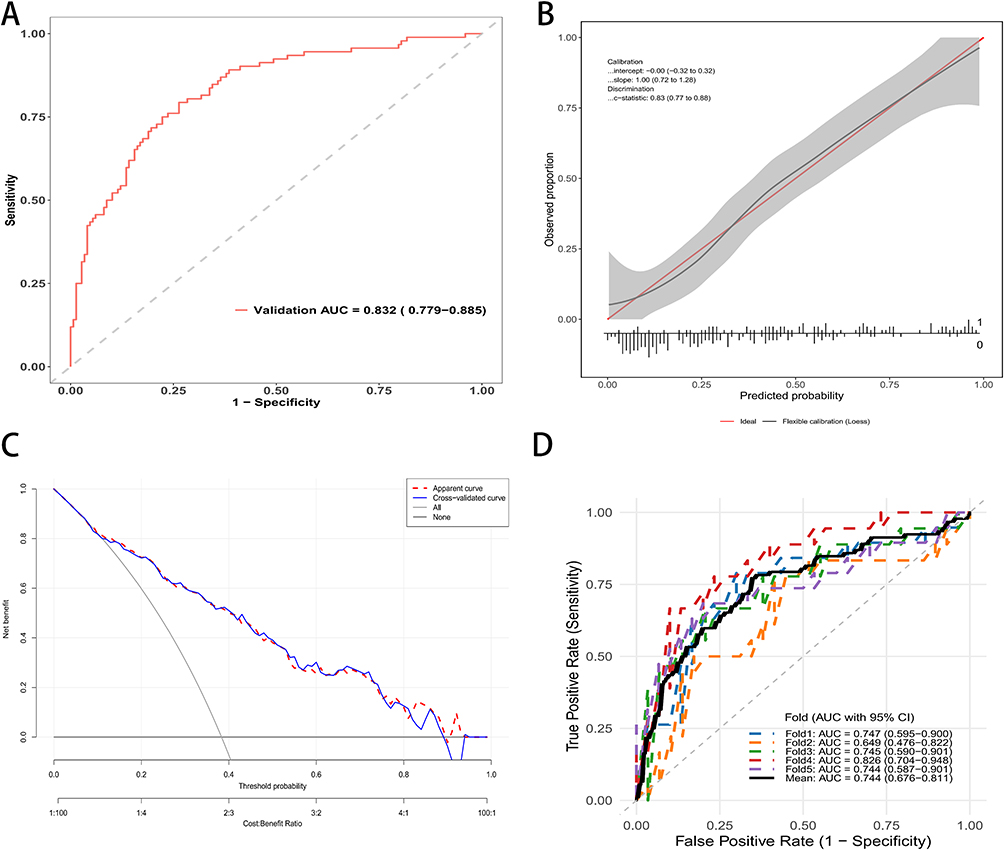 |
Figure 3 Performance evaluation of the Random Forest model in the validation set. (A) Receiver operating characteristic (ROC) curve of the RF model with an AUC of 0.832 (95% CI: 0.779–0.885). (B) Calibration curve demonstrating good agreement between predicted and observed probabilities; the gray band represents the 95% confidence interval. (C) Decision curve analysis indicating favorable clinical net benefit of the model across a wide range of threshold probabilities. (D) ROC curves from fivefold cross-validation showing stable discriminative performance with a mean AUC of 0.744 (95% CI: 0.676–0.811). |
Finally, five-fold cross-validation (Figure 3D) confirmed the model’s reproducibility, with AUCs ranging from 0.644 to 0.826 and an average AUC of 0.744 (95% CI 0.676–0.811). Taken together, these validation results demonstrated that the RF model possessed good generalizability and reliable predictive performance across both internal and external cohorts.
Model Interpretation
As shown in Figure 4A, the SHAP summary plot demonstrated the distribution and direction of feature contributions for each patient. Features in the upper part of the plot made stronger contributions to model prediction. With vascular complications, with osteomyelitis, and ankle brachial index had the greatest impact on infection risk, followed by duration of diabetes, ulcer area, and age. A higher SHAP value corresponded to a stronger positive influence on infection probability. High values of with vascular complications and with osteomyelitis were associated with substantial increases in predicted infection risk. Conversely, a higher ankle brachial index was negatively correlated with infection probability, suggesting that better lower-extremity perfusion was protective. The mean absolute SHAP value plot (Figure 4B) confirmed the same ranking of feature importance. With vascular complications and with osteomyelitis showed the largest average SHAP values, indicating they exerted the most pronounced effects on model output. In contrast, age and ulcer area contributed less but still provided meaningful information for the overall prediction.
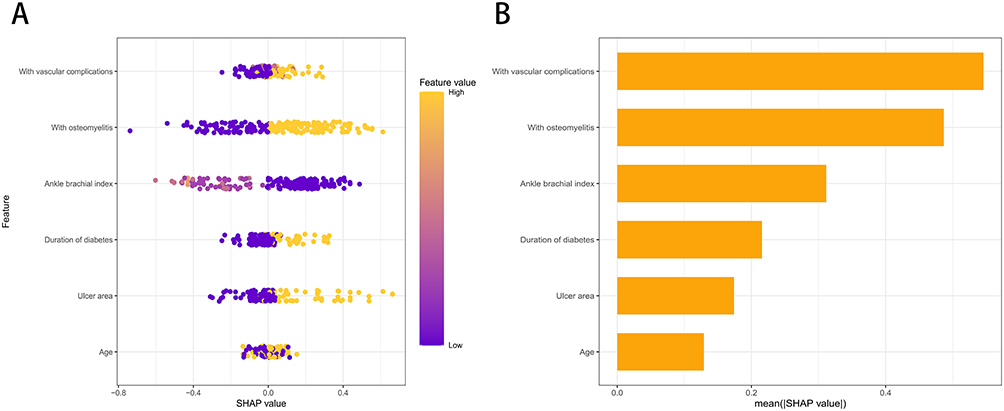 |
Figure 4 SHAP analysis of feature importance in the Random Forest model. (A) SHAP summary plot illustrating the impact of each feature on DFU infection prediction. The horizontal axis represents the SHAP value: points to the right of the center line indicate an increased risk of infection, while points to the left indicate a decreased risk. The color codes the feature value for each patient (Yellow = High; Purple = Low). Clinically, the presence of Vascular Complications and Osteomyelitis (yellow points) strongly correlates with increased risk. In contrast, for Ankle Brachial Index (ABI), lower values (purple points) are associated with higher risk, highlighting poor perfusion as a critical driver of infection. (B) Global feature importance ranking based on the mean absolute SHAP values. Longer bars indicate variables that have a greater overall influence on the model’s predictive performance. |
The SHAP analysis in our study validates the biological plausibility of the model by confirming known risk factors such as osteomyelitis and ABI. However, its unique value lies in quantifying the specific contribution of each feature for an individual patient. To bridge the gap between statistical interpretation and clinical practice, we illustrate the model’s decision-making process using the two patient scenarios presented in Figure 5.
 |
Figure 5 SHAP waterfall plots illustrating feature contributions to individual predictions of wound infection in patients with diabetic foot ulcers. (A) Example of a positive case showing how each feature contributes to increasing the predicted risk of postoperative infection. (B) Example of a negative case showing how features contribute to decreasing the predicted risk. Yellow bars represent features with positive contributions (increasing predicted probability), while red bars represent features with negative contributions (decreasing predicted probability). |
Figure 5A depicts a 61-year-old patient with a short diabetes duration of less than 5 years and a small ulcer area of less than 4 cm2. Clinically, these factors might suggest a milder condition, and indeed, the SHAP values show they contributed to lowering the risk score. However, the model identified critical systemic vulnerabilities. The presence of vascular complications, concurrent osteomyelitis, and a low ABI of 0.57 acted as powerful positive drivers. Specifically, vascular complications alone added significant weight to the risk prediction (+0.0709). Consequently, despite the patient’s relatively young age and small wound, the model aggregated these factors to output a high predicted probability of 0.657. This alerts the clinician that systemic vascular deficits override the seemingly benign local wound appearance.
In contrast, Figure 5B presents an 83-year-old patient who also has osteomyelitis. Traditional clinical intuition might flag this elderly patient with a bone infection as high risk. The SHAP analysis confirms that age and osteomyelitis indeed pushed the risk score upward. However, the model successfully balanced these against strong protective factors. The absence of vascular complications provided the largest reduction in risk (−0.107), supported by a healthy ABI of 0.91 and a short duration of diabetes. These protective systemic factors outweighed the risks associated with age and local bone infection, resulting in a final predicted probability of 0.407, which is well below the baseline average. This demonstrates the model’s capacity to identify patients who, despite advanced age and infection, have sufficient physiological reserve to potentially respond well to conservative management.
Together, these findings confirmed that the Random Forest model produced clinically interpretable and biologically plausible predictions. The SHAP analysis effectively identified both global feature contributions and patient-specific risk patterns, enhancing the model’s transparency and supporting its application in individualized infection risk assessment for diabetic foot ulcers.
Discussion
This study developed and validated eight machine learning models to predict wound infection in patients with diabetic foot ulcers (DFUs) using routinely collected clinical parameters. Among these models, the random forest (RF) algorithm achieved the best overall performance in both internal and external validation cohorts, demonstrating strong discriminative ability and good generalizability. Based on feature selection and SHAP interpretation, six key variables including age, duration of diabetes, ankle brachial index (ABI), ulcer area, vascular complications, and osteomyelitis were identified as the most important predictors of wound infection.
The identification of these variables is consistent with clinical understanding. Older age is often accompanied by impaired immune function, weaker microcirculation, and slower wound healing, which collectively increase the risk of infection.18 The duration of diabetes reflects the degree of chronic metabolic dysregulation that damages microvascular and immune function.19 A reduced ABI indicates peripheral arterial disease, which compromises tissue oxygenation and antibiotic delivery.20 In addition, a larger ulcer area represents more extensive tissue destruction that provides favorable conditions for bacterial colonization.21 The presence of vascular complications and osteomyelitis further aggravates ischemia and chronic inflammation, predisposing wounds to persistent infection.22 Together, these features capture both systemic and local mechanisms that contribute to diabetic foot infection.
Compared with traditional regression-based approaches, the machine learning models capture non-linear relationships and complex feature interactions that conventional analyses often overlook.23 The ensemble structure of the RF model allows it to handle heterogeneous clinical data with strong robustness and adaptability, thus explaining its superior performance. Consistent results from internal cross-validation and external testing support the reliability and generalization ability of the model across different populations. The use of SHAP analysis further enhances transparency by providing an interpretable relationship between predictors and model outcomes.24 The SHAP summary and bar plots illustrated the global importance of the six key features, while the waterfall plots presented their individual contributions, helping clinicians understand how these variables influence infection risk in specific patients.
While our machine learning model demonstrates favorable predictive capability, it is crucial to define its role within the clinical workflow accurately. We emphasize that this model is designed to serve as an adjunctive decision-support tool rather than a replacement for clinical judgment. The predictors used, such as ABI and osteomyelitis, are standard clinical metrics, but our model adds value by integrating them into a quantitative risk probability. This allows for more objective risk stratification, helping clinicians identify high-risk patients who might otherwise be overlooked by traditional categorical staging. Ultimately, the final treatment decision should remain in the hands of the clinician, who must integrate this model’s output with the patient’s comprehensive history, physical examination, and individual preferences. The intended clinical use case for this machine learning model is at the point of hospital admission or initial specialist consultation. By inputting six routinely available clinical indicators, the model serves as an early risk stratification tool. Specifically, for patients identified as high-risk by the model, clinicians are advised to adopt a more aggressive management strategy, including closer wound surveillance, early consultation for vascular intervention, and consideration of broad-spectrum empiric antibiotics before culture results are available. Conversely, for low-risk patients, standard wound care protocols and outpatient follow-up may be sufficient, thereby optimizing the allocation of medical resources and avoiding overtreatment.
Currently, clinical assessment of DFU infection primarily relies on standardized classification systems like the Infectious Diseases Society of America and International Working Group on the Diabetic Foot (IDSA/IWGDF) classification or the Perfusion, Extent, Depth, Infection, and Sensation (PEDIS) scoring system. These tools are invaluable for categorizing the severity of established infections and guiding initial antibiotic choices. However, they are predominantly descriptive and categorical. They focus heavily on local wound characteristics while potentially underweighting the complex interactions of systemic risk factors. In contrast, our machine learning approach offers two distinct advantages. First, it transforms categorical staging into a quantitative and individualized probability score. This allows for more granular risk stratification than the broad categories of traditional guidelines. Second, by integrating systemic indicators such as age, diabetes duration, and ABI with local wound metrics, our model captures the patient-specific physiological context that contributes to susceptibility. Therefore, this model is intended to complement existing guidelines by identifying high-risk patients who may not yet exhibit severe local symptoms but possess a high systemic vulnerability.
While the Area Under the Receiver Operating Characteristic Curve demonstrates the model’s acceptable statistical discrimination, we recognize that a high AUC alone does not guarantee clinical utility. To assess the practical value of the model, we relied on Decision Curve Analysis. The results indicate that our RF model provides a positive net benefit across a wide range of threshold probabilities, particularly between 10% and 60%. This range is clinically significant because it covers the typical decision thresholds a clinician might use for deciding whether to initiate closer monitoring or empiric antibiotics. For instance, in a clinical setting where a doctor sets a low threshold for intervention due to the high cost of missing an infection, using this model yields a higher net benefit than a “treat-all” or “treat-none” strategy. This means that, theoretically, the model allows clinicians to identify more true high-risk patients without increasing the rate of unnecessary interventions for false positives. Therefore, the clinical meaningfulness of this model lies not just in its predictive accuracy, but in its potential to optimize resource allocation by reducing unnecessary medical burden while maintaining high sensitivity for at-risk patients.
Nevertheless, several limitations should be acknowledged. First, the retrospective design may introduce selection or information bias. Second, both the development and validation cohorts were derived from a single-country healthcare setting. This geographic homogeneity may restrict the generalizability of our findings to other ethnic groups or healthcare systems with different patient characteristics. Although the sample size is adequate for model development and internal validation, larger multicenter studies are required to further verify the robustness and applicability of the model. Third, microbiological and imaging information was not consistently available, limiting the ability to capture all infection-related features. Although the calibration slopes for both internal and external validation were ideal (1.00), the 95% confidence intervals remained relatively wide (0.74–1.26 and 0.72–1.28, respectively). The observed width of the confidence intervals suggests that while the model is accurate on average, risk estimation may be unstable for specific patient subsets, likely due to limited sample sizes in the extreme tails of the risk distribution. Therefore, future studies require larger datasets to narrow these intervals and improve the precision of individualized predictions. Beyond sample size, subsequent research should also integrate longitudinal, imaging, and microbiological data to build more comprehensive predictive frameworks. Ultimately, prospective evaluation in real-world clinical settings will be essential to definitively confirm the model’s utility and impact on patient outcomes.
Conclusion
In conclusion, this study developed and validated eight machine learning models for predicting wound infection in patients with diabetic foot ulcers, with the Random Forest model demonstrating superior predictive performance and generalizability. Six key variables, including age, diabetes duration, ankle-brachial index, ulcer area, vascular complications, and osteomyelitis, were identified as the most influential predictors. Collectively, these factors reflect the systemic metabolic impairment, peripheral ischemia, and local tissue damage that drive infection risk. Consequently, the proposed model offers an accurate and interpretable tool for early risk stratification. Its clinical implementation could facilitate the early identification of high-risk patients, thereby enabling timely interventions and improving prognoses. Future multicenter prospective studies are necessary to further validate the model and support its integration into intelligent clinical decision-support systems.
Data Sharing Statement
All original data can be available from the corresponding author upon request.
Ethical Approval and Consent to Participate
The study was conducted in accordance with the Declaration of Helsinki and was approved by the Ethics Committee of The First Affiliated Hospital of Henan Medical University (Approval No. EC-2025-749). The requirement for informed consent was waived by the Ethics Committee due to the retrospective nature of the study.
Acknowledgments
This study was generously supported by Jingding Medical Tech, to whom we extend our sincere gratitude. We especially thank them for providing authorization and technical support for the JD_DCPM software. The team at Jingding Medical Tech offered invaluable assistance in data processing.
Author Contributions
All authors made a significant contribution to the work reported, whether that is in the conception, study design, execution, acquisition of data, analysis and interpretation, or in all these areas; took part in drafting, revising or critically reviewing the article; gave final approval of the version to be published; have agreed on the journal to which the article has been submitted; and agree to be accountable for all aspects of the work.
Specific contributions were as follows: Xingguo Nie was responsible for conceptualization, methodology, software, formal analysis, and drafting the original manuscript. Yang Jiang, Xiangyan Meng, and Ju Liu focused on data curation and investigation. Haijian Zhao and Yundong Chen handled visualization and validation, while Junbo Wang contributed to investigation and resources. Tan Lu provided conceptualization, supervision, and project administration. Critically, all authors, including Yang Jiang, Xiangyan Meng, Ju Liu, Haijian Zhao, Yundong Chen, and Junbo Wang, participated in the review and editing of the manuscript.
Funding
The authors received no financial support for the research, authorship, and/or publication of this article.
Disclosure
The authors have no conflicts of interest.
References
1. Mariam TG, Alemayehu A, Tesfaye E, et al. Prevalence of diabetic foot ulcer and associated factors among adult diabetic patients who attend the diabetic follow-up clinic at the university of gondar referral hospital, north west Ethiopia, 2016: institutional-based cross-sectional study. J. Diabetes Res. 2017;2017:1–15. doi:10.1155/2017/2879249
2. Hicks CW, Selvarajah S, Mathioudakis N, et al. Burden of infected diabetic foot ulcers on hospital admissions and costs. Ann Vasc Surg. 2016;33:149–158. doi:10.1016/j.avsg.2015.11.025
3. Oswal MN, P OB, D’Souza R, et al. The analysis of the diabetic foot osteomyelitis at a tertiary care center - a prospective study. jemds. 2015;04:1906–1911. doi:10.14260/jemds/2015/276
4. Qi X, Li Y, Xiang Y, et al. Hyperthermia-enhanced immunoregulation hydrogel for oxygenation and ROS neutralization in diabetic foot ulcers. Cell Biomaterials. 2025;1:100020. doi:10.1016/j.celbio.2025.100020
5. Cheng S, Wang H, Pan X, et al. Dendritic hydrogels with robust inherent antibacterial properties for promoting bacteria-infected wound healing. ACS Appl Mater Interfaces. 2022;14:11144–11155. doi:10.1021/acsami.1c25014
6. Gong H, Ren Y, Li Z, et al. Clinical characteristics and risk factors of lower extremity amputation in the diabetic inpatients with foot ulcers. Front Endocrinol. 2023;14:1144806. doi:10.3389/fendo.2023.1144806
7. Tanaka M, Kohjitani H, Yamamoto E, et al. Development of interpretable machine learning models to predict in‐hospital prognosis of acute heart failure patients. ESC Heart Failure. 2024;11:2798–2812. doi:10.1002/ehf2.14834
8. Wang S, Wang J, Zhu MX, et al. Machine learning for the prediction of minor amputation in university of Texas grade 3 diabetic foot ulcers. PLoS One. 2022;17:e0278445. doi:10.1371/journal.pone.0278445
9. Gulshan V, Peng L, Coram M, et al. Development and validation of a deep learning algorithm for detection of diabetic retinopathy in retinal fundus photographs. JAMA. 2016;316:2402. doi:10.1001/jama.2016.17216
10. Alhubail A, Sewify M, Messenger G, et al. Microbiological profile of diabetic foot ulcers in Kuwait. PLoS One. 2020;15:e0244306. doi:10.1371/journal.pone.0244306
11. Almufadi N, Alhasson HF. Classification of diabetic foot ulcers from images using machine learning approach. Diagnostics. 2024;14:1807. doi:10.3390/diagnostics14161807
12. Goyal M, Reeves ND, Rajbhandari S, et al. Robust methods for real-time diabetic foot ulcer detection and localization on mobile devices. IEEE J Biomed Health Inform. 2019;23:1730–1741. doi:10.1109/JBHI.2018.2868656
13. Barwell ND, Devers MC, Kennon B, et al. Diabetic foot infection: antibiotic therapy and good practice recommendations. Int J Clin Pract. 2017;71:e13006. doi:10.1111/ijcp.13006
14. Monteiro‐Soares M, Hamilton EJ, Russell DA, et al. Guidelines on the classification of foot ulcers in people with diabetes (IWGDF 2023 update). Diabetes Metabolism Res. 2024;40:e3648. doi:10.1002/dmrr.3648
15. Malone M, Erasmus A, Schwarzer S, et al. Utilisation of the 2019 IWGDF diabetic foot infection guidelines to benchmark practice and improve the delivery of care in persons with diabetic foot infections. J. Foot Ankle Res. 2021;14:10. doi:10.1186/s13047-021-00448-w
16. Salutini E, Brocco E, Da Ros R, et al. The complexity of diabetic foot management: from common care to best practice. The Italian expert opinion by delphi survey. Int J Low Extrem Wounds. 2020;19:34–43. doi:10.1177/1534734619890814
17. Parker CN, Van Netten JJ, Parker TJ, et al. Differences between national and international guidelines for the management of diabetic foot disease. Diabetes Metabolism Res. 2019;35:e3101. doi:10.1002/dmrr.3101
18. Prompers L, Huijberts M, Apelqvist J, et al. High prevalence of ischaemia, infection and serious comorbidity in patients with diabetic foot disease in Europe. Baseline results from the eurodiale study. Diabetologia. 2007;50:18–25. doi:10.1007/s00125-006-0491-1
19. Guo Q, Ying G, Jing O, et al. Influencing factors for the recurrence of diabetic foot ulcers: a meta‐analysis. Int Wound J. 2023;20:1762–1775. doi:10.1111/iwj.14017
20. Ugwu E, Adeleye O, Gezawa I, et al. Predictors of lower extremity amputation in patients with diabetic foot ulcer: findings from MEDFUN, a multi‐center observational study. J. Foot Ankle Res. 2019;12:34.
21. Uysal S, Arda B, Taşbakan MI, et al. Risk factors for amputation in patients with diabetic foot infection: a prospective study. Int Wound J. 2017;14:1219–1224. doi:10.1111/iwj.12788
22. Prompers L, Schaper N, Apelqvist J, et al. Prediction of outcome in individuals with diabetic foot ulcers: focus on the differences between individuals with and without peripheral arterial disease. The EURODIALE study. Diabetologia. 2008;51:747–755. doi:10.1007/s00125-008-0940-0
23. Tao H, You L, Huang Y, et al. An interpreting machine learning models to predict amputation risk in patients with diabetic foot ulcers: a multi-center study. Front Endocrinol. 2025;16:1526098. doi:10.3389/fendo.2025.1526098
24. Emi-Johnson OG, Nkrumah KJ. Predicting 30-day hospital readmission in patients with diabetes using machine learning on electronic health record data. Cureus. 2025;17. doi:10.7759/cureus.82437.
 © 2026 The Author(s). This work is published and licensed by Dove Medical Press Limited. The
full terms of this license are available at https://www.dovepress.com/terms
and incorporate the Creative Commons Attribution
- Non Commercial (unported, 4.0) License.
By accessing the work you hereby accept the Terms. Non-commercial uses of the work are permitted
without any further permission from Dove Medical Press Limited, provided the work is properly
attributed. For permission for commercial use of this work, please see paragraphs 4.2 and 5 of our Terms.
© 2026 The Author(s). This work is published and licensed by Dove Medical Press Limited. The
full terms of this license are available at https://www.dovepress.com/terms
and incorporate the Creative Commons Attribution
- Non Commercial (unported, 4.0) License.
By accessing the work you hereby accept the Terms. Non-commercial uses of the work are permitted
without any further permission from Dove Medical Press Limited, provided the work is properly
attributed. For permission for commercial use of this work, please see paragraphs 4.2 and 5 of our Terms.
Recommended articles
A Predictive Machine Learning Tool for Asthma Exacerbations: Results from a 12-Week, Open-Label Study Using an Electronic Multi-Dose Dry Powder Inhaler with Integrated Sensors

Lugogo NL, DePietro M, Reich M, Merchant R, Chrystyn H, Pleasants R, Granovsky L, Li T, Hill T, Brown RW, Safioti G
Journal of Asthma and Allergy 2022, 15:1623-1637
Published Date: 11 November 2022
Machine Learning Prediction of Residual and Recurrent High-Grade CIN Post-LEEP
Zhai F, Mu S, Song Y, Zhang M, Zhang C, Lv Z
Cancer Management and Research 2024, 16:1175-1187
Published Date: 6 September 2024
Predicting the Recurrence of Ovarian Cancer Based on Machine Learning
Zhou L, Hong H, Chu F, Chen X, Wang C
Cancer Management and Research 2024, 16:1375-1387
Published Date: 9 October 2024
Development and Validation of a Machine Learning Model for Predicting Osteoporosis in Patients with Parkinson’s Disease
Liang Y, Yin Y, Zhen K, Lin H, Yu G, Li X
Neuropsychiatric Disease and Treatment 2026, 22:582787
Published Date: 17 February 2026
Development and Interpretable Machine Learning-Based Prediction of Cardiovascular Disease Risk in Chinese COPD Patients: An Analysis of the CHARLS Database
Yuan Y, Zhu J, Zhao X, Huang Q, Li J, Wang Y, Liu W, Chen M, Li D, Wu B, Li W, Wu D
International Journal of Chronic Obstructive Pulmonary Disease 2026, 21:590631
Published Date: 25 May 2026