Back to Journals » Neuropsychiatric Disease and Treatment » Volume 22
Development and Validation of a Machine Learning Model for Predicting Osteoporosis in Patients with Parkinson’s Disease
Authors Liang Y, Yin Y, Zhen K ![]() , Lin H, Yu G
, Lin H, Yu G ![]() , Li X
, Li X ![]()
Received 10 December 2025
Accepted for publication 30 January 2026
Published 17 February 2026 Volume 2026:22 582787
DOI https://doi.org/10.2147/NDT.S582787
Checked for plagiarism Yes
Review by Single anonymous peer review
Peer reviewer comments 4
Editor who approved publication: Professor Taro Kishi
Yixin Liang,1 Yiming Yin,2 Kun Zhen,3 Hongxiao Lin,4 Guran Yu,1 Xin Li5
1Department of Neurology, The Affiliated Hospital of Nanjing University of Chinese Medicine, Nanjing, Jiangsu, 210029, People’s Republic of China; 2Department of Neurology, Xuzhou Central Hospital, XuZhou, Jiangsu, 221000, People’s Republic of China; 3Department of Neurology, Nanjing University of Chinese Medicine Affiliated Hospital of Lianyungang, Lianyungang, Jiangsu, 222001, People’s Republic of China; 4Department of Osteoporosis, The Affiliated Lianyungang Hospital of Xuzhou Medical University (The First People’s Hospital of Lianyungang), Lianyungang, Jiangsu, 222061, People’s Republic of China; 5Department of Orthopedics, The Affiliated Lianyungang Hospital of Xuzhou Medical University (The First People’s Hospital of Lianyungang), Lianyungang, Jiangsu, 222061, People’s Republic of China
Correspondence: Guran Yu, The Affiliated Hospital of Nanjing University of Chinese Medicine, Nanjing, Jiangsu, People’s Republic of China, Email [email protected] Xin Li, The Affiliated Lianyungang Hospital of Xuzhou Medical University (The First People’s Hospital of Lianyungang), Lianyungang, Jiangsu, People’s Republic of China, Email [email protected]
Purpose: To develop and externally validate machine-learning models for predicting osteoporosis in patients with Parkinson’s disease (PD) using routinely collected clinical and treatment-related variables.
Methods: We assembled a multicenter retrospective cohort of 3,935 adults with PD, of whom 907 (23.1%) had osteoporosis. Candidate predictors included demographics, lifestyle factors, comorbidities, PD duration and severity, and medication exposures. Features were selected with least absolute shrinkage and selection operator, and nine classifiers were trained in the development cohort. Discrimination was evaluated by area under the receiver operating characteristic curve (AUC), calibration by decile-based plots and logistic recalibration, and clinical utility by decision-curve analysis. Models were assessed in an internal testing cohort and an independent external cohort processed with the same pipeline. Kernel SHAP was used for model interpretability.
Results: Across development, internal testing, and external validation cohorts, models yielded moderate-to-high discrimination with generally favorable calibration. Neural network (AUC = 0.937) achieved the best performance, with support vector machine and random forest also showing strong discrimination (both AUC = 0.935). Decision-curve analysis showed higher net benefit than “treat all” or “treat none” across clinically relevant thresholds. SHAP analyses indicated that lower body mass index, higher Hoehn–Yahr stage, longer disease duration, prior fracture, family history of osteoporosis, sarcopenia, and steroid or proton-pump inhibitor use were major contributors to predicted risk.
Conclusion: Machine-learning models based on routinely available clinical data provide transportable risk stratification for osteoporosis in PD, demonstrating good calibration and meaningful clinical utility. These tools may support targeted screening and individualized management to mitigate fracture risk in this vulnerable population.
Keywords: bone mineral density, external validation, decision curve analysis, calibration, SHAP
Introduction
Osteoporosis is a systemic skeletal disorder characterized by reduced bone mass and impaired bone microarchitecture, which markedly increases the risk of fragility fractures.1,2 In the general elderly population, osteoporosis represents a major public health burden, but in patients with Parkinson’s disease (PD) this risk is particularly pronounced.3,4 Parkinson’s disease is a progressive neurodegenerative disorder characterized not only by motor dysfunction but also by non-motor comorbidities that increase skeletal fragility.5,6 Factors such as impaired mobility, postural instability, frequent falls, reduced sunlight exposure, altered nutrition, and long-term medication use further contribute to the development of osteoporosis in these patients.7–10 Several epidemiological studies have reported that the prevalence of osteoporosis and fracture incidence in PD patients is significantly higher than in age-matched controls, and fractures in this population often lead to prolonged hospitalization, loss of independence, and increased mortality.4,11
Early identification of osteoporosis in PD patients is therefore essential for timely intervention and prevention of fractures. However, conventional clinical tools, such as the Fracture Risk Assessment Tool (FRAX), were designed for the general population and do not incorporate PD-specific risk factors.12 Disease duration, Hoehn–Yahr stage, frequency of falls, use of walking aids, and exposure to medications such as corticosteroids, proton pump inhibitors, or selective serotonin reuptake inhibitors are relevant in the PD setting but are not adequately captured by traditional models.13–16 As a result, clinicians often lack reliable methods to stratify osteoporosis risk in PD patients, which may delay the initiation of preventive therapy.
In recent years, machine learning (ML) has emerged as a promising approach for clinical risk prediction. Unlike conventional regression-based methods, ML can handle complex, nonlinear relationships and interactions among multiple variables, offering superior accuracy in high-dimensional datasets. ML algorithms have already demonstrated value in neurology, including prediction of cognitive decline, disease progression, and treatment outcomes in PD, as well as in metabolic bone diseases, where they have been used to predict bone mineral density, osteoporosis, and fracture risk.17–19 Recent methodological work has also explored hybrid frameworks combining machine learning and fuzzy logic to improve osteoporosis risk prediction.20 Despite these advances, few studies have specifically applied ML to predict osteoporosis in PD patients, and those that exist are limited by small sample sizes, single-center designs, or lack of external validation.
To address these gaps, we conducted a multicenter retrospective cohort study including 3935 PD patients across three tertiary hospitals in China. Our objective was to develop and externally validate machine learning models for predicting osteoporosis in PD, using a comprehensive set of demographics, lifestyle, clinical, and treatment-related variables. By incorporating PD-specific predictors and applying modern ML methods with external validation, we sought to establish a robust and interpretable prediction tool that could support individualized risk stratification and guide early preventive strategies in this vulnerable population.
Materials and Methods
Study Design
This was a multicenter, retrospective cohort study conducted at three tertiary teaching hospitals in China between January 2019 and December 2024. Two centers contributed data to the development cohort, and one center provided an independent external validation cohort. The study was designed and reported according to the TRIPOD (Transparent Reporting of a multivariable prediction model for Individual Prognosis or Diagnosis) statement.21 This study was approved by the institutional review board of the participating hospital, and the requirement for informed consent was waived due to the retrospective design and anonymization of patient data.
Study Population
We included patients with a confirmed diagnosis of PD and complete demographic, clinical, and treatment information. Patients with missing key variables, unclear PD diagnosis, or incomplete outcome data were excluded. After applying the inclusion and exclusion criteria, patients from two hospitals were used for model training and internal testing, while those from the third hospital were used for external validation. Figure 1 illustrates the flow of patient inclusion and exclusion across the participating centers.
 |
Figure 1 Study profile and cohort construction. |
Sample Size
The sample size was determined by the total number of eligible patients available in the participating centers during the study period. According to established recommendations for prediction model development, at least 10–20 outcome events per predictor variable (EPV) are required to ensure model stability.22 In our study, 3,935 patients with Parkinson’s disease were included, of whom 907 (23.1%) had osteoporosis. Fourteen predictors were retained after LASSO feature selection, corresponding to a minimum requirement of 140–280 events. The actual number of outcome events far exceeded this threshold, indicating that the study sample size was adequate for reliable model development and validation.
Outcome Definition
The primary outcome was osteoporosis, defined as a T-score ≤ −2.5 at the lumbar spine, femoral neck, or total hip, based on dual-energy X-ray absorptiometry (DXA). When multiple skeletal sites were available, the lowest T-score, defined as the most negative value across the lumbar spine, femoral neck, and total hip, was used for outcome determination, consistent with the diagnostic principle that osteoporosis can be diagnosed if any major site meets the threshold. All clinical and densitometric variables were collected at the time of hospital admission or outpatient evaluation. As the outcome was defined by baseline DXA T-scores, no longitudinal follow-up was required for outcome ascertainment.
Candidate Predictors
Based on prior literature, clinical expertise, and data availability across centers, we included a comprehensive set of candidate predictors for osteoporosis in patients with Parkinson’s disease. The variables comprised demographic and anthropometric factors including age, sex, and body mass index (BMI); lifestyle factors including smoking status, alcohol use, and regular physical activity; comorbidities such as hypertension, diabetes mellitus, dyslipidemia, chronic kidney disease, coronary artery disease, stroke, dementia, and depression; Parkinson’s disease–related characteristics including disease duration, Hoehn–Yahr stage, use of anti-Parkinson medications, and duration of PD treatment; medication exposures including use of anti-osteoporosis therapy, corticosteroids, proton pump inhibitors (PPI), and selective serotonin reuptake inhibitors (SSRI); and fracture risk–related variables including history of previous fracture, family history of osteoporosis, fall frequency, walking aid use, recent weight loss, and sarcopenia. The index date was defined as the date of the DXA scan. All candidate predictors were extracted from patients’ medical records within 6 months prior to the index date. Falls, recent weight loss, and medication exposures were operationalized using prespecified definitions based on medical records and prescription records within the six months look back window prior to the index date. Comorbidities, including sarcopenia, were identified based on clinician documented diagnoses and corresponding diagnostic codes recorded in the medical records.
Data Preprocessing and Missing Data
Raw data from each center were harmonized into a unified format. Continuous variables were converted to numeric and categorical variables were encoded with consistent factor levels. Implausible values were cross-checked against source records. Missing data were handled with multiple imputation by chained equations instead of case deletion. After imputation, the binary outcome was recoded as a two-level factor with “Yes” defined as the event.
Feature Selection with LASSO
We fitted binomial LASSO using glmnet with ten-fold cross-validation to identify the optimal penalty at the minimum cross-validated deviance (lambda.min). For stability assessment, we calculated the selection frequency of each predictor as the proportion of imputed datasets with a nonzero coefficient. A representative completed dataset was chosen whose lambda.min was closest to the median across imputations and was used to produce the coefficient path and cross-validation plots, and to enumerate predictors with nonzero coefficients at lambda.min.
Model Development and Internal Validation
Using the imputed development data, we split observations into a training set (70%) and a hold-out internal validation set (30%) by stratified sampling to preserve the event rate. We trained nine supervised learning algorithms under repeated cross-validation (ten folds, five repeats) with the area under the receiver operating characteristic curve (AUC) as the optimization metric and class probabilities enabled. The algorithms included support vector machine (SVM), gradient boosting machine (GBM), neural network, random forest, extreme gradient boosting (Xgboost), k-nearest neighbors (KNN), AdaBoost, LightGBM, and CatBoost.
External Validation
An independent dataset from a separate center was processed using the same numeric coercion and multiple-imputation strategy, with the outcome not imputed and any identifier excluded from the predictor matrix. To prevent leakage, we aligned the external features to the training schema. Absent one-hot encoded columns were added as zeros, and missing values were imputed using the same strategy as in the development cohort. We then generated model-specific predicted probabilities for the external cohort using the final models derived from the training set.
Performance Assessment
Discrimination was quantified by AUC with 95% confidence intervals from DeLong’s method and visualized with multi-model ROC curves. For each model we identified the Youden-optimal threshold on the relevant evaluation set and reported accuracy, sensitivity, specificity, precision, and F1 score. Calibration was assessed using nonparametric calibration curves constructed from predicted probabilities were grouped into deciles to construct calibration plots. Clinical utility was appraised with decision curve analysis under a cohort design with 50 bootstrap resamples, presented for the development, internal validation, and external validation datasets; when a center identifier was available in the external data, we additionally drew center-stratified decision curves to evaluate robustness across sites. The clinical decision was defined as whether to recommend DXA evaluation for osteoporosis assessment in patients with Parkinson’s disease. Treat all indicates recommending DXA to all patients and treat none indicates recommending DXA to no patients.
Model Explainability
For post-hoc interpretation, we applied KernelSHAP with shapviz to the best-performing models identified in the internal validation and external test cohorts. Background samples were drawn from the training data to approximate the underlying distribution, and a random subset of cases from the respective evaluation set was explained. We generated global beeswarm plots to illustrate the relative contribution and directionality of each predictor to the outcome.
Statistical Analysis
All analyses were performed using R (version 4.5.1). Continuous variables were summarized as medians with interquartile ranges and compared using the Mann–Whitney U-test, whereas categorical variables were presented as counts and percentages and compared using the χ2-test or Fisher’s exact test as appropriate. Missing data were handled using multiple imputation by chained equations (MICE) implemented in the mice package (version 3.19.0). Predictor selection was performed using LASSO penalized logistic regression implemented in the glmnet package (version 4.1.10). P values < 0.05 were considered statistically significant.
Results
Patient Characteristics
Among the 3,935 patients with Parkinson’s disease, 907 (23.1%) had osteoporosis. Compared with those without osteoporosis, these patients were older, had lower BMI, longer disease duration, and significantly reduced T-scores (all P<0.001). Women were more common in the osteoporosis group, and they were also more likely to have a history of fracture, family history of osteoporosis, and prior steroid use (all P<0.001). In terms of disease severity, advanced Hoehn–Yahr stage and higher fall frequency were markedly more prevalent among patients with osteoporosis. Other comorbidities and lifestyle factors showed no significant between-group differences. (Table 1)
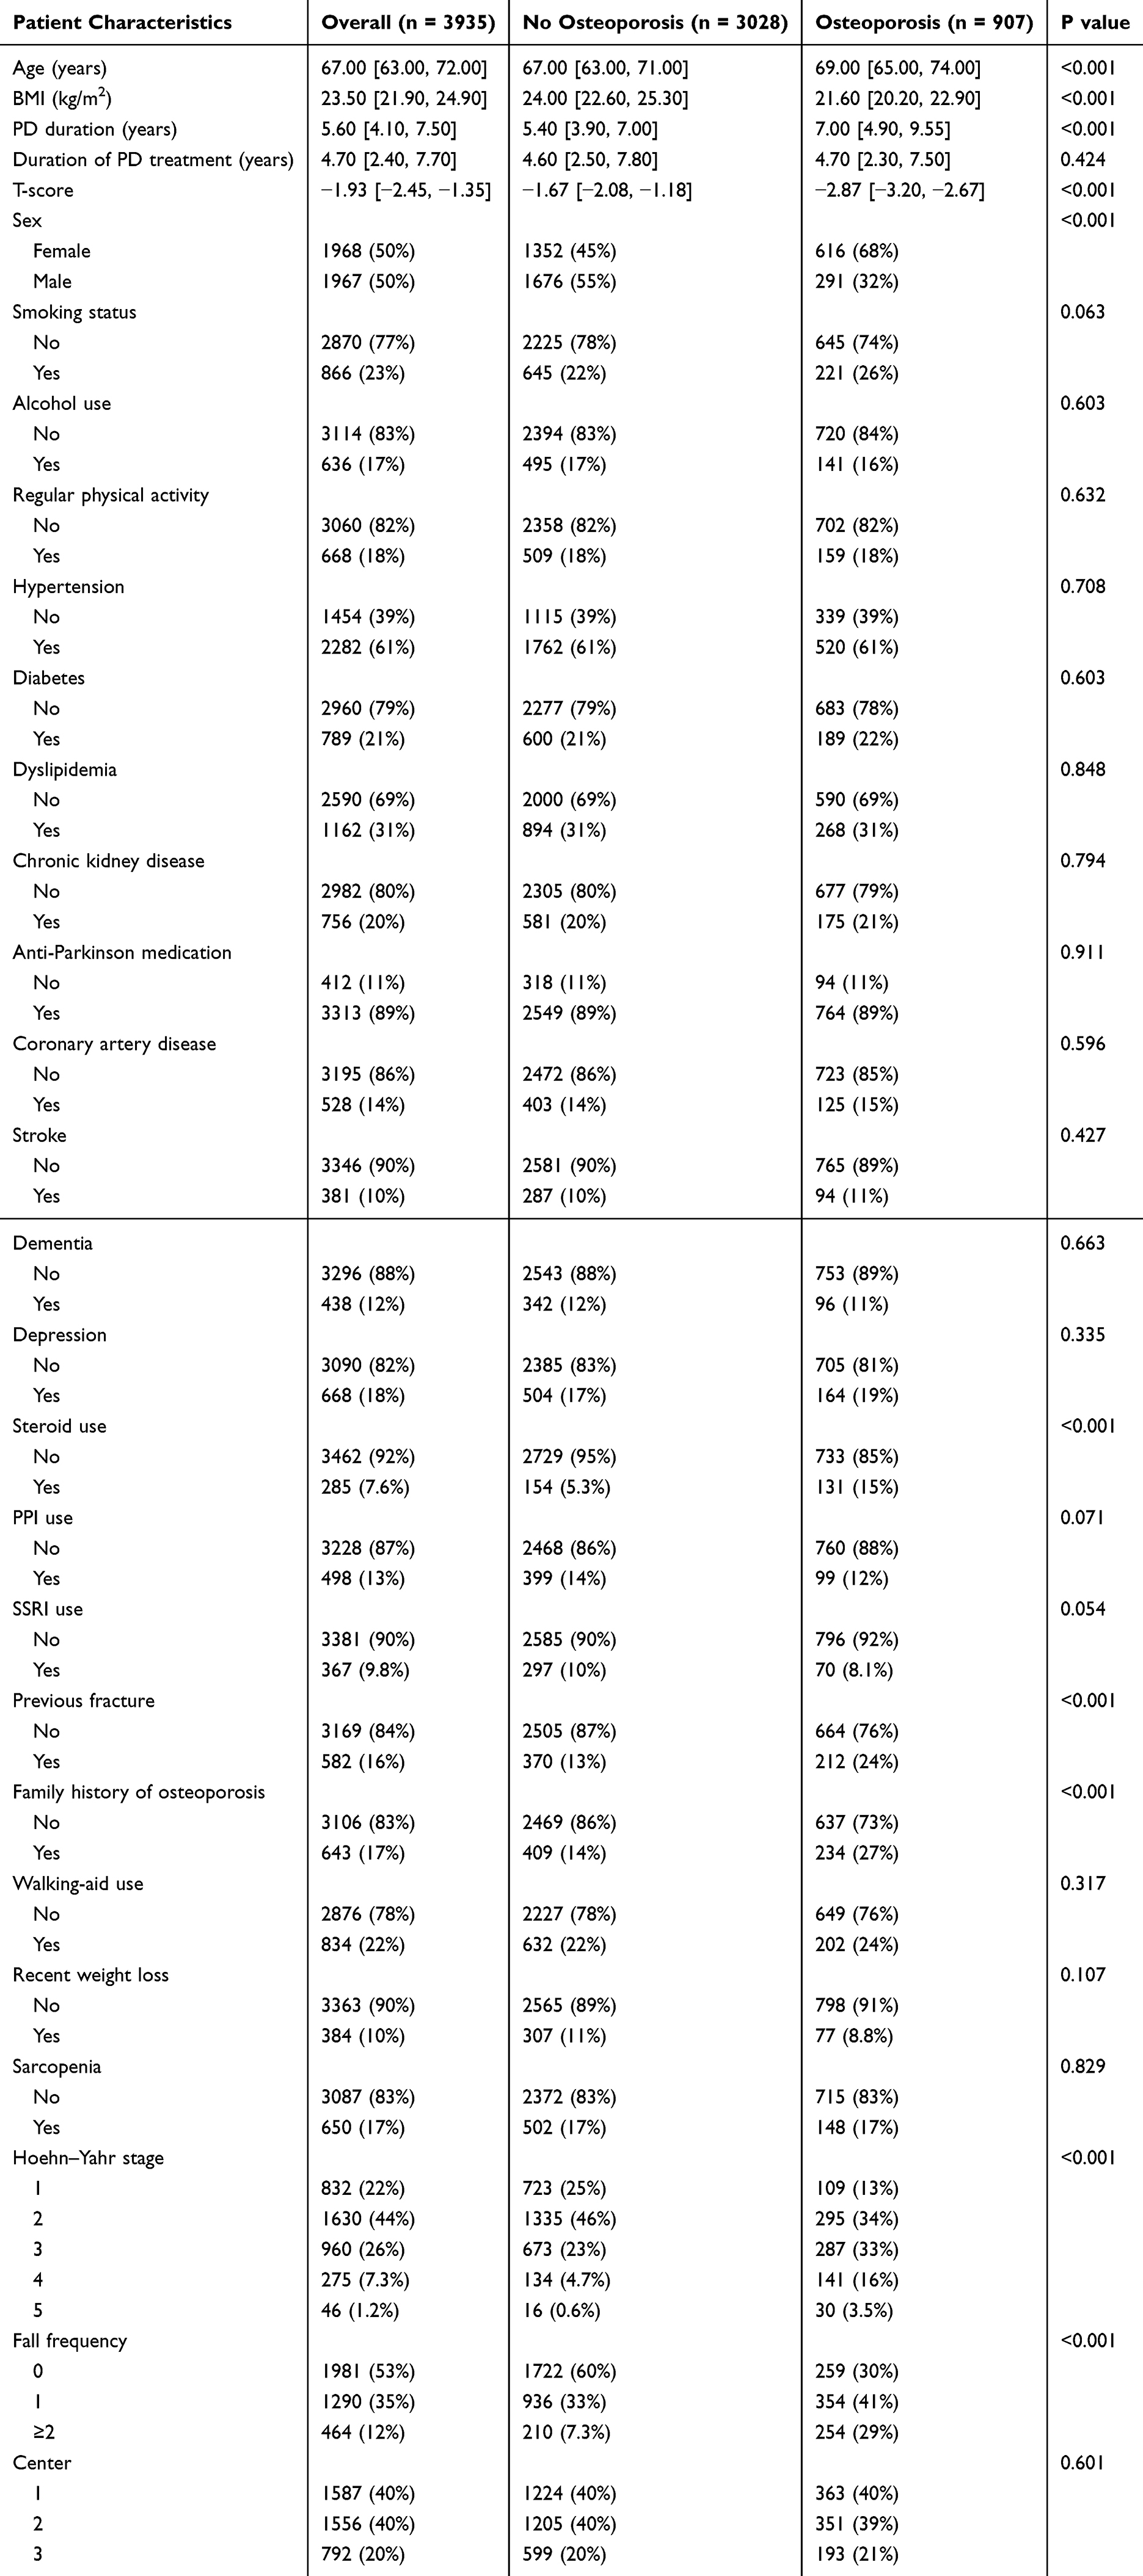 |
Table 1 Baseline Characteristics of Patients with and without Osteoporosis |
Feature Selection
LASSO regression with ten-fold cross-validation identified fourteen predictors with nonzero coefficients at the optimal penalty. The selected variables included Age, Sex, BMI, Smoking status, PD duration, Hoehn–Yahr stage, Anti-Parkinson medication use, Steroid use, PPI use, Previous fracture, Family history of osteoporosis, Fall frequency, Recent weight loss, and Sarcopenia. These variables were carried forward into model development (Figure 2).
 |
Figure 2 LASSO regression for feature selection. (A) Coefficient profiles of the candidate variables plotted against the log(λ) sequence. Each colored line represents the trajectory of a variable coefficient as the penalty parameter λ varies. (B) Ten-fold cross-validation for tuning parameter selection in the LASSO model. The mean area under the receiver operating characteristic curve (AUC) and standard error are plotted versus log(λ). The dotted vertical lines indicate the optimal values of λ corresponding to the minimum mean cross-validated error (lambda.min) and the largest value within one standard error of the minimum (lambda.1se). |
Model Development and Internal Validation
In the development cohort, all nine algorithms showed good discrimination with AUCs ranging from 0.881 to 0.935. LightGBM achieved the highest performance (AUC = 0.935, 95% CI: 0.923–0.947), followed by GBM (AUC = 0.922, 95% CI: 0.909–0.935). Random forest and AdaBoost performed similarly (both AUC = 0.910; 95% CI: 0.896–0.924 and 0.896–0.923, respectively). In the internal validation cohort, discrimination remained robust with AUCs between 0.809 and 0.869; the neural network performed best (AUC = 0.869, 95% CI: 0.843–0.895), followed by SVM (AUC = 0.866, 95% CI: 0.839–0.893) and GBM/AdaBoost (both AUC = 0.862, 95% CI: 0.834–0.889 and 0.835–0.889, respectively) (Figure 3).
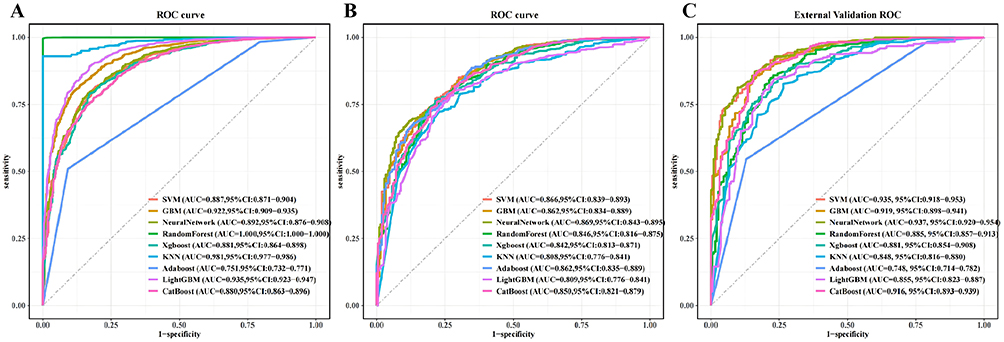 |
Figure 3 Receiver operating characteristic (ROC) curves of nine machine-learning models for predicting osteoporosis in patients with Parkinson’s disease. (A) Training cohort. (B) Internal testing cohort. (C) External validation cohort. |
External Validation
Applied to the independent external cohort, the models preserved strong discrimination with AUCs ranging from 0.855 to 0.937. The neural network achieved the highest AUC (0.937, 95% CI: 0.920–0.954), closely followed by SVM (0.935, 95% CI: 0.918–0.953) and random forest (0.935, 95% CI: 0.916–0.953). GBM and AdaBoost also performed well (AUC = 0.919, 95% CI: 0.898–0.941; and AUC = 0.922, 95% CI: 0.902–0.943, respectively), while CatBoost, XGBoost, KNN, and LightGBM maintained acceptable discrimination (AUCs = 0.916, 0.881, 0.858, and 0.855, respectively) consistent with the ROC curves and the threshold-based metrics summarized in Table 2.
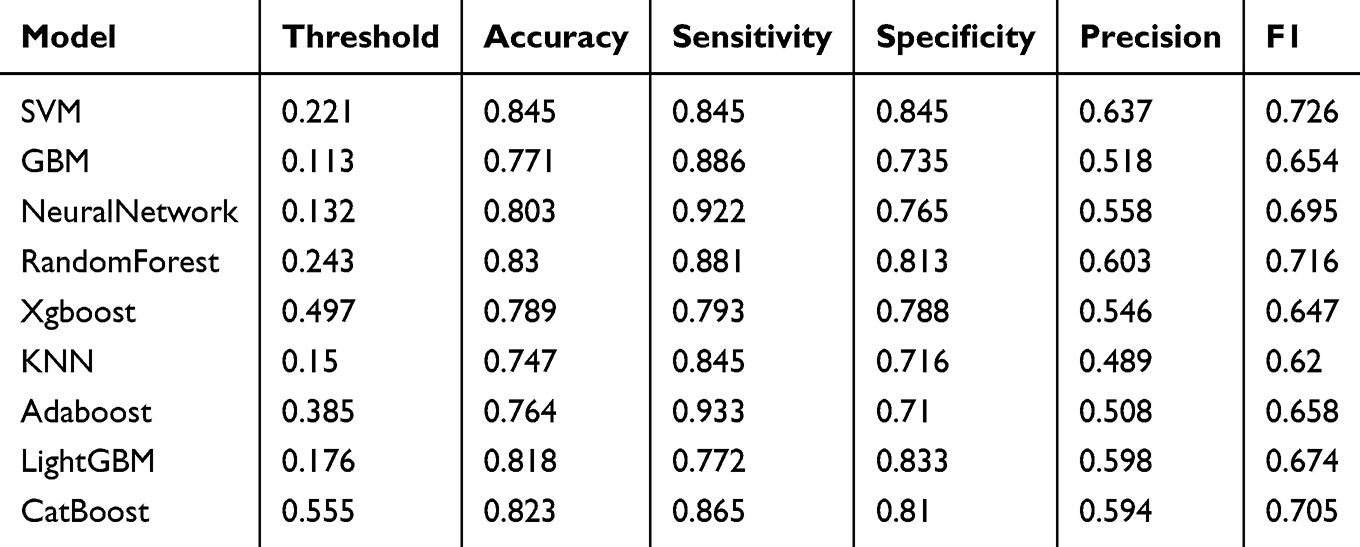 |
Table 2 Threshold-Based Classification Performance in the External Validation Cohort |
Model Calibration and Clinical Utility
Calibration analyses using decile-based plots showed close agreement between predicted risks and observed event rates in the development, internal testing, and external cohorts, with curves tracking the 45° line and only modest departures at the extremes (Figure 4).
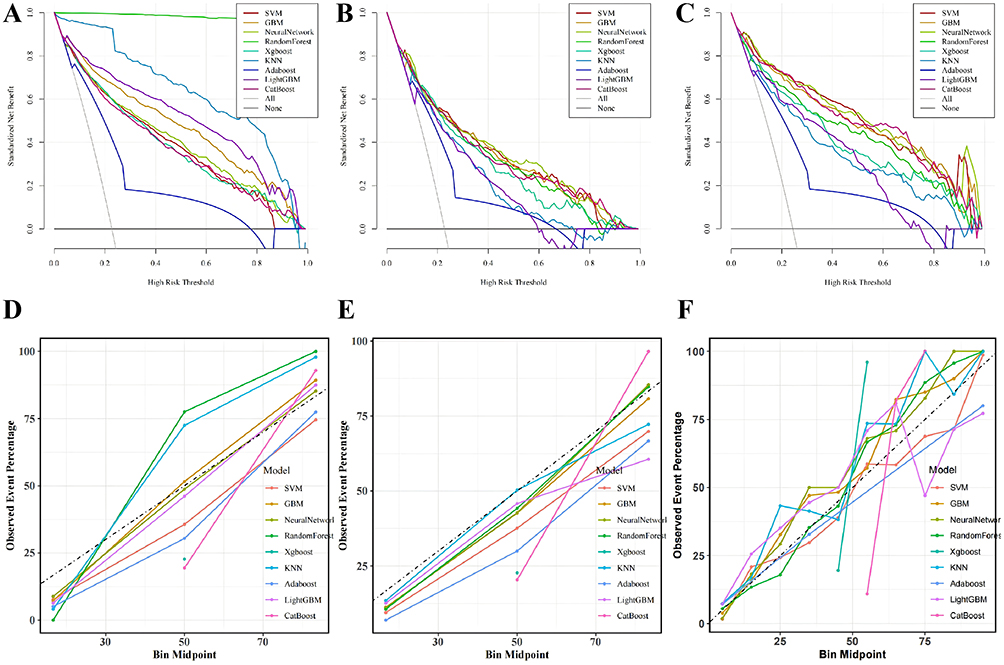 |
Figure 4 Calibration and decision curve analyses across cohorts. (A–C) Decision curve analysis in the development cohort (A), internal testing cohort (B), and external validation cohort (C). Decision curves show net benefit for the strategy of recommending DXA evaluation at different risk thresholds. Treat all means recommending DXA for all patients, and treat none means recommending DXA for no patients. (D–F) Decile-based calibration plots in the development cohort (D), internal testing cohort (E), and external validation cohort (F). |
Decision-curve analysis further demonstrated that random forest, LightGBM, and GBM provided higher net clinical benefit than “treat all” or “treat none” across clinically meaningful threshold probabilities, with consistent patterns replicated in both the testing and external validation cohorts (Figure 4).
Model Explainability
SSHAP analysis of the neural network model indicated that higher BMI was most strongly associated with a lower predicted risk of osteoporosis, whereas higher Hoehn–Yahr stage and longer PD duration were associated with a higher predicted risk. Sarcopenia and anti-Parkinson medication use also contributed notably, and other factors such as PPI use, smoking, recent weight loss, steroid use, previous fracture, and family history of osteoporosis showed consistent but smaller effects (Figure 5).
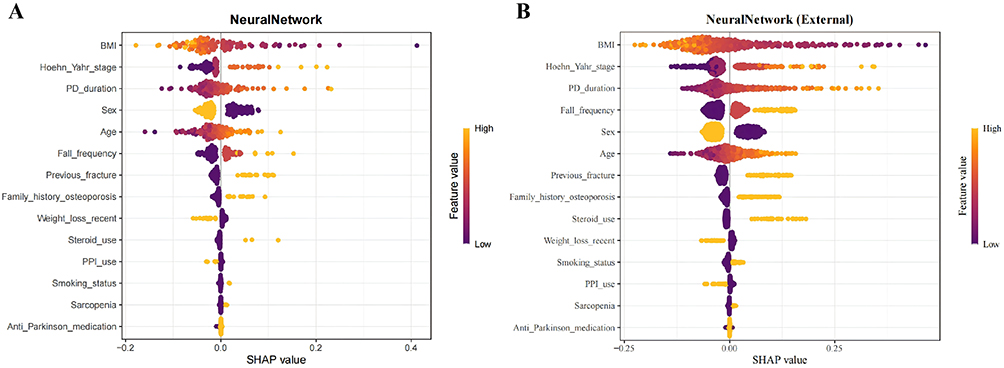 |
Figure 5 Global SHAP importance for the neural network model in the internal and external cohorts. (A) Beeswarm plot depicting SHAP value distributions for each feature in the internal cohort. (B) Corresponding SHAP beeswarm plot in the external validation cohort. Points are colored by feature value, and horizontal spread reflects the magnitude and direction of each feature’s contribution to the predicted probability. |
Discussion
In this multicenter retrospective cohort study, we developed and externally validated a machine learning model to predict the risk of osteoporosis in patients with PD. By integrating routinely available clinical variables with PD-specific factors, the model demonstrated stable discrimination, good calibration, and favorable net benefit across clinically relevant thresholds. External validation in an independent center confirmed robust generalizability, while SHAP-based explainability analysis highlighted the major contributions of age, BMI, disease duration, Hoehn–Yahr stage, fall frequency, and medication exposure to individual predictions, thereby enhancing clinical interpretability.
The novelty of our study lies in being the first large-scale, multicenter effort to systematically incorporate PD-specific determinants into an ML framework for osteoporosis risk prediction. Unlike conventional tools developed for the general population, our model accounts for disease stage, functional impairment, fall frequency, use of walking aids, sarcopenia, recent weight loss, and exposure to bone-affecting medications such as corticosteroids, proton pump inhibitors, and SSRIs. Feature selection through LASSO followed by training across multiple algorithms ensured model parsimony and robustness. The resulting models achieved favorable AUCs in both development and validation cohorts, and calibration and decision curve analyses further supported their potential clinical value.
Previous studies in PD populations have mainly focused on epidemiological associations, reporting higher prevalence of osteoporosis and fracture compared with controls, or on identifying risk factors using traditional regression models.23–26 However, these approaches have typically been limited by small sample sizes, single-center settings, or lack of independent validation. Compared with traditional risk assessment tools, our ML approach incorporates disease-specific variables and demonstrates improved discrimination. Although ML has been applied in osteoporosis and fracture risk prediction in general populations, studies specifically targeting PD patients, with external validation and model interpretability, remain scarce.19,27 Our work fills this gap and shows that integrating PD-related predictors yields tangible improvements in risk stratification.
Clinical implementation of a PD-specific osteoporosis risk model requires attention to care setting, threshold selection, workflow integration, and the behavioral realities of shared decision-making. In ambulatory neurology and peri-hospital follow-up, individualized probabilities can function as low-cost pre-screening to prioritize DXA or earlier reassessment, addressing the consistent under-recognition of bone disease in PD despite a clearly elevated fracture burden. A recent review emphasized that standard assessment tools such as FRAX may underestimate the probability of major osteoporotic fractures in patients with Parkinson’s disease, partly because these tools fail to adequately account for PD-specific risk factors.28 Emerging variants such as FRAXplus incorporate additional risk factors like recent falls, and QFracture includes PD as a named factor, but direct evaluations in PD populations remain limited.12,29 A transportable, PD-tuned model can therefore complement existing calculators and help operationalize proactive screening pathways in movement-disorder clinics.
Decision-curve analysis offers a principled framework to identify threshold ranges where net benefit exceeds “treat all” or “treat none”, and to compare candidate algorithms on the dimension of clinical utility. Within those ranges, institutions can align thresholds with local DXA capacity, medication access, and fracture-liaison resources, while individual encounters can tailor choices to patient preferences regarding testing and pharmacotherapy burden. Clear reporting and interpretation of decision curves, as recommended by methodological primers and critiques, will be essential to avoid misapplication.30–32
Embedding risk estimation into electronic health records may provide passive safety nets by generating contextual risk flags during neurology or geriatrics visits, issuing automated DXA orders for high-risk phenotypes, and prompting recalls after hospitalization for falls. Together, these functions create a closed loop of identification, testing, intervention, and re-evaluation. At the bedside, case-level explanations produced by post-hoc methods such as SHAP can make risk drivers legible to clinicians, patients, and caregivers, supporting concordant decisions around calcium and vitamin D optimization, initiation of anti-osteoporosis pharmacotherapy, and individualized fall-prevention programs. Recent syntheses of explainable AI in healthcare underscore both the promise of such explanations for trust and auditability and the need for careful use to avoid over-interpretation; pairing global importance summaries with simple, patient-facing narratives appears to be a practical compromise.33–36
The clinical significance of a PD-specific model lies in its capacity to aggregate the cumulative effects of motor phenotypes, functional decline, body-composition changes, and medication exposures on skeletal fragility, translating diffuse risk into timely prevention. Implementation at scale could plausibly reduce preventable fractures, shorten hospital stays, and lower disability and mortality while optimizing the use of DXA scanners and fracture-liaison services. Recent neurology and movement-disorders reviews have also called for explicit incorporation of bone-health pathways into PD care guidelines, highlighting a system-level gap that predictive tools can help close.28,37
Future work should extend beyond static baselines. Longitudinal updating that ingests routinely collected data, repeated weights and T-scores, medication changes, intercurrent falls—would allow dynamic risk trajectories and timely recalibration across centers. Integration of digital mobility measures from wearables and smartphones is particularly promising: gait speed, variability, turning metrics, and trunk motion derived from short in-clinic sensors or brief home monitoring have repeatedly associated with future falls and may refine fracture risk stratification when combined with traditional covariates. Parallel incorporation of biochemical markers, including vitamin D and bone-turnover indicators, and systematic assessment of sarcopenia and low lean mass could further tighten the mechanistic link between motor impairment, muscle-bone crosstalk, and skeletal fragility in PD.
Several limitations should be acknowledged. The retrospective design may leave residual confounding and selection bias. Despite harmonization efforts, measurement heterogeneity across centers cannot be fully eliminated. Osteoporosis was defined solely by T-scores, without systematically incorporating vertebral morphometric fractures or detailed fall severity indices, potentially underestimating clinically relevant outcomes. Moreover, the study population was restricted to three tertiary hospitals in China, limiting generalizability to other ethnic groups and healthcare systems. Prospective studies are required to assess transportability, recalibration needs, and temporal stability. Finally, although SHAP enhanced interpretability, consistency of explanations across algorithms and causal generalizability warrant further investigation.
Conclusion
In conclusion, we developed and externally validated a machine learning model for predicting osteoporosis in PD patients, incorporating disease stage, functional status, and medication exposures to achieve strong performance and clinical interpretability. Future work should focus on prospective, multi-regional validation and electronic health record integration to translate predictive accuracy into measurable improvements in screening efficiency, fracture prevention, and patient outcomes.
Ethics Approval and Informed Consent
The study protocol was reviewed and approved by the Ethics Committee of The First People’s Hospital of Lianyungang (No. LW-20251014001). All procedures performed in this study involving human participants were conducted in accordance with the ethical standards of the institutional research committee and with the 1964 Declaration of Helsinki and its later amendments or comparable ethical standards. Given the retrospective nature of the study and the use of fully anonymized clinical data, the requirement for informed consent was waived by the Ethics Committee.
Acknowledgments
We would like to thank all of the doctors who participated in this study for their cooperation.
Funding
This research was supported by the National Key Research and Development Program of China (2022YFC3501403) and the Academician Workstation of Jiangsu Province (BM2024101).
Disclosure
The authors report no conflicts of interest in this work.
References
1. Morin SN, Leslie WD, Schousboe JT. Osteoporosis: a review. JAMA. 2025;334(10):894. doi:10.1001/jama.2025.6003
2. Reid IR, Billington EO. Drug therapy for osteoporosis in older adults. Lancet. 2022;399(10329):1080–12. doi:10.1016/S0140-6736(21)02646-5
3. Panahi N, Saeedi Moghaddam S, Fahimfar N, et al. Trend in global burden attributable to low bone mineral density in different WHO regions: 2000 and beyond, results from the global burden of disease (GBD) study 2019. Endocr Connect. 2023;12(10):e230160. doi:10.1530/EC-23-0160
4. Ahn S-H, Lee HS, Lee J-H. Body mass index changes and femur fracture risk in Parkinson’s disease: national cohort study. J Cachexia Sarcopenia Muscle. 2025;16(3):e13860. doi:10.1002/jcsm.13860
5. Ali M, Erabadda B, Chen Y, et al. Shared and disease-specific pathways in frontotemporal dementia and Alzheimer’s and Parkinson’s diseases. Nat Med. 2025;31(8):2567–2577. doi:10.1038/s41591-025-03833-1
6. Voruz P, Guérin D, Péron JA. Impact of motor symptom asymmetry on non-motor outcomes in Parkinson’s disease: a systematic review. NPJ Parkinsons Dis. 2025;11(1):188. doi:10.1038/s41531-025-01046-4
7. Mylius V, Zenev E, Brook CS, et al. Imbalance and falls in patients with Parkinson’s disease: causes and recent developments in training and sensor-based assessment. Brain Sciences. 2024;14(7):625. doi:10.3390/brainsci14070625
8. Zampogna A, Cavallieri F, Bove F, et al. Axial impairment and falls in Parkinson’s disease: 15 years of subthalamic deep brain stimulation. npj Parkinsons Dis. 2022;8(1):121. doi:10.1038/s41531-022-00383-y
9. Barichella M, Cereda E, Iorio L, et al. Clinical correlates of serum 25-hydroxyvitamin D in Parkinson’s disease. Nutr Neurosci. 2022;25(6):1128–1136. doi:10.1080/1028415X.2020.1840117
10. Corrà MF, Vila-Chã N, Sardoeira A, et al. Peripheral neuropathy in Parkinson’s disease: prevalence and functional impact on gait and balance. Brain. 2023;146(1):225–236. doi:10.1093/brain/awac026
11. Amarasekera NN, Taylor J, Coppin C, Lewis SJG. An audit on the assessment and management of osteoporosis in a Parkinson’s and related diseases clinic in Australia. J Neurol. 2025;272(2):139. doi:10.1007/s00415-024-12752-z
12. Schini M, Johansson H, Harvey NC, Lorentzon M, Kanis JA, McCloskey EV. An overview of the use of the fracture risk assessment tool (FRAX) in osteoporosis. J Endocrinol Invest. 2023;47(3):501–511. doi:10.1007/s40618-023-02219-9
13. Kataoka H, Sugie K. Health-related quality of life may predict disease staging in 10 years in Parkinson disease with hoehn-yahr stage III. Neurol Clin Pract. 2021;11(3):e261–e266. doi:10.1212/CPJ.0000000000000924
14. Hong JT, Jung H-K, Lee KJ, et al. Potential risk of proton pump inhibitors for Parkinson’s disease: a nationwide nested case-control study. PLoS One. 2023;18(12):e0295981. doi:10.1371/journal.pone.0295981
15. Gao R, Zhao P, Yan K. Selective serotonin reuptake inhibitors for the treatment of depression in Parkinson’s disease: a systematic review and meta-analysis. Clin Drug Investig. 2024;44(7):459–469. doi:10.1007/s40261-024-01378-8
16. Joo B, Marquez JL, Osmotherly PG. Objective assessments for walking aid prescription in balance impairment and falls risk: a scoping review of current evidence. Disabil Rehabil Assist Technol. 2025;1–13. doi:10.1080/17483107.2025.2508936
17. Reddy A, Reddy RP, Roghani AK, et al. Artificial intelligence in Parkinson’s disease: early detection and diagnostic advancements. Ageing Res Rev. 2024;99:102410. doi:10.1016/j.arr.2024.102410
18. Abumalloh RA, Nilashi M, Samad S, et al. Parkinson’s disease diagnosis using deep learning: a bibliometric analysis and literature review. Ageing Res Rev. 2024;96:102285. doi:10.1016/j.arr.2024.102285
19. Carvalho FR, Gavaia PJ. Enhancing osteoporosis risk prediction using machine learning: a holistic approach integrating biomarkers and clinical data. Comput Biol Med. 2025;192(Pt B):110289. doi:10.1016/j.compbiomed.2025.110289
20. Khushal R, Fatima DU. Machine learning and Fuzzy logic fusion approach for osteoporosis risk prediction. MethodsX. 2025;14:103152. doi:10.1016/j.mex.2024.103152
21. Collins GS, Moons KGM, Dhiman P, et al. TRIPOD+AI statement: updated guidance for reporting clinical prediction models that use regression or machine learning methods. BMJ. 2024:385e078378. doi:10.1136/bmj-2023-078378
22. Watson V, Smith CT, Bonnett LJ. Systematic review of methods used in prediction models with recurrent event data. Diagnostic and Prognostic Res. 2024;8(1):13. doi:10.1186/s41512-024-00173-5
23. Park K-Y, Jung J-H, Hwang H-S, Park H-K, Han K, Nam GE. Bone mineral density and the risk of parkinson’s disease in postmenopausal women. Mov Disord. 2023;38(9):1606–1614. doi:10.1002/mds.29579
24. Naylor KC, Tenis On E, Hardcastle SA, Lyell V, Gregson CL, Henderson EJ. Assessing and managing bone health and fracture risk in Parkinson’s disease: the BONE PARK 2 protocol. Age Ageing. 2025;54(3):afaf052. doi:10.1093/ageing/afaf052
25. Feng S-H, Huang Y-P, Yeh K-C, Pan S-L. Osteoporosis and the risk of Parkinson’s disease: a nationwide, propensity score–matched, longitudinal follow-up study. J Clin Endocrinol Metab. 2021;106(2):e763–e771. doi:10.1210/clinem/dgaa864
26. Jin Y, Choi BK, Lee JW, Hong JY, Hong I, Baek MS. Association between osteoporosis and mortality in Parkinson’s disease with mediating effect of hip fractures: a Korean nationwide population-based study. Front Aging Neurosci. 2025;17:1552381. doi:10.3389/fnagi.2025.1552381
27. Hong N, Whittier DE, Glüer -C-C, Leslie WD. The potential role for artificial intelligence in fracture risk prediction. Lancet Diabetes Endocrinol. 2024;12(8):596–600. doi:10.1016/S2213-8587(24)00153-0
28. Ó Breasail M, Singh KP, Lithander FE, et al. Management of osteoporosis in Parkinson’s disease: a systematic review of clinical practice guidelines. Move Disord Clin Prac. 2025;12(3):285–295. doi:10.1002/mdc3.14311
29. Kobylecki C, Glasse H, Amin J, Gregson CL, Lyell V, Henderson EJ. Fracture risk assessment in atypical Parkinsonian syndromes. Move Disord Clin Prac. 2021;8(3):385–389. doi:10.1002/mdc3.13146
30. Chalkou K, Vickers AJ, Pellegrini F, Manca A, Salanti G. Decision curve analysis for personalized treatment choice between multiple options. Med Decis Making. 2023;43(3):337–349. doi:10.1177/0272989X221143058
31. Piovani D, Sokou R, Tsantes AG, Vitello AS, Bonovas S. Optimizing clinical decision making with decision curve analysis: insights for clinical investigators. Healthcare. 2023;11(16):2244. doi:10.3390/healthcare11162244
32. Vellekoop H, Versteegh M, Huygens S, et al. The net benefit of personalized medicine: a systematic literature review and regression analysis. Value Health. 2022;25(8):1428–1438. doi:10.1016/j.jval.2022.01.006
33. Karim MR, Islam T, Shajalal M, et al. Explainable AI for bioinformatics: methods, tools and applications. Brief Bioinform. 2023;24(5):bbad236. doi:10.1093/bib/bbad236
34. Gatineau G, Shevroja E, Vendrami C, et al. Development and reporting of artificial intelligence in osteoporosis management. J Bone Miner Res. 2024;39(11):1553–1573. doi:10.1093/jbmr/zjae131
35. Rasheed K, Qayyum A, Ghaly M, Al-Fuqaha A, Razi A, Qadir J. Explainable, trustworthy, and ethical machine learning for healthcare: a survey. Comput Biol Med. 2022;149:106043. doi:10.1016/j.compbiomed.2022.106043
36. Ali S, Akhlaq F, Imran AS, Kastrati Z, Daudpota SM, Moosa M. The enlightening role of explainable artificial intelligence in medical & healthcare domains: a systematic literature review. Comput Biol Med. 2023;166:107555. doi:10.1016/j.compbiomed.2023.107555
37. Montero-Odasso M, Van Der Velde N, Martin FC, et al. World guidelines for falls prevention and management for older adults: a global initiative. Age Ageing. 2022;51(9):afac205. doi:10.1093/ageing/afac205
 © 2026 The Author(s). This work is published and licensed by Dove Medical Press Limited. The
full terms of this license are available at https://www.dovepress.com/terms
and incorporate the Creative Commons Attribution
- Non Commercial (unported, 4.0) License.
By accessing the work you hereby accept the Terms. Non-commercial uses of the work are permitted
without any further permission from Dove Medical Press Limited, provided the work is properly
attributed. For permission for commercial use of this work, please see paragraphs 4.2 and 5 of our Terms.
© 2026 The Author(s). This work is published and licensed by Dove Medical Press Limited. The
full terms of this license are available at https://www.dovepress.com/terms
and incorporate the Creative Commons Attribution
- Non Commercial (unported, 4.0) License.
By accessing the work you hereby accept the Terms. Non-commercial uses of the work are permitted
without any further permission from Dove Medical Press Limited, provided the work is properly
attributed. For permission for commercial use of this work, please see paragraphs 4.2 and 5 of our Terms.
Recommended articles
Association Between Hemoglobin Levels and Osteoporosis in Chinese Patients with Type 2 Diabetes Mellitus: A Cross-Sectional Study
Ye T, Lu L, Guo L, Liang M
Diabetes, Metabolic Syndrome and Obesity 2022, 15:2803-2811
Published Date: 14 September 2022
Associations of Obesity Indices with Bone Mineral Densities and Risk of Osteoporosis Stratified Across Diabetic Vascular Disease in T2DM Patients
Zheng S, Zhou J, Wang K, Wang X, Li Z, Chen N
Diabetes, Metabolic Syndrome and Obesity 2022, 15:3459-3468
Published Date: 3 November 2022
Clinical Utility of Romosozumab in the Management of Osteoporosis: Focus on Patient Selection and Perspectives
Lim SY, Bolster MB
International Journal of Women's Health 2022, 14:1733-1747
Published Date: 15 December 2022
The Effects of Switching from Dipeptidyl Peptidase-4 Inhibitors to Glucagon-Like Peptide-1 Receptor Agonists on Bone Mineral Density in Diabetic Patients
Huang CF, Mao TY, Hwang SJ
Diabetes, Metabolic Syndrome and Obesity 2023, 16:31-36
Published Date: 11 January 2023
The Relationship Between Serum 25-Hydroxyvitamin D Levels and Osteoporosis in Postmenopausal Women
Wang D, Yang Y
Clinical Interventions in Aging 2023, 18:619-627
Published Date: 18 April 2023