Back to Journals » Diabetes, Metabolic Syndrome and Obesity » Volume 18
Development and External Validation of a Machine Learning-Based Model for Predicting Heart Failure Risk in Type 2 Diabetes
Authors Liu Y ![]() , Wang P, Wang M, Chen Y, Kasyanju SM, Yang Y, Yang T
, Wang P, Wang M, Chen Y, Kasyanju SM, Yang Y, Yang T ![]() , Peng L, Sun M
, Peng L, Sun M
Received 8 August 2025
Accepted for publication 4 November 2025
Published 13 November 2025 Volume 2025:18 Pages 4177—4191
DOI https://doi.org/10.2147/DMSO.S558687
Checked for plagiarism Yes
Review by Single anonymous peer review
Peer reviewer comments 2
Editor who approved publication: Dr Rebecca Baqiyyah Conway
Yuqing Liu,1 Ping Wang,2 Min Wang,3 Yan Chen,2 Sania Martin Kasyanju,1 Yuhong Yang,1 Tao Yang,1 Li Peng,3,* Min Sun1,*
1Department of Endocrinology, The First Affiliated Hospital with Nanjing Medical University, Nanjing, People’s Republic of China; 2Department of Endocrinology, Nanjing Gaochun People’s Hospital, Nanjing, People’s Republic of China; 3Department of Endocrinology, The Fourth Affiliated Hospital with Nanjing Medical University, Nanjing, People’s Republic of China
*These authors contributed equally to this work
Correspondence: Min Sun, Department of Endocrinology, The First Affiliated Hospital with Nanjing Medical University, Guangzhou Road 300, Nanjing, 210029, People’s Republic of China, Email [email protected] Li Peng, Department of Endocrinology, The Fourth Affiliated Hospital with Nanjing Medical University, Nanpu Road 298, Nanjing, 211800, People’s Republic of China, Email [email protected]
Background: Heart failure (HF) is a severe and common complication of type 2 diabetes mellitus (T2DM), associated with increased morbidity and mortality. Although the biomarker NT-proBNP, at a cut-off value of 125 pg/mL, has demonstrated satisfactory discriminatory power for predicting HF risk in T2DM patients, its measurement remains inaccessible in most primary healthcare settings in China. This study aimed to develop and externally validate a machine learning-based nomogram for predicting the risk of elevated NT-proBNP (≥ 125 pg/mL) as a surrogate for HF risk in patients with T2DM.
Methods: We retrospectively enrolled 564 T2DM patients as the development cohort and 302 from two external centers as the validation cohort. After feature selection via least absolute shrinkage and selection operator regression, five machine learning models were constructed and evaluated using 10-fold cross-validation. The optimal model was presented as a static nomogram and further deployed as an online web application for clinical use.
Results: Six key predictors were identified: estimated glomerular filtration rate, age, serum albumin, hemoglobin, urine albumin-to-creatinine ratio, and the binary indicator of age ≥ 65 years. Interpretability analysis using SHapley Additive exPlanations revealed estimated glomerular filtration rate as the most influential feature. The final machine learning-based nomogram achieved AUCs of 0.806 (95% CI: 0.767– 0.845) in training and 0.861 (95% CI: 0.813– 0.908) in external validation, with good calibration and clinical utility. Furthermore, the nomogram scores showed a significant positive correlation with established TRS-HFDM risk strata, supporting its clinical relevance.
Conclusion: We developed and validated an interpretable machine learning-based nomogram that effectively predicts the risk of elevated NT-proBNP in T2DM patients using six routine clinical variables. This tool demonstrates robust performance and generalizability, offering a practical and accessible solution for HF risk stratification in resource-limited primary care settings in China.
Keywords: type 2 diabetes mellitus, N-terminal pro-B-type natriuretic peptide, heart failure, prediction model, machine learning
Introduction
Type 2 diabetes mellitus (T2DM) affects 11.2% of the adult population in China and is an independent risk factor for heart failure (HF).1 A Swedish study found that individuals with T2DM are subject to a 2–4 times higher risk of mortality and cardiovascular disease compared to the general population.2 Among them, HF is the complication with the highest risk of T2DM,3 and it is also one of the most common initial manifestations of T2DM cardiovascular disease.4 The high incidence and poor outcomes of HF in this population underscore an urgent need for effective preventive strategies. Members of two novel drug classes, sodium-glucose co-transporter 2 inhibitors (SGLT2i) and glucagon-like peptide 1 receptor agonists, have been shown to reduce atherosclerotic major adverse cardiovascular events to a similar degree in patients with established atherosclerotic cardiovascular disease, while SGLT2i have a more noticeable effect on preventing hospitalization for HF.5,6 However, the efficient implementation of such preventive therapies hinges on the ability to identify which patients are at elevated risk and would benefit most from targeted intervention.
This creates a critical need for practical risk stratification tools, particularly in primary care settings where the majority of T2DM patients are managed. N-terminal pro-B-type natriuretic peptide (NT-proBNP) is a group of endogenous peptides with natriuretic and diuretic effects, and was proposed as the most powerful predictor of HF occurrence in patients with T2DM by comparing four biomarkers.7 The European Society of Cardiology guidelines on HF recommend measuring concentrations of NT-proBNP for the diagnostic evaluation of HF.8 Studies have shown that NT-proBNP levels above 125 pg/mL indicate an elevated risk of cardiovascular events within a 12-month period.9,10 Therefore, NT-proBNP represents a well-validated and guideline-endorsed biomarker for this risk stratification task, providing an objective basis to guide preventative care.
A fundamental barrier, however, prevents the widespread application of this valuable tool in the very settings where it is most needed. The majority of primary hospitals in China, which bear the primary responsibility for chronic disease management, lack access to NT-proBNP testing. This discrepancy creates a significant care gap, leaving clinicians without a reliable means to identify high-risk T2DM patients. Furthermore, a large-scale study involving 348,027 T2DM cases revealed that rural areas are an independent risk factor for HF in T2DM patients.11 Consequently, there is a pressing demand for an alternative risk assessment strategy that can replicate the predictive utility of NT-proBNP using only routinely available clinical data.
Machine learning (ML) is a powerful tool for data mining and analysis, with broad predictive applications in medicine.12,13 The predictive accuracy of ML outperforms that of conventional statistical approaches, as evidenced by some studies.12,14 Hence, this study aimed to create a ML-based nomogram model for predicting the probability of NT-ProBNP levels rising to ≥125 pg/mL in Chinese patients with T2DM, utilizing several clinical variables. This will allow for the identification of T2DM people at elevated risk of HF and enhance the guidance on the prevention and management of cardiovascular disease in T2DM.
Materials and Methods
Study Population
This multicenter study utilized a hybrid design, retrospectively and prospectively enrolling adult patients with T2DM. A total of 564 patients with T2DM admitted to the Department of Endocrinology of the First Affiliated Hospital with Nanjing Medical University from August 2022 to August 2023 were retrospectively enrolled in the study as a development cohort. The external validation cohorts comprised 196 consenting patients with T2DM admitted to the Department of Endocrinology at Nanjing Gaochun People’s Hospital from June to November 2024, and 106 patients with T2DM admitted to Department of Endocrinology at the Fourth Affiliated Hospital with Nanjing Medical University from March to October 2024. This study was conducted in accordance with the Declaration of Helsinki.
The inclusion criteria for this study required patients to meet all of the following conditions: (1) a diagnosis of T2DM according to the Chinese Guidelines for Prevention and Control of Type 2 Diabetes Mellitus (2020 Edition);15 and (2) age ≥18 years at the time of admission. Patients were excluded if they met any of the following criteria: (1) a diagnosis of type 1 diabetes, gestational diabetes, or other specific types of diabetes; (2) a known history of HF as defined by the Chinese guidelines for the diagnosis and treatment of heart failure 2018;16 or (3) the presence of severe comorbid conditions, including severe pulmonary disease (eg, requiring long-term oxygen therapy), active uncontrolled systemic infection (eg, sepsis), malignant tumors under active treatment or with metastasis, end-stage renal disease (estimated glomerular filtration rate [eGFR] <15 mL/min/1.73m2 or on dialysis), or any other end-stage disease with a life expectancy of less than one year.
Variables Identified
We grouped the collected variables into: (1) demographic characteristics, such as sex, age and body mass index (BMI); (2) clinical variables, including the duration of T2DM, the use of hypoglycemic agents, the presence of hypertension, the duration of hypertension, the participant’s history of atherosclerotic cardiovascular disease (ASCVD), and atrial fibrillation (AF), systolic blood pressure (SBP), and diastolic blood pressure (DBP); (3) laboratory indices, including hemoglobin (Hb), total cholesterol (TC), triglycerides (TG), low-density lipoprotein (LDL), high-density lipoprotein (HDL), lipoprotein (a) (lpa), hemoglobin A1c (HbA1C), serum albumin, urine albumin to creatinine ratio (UACR), serum creatinine (Cr), eGFR (Chronic Kidney Disease Epidemiology Collaboration [CKD-EPI]17). We evaluated the NT-proBNP using electrochemiluminescence (the cobas e 601). The electrochemiluminescence’s intra- and inter-coefficient of variation is < 5%.
T2DM and Elevated NT-proBNP Diagnostic Criteria
Diabetes mellitus is diagnosed according to the Chinese Guidelines for Prevention and Control of Type 2 Diabetes Mellitus (2020 Edition),15 defined as fasting plasma glucose ≥7.0 mmol/L, 2-hour plasma glucose ≥11.1 mmol/L during an oral glucose tolerance test, or HbA1C ≥6.5%. T2DM should be diagnosed by excluding type 1 and other types of diabetes mellitus. In accordance with the Diagnostic Criteria for Heart Failure Diagnosis and Treatment Guidelines in China 2018,16 an elevated NT-proBNP was defined as NT-proBNP ≥125 pg/mL.
Selection of Machine Learning Models and Evaluation
Initially, we analyzed the data using a univariate approach based on the NT-proBNP classification. To prevent overfitting, the least absolute shrinkage and selection operator (LASSO) with 10-fold cross-validation was employed to identify predictive variables for model inclusion. Subsequently, the selected variables were employed to construct five ML models, comprising logistic regression (LR), random forest (RF), support vector machines (SVM), extreme gradient boosting (XGBoost), and k-nearest neighbor (KNN). We evaluated the models on the development cohort using multiple metrics: the area under the receiver operating characteristic curve (AUC), sensitivity, specificity, accuracy, positive predictive value (PPV), and negative predictive value (NPV). We choose the model exhibiting optimal performance.
Model Interpretability and Importance Analysis
SHapley Additive exPlanations (SHAP) is a comprehensive framework for interpreting ML predictions, quantifying the positive or negative influence of each predictor on the result.18 We employed the SHAP method in this study to illustrate the predictive capacity of these variables for elevated NT-proBNP risk in T2DM patients, based on our optimal model.
Nomogram Development and External Validation
In order to facilitate clinical decision-making, the optional predictive model was visualized in two formats: a static nomogram and a web-based dynamic nomogram. We thoroughly assessed the nomogram’s discrimination, calibration, and clinical utility in both the development and validation cohorts. Discrimination was assessed through the calculation of AUC, while the calibration was determined by plotting calibration curves and Hosmer-Lemeshow tests. We utilized decision curve analysis (DCA) curves to evaluate clinical utility. Based on the nomogram-derived scores, patients were stratified into low- and high-risk subgroups using an optimal cut-off value determined by the Youden’s index.
Statistical Analysis
Statistical analysis was performed using SPSS version 27.0 and R software version 4.0.3. Data were expressed as means (standard deviation) for normally distributed variables, medians (interquartile range) for variables with skewed distributions, or as proportions for categorical variables. The Kolmogorov–Smirnov test was employed to assess the normality of continuous variables. The comparison of continuous variables was conducted using either the Student’s t-test or the Mann–Whitney U-test, depending on the distribution of the data. Categorical data were compared using either a Chi-squared test or Fisher’s exact test, as appropriate. P < 0.05 indicated statistically significant differences. We have summarized all statistical methods in Table S2.
Results
Characteristics of Participants in the Development and External Validation Cohorts
This study comprised two datasets: the development cohort (n=564) and external validation cohort (n=312). The detailed procedure for sample screening is illustrated in Figure 1. The demographic, clinical, and laboratory variables of the development and external validation cohorts were described and compared, as presented in Table 1. The frequencies of female sex, age <65 years, duration of T2DM <15 years, duration of hypertension <10 years, ASCVD, higher levels of SBP, DBP, HbA1C, serum albumin, UACR, eGFR, Hb, TC, LDL, and TG were significantly greater in the external validation cohort than the development cohort (all, P < 0.05).
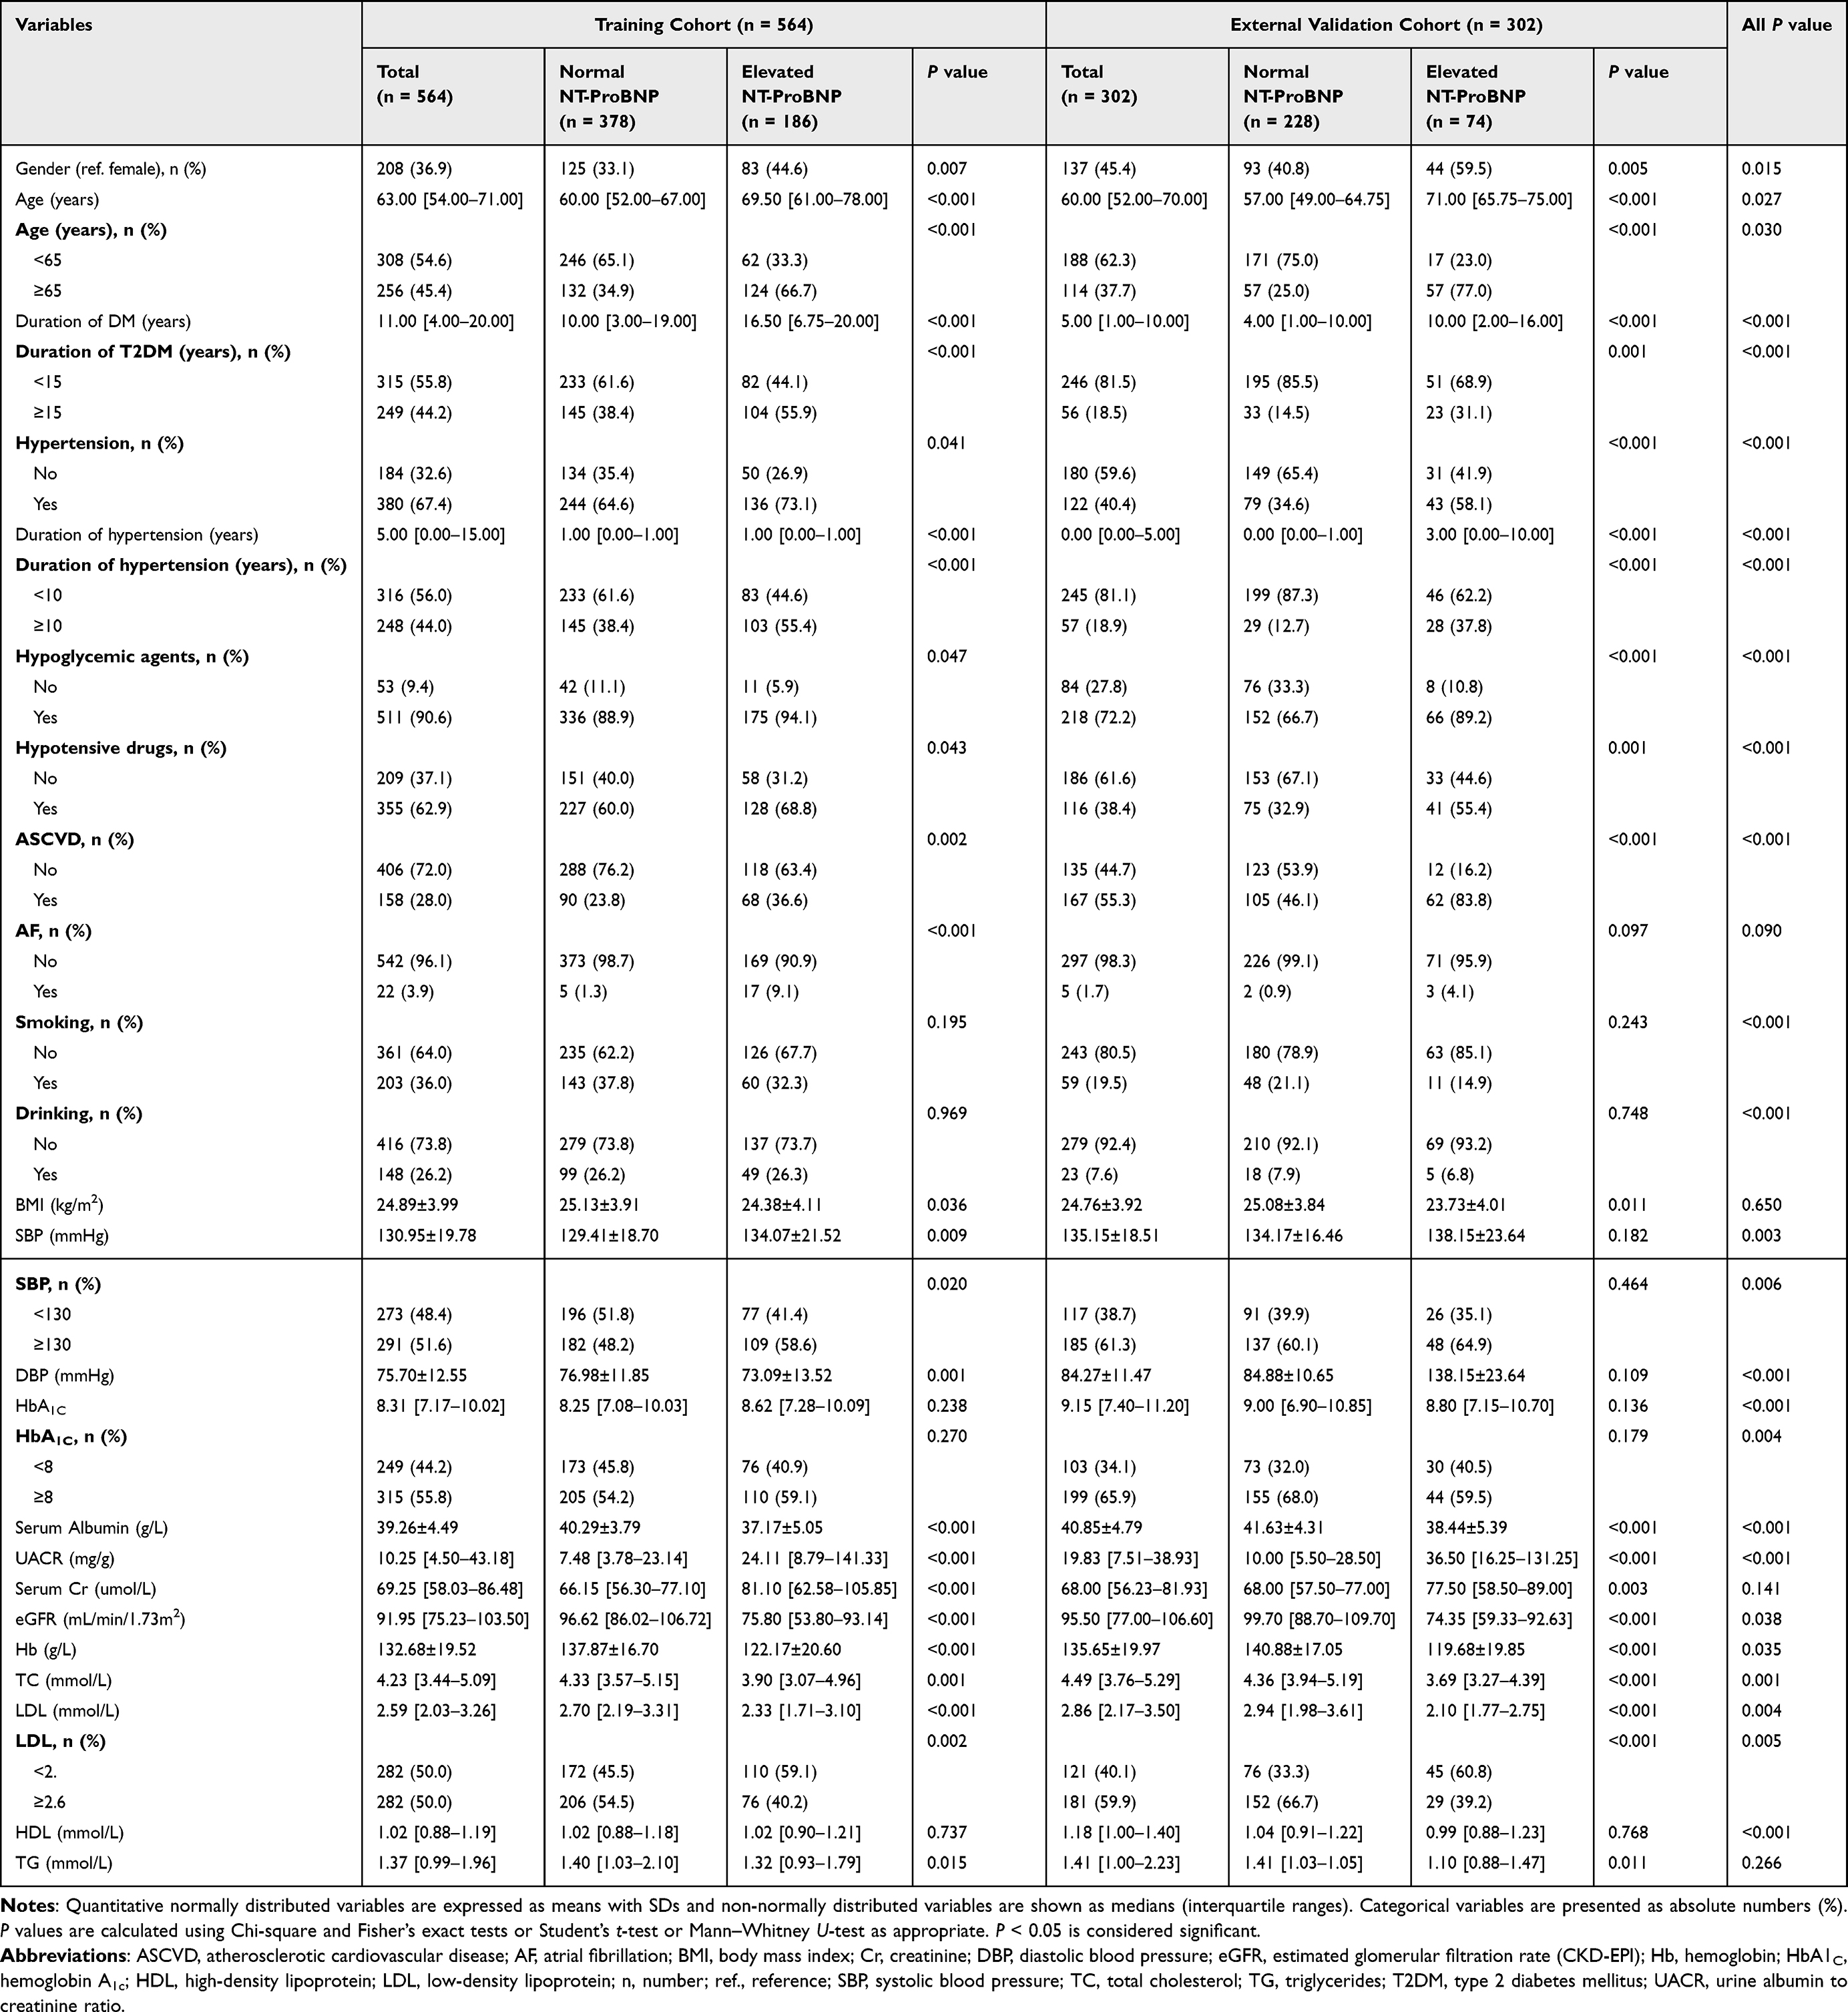 |
Table 1 Demographics and Clinical Characteristics of the Study in the Training Cohort and External Validation Cohort |
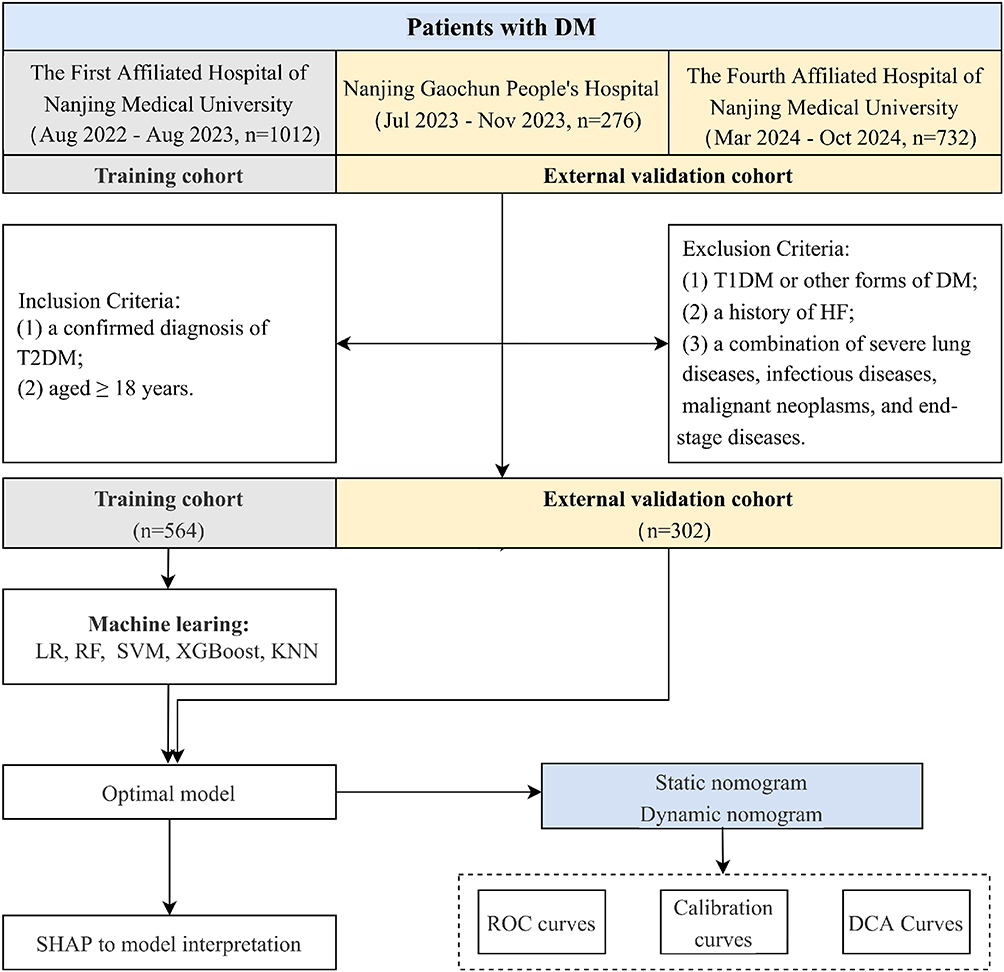 |
Figure 1 Flowchart of the study. Abbreviations: DCA, decision curve analysis; DM, diabetes mellitus; HF, heart failure; KNN, k-nearest neighbor; LR, logistic regression; n, number; RF, random forest; ROC, receiver operator characteristic; SHAP, SHapley Additive exPlanations; SVM, support vector machines; T1DM, Type 1 diabetes mellitus; T2DM, Type 2 diabetes mellitus; XGBoost, extreme gradient boosting. |
Selection of Predictors
In the training cohort, patients with T2DM were divided into two groups: normal NT-ProBNP (n = 378, 67.0%) and elevated NT-ProBNP (n = 186, 23.0%). Compared to patients with normal NT-ProBNP, the univariate analysis revealed that patients with elevated NT-ProBNP were older (P<0.001), more frequently female (P=0.007), and exhibited a longer duration of T2DM (P<0.001), higher levels of SBP (P=0.020), UACR (P<0.001), Cr (P<0.001), and higher proportions of hypertension (P=0.041), ASCVD (P=0.002), AF (P<0.001), serum albumin (P<0.001), eGFR (P<0.001), Hb (P<0.001), TC (P=0.001), LDL (P<0.001), and TG (P=0.015) (Table 1).
Variables with statistically significant differences (P < 0.05) in the univariate analysis of the developmental cohort were incorporated into LASSO regression analysis with 10-fold cross-validation, yielding a λ value at one standard error (λ.1se) of 0.01888967. Features with a coefficient of 0 were considered redundant and removed, resulting in a total of 11 candidate variables. The variable selection process of LASSO regression was illustrated in Figure S1A and B.
Performance Comparison of Five Machine Learning Models
We individually incorporated each of the 11 features into LR, RF, SVM, XGBoost, and KNN ML models, conducting parameter optimization through 5-fold cross-validation. The performance of five ML methods on the training set was shown in Table 2 and Figure S2. The AUC for each model exceeded 0.80, with RF achieving the highest at 0.892 and LR exhibiting the lowest at 0.827. The RF model also demonstrated superior performance in terms of accuracy (0.823), specificity (0.870), and PPV (0.734), while the KNN model exhibited the highest sensitivity score (0.876). We ultimately selected the RF algorithm for clinical implementation. The decision was based on the following key considerations: first, RF achieved the highest overall discriminative power (AUC). Second, and more importantly, its high specificity and positive predictive value mean it is better at correctly identifying patients who are truly at high risk, which helps prevent unnecessary referrals and saves medical resources in primary care settings. Third, the logic behind an RF model is easier to interpret and explain to clinicians using feature importance scores, which builds trust in the tool. Finally, compared to other powerful models like XGBoost, RF is known to be more robust and less sensitive to specific data settings, making it a more stable and reliable choice for a tool designed for real-world use. The efficacy of the RF model was assessed by confusion matrix, as depicted in Figure S3.
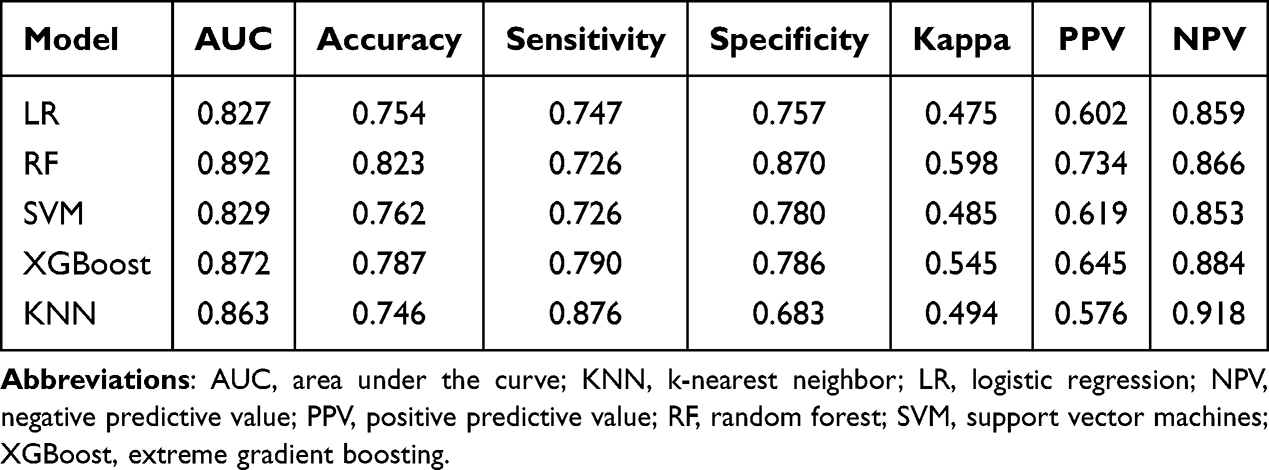 |
Table 2 Performance Metrics of the Machine Learning in the Training Cohort |
Variables Importance and Interpretation
We used the SHAP algorithm to graphically demonstrate the specified features’ impact on the risk of patients with T2DM within the RF model. The SHAP plot illustrated the relative importance of selected variables in the RF model in the training cohort. Figure 2 showed the importance of eleven features, ranked from top to bottom as eGFR, serum albumin, age, Hb, UACR, the presence of age ≥ 65 years, LDL, AF, SBP, the presence of a duration of hypertension ≥ 10 years, and ASCVD, with the x-axis SHAP value reflecting the relative importance of the forecast model. We built five RF models using variables ranked by importance and compared their performance (Table S1 and Figure S4). The RF (top 6) model demonstrated a higher AUC (0.994) than the other three models, but lower than the RF (top 10) model.
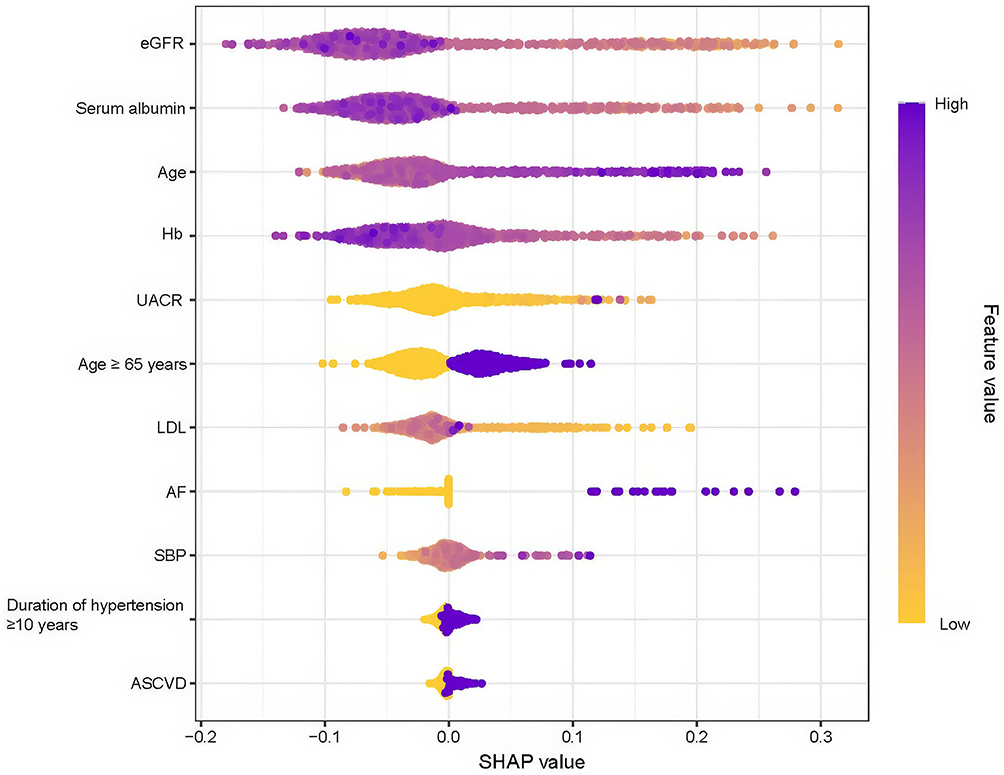 |
Figure 2 SHAP to model interpretation. The importance ranking of the eleven risk factors with stability and interpretation using the RF machine learning model. In this model, a higher SHAP value of a feature indicates a higher risk of an elevated NT-ProBNP for the patient. The purple portion of the feature value represents a higher value, while the yellow portion represents a lower value. Abbreviations: ASCVD, atherosclerotic cardiovascular disease; AF, atrial fibrillation; eGFR, estimated glomerular filtration rate (CKD-EPI); Hb, hemoglobin; LDL, low-density lipoprotein; SBP, systolic blood pressure; SHAP, SHapley Additive exPlanations; UACR, urine albumin to creatinine ratio. |
Nomogram Prediction Model Construction
We developed a nomogram with six features (eGFR, age, serum albumin, Hb, UACR, and age ≥ 65 years) to predict HF risk in patients with T2DM (Figure 3A). We further constructed a dynamic nomogram to improve the nomogram’s convenience (Figure 3B). Users input the six variables, and the web application automatically displays the HF risk with a 95% confidence interval (CI) (https://lyqyjy.shinyapps.io/NT_proBNP_DynNomogram/).
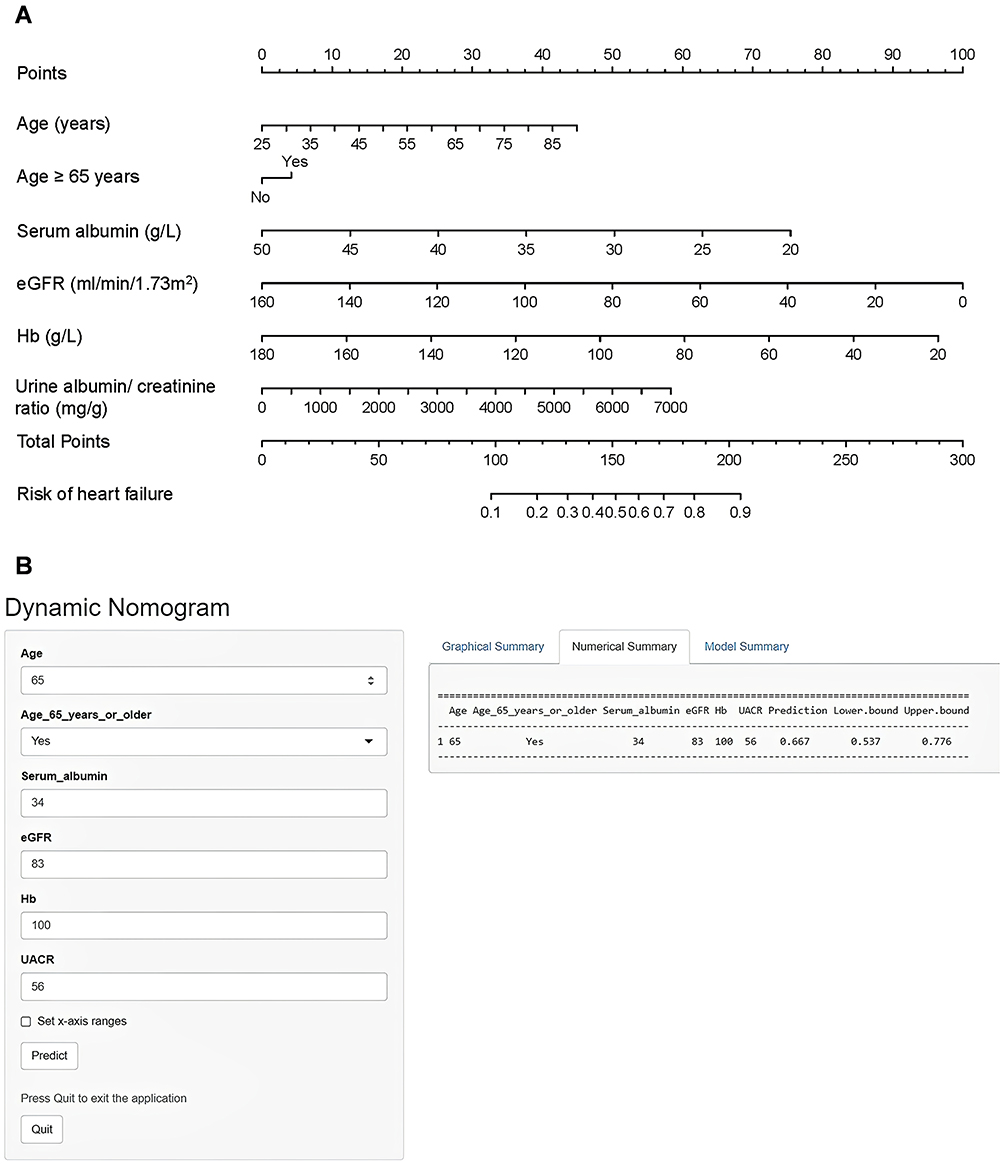 |
Figure 3 Nomogram and dynamic nomogram for predicting heart failure risk in patients with type 2 diabetes mellitus. (A) Static nomogram for heart failure risk prediction. The points assigned for each variable are summed to obtain the total points, which correspond to the individual probability of heart failure. (B) Interactive, web-based dynamic nomogram interface (available at: https://lyqyjy.shinyapps.io/NT_proBNP_DynNomogram/). This clinically oriented tool allows real-time risk calculation by enabling users to input values for the six predictive variables (eGFR, age, serum albumin, Hb, UACR, and age ≥65 years) via adjustable sliders or direct numerical entry. Upon submission, the application instantly computes and displays the individualized probability of elevated NT-proBNP (≥125 pg/mL) along with the 95% confidence interval, providing an accessible and practical decision support tool for point-of-care use in primary care settings. Abbreviations: eGFR, estimated glomerular filtration rate; Hb, hemoglobin; UACR, urine albumin-to-creatinine ratio. |
Evaluation and External Validation of the Nomogram Model
The performance of the nomogram was calculated and compared in both the training and external validation groups. The AUCs for the training cohort and external validation cohort were 0.806 (95% CI, 0.767–0.845) and 0.861 (95% CI, 0.813–0.908), respectively (Figure 4A and B). The calibration curves of the training and validation cohorts demonstrated a high degree of fit between the apparent and bias-corrected values, indicating that the nomogram is an effective tool for predicting the risk of HF (Figure 4C and D). Furthermore, the DCA curve of the training cohort demonstrated that the nomogram exhibited superior clinical predictive power (Figure 4E and F).
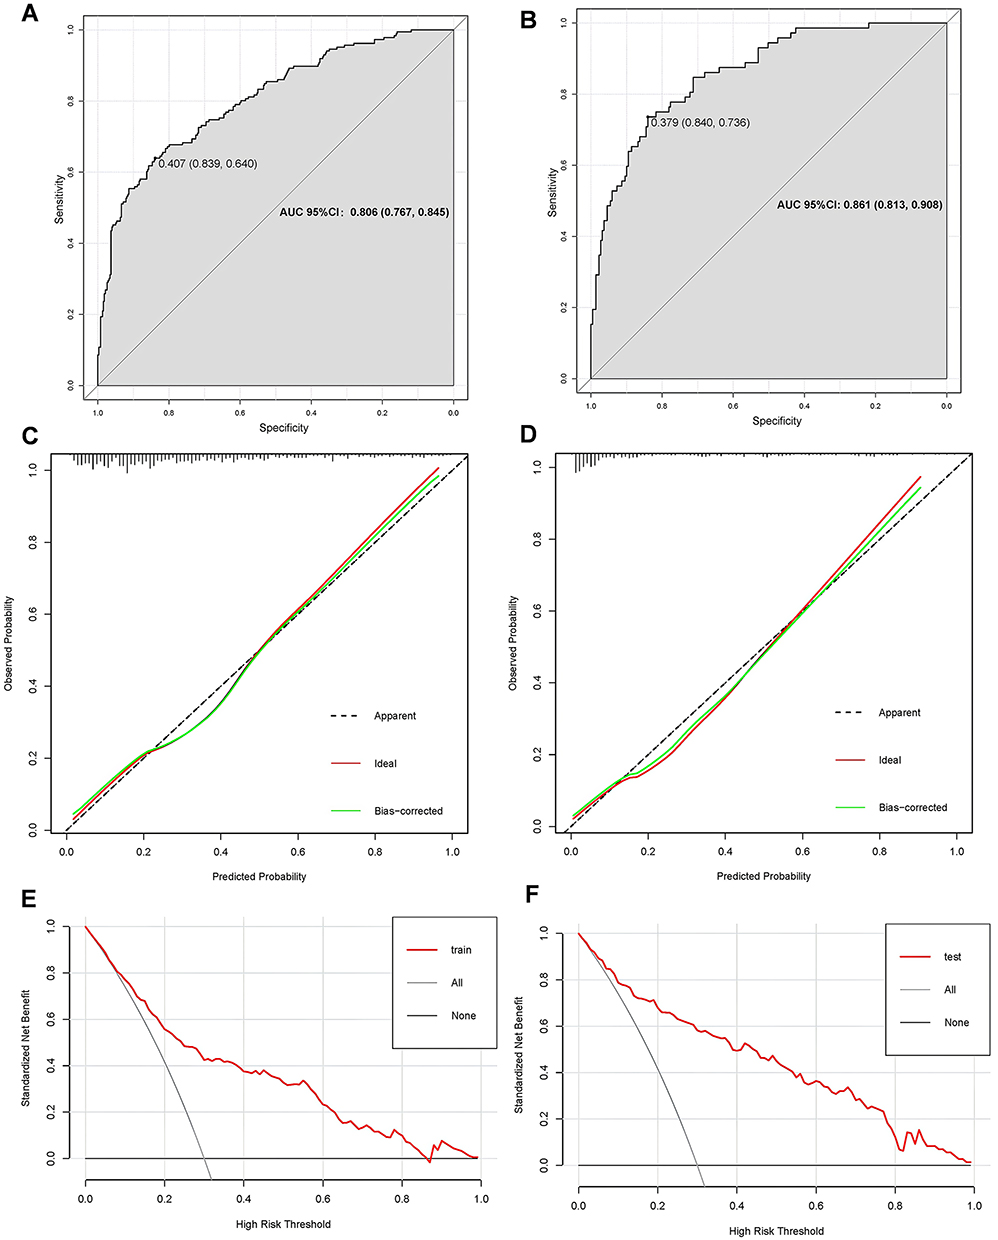 |
Figure 4 Performance of the nomogram in the training and external validation sets. (A) The receiver operating characteristic (ROC) curve of the nomogram in the training cohort. (B) The ROC curve of the nomogram in the external validation cohort. (C) The calibration curve in the training cohort. (D) The calibration curve in the external validation cohort. (E) The decision curve analysis (DCA) curve in the in the training cohort. (F) The DCA curve in the external validation cohort. |
Risk Stratification System
A risk stratification system was implemented using the optimal nomogram score cut-off of 138.2 points, corresponding to a predicted probability of 0.373, which was derived by maximizing the Youden index. This threshold categorized patients into low-risk (n=584; score ≤138.2) and high-risk (n=282; score >138.2) groups. The prevalence of elevated NT-proBNP was significantly higher in the high-risk group (62.4%) than in the low-risk group (14.4%; P<0.001; Figure S5). This substantial risk gradient suggests the nomogram’s potential to effectively stratify T2DM patients for future HF risk.
Association Between the ML-Based Nomogram and TRS-HFDM Risk Stratifications
The Thrombolysis in Myocardial Infarction (TIMI) Risk Score for Heart Failure in Diabetes (TRS-HFDM)5 is a novel, integer-based clinical risk score for predicting hospitalization for HF in patients with T2DM. It incorporates several key clinical variables, including prior HF, history of AF, coronary artery disease, eGFR, and UACR. Based on the total points, risk categories of TRS-HFDM were defined to four groups: low risk, intermediate risk, high risk, and very high risk. We analyzed the association between the ML-based nomogram and TRS-HFDM stratified risk. The predictive scores of the nomogram were strongly correlated with the risk stratifications of TRS-HFDM in both the training and validation sets, thereby indicating that as the nomogram scores increased, the elevated risk of TRS-HFDM also increased (Figure 5A and B).
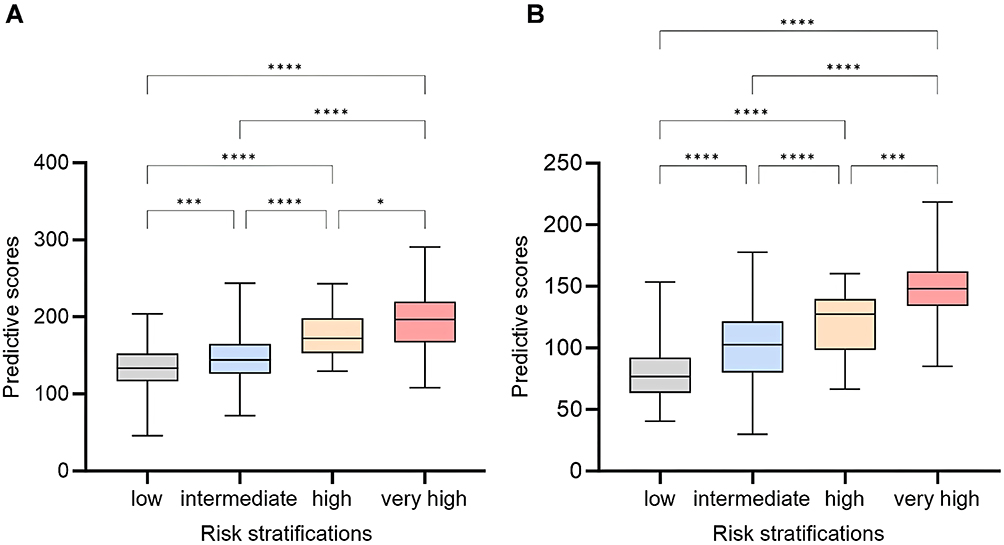 |
Figure 5 Association between the ML-based nomogram and TRS-HFDM risk stratifications. (A) A box plot illustrating the correlation between the TRS-HFDM risk stratifications and the ML-based nomogram predictive scores in the training set. (B) A box plot illustrating the correlation between the TRS-HFDM risk stratifications and the ML-based nomogram predictive scores in the external validation set. *P < 0.05; ***P < 0.001; ****P < 0.0001. Low: Low Predicted Risk Group (0 points). Intermediate: Intermediate Predicted Risk Group (1 points). High: High Predicted Risk Group (2 points). Very high: Very high Predicted Risk Group (≥3 points). |
Discussion
In the present study, we developed and externally validated an ML-based nomogram for predicting the risk of HF in patients with T2DM using an ML algorithm and SHAP importance ranking. We defined individuals with high risk of HF as NT-proBNP ≥125 pg/mL. The variables included in this study were all detectable in community hospitals and were recommended for routine monitoring by the Chinese Guidelines for Prevention and Control of Type 2 Diabetes Mellitus (2020 Edition).15 This ML-based nomogram included 6 routinely assessed clinical variables: eGFR, age, serum albumin, Hb, UACR, and the presence of age ≥ 65 years. The nomogram had excellent discrimination, with an AUC of 0.806 in the training cohort and 0.861 in the validation cohort. Furthermore, we transformed the static model into a web-based calculator, providing a practical tool to assist clinicians in Chinese primary hospitals with HF risk prediction and therapeutic decision-making in patients with T2DM. Given the robust association between T2DM and HF, along with the varying impacts of distinct antidiabetic treatments on HF outcomes, the proposed prediction model may prove useful in guiding antidiabetic drug selection when HF is a consideration.
HF is a prevalent and prognostically important cardiovascular condition linked to T2DM, adversely affecting quality of life, survival rates, and healthcare expenditures.19,20 Early identification is crucial as treatments for HF decrease hospitalization and mortality. A number of mechanisms have been identified as contributing to the development of HF in individuals with T2DM, including hyperglycemia, insulin resistance, impaired calcium handling, and the activation of sodium-hydrogen exchangers, but the potential pathophysiology and underlying molecular mechanisms remain to be further explored.21–27
In regard to the selection of NT-proBNP as a surrogate marker for the occurrence of HF and the definition of NT-proBNP ≥ 125 pg/mL as the cause of high risk of HF, patients with T2DM should be tested for NT-proBNP at least once a year according to the Chinese consensus on the risk assessment and management of panvascular disease in patients with T2DM.28 If NT-proBNP levels surpass 125 pg/mL, indicating potential alterations in cardiac structure or function, we should immediately initiate cardiac protective therapy and further evaluate echocardiography. Abhinav et al identified that biomarkers, particularly NT-proBNP, were among the strongest parameters associated with future risk of HF outcomes.29 This study aimed to facilitate early HF screening for T2DM patients in Chinese community hospitals. This initiative aims to identify high-risk patients for subsequent referral to major tertiary hospitals, aligning with the hierarchical medical system in China. Accordingly, in the present literature, we have defined NT-proBNP ≥ 125 pg/mL as an indicator of an elevated risk for the occurrence of an HF event. To reduce the influence of NT-proBNP ≥ 125 pg/mL replacing the actual occurrence of HF events, we examined the correlation between the current nomogram model and the TRS-HFDM stratification score.5 The findings indicated that predictive outcomes of our nomogram were highly consistent with TRS-HFDM stratification score, hence substantiating the assertion that the present nomogram is an effective tool for identifying patients with high-risk HF in T2DM individuals.
Previous research, which integrated analyses of nearly 15,000 participants from the CANVAS Program and the CREDENCE trial, reported that individuals with T2DM who had reduced eGFR, increased UACR, or both were at increased risk of HF event,30 in accordance with the results of the study. Currently, SGLT2i have been demonstrated to markedly reduce HF risk in populations with T2DM regardless of baseline renal function or albuminuria status and are advised for HF prevention in this patient population.30,31 Together, these findings support the clinical use of eGFR and UACR as key complementary biomarkers to assess the risk of HF in patients with T2DM.
A range of HF risk prediction models has been created for individuals with T2DM, varying in the types of variables included, such as clinical factors,32,33 biomarkers,29,34,35 metabonomics,36 and electrocardiogram (ECG) data;37 as well as modeling approach (traditional33,38 vs ML-based39). Each category carries distinct advantages and limitations across clinical settings. For instance, several established clinical scores integrate parameters that may restrict their broad applicability in primary care screening. The WATCH-DM score, a machine learning-derived tool, incorporates QRS duration from an ECG,40 which is not routinely available in many community T2DM management pathways. Similarly, while biomarker-enhanced models using NT-proBNP and high-sensitivity troponin show strong discriminative performance,34,35 their adoption is limited in settings where such testing is inaccessible. Metabolomics-based models represent another promising approach. As illustrated by Karagiannidis et al, specific metabolomic biomarkers-such as acylcarnitine ratio C4/C18:2, ceramide ratio C24:1/C24:0, and apolipoproteins-have demonstrated significant prognostic value for both clinical outcomes and coronary artery disease complexity in diabetic patients.36 Despite their potential, these models also depend on specialized assays such as liquid chromatography-tandem mass spectrometry, which constrains their feasibility in resource-limited primary care environments. In contrast, our study presents an ML-based nomogram purposefully engineered for resource-limited primary care in China. The model achieves robust predictive performance (AUC 0.861 on external validation) by leveraging only six routinely available clinical variables, deliberately avoiding dependency on ECG, specialized biomarkers, or metabolomic profiling. This design establishes a practical benchmark for HF risk screening in real-world primary care. Furthermore, we address the common trade-off between accuracy and interpretability in ML by integrating SHAP analysis into an intuitive nomogram and web calculator, thus creating a translational bridge between algorithmic sophistication and clinical utility. Building upon these advantages, we explore a potential pathway for integrating this tool into clinical practice. The web-based calculator provides a user-friendly interface for use in primary care. For T2DM patients stratified into the high-risk category (predicted probability ≥ 0.373), the model output may serve as an adjunctive indicator to support clinical decisions. In resource-limited settings without access to NT-proBNP testing, this risk stratification might be considered to help identify patients who could potentially benefit from the initiation of SGLT2i for HF prevention. This represents a pragmatic strategy to guide targeted therapy in the management of the widespread T2DM population within primary care.
Several limitations of our study should be acknowledged. First, the hybrid (retrospective-prospective) design, while pragmatically enriching sample diversity, may introduce selection bias and limits causal inference. Second, although externally validated, the sample size remains relatively modest and was derived from only three hospitals within the same regional healthcare system. This geographic and potential ethnic homogeneity means that our validation primarily tests portability across local clinical settings rather than generalizability to populations with fundamentally different genetic backgrounds, lifestyles, or environmental factors. Therefore, the performance of our model in other regions of China or in other countries requires further investigation. Third, and most critically, is the use of NT-proBNP ≥125 pg/mL as a surrogate endpoint. While this cut-off is clinically justified and guideline-recommended for risk stratification, it is not a direct measure of incident HF. This choice impacts the model’s real-world applicability, as it identifies biomarker-defined high risk, which is not synonymous with a clinical HF diagnosis. Consequently, the model could yield false positives (eg, patients with NT-proBNP elevated due to non-cardiac conditions like renal dysfunction) or false negatives (eg, patients in early stages of HF who have not yet developed significant biomarker elevation). Furthermore, as the model predicts a biomarker surrogate and not hard clinical endpoints, its performance in directly forecasting HF hospitalization or mortality requires prospective validation. Fourth, potential unmeasured confounders-such as detailed lifestyle factors (physical activity, diet), medication adherence, and socioeconomic status-were not accounted for and could influence both predictor values and HF risk. Future studies should prioritize larger, prospective, multi-center cohorts with long-term follow-up to validate the model against hard clinical endpoints. Further refinement could incorporate dynamic variables, investigate feature interactions, or adapt the model for diverse ethnic and healthcare settings.
Conclusion
In summary, we developed and externally validated a machine learning-based nomogram for predicting HF risk in patients with T2DM. The model, which incorporates six routinely available clinical variables (eGFR, age, serum albumin, Hb, UACR, and age ≥ 65 years), demonstrated strong discriminatory power with AUCs of 0.806 and 0.861 in the training and external validation cohorts, respectively. Its predictive scores showed a significant positive correlation with the established TRS-HFDM risk stratification, reinforcing its clinical relevance. The transformation of this model into a publicly accessible web-based calculator enhances its practicality for implementation in primary care settings, particularly where NT-proBNP testing is unavailable. This facilitates the early identification of high-risk T2DM patients, potentially guiding preventative therapies such as SGLT2i. Future research should prioritize prospective validation against hard clinical endpoints, such as HF hospitalization. Further model enhancement may involve incorporating dynamic variables, while studies in broader populations will be essential to assess generalizability and optimize personalized prevention strategies.
Data Sharing Statement
All data generated in this study are available from the corresponding author on reasonable request with a signed agreement for scientific research purposes only.
Ethics Statement
This study was approved by the Research Ethics Committees of the First Affiliated Hospital with Nanjing Medical University (2023-SR-908), the Fourth Affiliated Hospital with Nanjing Medical University (20240315-k029), and Nanjing Gaochun People’s Hospital (AF/SC-05/01.0). The requirement for informed consent was waived for the retrospectively enrolled participants by the Ethics Committees due to the use of anonymized clinical data. For prospectively enrolled participants, written informed consent was obtained.
Acknowledgments
The authors are grateful to all the patients for their participation.
Author Contributions
Yuqing Liu: Data Curation, Methodology, Software, Formal Analysis, Visualization, Validation, Writing - Original Draft, Writing - Review & Editing; Ping Wang: Data Curation, Investigation, Resources; Min Wang: Data Curation, Methodology, Software. Yan Chen: Investigation, Data Curation; Sania Martin Kasyanju: Data Curation, Formal Analysis, Validation; Yuhong Yang: Project Administration, Supervision, Validation. Tao Yang: Resources, Supervision; Li Peng: Funding Acquisition, Supervision, Writing - Review & Editing; Min Sun: Conceptualization, Funding Acquisition, Supervision, Writing - Review & Editing. All authors took part in drafting, revising or critically reviewing the article; gave final approval of the version to be published; have agreed on the journal to which the article has been submitted; and agree to be accountable for all aspects of the work. Li Peng and Min Sun have contributed equally to this work and shared last authorship.
Funding
This work was supported by the Key project of Health Department of Jiangsu Province [grant number K2023046]; the Medical Research Project of Jiangsu Province Health Commission [grant number Z2022048]; the Preventive Medicine Research Project of Jiangsu Province [grant number Ym2023061]; the General Project of Nanjing Health Commission [grant number YKK22211].
Disclosure
The authors have declared that no conflicts of interest exists in this work.
References
1. Saeedi P, Petersohn I, Salpea P, et al. Global and regional diabetes prevalence estimates for 2019 and projections for 2030 and 2045: results from the International Diabetes Federation Diabetes Atlas, 9th edition. Diabetes Res Clin Pract. 2019;157:107843. doi:10.1016/j.diabres.2019.107843
2. Rawshani A, Rawshani A, Franzén S, et al. Mortality and cardiovascular disease in type 1 and type 2 diabetes. N Engl J Med. 2017;376(15):1407–1418. doi:10.1056/NEJMoa1608664
3. Bergenstal RM, Bailey CJ, Kendall DM. Type 2 diabetes: assessing the relative risks and benefits of glucose-lowering medications. Am J Med. 2010;123(4):374.e379–374.e318. doi:10.1016/j.amjmed.2009.07.017
4. Shah AD, Langenberg C, Rapsomaniki E, et al. Type 2 diabetes and incidence of cardiovascular diseases: a cohort study in 1·9 million people. Lancet Diabetes Endocrinol. 2015;3(2):105–113. doi:10.1016/s2213-8587(14)70219-0
5. Berg DD, Wiviott SD, Scirica BM, et al. Heart failure risk stratification and efficacy of sodium-glucose cotransporter-2 inhibitors in patients with type 2 diabetes mellitus. Circulation. 2019;140(19):1569–1577. doi:10.1161/circulationaha.119.042685
6. Zelniker TA, Wiviott SD, Raz I, et al. Comparison of the effects of glucagon-like peptide receptor agonists and sodium-glucose cotransporter 2 inhibitors for prevention of major adverse cardiovascular and renal outcomes in type 2 diabetes mellitus. Circulation. 2019;139(17):2022–2031. doi:10.1161/CIRCULATIONAHA.118.038868
7. Ohkuma T, Jun M, Woodward M, et al. Cardiac stress and inflammatory markers as predictors of heart failure in patients with type 2 diabetes: the ADVANCE Trial. Diabetes Care. 2017;40(9):1203–1209. doi:10.2337/dc17-0509
8. McDonagh TA, Metra M, Adamo M, et al. 2021 ESC Guidelines for the diagnosis and treatment of acute and chronic heart failure. Eur J Heart Fail. 2022;24(1):4–131. doi:10.1002/ejhf.2333
9. Huelsmann M, Neuhold S, Strunk G, et al. NT-proBNP has a high negative predictive value to rule-out short-term cardiovascular events in patients with diabetes mellitus. Eur Heart J. 2008;29(18):2259–2264. doi:10.1093/eurheartj/ehn334
10. Neal B, Perkovic V, Mahaffey KW, et al. Canagliflozin and cardiovascular and renal events in type 2 diabetes. N Engl J Med. 2017;377(7):644–657. doi:10.1056/NEJMoa1611925
11. Sun LY, Zghebi SS, Eddeen AB, et al. Derivation and External Validation of a Clinical Model to Predict Heart Failure Onset in Patients With Incident Diabetes. Diabetes Care. 2022;45(11):2737–2745. doi:10.2337/dc22-0894
12. Buffolo F, Burrello J, Burrello A, et al. Clinical score and machine learning-based model to predict diagnosis of primary aldosteronism in arterial hypertension. Hypertension. 2021;78(5):1595–1604. doi:10.1161/hypertensionaha.121.17444
13. Geng Z, Yang C, Zhao Z, et al. Development and validation of a machine learning-based predictive model for assessing the 90-day prognostic outcome of patients with spontaneous intracerebral hemorrhage. J Transl Med. 2024;22(1):236. doi:10.1186/s12967-024-04896-3
14. Frizzell JD, Liang L, Schulte PJ, et al. Prediction of 30-day all-cause readmissions in patients hospitalized for heart failure. JAMA Cardiol. 2017;2(2):204–209. doi:10.1001/jamacardio.2016.3956
15. Chinese Diabetes Society. Guideline for the prevention and treatment of type 2 diabetes mellitus in China (2020 edition). Chin J Diabetes Mellitus. 2021;13(4):315–409.
16. Heart Failure Group of Chinses Society of Cardiology of Chinses Medical Association, Chinses Heart Failure Association of Chinses Medical Doctor Association, Editorial Board of Chinses Journar of Cardioloy. Chinese guidelines for the diagnosis and treatment of heart failure 2018. Chin J Heart Fail Cardiomyopathy. 2018;2(4):2096–3076.
17. Levey AS, Stevens LA, Schmid CH, et al. A new equation to estimate glomerular filtration rate. Ann Internal Med. 2009;150(9):604–612. doi:10.7326/0003-4819-150-9-200905050-00006
18. Li J, Liu S, Hu Y, et al. Predicting mortality in intensive care unit patients with heart failure using an interpretable machine learning model: retrospective cohort study. J Med Internet Res. 2022;24(8):e38082. doi:10.2196/38082
19. McMurray JJV, Gerstein HC, Holman RR, et al. Heart failure: a cardiovascular outcome in diabetes that can no longer be ignored. Lancet Diabetes Endocrinol. 2014;2(10):843–851. doi:10.1016/s2213-8587(14)70031-2
20. Dauriz M, Targher G, Laroche C, et al. Association between diabetes and 1-year adverse clinical outcomes in a multinational cohort of ambulatory patients with chronic heart failure: results from the ESC-HFA heart failure long-term registry. Diabetes Care. 2017;40(5):671–678. doi:10.2337/dc16-2016
21. Skali H, Shah A, Gupta DK, et al. Cardiac structure and function across the glycemic spectrum in elderly men and women free of prevalent heart disease. Circulation. 2015;8(3):448–454. doi:10.1161/circheartfailure.114.001990
22. Saotome M, Ikoma T, Hasan P, et al. Cardiac insulin resistance in heart failure: the role of mitochondrial dynamics. Int J Mol Sci. 2019;20(14):3552. doi:10.3390/ijms20143552
23. Jankauskas SS, Kansakar U, Varzideh F, et al. Heart failure in diabetes. Metabolism. 2021;125:154910. doi:10.1016/j.metabol.2021.154910
24. Jia D, Zhang J, Liu X, et al. Insulin resistance in skeletal muscle selectively protects the heart in response to metabolic stress. Diabetes. 2021;70(10):2333–2343. doi:10.2337/db20-1212
25. Prandi FR, Evangelista I, Sergi D, et al. Mechanisms of cardiac dysfunction in diabetic cardiomyopathy: molecular abnormalities and phenotypical variants. Heart Fail Rev. 2022;28(3):597–606. doi:10.1007/s10741-021-10200-y
26. Jerkins T, McGill JB, Bell DSH. Heart failure and diabetes: clinical significance and epidemiology of this two‐way association. Diabetes Obes Metab. 2023;25(S3):3–14. doi:10.1111/dom.15062
27. Pandey A, Khan MS, Patel KV, et al. Predicting and preventing heart failure in type 2 diabetes. Lancet Diabetes Endocrinol. 2023;11(8):607–624. doi:10.1016/s2213-8587(23)00128-6
28. Chinese College of Cardiovascular Physicians, the Panel of Chinese Expert Consensus on the Risk Assessment and Management of Panvascular Disease in Patients with Type 2 Diabetes Mellitus. Chinese expert consensus on the risk assessment and management of panvascular disease in patients with type 2 diabetes mellitus (2022 Edition). Chin Circ J. 2022;37(10):974–990.
29. Sharma A, Vaduganathan M, Ferreira JP, et al. Clinical and biomarker predictors of expanded heart failure outcomes in patients with type 2 diabetes mellitus after a recent acute coronary syndrome: insights from the EXAMINE Trial. J Am Heart Assoc. 2020;9(1):e012797. doi:10.1161/jaha.119.012797
30. Sarraju A, Bakris G, Cannon CP, et al. Cardiovascular effects of canagliflozin in relation to renal function and albuminuria. J Am Coll Cardiol. 2022;80(18):1721–1731. doi:10.1016/j.jacc.2022.08.772
31. Hinton W, Feher MD, Munro N, et al. Prescribing sodium-glucose co-transporter-2 inhibitors for type 2 diabetes in primary care: influence of renal function and heart failure diagnosis. Cardiovasc Diabetol. 2021;20(1):130. doi:10.1186/s12933-021-01316-4
32. Kim E, Caraballo PJ, Castro MR, et al. Towards more accessible precision medicine: building a more transferable machine learning model to support prognostic decisions for micro- and macrovascular complications of type 2 diabetes mellitus. J Med Syst. 2019;43(7):185. doi:10.1007/s10916-019-1321-6
33. Williams BA, Geba D, Cordova JM, et al. A risk prediction model for heart failure hospitalization in type 2 diabetes mellitus. Clinl Cardiol. 2019;43(3):275–283. doi:10.1002/clc.23298
34. Berg DD, Wiviott SD, Scirica BM, et al. A biomarker-based score for risk of hospitalization for heart failure in patients with diabetes. Diabetes Care. 2021;44(11):2573–2581. doi:10.2337/dc21-1170
35. Pandey A, Vaduganathan M, Patel KV, et al. Biomarker-based risk prediction of incident heart failure in pre-diabetes and diabetes. JACC Heart Fail. 2021;9(3):215–223. doi:10.1016/j.jchf.2020.10.013
36. Karagiannidis E, Moysidis DV, Papazoglou AS, et al. Prognostic significance of metabolomic biomarkers in patients with diabetes mellitus and coronary artery disease. Cardiovasc Diabetol. 2022;21(1):70. doi:10.1186/s12933-022-01494-9
37. Soh CH, de Sá AGC, Potter E, et al. Use of the energy waveform electrocardiogram to detect subclinical left ventricular dysfunction in patients with type 2 diabetes mellitus. Cardiovasc Diabetol. 2024;23(1):91. doi:10.1186/s12933-024-02141-1
38. Kirchmair R, Ahmad Kiadaliri A, Gerdtham U-G, et al. Towards renewed health economic simulation of type 2 diabetes: risk equations for first and second cardiovascular events from swedish register data. PLoS One. 2013;8(5):e62650. doi:10.1371/journal.pone.0062650
39. Basu S, Sussman JB, Berkowitz SA, et al. Development and validation of Risk Equations for Complications Of type 2 Diabetes (RECODe) using individual participant data from randomised trials. Lancet Diabetes Endocrinol. 2017;5(10):788–798. doi:10.1016/s2213-8587(17)30221-8
40. Segar MW, Vaduganathan M, Patel KV, et al. Machine learning to predict the risk of incident heart failure hospitalization among patients with diabetes: the WATCH-DM risk score. Diabetes Care. 2019;42(12):2298–2306. doi:10.2337/dc19-0587
 © 2025 The Author(s). This work is published and licensed by Dove Medical Press Limited. The
full terms of this license are available at https://www.dovepress.com/terms
and incorporate the Creative Commons Attribution
- Non Commercial (unported, 4.0) License.
By accessing the work you hereby accept the Terms. Non-commercial uses of the work are permitted
without any further permission from Dove Medical Press Limited, provided the work is properly
attributed. For permission for commercial use of this work, please see paragraphs 4.2 and 5 of our Terms.
© 2025 The Author(s). This work is published and licensed by Dove Medical Press Limited. The
full terms of this license are available at https://www.dovepress.com/terms
and incorporate the Creative Commons Attribution
- Non Commercial (unported, 4.0) License.
By accessing the work you hereby accept the Terms. Non-commercial uses of the work are permitted
without any further permission from Dove Medical Press Limited, provided the work is properly
attributed. For permission for commercial use of this work, please see paragraphs 4.2 and 5 of our Terms.
Recommended articles
Using Machine Learning Algorithms to Predict High-Risk Factors for Postoperative Delirium in Elderly Patients
Liu Y, Shen W, Tian Z
Clinical Interventions in Aging 2023, 18:157-168
Published Date: 8 February 2023
Development of Machine Learning Models for Predicting Osteoporosis in Patients with Type 2 Diabetes Mellitus—A Preliminary Study
Wu X, Zhai F, Chang A, Wei J, Guo Y, Zhang J
Diabetes, Metabolic Syndrome and Obesity 2023, 16:1987-2003
Published Date: 30 June 2023
Identification of Shared Immune Cells and Immune-Related Co-Disease Genes in Chronic Heart Failure and Systemic Lupus Erythematosus Based on Transcriptome Sequencing

Luo Z, Lu G, Yang Q, Ding J, Wang T, Hu P
Journal of Inflammation Research 2023, 16:2689-2705
Published Date: 30 June 2023
Prediction of the Risk of Bone Mineral Density Decrease in Type 2 Diabetes Mellitus Patients Based on Traditional Multivariate Logistic Regression and Machine Learning: A Preliminary Study
Zhang J, Xu Z, Fu Y, Chen L
Diabetes, Metabolic Syndrome and Obesity 2023, 16:2885-2898
Published Date: 19 September 2023
Remnant Cholesterol Inflammatory Index for Predicting Heart Failure Risk in Patients with Coronary Artery Disease and Type 2 Diabetes: A Retrospective Study Using Multiple Machine Learning Approaches
Luo C, Du J, Zhang C
Risk Management and Healthcare Policy 2025, 18:4027-4036
Published Date: 26 December 2025