
Back to Journals » International Journal of General Medicine » Volume 19
Deep Learning-Based Assessment of the Value of Vertebral Structural Parameters in Predicting Osteoporotic Vertebral Compression Fractures on Opportunistic CT Scans
Authors Qin J, Li J, Liang Y, Yu M, Ran Z, Yao Q, Noor Shafini M, Ramli I 
Received 8 January 2026
Accepted for publication 2 April 2026
Published 9 April 2026 Volume 2026:19 594749
DOI https://doi.org/10.2147/IJGM.S594749
Checked for plagiarism Yes
Review by Single anonymous peer review
Peer reviewer comments 3
Editor who approved publication: Dr Vinay Kumar
Jian Qin,1,2 Jiang Li,1,2 Yanbo Liang,2 Mohan Yu,3 Zhangshen Ran,2 Qianqian Yao,2 Mohamad Noor Shafini,4 Izzad Ramli5
1Faculty of Health Sciences, Universiti Teknologi MARA, Shah Alam, Selangor, Malaysia; 2The Second Affiliated Hospital of Shandong First Medical University, Tai’an, Shandong, People’s Republic of China; 3Shandong First Medical University, Tai’an, Shandong, People’s Republic of China; 4Medical Imaging, Faculty of Health and Life Sciences, University of Exeter, Exeter, UK; 5College of Computing, Informatics and Mathematics, Universiti Teknologi MARA, Shah Alam, Selangor, Malaysia
Correspondence: Mohamad Noor Shafini, Medical Imaging, Faculty of Health and Life Sciences, University of Exeter, Exeter, UK, Email [email protected] Izzad Ramli, College of Computing, Informatics and Mathematics, Universiti Teknologi MARA, Shah Alam, Selangor, Malaysia, Email [email protected]
Background: Osteoporotic vertebral compression fractures are common fragility fractures in older adults and are associated with substantial disability and healthcare burden. Opportunistic CT may provide a practical no-extra-radiation pathway for fracture-risk assessment, but quantitative vertebral structural parameters, especially cortical parameters, remain insufficiently studied.
Purpose: To evaluate the value of vertebral structural parameters derived from opportunistic CT in identifying osteoporotic vertebral compression fractures and to develop a nomogram for individualized risk estimation.
Methods: This retrospective single-center study included 298 patients aged 45 years or older who underwent chest or abdominal CT at the Second Affiliated Hospital of Shandong First Medical University between January 2020 and May 2024. Osteoporotic vertebral compression fracture status on sagittal CT was determined by two readers (one radiology resident and one senior physician) by consensus. A high-resolution 3D Dense-U-Net was used for automated vertebral segmentation and extraction of L1 structural parameters. Group comparisons were performed with t tests, one-way analysis of variance, and chi-squared tests as appropriate. Independent predictors were identified with univariate and multivariate logistic regression, and the nomogram was evaluated with receiver operating characteristic and calibration analyses.
Results: Of the 298 participants (182 men and 116 women; mean age, 62.33 ± 9.56 years), 134 had osteoporotic vertebral compression fractures and 164 did not. In multivariate analysis, L1 cortical average area (OR, 0.99; 95% CI, 0.99– 1.00; P = 0.002) and L1 cortical average thickness (OR, 0.22; 95% CI, 0.13– 0.38; P < 0.001) were independent predictors. The nomogram achieved an area under the curve of 0.867 (95% CI, 0.817– 0.918) in the training cohort and 0.804 (95% CI, 0.709– 0.899) in the validation cohort.
Conclusion: Quantitative vertebral structural parameters derived from opportunistic CT, particularly cortical parameters, showed good performance for identifying osteoporotic vertebral compression fracture risk in this single-center cohort. These findings support the potential value of deep learning-assisted quantitative assessment for opportunistic screening, although external validation is still required before broader clinical implementation.
Keywords: osteoporotic vertebral compression fracture, opportunistic CT, cortical bone, deep learning-assisted segmentation, nomogram
Introduction
Osteoporosis (OP) is a common systemic skeletal disease in older adults and a major cause of fragility fracture. Osteoporotic vertebral compression fracture (OVCF) is among its most frequent and clinically important complications and is associated with pain, disability, reduced quality of life, and increased healthcare use.1–4 Early identification of patients at elevated fracture risk is therefore essential. Current OP management includes lifestyle modification, adequate calcium and vitamin D intake, exercise and fall-prevention strategies, antiresorptive therapy, anabolic therapy, and risk-based monitoring, but these interventions depend on timely identification of at-risk patients.2–5
Large numbers of chest and abdominal CT examinations acquired for other clinical indications include part or all of the thoracolumbar spine and therefore provide an opportunity for opportunistic screening without additional radiation exposure or dedicated imaging cost. Previous opportunistic CT studies have mainly relied on vertebral attenuation values or radiomics-derived features.6,7 Although dual-energy X-ray absorptiometry and quantitative CT are established approaches to bone mineral density assessment, they are not routinely available for all patients undergoing non-bone imaging and therefore do not fully address opportunistic screening needs. Previous attenuation-based approaches can also be influenced by scanner-related factors and often emphasize trabecular bone or overall CT value rather than cortical structure. Cortical bone is a key contributor to vertebral mechanical strength, yet quantitative research on cortical structural parameters for OVCF prediction remains limited.8–11
Deep learning methods are increasingly used in medical image analysis, and machine-learning approaches have also been applied to the prediction of musculoskeletal and other disorders using clinical or anthropometric variables.12–18 For vertebral assessment, automated segmentation can improve the efficiency and reproducibility of quantitative analysis. The 3D Dense-U-Net used in our workflow performs automated three-dimensional vertebral cortical and trabecular segmentation at the original image resolution, enabling extraction of quantitative structural parameters from routine CT data.19 Compared with conventional encoder-decoder segmentation networks, its dense connectivity promotes feature reuse and more stable gradient propagation, which is advantageous for preserving thin cortical boundaries during automated measurement.19 We hypothesized that quantitative L1 vertebral structural parameters derived from opportunistic CT, especially cortical parameters, would be associated with OVCF and could support a clinically usable nomogram for individualized risk estimation.
Methods
Study Population
This retrospective single-center study was conducted at the Second Affiliated Hospital of Shandong First Medical University (Tai’an, Shandong, China). We screened consecutive patients who underwent chest or abdominal CT examinations between January 2020 and May 2024. The study was approved by the UiTM Research Ethics Committee and the Ethics Committee of the Second Affiliated Hospital of Shandong First Medical University. The requirement for informed consent was waived because this was a retrospective analysis of existing de-identified clinical and imaging data with no direct patient contact or intervention. Patient confidentiality was protected throughout data collection and analysis, and the study was conducted in accordance with the Declaration of Helsinki. The manuscript was revised with reference to the STROBE recommendations for observational studies. The inclusion criteria were: (1) complete inclusion of the L1 vertebral body within the scan range; (2) complete clinical and imaging data; and (3) age ≥45 years. The exclusion criteria were: (1) vertebral fractures caused by high-energy trauma; (2) previous hyperparathyroidism, tumors, or hypocalcemia; and (3) long-term glucocorticoid use or other long-term medication likely to affect bone metabolism. Demographic data (age and sex), hematological data obtained on admission (hemoglobin [HGB], glycated hemoglobin [HbA1C], hypersensitive C-reactive protein [hCRP], high-density lipoprotein [HDL], low-density lipoprotein [LDL], triglyceride [TG], total cholesterol [TC], free fatty acid [FFA], and glucose [GLU]), and imaging data (structural parameters of the L1 vertebral body) were collected (Figure 1). A total of 298 eligible patients were included and divided into non-fractured and fractured groups, with additional age-stratified analyses for 45–60 years, 61–70 years, and >70 years. No a priori sample-size calculation was performed because all eligible patients during the predefined study period were included.
 |
Figure 1 Representative sagittal CT image showing automated vertebral segmentation. |
CT Scanning and Patients Grouping
All patients underwent chest or abdominal CT examinations using a General Electric (GE) Revolution CT scanner. Scanning parameters were as follows: tube voltage, 120 kVp; tube current, 355 mA; slice thickness and interval, 5 mm; thin-slice thickness, 1.25 mm; pitch, 0.984; and tube rotation time, 0.8 s. The primary outcome was the presence of OVCF on sagittal CT images. OVCF was defined on the basis of vertebral compression deformity with imaging findings compatible with osteoporotic fracture after exclusion of high-energy trauma, tumor, and other listed secondary causes. OVCF status was determined by two readers (one radiology resident and one senior physician), and the final grouping was established by consensus. A formal blinded rereading protocol was not performed.
Image Reconstruction and Measurement of Vertebral Structure Parameters
The thin-slice CT sequences were transmitted to the GE AW4.7 post-processing platform. Under bone-window settings (window width 2000 HU, window level 350 HU), the L1 vertebral bodies were reconstructed into Digital Imaging and Communications in Medicine (DICOM) images with a slice thickness of 1.25 mm using the reformat function. The images were then imported into the CT spine bone quantitative system developed by the Second Affiliated Hospital of Shandong First Medical University and Hangzhou Shimai Company (Computer Software Copyright Registration No. 2024SR0222436) to measure vertebral structural parameters.19 This software uses a previously reported 3D Dense-U-Net-based workflow to automatically segment cortical and trabecular bone and quantify vertebral cortical average area (mm2), cortical average thickness (mm), cortical volume (mm3), average maximum diameter length of trabecular (μm), average minimum diameter length of trabecular (μm), and trabecular volume (μm3). All examinations were performed without contrast agents. The present study used this deep learning-based segmentation framework for automated quantitative extraction; the final fracture-prediction tool was a logistic-regression-based nomogram rather than a deep learning classifier.
Statistical Analysis
Statistical analyses were performed with SPSS 27.0 and R software. Normality was assessed using the Kolmogorov–Smirnov test, and homogeneity of variance was assessed using the Levene test. Continuous variables are presented as mean ± standard deviation for normally distributed data and median with interquartile range for non-normal data. Between-group comparisons of normally distributed variables were performed with two-sample t tests, whereas comparisons across multiple groups were performed with one-way analysis of variance and post hoc pairwise comparison by the least significant difference method. Categorical variables were analyzed with chi-squared tests. The cohort was randomly divided into training (70%) and validation (30%) subsets using a fixed seed (seed = 123), and the split was completed before variable selection to avoid data leakage. Potential predictors were explored with univariate logistic regression and then entered into multivariable logistic regression to identify independent predictors. The final regression model was visualized as a nomogram. Model discrimination was assessed with receiver operating characteristic (ROC) analysis, calibration was evaluated with calibration curves, and clinical utility was assessed with decision curve analysis. As an exploratory descriptive analysis, age-stratified discrimination of the final nomogram score was also summarized in the overall cohort. Two-sided P < 0.05 was considered statistically significant.
Results
Clinical and Vertebral Structural Data in Non-Fractured and Fractured Groups
A total of 298 participants (182 men, 116 women; mean age, 62.33 ± 9.56 years; range, 45–92 years) met the inclusion and exclusion criteria for this study. In addition, based on the imaging examination results, the patients were divided into a non-fractured group (n = 164) and a fractured group (n = 134).
Table 1 showed the clinical baseline characteristics of participants in both non-fractured and fractured groups. There was a significant difference between the two groups of patients in terms of sex and hCRP (P < 0.05). The hCRP of patients in the fractured group was significantly higher than that in the non-fractured group. There were no significant differences in terms of other clinical characteristics (P > 0.05).
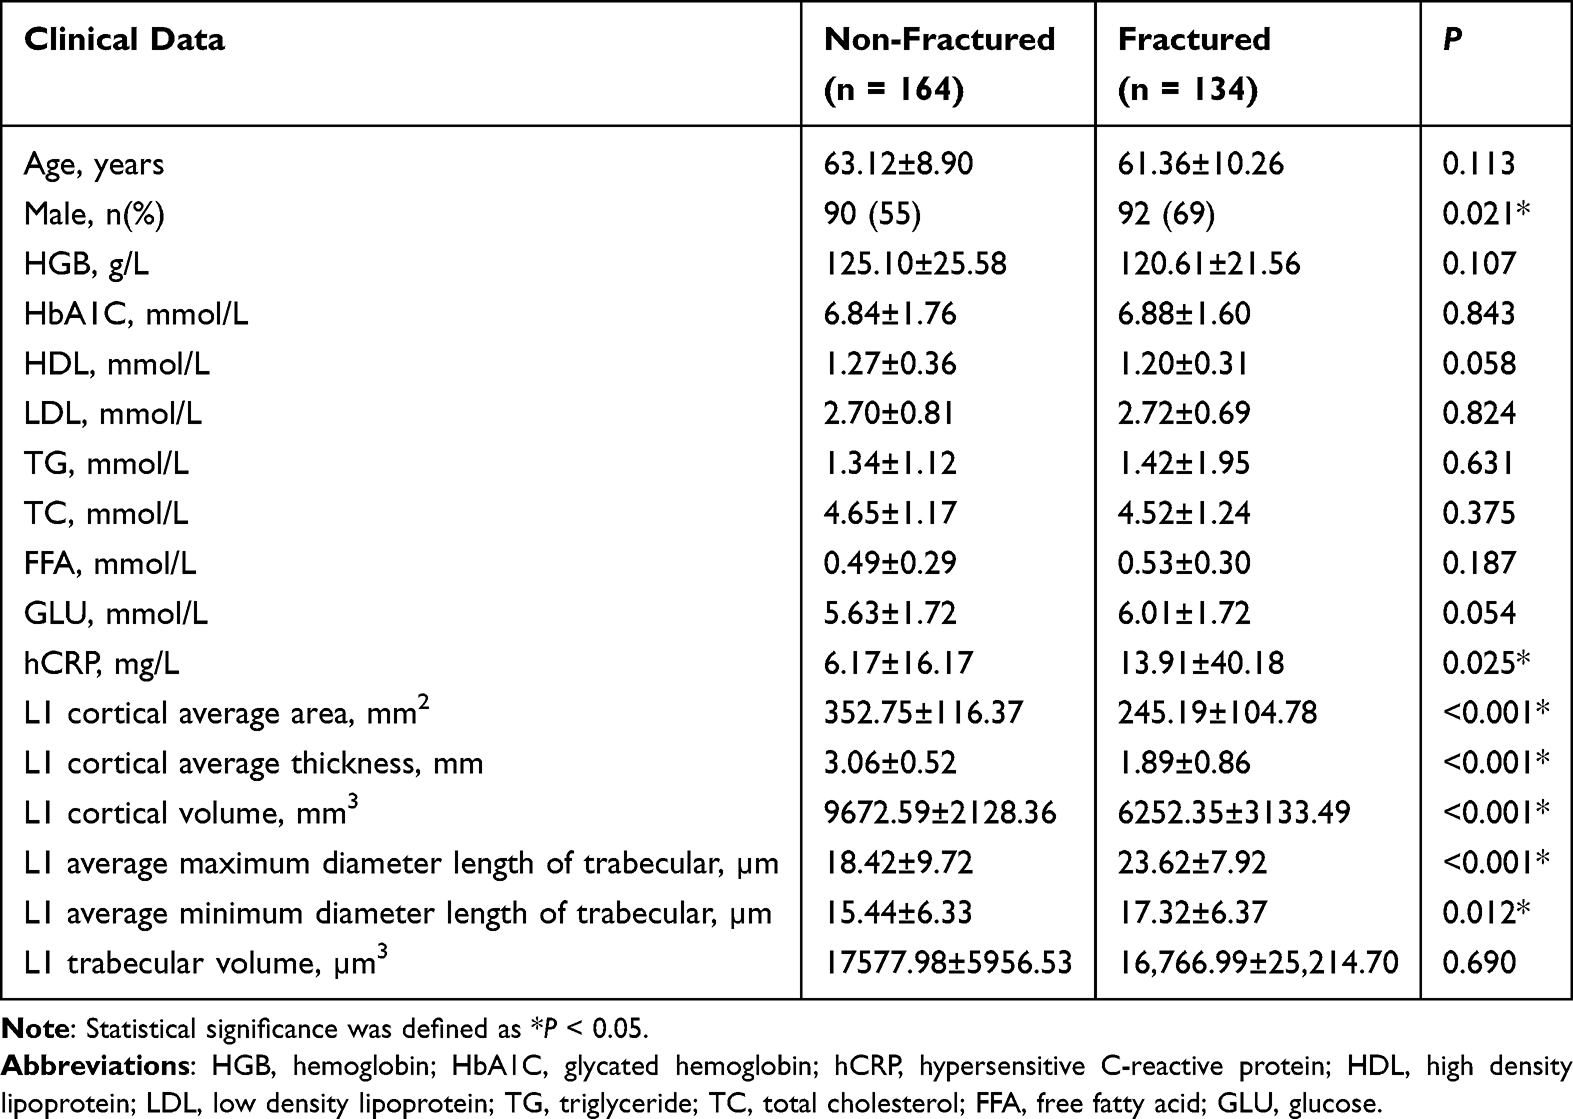 |
Table 1 Clinical Data and Vertebral Structural Parameters in Non-Fractured and Fractured Groups |
Table 1 also shows the vertebral structural parameters in the non-fractured and fractured groups. Significant between-group differences were observed for L1 cortical average area, L1 cortical average thickness, L1 cortical volume, L1 average maximum diameter length of trabecular, and L1 average minimum diameter length of trabecular (all P < 0.05). L1 cortical average area, L1 cortical average thickness, and L1 cortical volume were lower in the fractured group, whereas L1 average maximum diameter length of trabecular and L1 average minimum diameter length of trabecular were higher. L1 trabecular volume did not differ significantly between groups (P = 0.690).
Clinical and Vertebral Structural Data in Non-Fractured and Fractured Groups Among Three Age Groups
Table 2 shows the clinical and vertebral structural data in the non-fractured and fractured groups across the three age strata. Across age groups, age and most vertebral structural parameters changed significantly, whereas L1 trabecular volume did not show a significant across-age difference. There were no significant across-age differences in the other clinical variables (all P > 0.05).
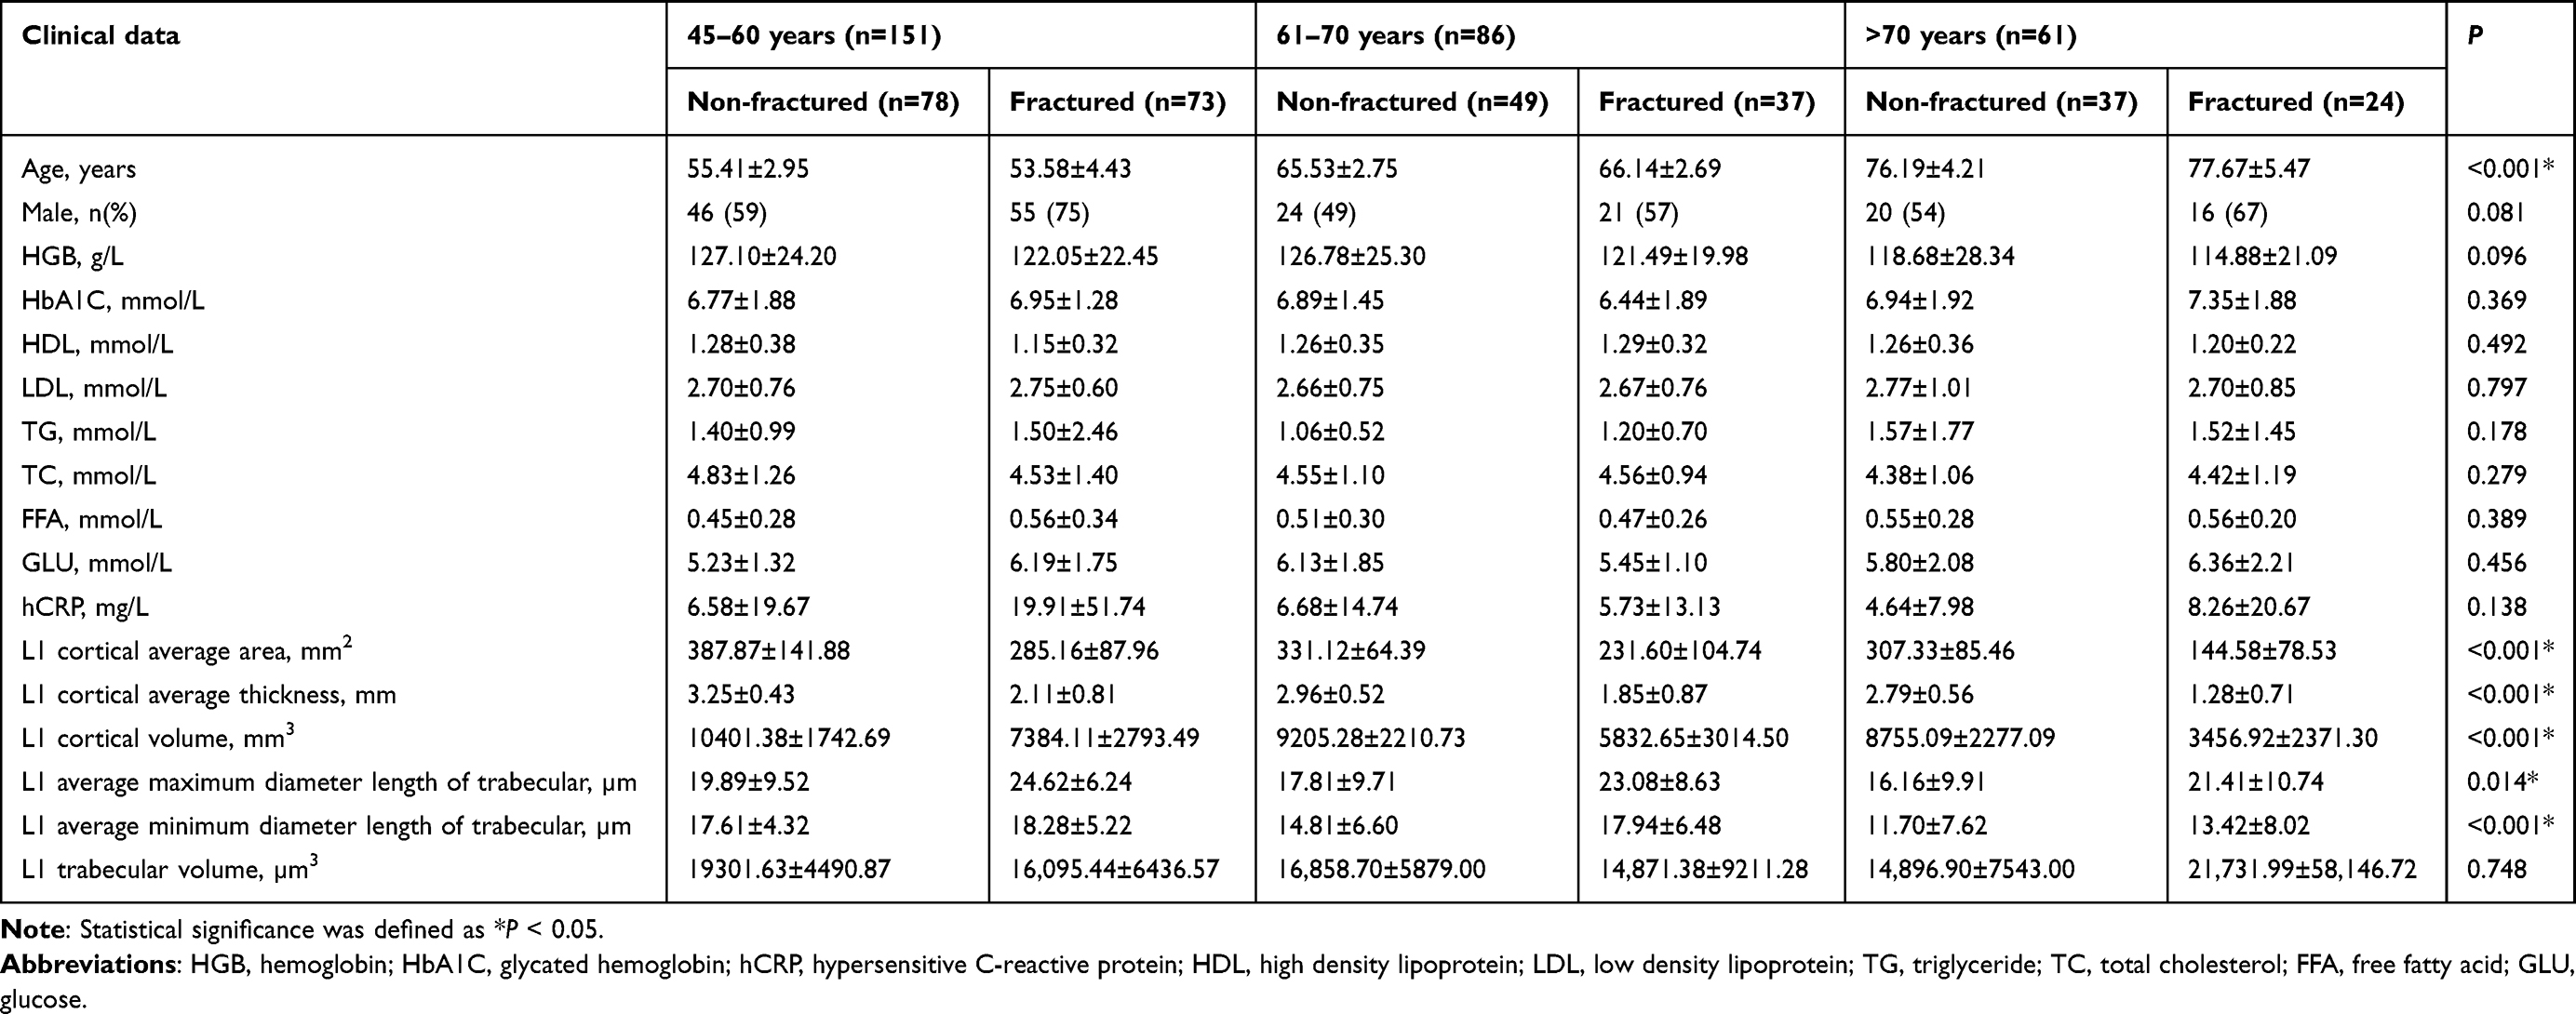 |
Table 2 Clinical and Vertebral Structural Data in Non-Fractured and Fractured Groups Among Three Age Groups |
The pattern of between-group differences varied by age stratum. In the 45–60-year group, significant differences were observed for age, sex, HDL, FFA, GLU, hCRP, L1 cortical average area, L1 cortical average thickness, L1 cortical volume, L1 average maximum diameter length of trabecular, and L1 trabecular volume (Table S1). In the 61–70-year group, between-group differences were observed mainly in L1 cortical average area, L1 cortical average thickness, L1 cortical volume, L1 average maximum diameter length of trabecular, and L1 average minimum diameter length of trabecular (Table S2). In the >70-year group, significant differences were limited to L1 cortical average area, L1 cortical average thickness, and L1 cortical volume (Table S3).
Construction of the Predictive Model
Subsequently, we conducted univariate and multivariate logistic regression analyses to investigate the association between clinical and vertebral structural parameters and OVCF. The multivariate analysis indicated that L1 cortical average area [odds ratio (OR), 0.99; 95% confidence interval (CI), 0.99–1.00] and L1 cortical average thickness (OR, 0.22; 95% CI, 0.13–0.38) were independent predictors of OVCF (Table 3). The cohort was partitioned into a training cohort (n = 209) and a validation cohort (n = 89) with a 7:3 ratio. These predictors were used to establish the predictive model. A nomogram model was established by multivariate logistic regression analysis (Figure 2).
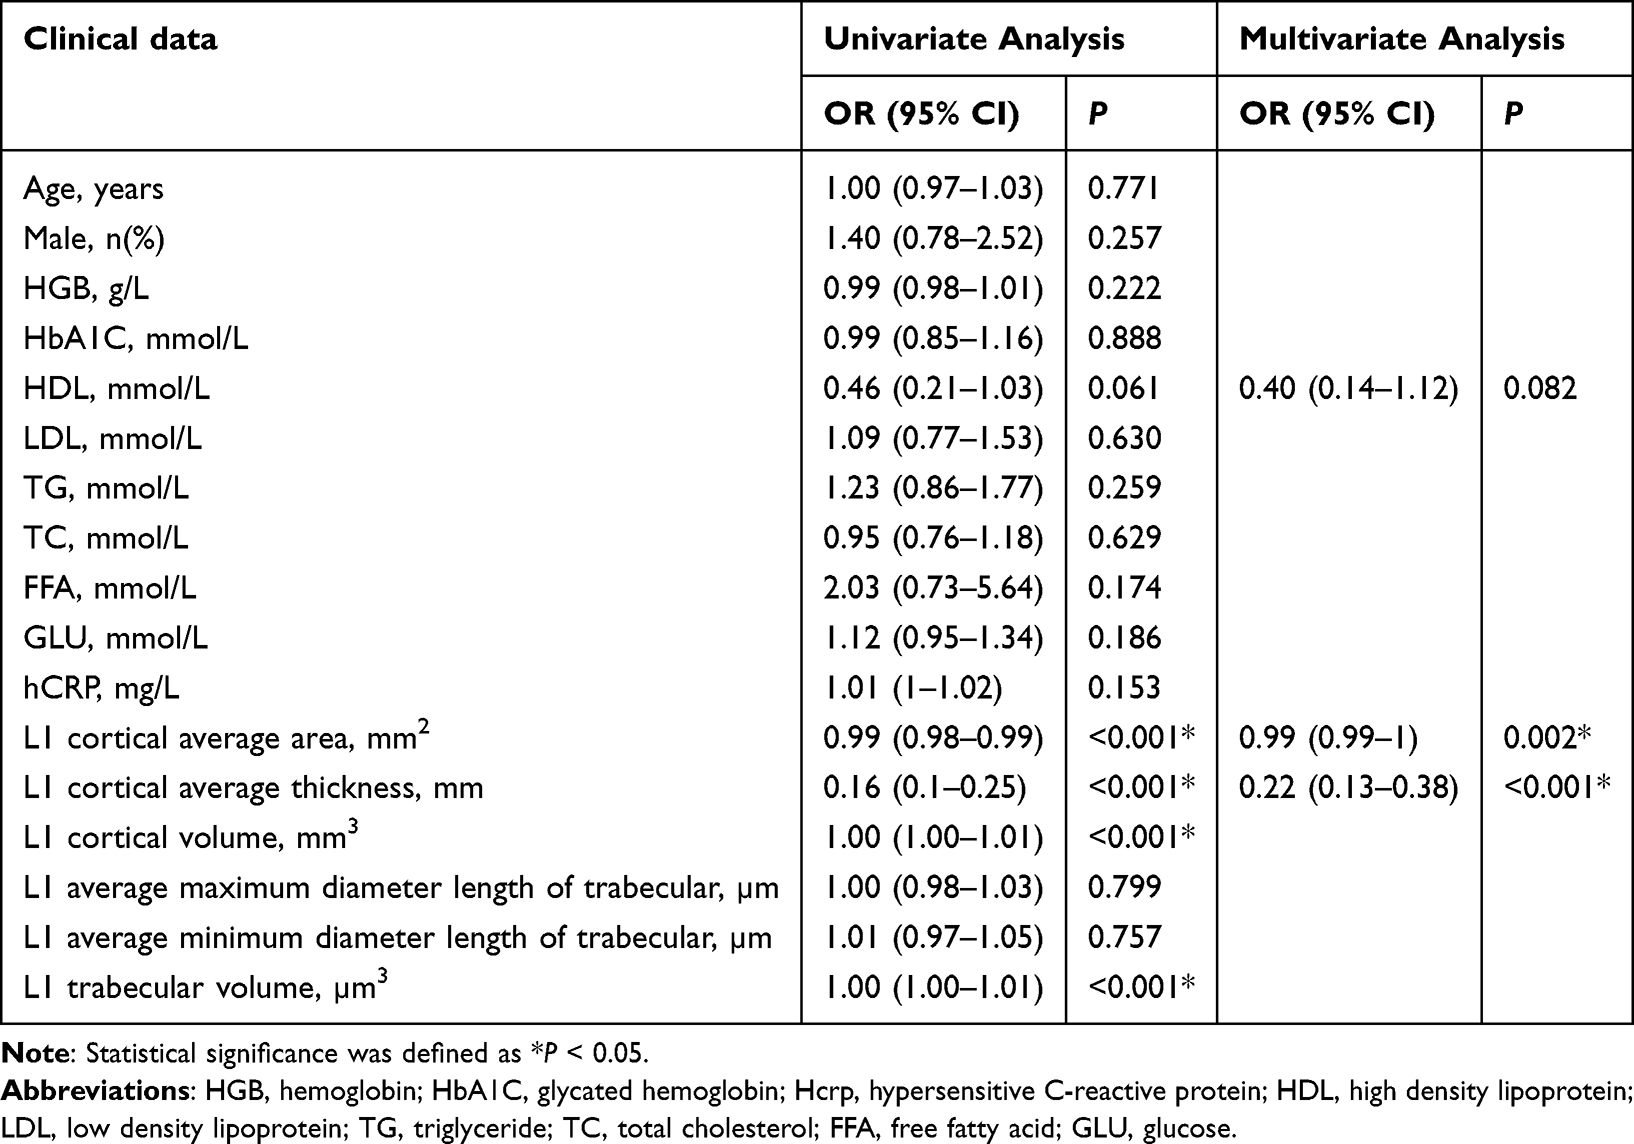 |
Table 3 Univariate and Multivariate Logistic Regression Analysis for Clinical and Vertebral Structural Parameters |
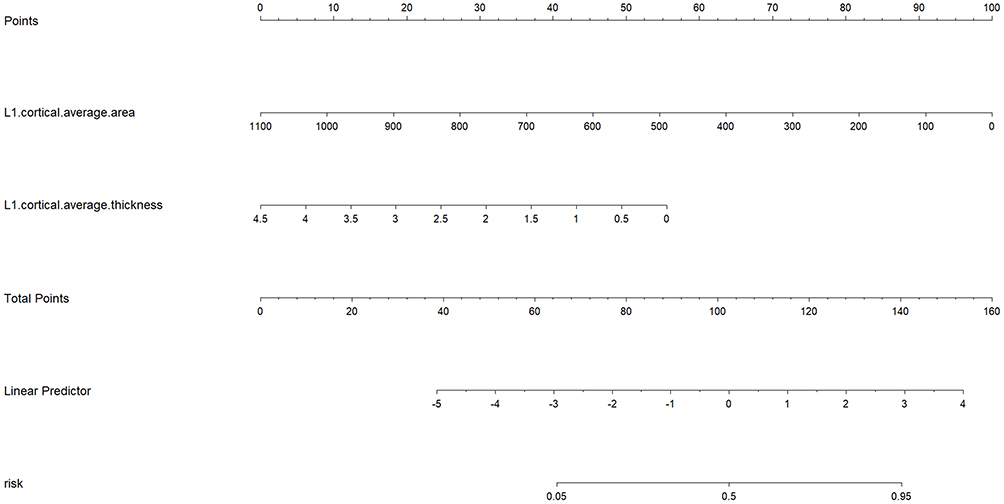 |
Figure 2 Nomogram of the logistic-regression-based prediction model for estimating the risk of osteoporotic vertebral compression fractures. |
In the training cohort, the AUC was 0.867 (95% CI, 0.817–0.918), with accuracy, sensitivity, and specificity of 0.814, 0.929, and 0.688, respectively. In the validation cohort, the AUC was 0.804 (95% CI, 0.709–0.899), with accuracy, sensitivity, and specificity of 0.775, 0.765, and 0.789, respectively (Table 4, Figure 3). The calibration curves showed acceptable agreement between predicted and observed risk in both cohorts (Figure 4). In an exploratory age-stratified analysis using the final nomogram score in the overall cohort, the AUCs were 0.885 (95% CI, 0.827–0.935) in patients aged 45–60 years, 0.873 (95% CI, 0.792–0.943) in those aged 61–70 years, and 0.935 (95% CI, 0.840–0.995) in those older than 70 years (Table S4). These subgroup estimates should be interpreted cautiously because the stratum-specific sample sizes were limited.
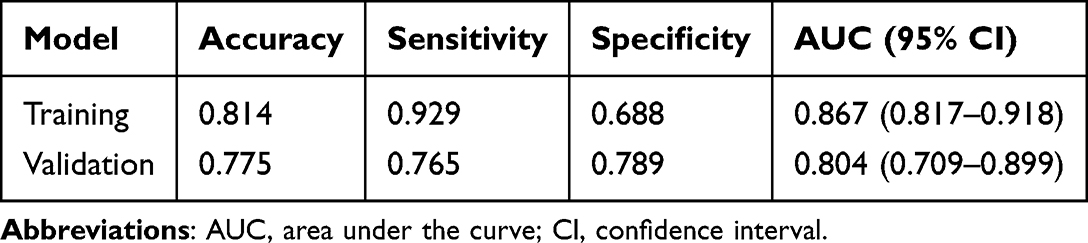 |
Table 4 Diagnostic Performance of the Model for Predicting OVCF in Training and Validation Cohorts |
 |
Figure 3 Receiver operating characteristic curves of the nomogram model in the training cohort (a) and validation cohort (b). |
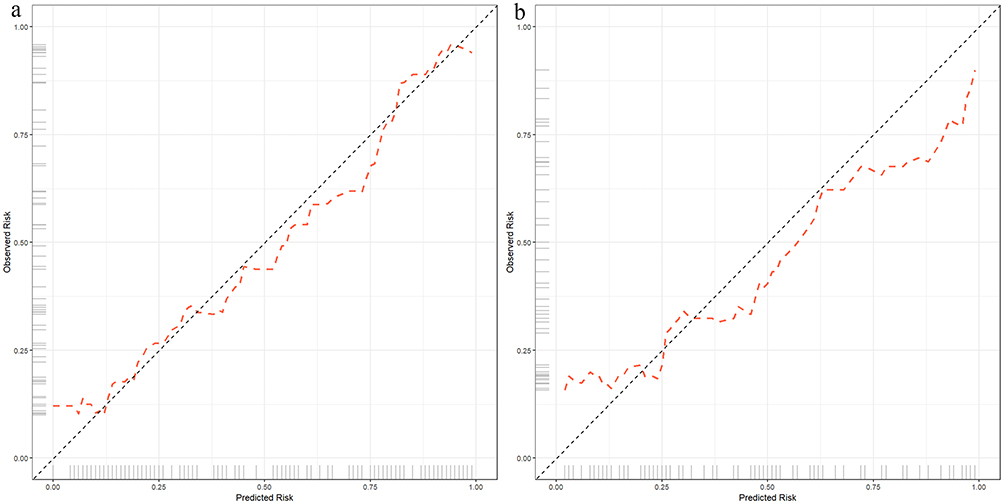 |
Figure 4 Calibration curves of the nomogram model in the training cohort (a) and validation cohort (b). The grey diagonal line represents ideal agreement between predicted and observed risk, and the Orange dashed line represents the model calibration curve. |
Discussion
OVCF is one of the most clinically important fragility fractures in older adults and is associated with substantial morbidity and healthcare burden. Although BMD-based assessment remains central to osteoporosis care, bone strength is influenced by more than bone mineral density alone.20,21 Our study focused on whether vertebral structural parameters derived from opportunistic CT could help identify OVCF risk in routine clinical imaging. A key point of the present work is that deep learning was used for automated vertebral segmentation and quantitative parameter extraction, whereas the final risk-estimation model was a logistic-regression-based nomogram. In this single-center cohort, L1 cortical average area and L1 cortical average thickness were independent predictors, and the resulting nomogram showed good discrimination in both the training and validation cohorts.
In the overall cohort, male sex and higher hCRP were associated with the fractured group in unadjusted comparisons, but they were not retained as independent predictors after multivariable modeling. We therefore interpret these findings cautiously. Sex-related differences in bone health are biologically plausible and may reflect differences in cortical remodeling, hormonal milieu, and age-related changes in bone quality rather than any single behavioral explanation.22–24 In addition, hCRP is a marker of systemic inflammation, and prior studies suggest that inflammatory pathways may contribute to bone loss and vertebral fragility.25,26 The higher hCRP level observed in the fractured group may therefore reflect an adverse inflammatory milieu, although causal inference is not possible in this retrospective observational study.
The age-stratified analyses also merit comment. In participants aged 45–60 years, between-group differences involved not only cortical parameters but also several laboratory or metabolic variables, whereas in the older strata the between-group differences were concentrated mainly in cortical structural parameters. This pattern may suggest that, in relatively younger patients, fracture susceptibility reflects a broader interaction between bone structure and metabolic risk, whereas in older patients progressive cortical structural degradation may play a more dominant role. Because the sample size within each age stratum was limited, these subgroup observations should be interpreted as exploratory rather than definitive.
The quantitative workflow in this study used a previously reported 3D Dense-U-Net-based segmentation framework to automatically measure vertebral cortical and trabecular parameters from routine CT images.19 The advantage of this workflow is that it performs three-dimensional segmentation at original image resolution and reduces the manual burden of quantitative extraction. Cortical bone contributes substantially to vertebral strength, and our results support its importance: L1 cortical average area and L1 cortical average thickness remained independent predictors in the multivariable model.10,11 The nomogram therefore provides a simple and interpretable way to estimate individualized OVCF risk from opportunistic CT, but it should be regarded as an internally validated tool rather than a definitive clinical decision system.
This study has several limitations. First, it was a retrospective single-center study with a modest sample size, and no a priori sample-size calculation was performed because all eligible patients during the predefined study period were included; this limits subgroup precision and may introduce selection bias. Second, the dataset did not contain DXA or QCT measurements, smoking status, alcohol consumption, physical activity, or detailed osteoporosis medication history, which limited confounder adjustment and prevented direct comparison with established bone mineral density-based approaches. Third, OVCF grouping was determined by consensus of two readers, but a formal blinded rereading protocol was not performed. Fourth, the segmentation workflow used in this study was based on a previously published framework and was not independently revalidated in the present cohort; therefore, the technical performance should not be overstated. Accordingly, the present model should be regarded as a complementary opportunistic screening tool rather than a replacement for DXA- or QCT-based evaluation. Finally, external validation in independent populations and scanners is still required before broader clinical implementation.
Conclusions
L1 cortical average area and L1 cortical average thickness derived from opportunistic computed tomography were independently associated with osteoporotic vertebral compression fractures and supported a nomogram with good discrimination in this single-center cohort. These findings suggest that deep learning-assisted quantitative assessment of vertebral structure may help opportunistic fracture-risk identification without additional dedicated examinations, but external validation is required before wider clinical use.
Data Sharing Statement
The datasets used and/or analyzed during the current study are available from the corresponding authors upon reasonable request.
Ethics Approval
The study was approved by the UiTM Research Ethics Committee (REC/11/2024 (PG/MR/575)) and the Ethics Committee of the Second Affiliated Hospital of Shandong First Medical University (2023-060). The requirement for informed consent was waived because this was a retrospective study using existing de-identified records with no direct patient contact or intervention. Patient confidentiality was protected throughout data handling and analysis. The study was conducted in accordance with the Declaration of Helsinki.
Funding
This study was funded by Shandong Provincial Medical and Health Science and Technology Project (No.202409010744); Tai’an Science and Technology Innovation Development Project (No.2023NS373); National Natural Science Foundation of China (62576196); Shandong First Medical University (Shandong Academy of Medical Sciences) Youth Science Fund Cultivation Funding Program (No.202201-104).
Disclosure
The authors declare no conflicts of interest in this work.
References
1. Li Y, Yan L, Cai S, Wang P, Zhuang H, Yu H. The prevalence and under-diagnosis of vertebral fractures on chest radiograph. BMC Musculoskelet Disord. 2018;19(1):235. doi:10.1186/s12891-018-2171-y
2. Black DM, Rosen CJ, Solomon CG. Postmenopausal osteoporosis. New England J Med. 2016;374(3):254–11. doi:10.1056/NEJMcp1513724
3. Coughlan T, Dockery F. Osteoporosis and fracture risk in older people. Clin Med Lond. 2014;14(2):187–191. doi:10.7861/clinmedicine.14-2-187
4. Cho MJ, Moon S-H, Lee JH, Lee J-H. Association between osteoporotic vertebral compression fractures and age, bone mineral density, and european quality of life-5 dimensions in Korean postmenopausal women: a nationwide cross-sectional observational study. Clin Orthopedic Surg. 2021;13(2):207–215. doi:10.4055/cios20209
5. Morin SN, Feldman S, Funnell L, et al. Clinical practice guideline for management of osteoporosis and fracture prevention in Canada: 2023 update. CMAJ. 2023;195(39):E1333–E1348. doi:10.1503/cmaj.221647
6. Chen Y-C, Li Y-T, Kuo P-C, et al. Automatic segmentation and radiomic texture analysis for osteoporosis screening using chest low-dose computed tomography. Eur Radiol. 2023;33(7):5097–5106. doi:10.1007/s00330-023-09421-6
7. Pickhardt PJ, Pooler BD, Lauder T, Del Rio AM, Bruce RJ, Binkley N. Opportunistic screening for osteoporosis using abdominal computed tomography scans obtained for other indications. Ann Intern Med. 2013;158(8):588–595. doi:10.7326/0003-4819-158-8-201304160-00003
8. Mather J, MacDermid JC, Faber KJ, Athwal GS. Proximal humerus cortical bone thickness correlates with bone mineral density and can clinically rule out osteoporosis. J Shoulder Elbow Surg. 2013;22(6):732–738. doi:10.1016/j.jse.2012.08.018
9. Ye C, Guo Y, Zheng Y, et al. Distal radial cortical bone thickness correlates with bone mineral density and can predict osteoporosis: a cohort study. Injury. 2020;51(11):2617–2621. doi:10.1016/j.injury.2020.08.018
10. Rockoff SD, Sweet E, Bleustein J. The relative contribution of trabecular and cortical bone to the strength of human lumbar vertebrae. Calcif Tissue Res. 1969;3(1):163–175. doi:10.1007/BF02058659
11. Shah FA, Stoica A, Cardemil C, Palmquist A. Multiscale characterization of cortical bone composition, microstructure, and nanomechanical properties in experimentally induced osteoporosis. J Biomed Mater Res A. 2018;106(4):997–1007. doi:10.1002/jbm.a.36294
12. Atkinson EJ, Therneau TM, Melton LJ, et al. Assessing fracture risk using gradient boosting machine (GBM) models. J Bone Miner Res. 2012;27(6):1397–1404. doi:10.1002/jbmr.1577
13. Wu Q, Nasoz F, Jung J, Bhattarai B, Han MV. Machine learning approaches for fracture risk assessment: a comparative analysis of genomic and phenotypic data in 5130 older men. Calcif Tissue Int. 2020;107(4):353–361. doi:10.1007/s00223-020-00734-y
14. Chen Y, Yang T, Gao X, Xu A. Hybrid deep learning model for risk prediction of fracture in patients with diabetes and osteoporosis. Front Med. 2022;16(3):496–506. doi:10.1007/s11684-021-0828-7
15. Goecks J, Jalili V, Heiser LM, Gray JW. How machine learning will transform biomedicine. Cell. 2020;181(1):92–101. doi:10.1016/j.cell.2020.03.022
16. Bui HM, Ha MH, Pham HG, et al. Predicting the risk of osteoporosis in older Vietnamese women using machine learning approaches. Sci Rep. 2022;12(1):20160. doi:10.1038/s41598-022-24181-x
17. Yıldız NT, Kocaman H, Yıldırım H, Canlı M. An investigation of machine learning algorithms for prediction of temporomandibular disorders by using clinical parameters. Medicine. 2024;103(41):e39912. doi:10.1097/MD.0000000000039912
18. Yetiş M, Kocaman H, Canlı M, Yıldırım H, Yetiş A, Ceylan İ. Carpal tunnel syndrome prediction with machine learning algorithms using anthropometric and strength-based measurement. PLoS One. 2024;19(4):e0300044. doi:10.1371/journal.pone.0300044
19. Li Y, Yao Q, Yu H, et al. Automated segmentation of vertebral cortex with 3D U-Net-based deep convolutional neural network. Front Bioeng Biotechnol. 2022;10:996723. doi:10.3389/fbioe.2022.996723
20. Malgo F, Hamdy NAT, Papapoulos SE, Appelman-Dijkstra NM. Bone material strength as measured by microindentation in vivo is decreased in patients with fragility fractures independently of bone mineral density. J Clin Endocrinol Metab. 2015;100(5):2039–2045. doi:10.1210/jc.2014-4346
21. Ferizi U, Honig S, Chang G. Artificial intelligence, osteoporosis and fragility fractures. Curr Opin Rheumatol. 2019;31(4):368–375. doi:10.1097/BOR.0000000000000607
22. Yamaguchi T, Sugimoto T, Yano S, et al. Plasma lipids and osteoporosis in postmenopausal women. Endocr J. 2002;49(2):211–217. doi:10.1507/endocrj.49.211
23. Hsu Y-H, Venners SA, Terwedow HA, et al. Relation of body composition, fat mass, and serum lipids to osteoporotic fractures and bone mineral density in Chinese men and women. Am J Clin Nutr. 2006;83(1):146–154. doi:10.1093/ajcn/83.1.146
24. Chen S, Patel J, Katzmeyer T, Pei M. Sex-dependent variation in bone adaptation: from degeneration to regeneration. J Orthop Translat. 2025;52:325–343. doi:10.1016/j.jot.2025.04.011
25. Mun H, Liu B, Pham THA, Wu Q. C-reactive protein and fracture risk: an updated systematic review and meta-analysis of cohort studies through the use of both frequentist and Bayesian approaches. Osteoporos Int. 2021;32(3):425–435. doi:10.1007/s00198-020-05623-6
26. Eriksson AL, Movérare-Skrtic S, Ljunggren Ö, Karlsson M, Mellström D, Ohlsson C. High-sensitivity CRP is an independent risk factor for all fractures and vertebral fractures in elderly men: the MrOS Sweden study. J Bone Miner Res. 2014;29(2):418–423. doi:10.1002/jbmr.2037
 © 2026 The Author(s). This work is published and licensed by Dove Medical Press Limited. The
full terms of this license are available at https://www.dovepress.com/terms
and incorporate the Creative Commons Attribution
- Non Commercial (unported, 4.0) License.
By accessing the work you hereby accept the Terms. Non-commercial uses of the work are permitted
without any further permission from Dove Medical Press Limited, provided the work is properly
attributed. For permission for commercial use of this work, please see paragraphs 4.2 and 5 of our Terms.
© 2026 The Author(s). This work is published and licensed by Dove Medical Press Limited. The
full terms of this license are available at https://www.dovepress.com/terms
and incorporate the Creative Commons Attribution
- Non Commercial (unported, 4.0) License.
By accessing the work you hereby accept the Terms. Non-commercial uses of the work are permitted
without any further permission from Dove Medical Press Limited, provided the work is properly
attributed. For permission for commercial use of this work, please see paragraphs 4.2 and 5 of our Terms.
Recommended articles

Development of Machine Learning Models for Predicting Osteoporosis in Patients with Type 2 Diabetes Mellitus—A Preliminary Study
Wu X, Zhai F, Chang A, Wei J, Guo Y, Zhang J
Diabetes, Metabolic Syndrome and Obesity 2023, 16:1987-2003
Published Date: 30 June 2023
Nomogram Based on Super-Resolution Ultrasound Images Outperforms in Predicting Benign and Malignant Breast Lesions
Yang L, Ma Z
Breast Cancer: Targets and Therapy 2023, 15:867-878
Published Date: 2 December 2023
A Systematic Review of Real-Time Deep Learning Methods for Image-Based Cancer Diagnostics
Sriraman H, Badarudeen S, Vats S, Balasubramanian P
Journal of Multidisciplinary Healthcare 2024, 17:4411-4425
Published Date: 9 September 2024
A Review of Datasets, Optimization Strategies, and Learning Algorithms for Analyzing Alzheimer’s Dementia Detection
Thulasimani V, Shanmugavadivel K, Cho J, Veerappampalayam Easwaramoorthy S
Neuropsychiatric Disease and Treatment 2024, 20:2203-2225
Published Date: 20 November 2024
An Artificial Intelligence Pipeline for Hepatocellular Carcinoma: From Data to Treatment Recommendations
Zhang X, Yang L, Liu C, Yuan X, Zhang Y
International Journal of General Medicine 2025, 18:3581-3595
Published Date: 2 July 2025